sdg indicator 2.4.1 measuring and monitoring sustainable
TRANSCRIPT

SDG Indicator 2.4.1 – Measuring and Monitoring Sustainable Agriculture
02 December, 2019 –Muscat (Oman)
Arbab Asfandiyar KhanESS Division (FAO)

• Introduction
• Process for development of methodology
• Methodology: scope, coverage, themes
• Reporting the indicator
• Data collection instruments
• FAO data collection and reporting strategy
2
CONTENT

Target 2.4: By 2030, ensure sustainable food production
systems and implement resilient agricultural practices that
increase productivity and production, that help maintain
ecosystems, that strengthen capacity for adaptation to climate
change, extreme weather, drought, flooding and other
disasters and that progressively improve land and soil quality
Indicator 2.4.1 (Tier II): Proportion of agricultural area under productive
and sustainable agriculture
GOAL 2: END HUNGER, ACHIEVE FOOD SECURITY AND IMPROVED NUTRITION AND PROMOTE SUSTAINABLE AGRICULTURE
3

• Introduction
• Process for development of methodology
• Methodology: scope, coverage, themes
• Reporting the indicator
• Data collection instruments
• FAO data collection and reporting strategy
4
CONTENT

MILESTONES
5
Year Month SDG process for Indicator 2.4.1
2015 October 2nd meeting of IAEG-SDG: definition of sustainable agriculture and ways to measure it
2016
March 47th UN-SC endorsed SDG 2.4.1 as: ‘Proportion of agricultural area under productive and sustainable agriculture’ (Tier III)
March-Dec Literature review: building on exiting frameworks
December Technical expert meeting (FAO) – First draft methodology
2017
February First proposal submitted to GS-SAC – refinement the methodology
April Multi-stakeholder Expert Group Meeting at FAO: Drafting detailed methodology
September First Global consultation (online) with NSOs
Oct-Dec Desk tests (Kyrgyz Republic, Bangladesh, Rwanda, Ecuador, Belgium)
November 6th meeting of IAEG-SDG. Requested finalizing country pilot

MILESTONES
6
Year Month SDG process for Indicator 2.4.1
2018
Jan- Nov Preparation of revised methodology
April Technical workshop on learning from country desk tests
May Second online consultation - Webinar with IAEG-SDG members.
May-October Country cognitive tests in Mexico, Kenya and Bangladesh
October Presented to FAO Committee on Agriculture
November 8th meeting of IAEG-SDG – Upgraded as Tier II
2019
Jan-June Data collection strategy and capacity development plan submitted to UNSD
Jan-Sept Extended pilot tests completed in Bangladesh Toolkit for 2.4.1 (survey questionnaire, enumerator manual, data entry manual and scripts, calculation procedure, sampling design, e-learning etc.)
Jan-Oct Refinements in bio-diversity sub-indicator carried out with informal group of countries –Revised proposal submitted to IAEG-SDG in Oct for endorsement, where it was accepted
December FAO Data collection questionnaire will be sent to countries
2020
Jan- Feb Countries send back the filled in questionnaire
Mar-July Data is validated and then reported at the global level
2020-2030 Repeat annual data collection, analysis and dissemination cycle

• Introduction
• Process for development of methodology
• Methodology: scope, coverage, themes
• Reporting the indicator
• Data collection instruments
• FAO data collection and reporting strategy
7
CONTENT

INDICATOR’S FORMULA
Formula:
𝑆𝐷𝐺 2.4.1 =𝐴𝑟𝑒𝑎 𝑢𝑛𝑑𝑒𝑟 𝑝𝑟𝑜𝑑𝑢𝑐𝑡𝑖𝑣𝑒 𝑎𝑛𝑑 𝑠𝑢𝑠𝑡𝑎𝑖𝑛𝑎𝑏𝑙𝑒 𝑎𝑔𝑟𝑖𝑐𝑢𝑙𝑡𝑢𝑟𝑒
𝐴𝑔𝑟𝑖𝑐𝑢𝑙𝑡𝑢𝑟𝑎𝑙 𝑙𝑎𝑛𝑑 𝑎𝑟𝑒𝑎
Where:
• The denominator agricultural area arable land + permanent crops + permanent meadows and pastures.
• The numerator captures the three dimensions of sustainable production: economic social and environmental
8
http://www.fao.org/faostat/en/#data/RL

STEPS TO DEVELOP THE INDICATOR
1) Choosing the scale: Agriculture holding level
2) Determining the scope: Crops and livestock
3) Dimensions to be covered: Economic, social and environmental
4) Selecting the themes to be covered: Specific areas/aspects within a dimension (e.g. land productivity, biodiversity, decent employment). Total 11 themes
5) Choosing a sub-indicator to measure performance of the farm in a given theme. 11 sub-indicator (3 Economic, 3 social and 5 environment)
6) Developing the criteria to assess sustainability performance of farms on each sub-indicator to classify the them green, yellow and red
7) Developing modality of reporting the indicator: Dashboard and aggregate indicator
8) Selecting the data collection instrument(s): Farm survey
9) Deciding the periodicity of monitoring the indicator: 3 Years
9

METHODOLOGICAL PRINCIPALS
Key principles applied in developing the indicator:
• Policy relevance and “action-ability”
• Universality
• Comparability
• Measurability and cost effectiveness
• Minimum cross correlation
Impacts upon:
• Choice of sub-indicators for different dimensions
• Choice of sustainability criteria for each sub-indicator
• Level of sophistication in data collection
10

SCOPE
Within scope:
• Intensive and extensive crop and livestock production systems
• Subsistence agriculture
• Food and non-food crops and livestock products (e.g., tobacco, cotton, sheep wool). Crops grown for fodder or for energy purposes
• Aquaculture, to the extent if it takes place within the agricultural area as a secondary activity e.g. rice-fish and similar systems
• Agro-forestry i.e. trees on the agricultural land area of the farm
• Common land when exclusively used and managed by the farm holding
11
Out of scope:
• Common land not exclusively used by agriculture holding
• Nomadic pastoralism
• Production from gardens, backyards and hobby farms
• Holding focused exclusively on aquaculture and/or agro-forestry
• Food harvested from the wild
• Forest and other wooded lands

INDICATOR'S FRAMEWORK
Dimension Theme Sub-indicator Farm type Reference period
Eco
no
mic 1. Land productivity Farm output value per hectare All types Last calendar yr.
2. Profitability Net farm income All types Last 3 calendar yrs.
3. Resilience Risk mitigation mechanisms All types Last calendar yr.
12
En
vir
onm
enta
l
4. Soil health Prevalence of soil degradation All types Last 3 calendar yrs.
5. Water use Variation in water availability All types Last 3 calendar yrs.
6. Fertilizer risk Management of fertilizers All types Last calendar yr.
7. Pesticide risk Management of pesticides All types Last calendar yr.
8. BiodiversityUse of agro-biodiversity
supportive practices All types Last calendar yr.
Soci
al
9. Decent
employmentWage rate in agriculture
Farms hiring
unskilled labourLast calendar yr.
10. Food securityFood Insecurity Experience Scale
(FIES)Household farms Last 12 months
11. Land tenure Secure tenure rights to land All types Last calendar yr.
En
vir
onm
en
tal
Soci
al
Dimension
Eco
nom
ic

ASSESSING SUSTAINABILITY LEVELS
Thresholds: A cutoff point, reference, benchmark, target or baseline value or range of values for each sub-indicators.
• Criteria for each of the 11 sub-indicators were established by thematic experts, and have been fine tuned in light of results of the tests conducted in selected countries
• Two thresholds were established for each sub-indicator
Traffic light approach:
1. Green: ‘desirable’
2. Yellow: ‘acceptable’
3. Red: ‘unsustainable’
13

SUMMARY OF STEPS FOR ESTIMATION OF AREAS BY SUSTAINABILITY STATUS
1. Estimate the sub-indicator value at the farm level
2. Classification of the farm and agricultural area it manages as sustainable (green), acceptable (yellow) and unsustainable (red) for each sub-indicator using the respective sustainability criteria.
3. At the national or sub-national level, add up the agricultural areas of the farms by sustainability status.
4. For each sub-indicator, calculate the proportion of agricultural area as a percentage of total agricultural area by sustainability status at the national or sub-national level and present as a dashboard.
14

• Introduction
• Process for development of methodology
• Methodology: scope, coverage, themes
• Reporting the indicator
• Data collection instruments
• FAO data collection and reporting strategy
15
CONTENT

REPORTING: DASHBOARD
16
Example of results for country X in year Y
Note: This dashboard is only a simulation and is not from real data

AGGREGATE INDICATOR (AT NATIONAL OR OTHER LEVELS)
𝑆𝐷𝐺241𝑑 = min𝑛:1−11
(𝑆𝐼𝑑 𝑛)
𝑆𝐷𝐺241𝑎+𝑑 = min𝑛:1−11
(𝑆𝐼𝑑+𝑆𝐼𝑎)𝑛
𝑆𝐷𝐺241𝑢 = max𝑛:1−11
(𝑆𝐼𝑢 𝑛)
SDG241d = proportion of agricultural land area that have achieved the ‘desirable’ level
SDG241a+d = proportion of agricultural land area that have achieved at least the ‘acceptable’ level
SDG241u = proportion of agricultural area that is ‘unsustainable’
17

REPORTING: AGGREGATE INDICATOR
18
Example of results for country X in year Y
Note: This dashboard is only a simulation and is not from real data

DISSAGREGATION
The dashboard offers a response in terms of measuring sustainability at farm level and aggregating and reporting it by:
National/sub-national level
Different holdings types:
• Household/non-household
• Crops/livestock/mixed
• Irrigate/non-irrigated
19

PERIODICITY
20
• Recommended periodicity of reporting is every 3-years
o For many sub-indicators, it is unlikely that its value will change from one year to another
o The 3-year periodicity will enable countries to have three data points on the indicator before 2030, assuming that they begin reporting in the early 2021
• Introduction
• Process for development of methodology
• Methodology: scope, coverage, themes
• Reporting the indicator
• Data collection instruments
• FAO data collection and reporting strategy
21
CONTENT

DATA COLLECTION INSTRUMENTS
18
1. Farm survey questionnaire
2. AGRISurvey programme and 50x2030 initiative
3. Alternative or existing data sources

OPTION 1: STANDALONE SURVEY QUESTIONNAIRE
18
• Standalone survey questionnaire designed as a module that contain the minimum set of questions needed to assess 2.4.1.
• It can be administered in various ways; i) independently; ii) attached as a separate module; iii) integrated at appropriate places within existing farm surveys.
• FAO has developed Statistical Toolkit to accompany the survey questionnaire which is comprised of guidelines on:
• Sampling design for 2.4.1
• Enumerator’s manual
• Data entry operations
• Data analysis “From raw data to computation of the indicator”
• Code book, tabulation plan, and STATA scripts to support data analysis and reporting

OPTION 1: STANDALONE SURVEY QUESTIONNAIRE
24
SURVEY INFORMATION
Date:
hour minutes
Holding Identification Number:
Section I: INTRODUCTION TO THE SURVEY MODULE AND IDENTIFICATION OF THE HOLDING AND HOLDER
I.1 Record the following information about the respondent
Survey Module
SDG Indicator 2.4.1
Proportion of Agricultural Area under Productive and Sustainable Agriculture Revision 6: 07 August 2019
QUESTIONNAIRE
Surveyor first name:
Start time of the
survey:
I.1.2 Surname
I.1.1 First name
TEXT TO READ:
Hello, my name is --------------. I work for the ---------------. We collect data that the Government and other stakeholders use for planning purposes. I am vising you to collect data on
your farm. This is part of a worldwide exercise to measure progress in agriculture organised together with the Food and Agriculture Organization of the United Nations. The
information you provide will be treated confidentially. It will only be used for statistical purposes and will be put together with responses from other farmers for use in the
formulation of programmes and policies to promote more productive and sustainable agriculture. This interview should take approximately one hour. We appreciate your participation
in answering these questions.
If you have any questions regarding this survey, you are welcome to telephone the number indicated on the visiting card of our organization that I leave for you here.
I express my gratitude for your participation in this survey in advance.
Surname: Surveyor number:

OPTION 1: SUPPORTING DOCUMENTS
25

OPTION 1: SUPPORTING DOCUMENTS
26

OPTION 2: AGRISURVEY PROGRAMME
Leverage and capitalize on the AGRISurvey programme which is farm based, high-quality and cost-efficient modular survey over a ten years cycle to generate the data on farms for policy making and cover several SDGs and the MSCD:
AGRIS survey system:
27
Core
Eco
Labour
MEA
PME
Agricultural Census
Sample
Inter-census survey
New Sample
Y
1
Y
2
Y
3
Y
4
Y
5
Y
6
Y
7Y
8
Y
9
Y1
0AGRIS Modules

OPTION 2: 50X2030 INITIATIVE
AGRISurvey programme will soon be scaled up into the 50X2030 initiative that aims to support 50 L/LMICs with a survey program by 2030 under the GRAInSpartnership.
50X2030 initiative:
28
IFAD USAIDBMGFWorld
BankFAO USDA
Partner
Nations
The Partners
LSMS-ISA AGRISurvey

OPTION 2: EFFORTS TO ENHANCE NATIONAL DATA PRODUCTION
2.4.1 integration with the AGRISurvey programme:
Core module : Allowing for 2.4.1 data collection in one single year.
Economy & PME modules: Allowing for 2.4.1 data collection in two consecutive years. Questions for sub-indicators in the social and economic dimensions are integrated in the core module, while questions on environmental sub-indicators are integrated with the Production Methods and Environment Module (PME).
2.4.1 integration with the 50X2030 initiative:
PME module with 2.4.1. questions: Allowing for 2.4.1 data collection in one single year.
29

OPTION 2: SUPPORTING DOCUMENTS
30

OPTION 3: USE OF ALTERNATIVE DATA SOURCESNo. Sub-indicators
Admin
data
Ag/livesto
ck censusAg surveys
Env.
monitoring
systems
GIS/remot
e sensing
Household
surveysOther
1 Farm output value per hectare X X X X X
2 Net farm income X X X
3 Risk mitigation mechanisms X X X
4Prevalence of soil
degradationX X
5 Variation in water availability X X X X X
6 Management of fertilizers X X X X
7 Management of pesticides X X X X
8Use of biodiversity-supportive
practices X X
9 Wage rate in agriculture X X X X
10Food insecurity experience
scale (FIES)X X
11 Secure tenure rights to land X X X
19Note: Environmental monitoring systems include soil sampling, river flows records, and groundwater abstraction records. GIS/RS includes models.
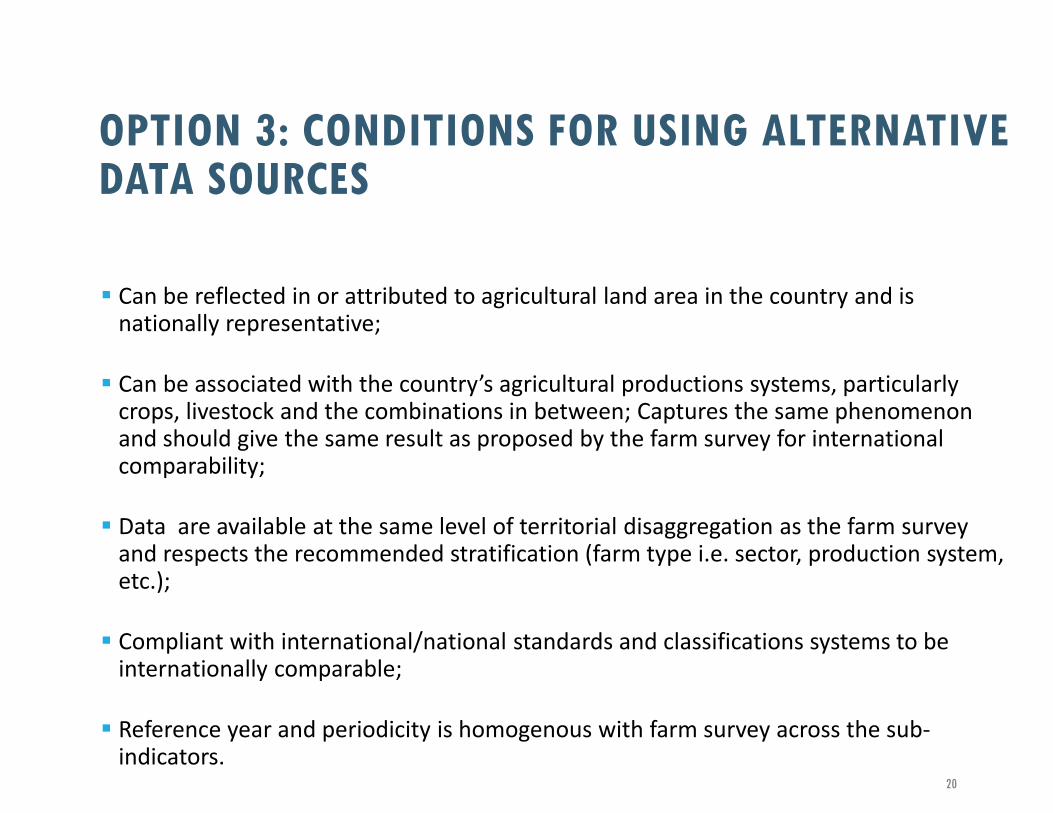
OPTION 3: CONDITIONS FOR USING ALTERNATIVE DATA SOURCES
Can be reflected in or attributed to agricultural land area in the country and is nationally representative;
Can be associated with the country’s agricultural productions systems, particularly crops, livestock and the combinations in between; Captures the same phenomenon and should give the same result as proposed by the farm survey for international comparability;
Data are available at the same level of territorial disaggregation as the farm survey and respects the recommended stratification (farm type i.e. sector, production system, etc.);
Compliant with international/national standards and classifications systems to be internationally comparable;
Reference year and periodicity is homogenous with farm survey across the sub-indicators.
20

COMPLEMENTING FARM SURVEY DATA
Replace farm survey questions, when alternative sources of information are available and respond to the criteria.
Complement farm survey questions, by providing additional contextual information helpful to interpret the results.
o This can be done ex-ante or during the data collection by providing contextual information to the enumerators before going to the field.
Crosschecking the farm survey results to identify any inconsistencies and to ensure its robustness
o Ex-post information to triangulate and validate survey data after the data collection and analysis has been completed.
20

• Introduction
• Process for development of methodology
• Methodology: scope, coverage, themes
• Reporting the indicator
• Data collection instruments
• FAO data collection and reporting strategy
34
CONTENT
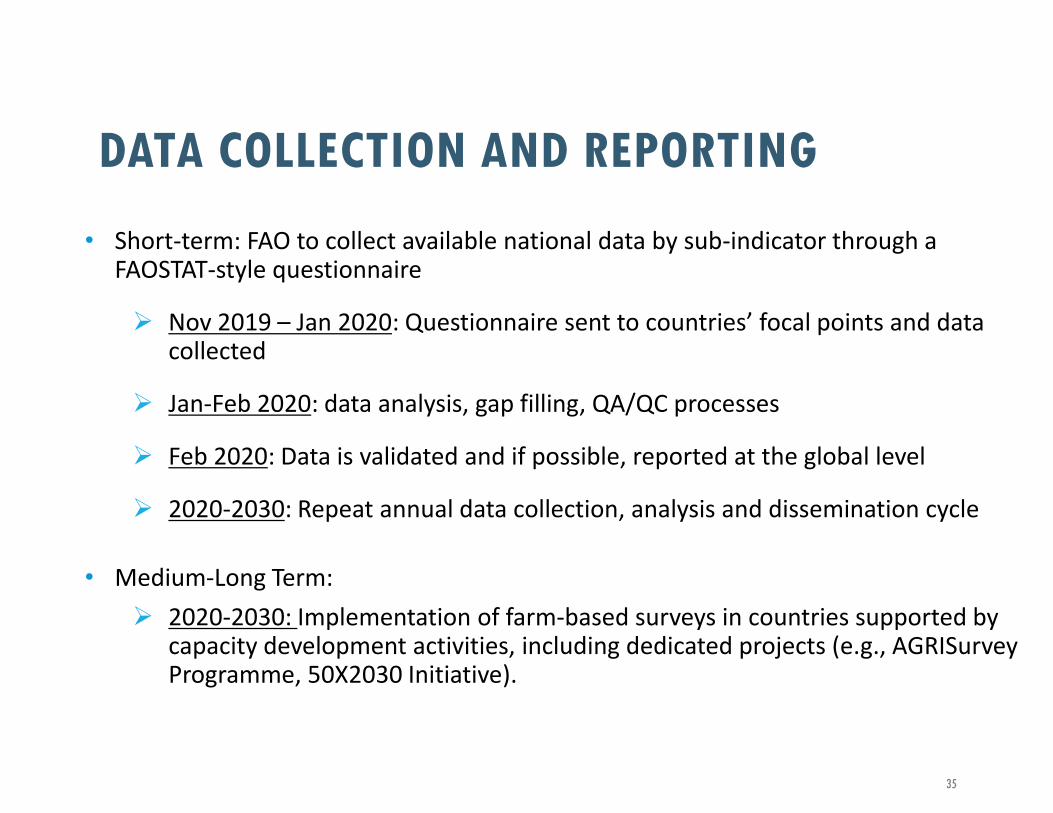
DATA COLLECTION AND REPORTING
• Short-term: FAO to collect available national data by sub-indicator through a FAOSTAT-style questionnaire
Nov 2019 – Jan 2020: Questionnaire sent to countries’ focal points and data collected
Jan-Feb 2020: data analysis, gap filling, QA/QC processes
Feb 2020: Data is validated and if possible, reported at the global level
2020-2030: Repeat annual data collection, analysis and dissemination cycle
• Medium-Long Term:
2020-2030: Implementation of farm-based surveys in countries supported by capacity development activities, including dedicated projects (e.g., AGRISurvey Programme, 50X2030 Initiative).
35
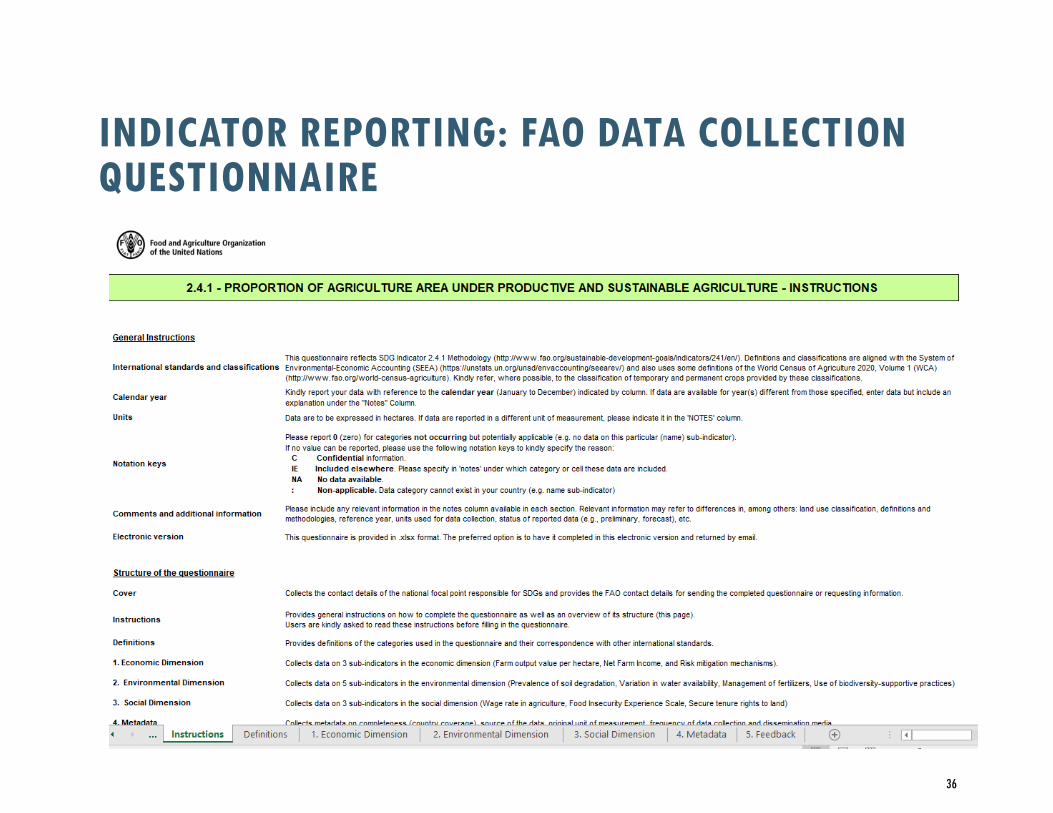
INDICATOR REPORTING: FAO DATA COLLECTION QUESTIONNAIRE
36

THANK YOU
Contact us:
[email protected] – Arbab Asfandiyar Khan
[email protected] – Francesco Nicola Tubiello
[email protected] – Amy Heyman
37

IMPORTANCE OF AGRICULTURE!
Over the coming 35 years, agriculture will face an unprecedented confluence of pressures:
• Including a 30 percent increase in the global population - projected to grow from 7.2 billion to reach 9.3 billion in 2050 (United Nations, 2013a).
• Support changing dietary patterns, estimates are that food production will need to increase from the current 8.4 billion tonnes to almost 13.5 billion tonnes a year. (Agriculture will need to produce 60 percent more food globally, and 100 percent more in developing countries, if it is to meet demand at current levels of consumption).
• Achieving that level of production from an already seriously depleted natural resource base will be impossible without profound changes in our food and agriculture systems.
As a result:
• A holistic approach is required to expand and accelerate the transition to sustainable food and agriculture which ensures world food security, provides economic and social opportunities, and protects the ecosystem services on which agriculture depends.
38

WHAT IS SUSTAINABLE AGRICULTURE?
• Unlike a traditional approach where the economic consideration is the single major factor; Agriculture sustainability also involves social and environmental factors.
• In fact it is defined by 3 integral aspects which are: agriculture needs to be economically viable, environmentally friendly/non degrading and socially responsible/acceptable. The integrated economic, environmental, and social principles are incorporated into a “triple bottom line” (TBL); profit, people and the planet.
• Sustainability in the context of 2.4.1. strive to capture 3 dimensions by focusing on practices of a farmer on the farm, rather than on a specific agricultural product or activity.
39

TYPE OF SUB-INDICATORS SELECTED
• Impact/outcome indicators that record what the state or change in state of factors and associated flows of benefits or costs.
• Practice indicators that record the type of agricultural practices and processes that a farm is undertaking.
• Awareness indicators record the level of awareness and knowledge in relation with a give sustainability issue.
• Behavior indicators capture the attitude of a given stakeholder in relation with a given sustainability issue.
• Perception indicators that record views of various stakeholders about different aspects of sustainability
40