sdarticle (1).pdf
TRANSCRIPT

Journal of Constructional Steel Research 65 (2009) 1206–1215
Contents lists available at ScienceDirect
Journal of Constructional Steel Research
journal homepage: www.elsevier.com/locate/jcsr
Seismic analysis of the world’s tallest buildingHong Fan a,b, Q.S. Li a,∗, Alex Y. Tuan c, Lihua Xu da Department of Building and Construction, City University of Hong Kong, Hong Kongb China Nuclear Power Design Company, Shenzhen 518026, Chinac Department of Civil Engineering, Tam Kang University, Taipei, Taiwand School of Civil Engineering, Wuhan University, Hubei Wuhan 430072, China
a r t i c l e i n f o
Article history:Received 13 March 2008Accepted 8 October 2008
Keywords:Super-tall buildingMega-frame structureFinite element modelingSeismic analysisDynamics responseShaking table test
a b s t r a c t
Taipei 101 (officially known as the Taipei Financial Center) with 101 stories and 508 m height, located inTaipei where earthquakes and strong typhoons are common occurrences, is currently the tallest buildingin the world. The great height of the building, the special geographic and environmental conditions, notsurprisingly, presented one of the greatest challenges for structural engineers. In particular, its dynamicperformance under earthquake or wind actions requires intensive research. The structure of the buildingis a mega-frame system composed of concrete filled steel tube (CFT) columns, steel brace core and belttrusses which are combined to resist vertical and lateral loads. In this study, a shaking table test wasconducted to determine the constitutive relationships and finite element types for the CFT columnsand steel members for establishing the finite element (FE) model of the tall building. Then, the seismicresponses of the super-tall buildingwere numerically investigated. An earthquake spectrumgenerated forTaipei Basinwas adopted to calculate the lateral displacements anddistributions of interior column forces.Furthermore, time-history analyses of elastic and inelastic seismic responsewere carried out using scaledaccelerograms representing earthquake events with return periods of 50-year, 100-year, and 950-year,respectively. The computational results indicate that the super-tall building with the mega-frame systempossesses substantial reserve strength, and the high-rise structure would satisfy the design requirementsunder severe seismic events. The output of this study is expected to be of considerable interest andpractical use to professionals and researchers involved in the design of super-tall buildings.
© 2008 Elsevier Ltd. All rights reserved.
1. Introduction
Owing to the growing use of high-strength materials and ad-vanced construction techniques, building structures have becomemore andmore flexible and taller. The increasing height ofmoderntall buildings posed a series of challenges for structural engineers.In the design of such a tall building, the structural system mustmeet threemajor requirements: strength, rigidity, and stability [1].As is well known, the strength requirement is the dominant factorin the design of low-rise structures. However, as building heightincreases, the rigidity and stability requirements becomemore im-portant, and they are often the dominant factors in the structuraldesign. Especially under lateral loads, interior forces are quite vari-able and increase rapidly with increases in height, and lateral de-flectionmay vary as the fourth power of the height of a building [2],and structural dynamic behavior is thus one of the most importantdesign considerations in the design of a modern tall building.
∗ Corresponding author. Tel.: +852 27844677; fax: +852 27887612.E-mail address: [email protected] (Q.S. Li).
0143-974X/$ – see front matter© 2008 Elsevier Ltd. All rights reserved.doi:10.1016/j.jcsr.2008.10.005
Taipei 101, rising 508 m above the city of Taipei, earns the titleof the tallest building in the world. Its dynamic responses dueto wind, earthquake and other extraordinary loads are of greatconcern. As Taiwan is located in one of the most active seismicregions in the world, this super-tall building may be susceptibleto damage caused by strong earthquakes. These features make adetailed study on the structural performance of theworld’s highesttall building under earthquake excitations of particular importanceand necessity.Numerous investigations on seismic behavior of tall buildings
have been carried out in the past; in particular shaking table testsplay an important role in earthquake-resistant design of structures,analysis of seismic responses and failure mechanisms [3–5]. Onthe other hand, the finite element method (FEM) is a powerfultool for structural analysis of tall buildings. Fan and Long [6]adopted spline elements in the analysis of tall buildings. In theirmethod, the element displacements are interpolated with splinefunctions and accurate results could be achieved with lower-orderfunctions and a few degrees of freedom. Takebatake et al. [7]presented a simplified analytical method for the preliminarydesign of doubly symmetric single and double frame-tubes inhigh-rise structures by replacing a tube with an equivalent rod,

H. Fan et al. / Journal of Constructional Steel Research 65 (2009) 1206–1215 1207
with consideration of the effect of bending, transverse sheardeformation, shear-lag and torsion. Li et al. [8,9] proposed finitesegment approaches for estimating the dynamic characteristicsof tall buildings. Recently, Li and Wu [10] established seven 3-D FE models for a 78-story super-tall building, and numericalresults of the structural dynamic characteristics were comparedwith their field measurements to identify the FEM modelingerrors for the purpose of updating the FEM models. Venturaand Schuster [11] presented a numerical study on estimation ofdynamic characteristic of a 30-storey RC building. A reduced-order continuum model was proposed by Chajes et al. [12] toconduct dynamic analysis of a 47-storey steel-framed buildingand correlate the numerical results with those from measuredresponses during an earthquake. Pan et al. [13] and Brownjohnet al. [14] presented numerical studies on dynamic responses ofthe tallest building in Singapore with correlation with their fieldmeasurements. Qi et al. [15] employed the finite element methodto study the seismic performance of a tall building and their resultsillustrated that the building is likely to perform satisfactorily undersevere seismic events. Rahimian and Romero [16] established afinite element model to study the seismic response of the tallestbuilding in Mexico City by time-history analysis and spectralmethod. These investigations indicated that numerical simulationis an effective tool to determine the dynamic characteristics andseismic responses of tall buildings. However, literature reviewreveals that comprehensive research studies on seismic effects ona super-tall building (building height > 500 m) have rarely beenreported in the literature. So, a detailed analysis is presented inthis paper to investigate the dynamic characteristics and seismicresponses of the super-tall building. The objective of this study isto investigate the seismic effects on the world’s tallest buildingin order to provide valuable information for the design andconstruction of other similar structures in the future.
2. The structural system of Taipei 101
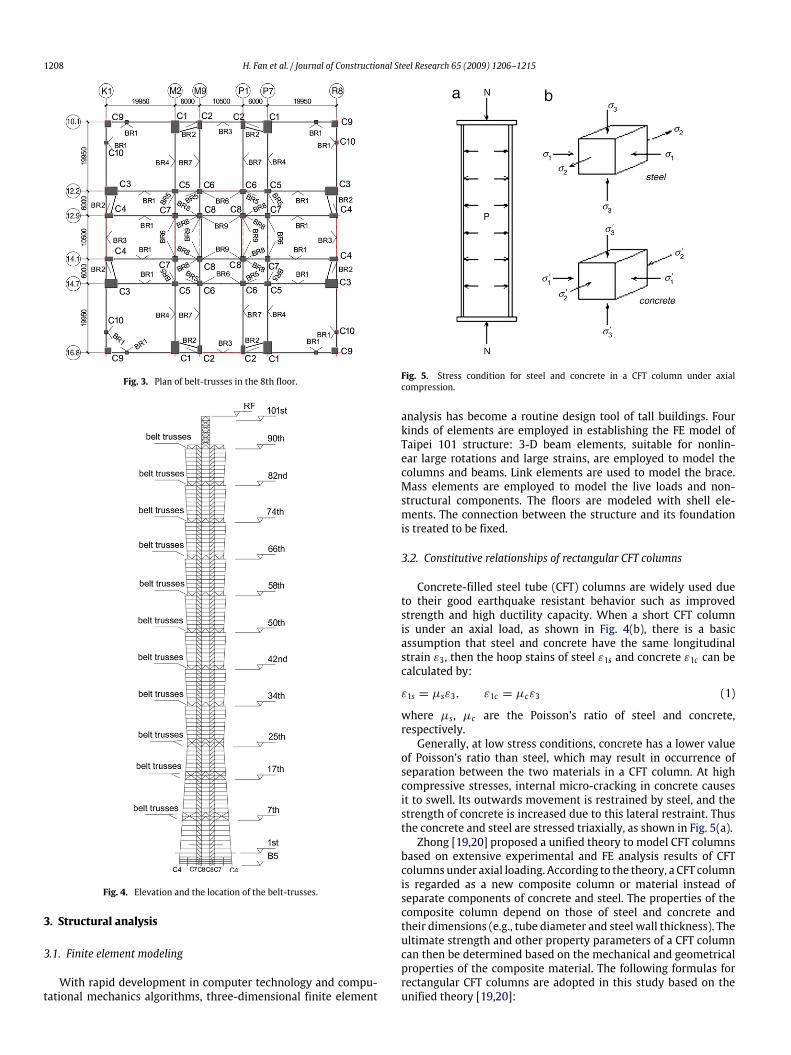
Taipei 101, a 508-m high office tower, is located at the eastdistrict of downtown Taipei City, and the elevation view of thebuilding is shown in Fig. 1. The structure is symmetrical with a62.4 m by 62.4 m square footprint [17]. Two sloping rectangularmega-columns with a maximum cross-sectional dimension of2400 mm × 3000 mm, are positioned one at each side of thebuilding extending to the 90th floor, and finally the cross-sectionaldimension of themega-column is reduced to 1600mm×2000mm.All perimeter columns are sloping from the ground floor to 25thfloor, and the sloping angle is 4.4. The core columns are squareand rectangular concrete-filled steel tubes (CFT). The compressivestrength of the concrete is 70 MPa, which provide extra stiffnessand strength to the steel tubes, from bottom of the basementto the 62nd floor. The section of the core columns reduce from1200 mm × 1200 mm to 900 mm × 900 mm, which are smallerthan the mega-column. The composite metal deck-slabs built ateach floor are 135 mm thick, however, those at mechanical floorsare 200 mm thick. The primary girders are composed of H-steelbeams with moment-resisting connections at the beam-columnjoints. Dog-bone connections are also provided at locations whereductility is requiredwhile beams are pinned to the primary girders,as shown in Fig. 2.Belt-trusses, one or two-stories high, are placed every 8-story
interval at the perimeter frame, and the brace core is connectedto mega-columns via belt-trusses consisting of in-floor braces andvertical trusses. The locations of the belt-trusses in the 8th floorare shown in Fig. 3 [17]. When the space of the column is 10.5 m,the shape of the steel braces are ‘‘V’’ or reverse ‘‘V’’, and whenthe space is 6 m, the shape of steel braces are acclivitous bracesFig. 4 presents an elevation view and the locations of the belt-trusses in axesM9 and P1 [17]. The belt-trusses andmega-columns
Fig. 1. Elevation view of Taipei 101.
Fig. 2. Sketch of the dog-bone connection.
help to stabilize the building core in the same way that the bracecore helps to balance the perimeter frame. Thismega-frame designmaximizes the spaces inside the building and carries perimetergravity loads at selected columns. The bracing, outriggers, andbelts that link the columns would also redistribute loads if somemembers are damaged by unforeseen circumstances. The structureis a dual system: the external structure is composed of the mega-columns and external columns providing the lateral rigidity to theseismic and wind loads, and the internal structure, also designatedas substructures, provides the utilizable space and allows forsignificant amount of energy dissipation. Belt trusses composed ofa transfer floor system are placed at every eighth or tenth floor,so the interior columns only carry the gravity loads from a limitednumber of floors. As a result, their sizes are substantially smallerthan those in a conventional structural system, in which theywould rise from foundation level to the building top.A FE model was established in this study based on the design
drawings of the super-tall building. The dead loads for buildingelements were determined by a commercial FE program ANSYS10.0 [18] and the design live loads were calculated according tothe data found from the design documents [17].
1208 H. Fan et al. / Journal of Constructional Steel Research 65 (2009) 1206–1215
Fig. 3. Plan of belt-trusses in the 8th floor.
Fig. 4. Elevation and the location of the belt-trusses.
3. Structural analysis
3.1. Finite element modeling
With rapid development in computer technology and compu-tational mechanics algorithms, three-dimensional finite element
Fig. 5. Stress condition for steel and concrete in a CFT column under axialcompression.
analysis has become a routine design tool of tall buildings. Fourkinds of elements are employed in establishing the FE model ofTaipei 101 structure: 3-D beam elements, suitable for nonlin-ear large rotations and large strains, are employed to model thecolumns and beams. Link elements are used to model the brace.Mass elements are employed to model the live loads and non-structural components. The floors are modeled with shell ele-ments. The connection between the structure and its foundationis treated to be fixed.
3.2. Constitutive relationships of rectangular CFT columns
Concrete-filled steel tube (CFT) columns are widely used dueto their good earthquake resistant behavior such as improvedstrength and high ductility capacity. When a short CFT columnis under an axial load, as shown in Fig. 4(b), there is a basicassumption that steel and concrete have the same longitudinalstrain ε3, then the hoop stains of steel ε1s and concrete ε1c can becalculated by:
ε1s = µsε3, ε1c = µcε3 (1)
where µs, µc are the Poisson’s ratio of steel and concrete,respectively.Generally, at low stress conditions, concrete has a lower value
of Poisson’s ratio than steel, which may result in occurrence ofseparation between the two materials in a CFT column. At highcompressive stresses, internal micro-cracking in concrete causesit to swell. Its outwards movement is restrained by steel, and thestrength of concrete is increased due to this lateral restraint. Thusthe concrete and steel are stressed triaxially, as shown in Fig. 5(a).Zhong [19,20] proposed a unified theory to model CFT columns
based on extensive experimental and FE analysis results of CFTcolumns under axial loading. According to the theory, a CFT columnis regarded as a new composite column or material instead ofseparate components of concrete and steel. The properties of thecomposite column depend on those of steel and concrete andtheir dimensions (e.g., tube diameter and steel wall thickness). Theultimate strength and other property parameters of a CFT columncan then be determined based on the mechanical and geometricalproperties of the composite material. The following formulas forrectangular CFT columns are adopted in this study based on theunified theory [19,20]:
H. Fan et al. / Journal of Constructional Steel Research 65 (2009) 1206–1215 1209
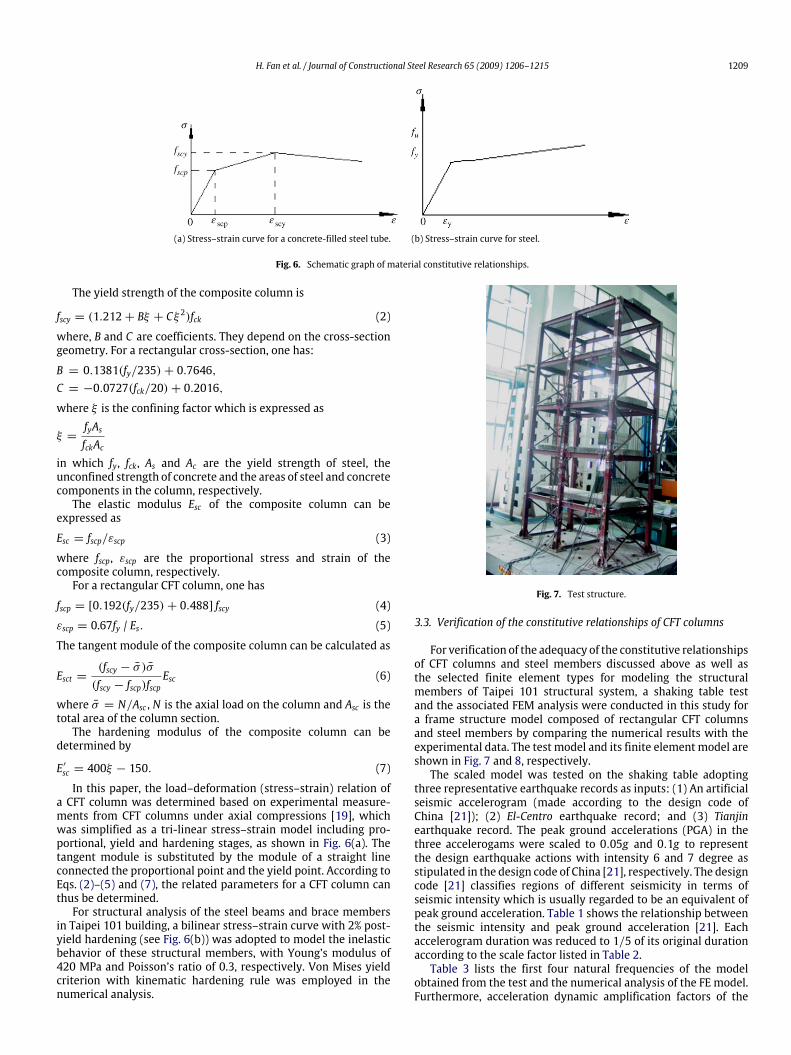
(a) Stress–strain curve for a concrete-filled steel tube. (b) Stress–strain curve for steel.
Fig. 6. Schematic graph of material constitutive relationships.
The yield strength of the composite column is
fscy = (1.212+ Bξ + Cξ 2)fck (2)
where, B and C are coefficients. They depend on the cross-sectiongeometry. For a rectangular cross-section, one has:
B = 0.1381(fy/235)+ 0.7646,C = −0.0727(fck/20)+ 0.2016,
where ξ is the confining factor which is expressed as
ξ =fyAsfckAc
in which fy, fck, As and Ac are the yield strength of steel, theunconfined strength of concrete and the areas of steel and concretecomponents in the column, respectively.The elastic modulus Esc of the composite column can be
expressed as
Esc = fscp/εscp (3)
where fscp, εscp are the proportional stress and strain of thecomposite column, respectively.For a rectangular CFT column, one has
fscp = [0.192(fy/235)+ 0.488] fscy (4)
εscp = 0.67fy / Es. (5)
The tangent module of the composite column can be calculated as
Esct =(fscy − σ̄ )σ̄(fscy − fscp)fscp
Esc (6)
where σ̄ = N/Asc , N is the axial load on the column and Asc is thetotal area of the column section.The hardening modulus of the composite column can be
determined by
E ′sc = 400ξ − 150. (7)
In this paper, the load–deformation (stress–strain) relation ofa CFT column was determined based on experimental measure-ments from CFT columns under axial compressions [19], whichwas simplified as a tri-linear stress–strain model including pro-portional, yield and hardening stages, as shown in Fig. 6(a). Thetangent module is substituted by the module of a straight lineconnected the proportional point and the yield point. According toEqs. (2)–(5) and (7), the related parameters for a CFT column canthus be determined.For structural analysis of the steel beams and brace members
in Taipei 101 building, a bilinear stress–strain curve with 2% post-yield hardening (see Fig. 6(b)) was adopted to model the inelasticbehavior of these structural members, with Young’s modulus of420 MPa and Poisson’s ratio of 0.3, respectively. Von Mises yieldcriterion with kinematic hardening rule was employed in thenumerical analysis.
Fig. 7. Test structure.
3.3. Verification of the constitutive relationships of CFT columns
For verification of the adequacy of the constitutive relationshipsof CFT columns and steel members discussed above as well asthe selected finite element types for modeling the structuralmembers of Taipei 101 structural system, a shaking table testand the associated FEM analysis were conducted in this study fora frame structure model composed of rectangular CFT columnsand steel members by comparing the numerical results with theexperimental data. The test model and its finite element model areshown in Fig. 7 and 8, respectively.The scaled model was tested on the shaking table adopting
three representative earthquake records as inputs: (1) An artificialseismic accelerogram (made according to the design code ofChina [21]); (2) El-Centro earthquake record; and (3) Tianjinearthquake record. The peak ground accelerations (PGA) in thethree accelerogams were scaled to 0.05g and 0.1g to representthe design earthquake actions with intensity 6 and 7 degree asstipulated in the design code of China [21], respectively. The designcode [21] classifies regions of different seismicity in terms ofseismic intensity which is usually regarded to be an equivalent ofpeak ground acceleration. Table 1 shows the relationship betweenthe seismic intensity and peak ground acceleration [21]. Eachaccelerogram duration was reduced to 1/5 of its original durationaccording to the scale factor listed in Table 2.Table 3 lists the first four natural frequencies of the model
obtained from the test and the numerical analysis of the FE model.Furthermore, acceleration dynamic amplification factors of the

1210 H. Fan et al. / Journal of Constructional Steel Research 65 (2009) 1206–1215
Fig. 8. FE model.
Table 1Relation between the seismic intensity and horizontal peak ground accelera-tion [20].
Seismic intensity (degree) Horizontal peak ground acceleration (g)
6 0.057 0.18 0.29 0.4
Table 2The similarity relationship between the model and the prototype structure.
Physical parameters Scale factors Ratio (model/prototype)
Length Sl 1/5Density Sρ 1.0Elastic modulus SE 1.0Strain Sε 1.0
Time St = SlS12ρ S−12
E 1/5
Frequency Sf = S−1l S−12
ρ S12E 5
Displacement Su = Sl 1/5Acceleration Sa = Sl/S2t 5
Table 3Natural frequencies of the scaled mode obtained by the shaking table test and thenumerical analysis.
Mode 1 2 3 4
Test (Hz) 17.48 26.68 40.00 72.50FE analysis (Hz) 16.50 29.43 54.44 58.14Differences (%) −5.61 10.27 36.1 −19.8
structural model under seismic excitation with PGA of 0.1g , whichwere determined by the test and the numerical computation, areshown in Fig. 9.It is shown in Table 3 that the fundamental natural frequencies
of the model obtained from the test and the numerical analysisagree fairly well. It is observed from Fig. 9 that the two sets ofthe results of acceleration dynamic amplification factors underthe three earthquake records were also in good agreement. It isthus expected that the constitutive relationships for rectangularCFT columns and steel members as well as the selected finiteelement types for modeling these structural components areadequate, since the numerical resultsmatch the experimental datareasonably well. Hence, it was decided to adopt the numerical
modeling strategies presented above in the establishment of theFE model of Taipei 101 structural system.
4. Dynamic characteristics of the super-tall building
A three-dimensional FE model of Taipei 101 structural systemwas established for numerical analysis of the super-tall building,as shown in Fig. 10, based on the constitutive relationships forrectangular CFT columns and steelmembers as well as the selectedfinite element types which were verified above. The FE modelof the super-tall building contains 20532 beam elements, 24 048shell elements, and 3496 link elements. In addition to the mainstructural elements, non-structural components were modeledwith mass elements. Fig. 11 shows the first six mode shapes ofthe FE model including two for translational motions in eachhorizontal direction and two for torsional motions about thevertical axis. Modes 1 and 2 are the translational modes in x andy directions, respectively. Mode 3 is the fundamental torsionalmode. The fundamental periods of the building are 6.21 s. in thex direction, 6.19 s in the y direction, and 3.62 s in torsion. Themodal participation coefficient for each mode [22] is defined asηji =
[Ei][M][uj][uj]T [M][uj]
, which shows the modes that contribute most
to the dynamic response, where [M] is the mass matrices, [u] isthe vibration mode vector of the structure, and [E] is the uniformmatrix. The model participation ratio in every direction for eachmode is defined as ϕci =
ηci∑j=1 η
cj(c = x, y, z), while the cumulative
modal participation mass ratios is defined as ψ ci =∑ij=1 m
cj∑n
t=1 mct(c =
x, y, z), where m is the effective mass participating the dynamicresponse of each mode. Table 4 shows the modal participationratios and the cumulative modal participation mass ratios of thefirst 30modes. The vibrationmodal participation ratios for the firsttwo modes in the x and y directions reach 1. Such ratios for othermodes decrease as the mode number increases. The cumulativemodal participation mass ratios for the first 30 modes reach 1 inthe horizontal directions. Therefore, it was decided to use the first30 modes in the response spectrum analysis of the tall building,which will be described below.
5. Response spectrum analysis
For earthquake-resistant designs, a structure should meetperformance requirements at two different levels, dependingupon the magnitude of earthquake actions. The first level ofperformance essentially requires structural response in the elasticrange without significant structural damage under a moderateearthquake action, and the second level of performance requiresthat the structure does not collapse under a severe earthquakeevent with rare occurrence. Taipei 101 is located in the TaipeiBasin, where there are deep and soft soil deposits with along predominant period. According to the Taiwanese BuildingTechnology Standards (BTS) [23], the building site is in a regionof moderate seismicity. A response spectrum, originally developedby the National Taiwan University and other research institutionsfor the design of Taipei 101, has been modified based on theresponse spectra stipulated in the local seismic code (BST), asshown in Fig. 12 [17]. The first 30 translational–torsional couplingmodeswere used to calculate the seismic response of the super-tallbuilding by the Complete Quadratic Combination (CQC)method onthe basis of the response spectrum analysis. The damping ratio ofthe high-rise structure was assumed to be 5% for all the 30 modes,and the seismic responses in the two orthogonal directions werecalculated accordingly.

H. Fan et al. / Journal of Constructional Steel Research 65 (2009) 1206–1215 1211
Table 4Modal participation ratios and participation mass ratios.
Mode Period (s) Model participation ratio Cumulative participation mass ratiox direction y direction x direction y direction
1 6.21 0.000704 1 2.70E-07 0.5449912 6.19 1 0.000692 0.545056 0.5449913 3.62 0.000002 0.000359 0.545056 0.5449914 2.52 0.001392 0.775207 0.545057 0.8724285 2.47 0.778882 0.001382 0.875625 0.8724296 1.65 0.000383 0.420086 0.875625 0.9683167 1.64 0.414047 0.000395 0.96938 0.9683178 1.42 0.000099 0.000007 0.96938 0.9683179 1.41 0.000036 0.000004 0.96938 0.96831710 1.37 0.000007 0.000002 0.96938 0.96831711 1.166 0.000044 0.132226 0.96938 0.98522512 1.161 0.000087 0.000133 0.96938 0.98522513 0.929 0.12753 0.000053 0.985388 0.98522514 0.922 0.000068 0.000704 0.985388 0.98522515 0.898 0.000011 0.075824 0.985388 0.99189716 0.740 0.07398 0.000019 0.991815 0.99189717 0.733 0.000006 0 0.991815 0.99189718 0.632 0.000015 0.056465 0.991815 0.99597719 0.624 0.054531 0.000022 0.995633 0.99597720 0.576 0.000006 0.000006 0.995633 0.99597721 0.557 0.000003 0.000001 0.995633 0.99597722 0.532 0.000003 0.000001 0.995633 0.99597723 0.489 0.023607 0.000021 0.996521 0.99597724 0.394 0.000018 0.025123 0.996521 0.99698325 0.379 0.000077 0.042725 0.996521 0.99999326 0.299 0.04295 0.000079 0.999566 0.99999327 0.285 0.000006 0.000007 0.999566 0.99999328 0.244 0.001874 0.000001 0.999572 0.99999329 0.235 0.000001 0.002004 0.999572 130 0.153 0.015782 0.000006 1 1
(a) Experimental results. (b) Numerical results.
Fig. 9. Dynamic amplification factors from the test and numerical analysis.
5.1. Displacement analysis
The results of the response spectrum analysis indicate thatthe deformations in the x direction are approximately equal tothose in the y direction (see Fig. 13). This can be attributed tothe symmetric structural system and shape. The maximum inter-story drift ratios in the x direction and y direction are 1/281.7 and1/261.1, respectively, both under the criteria stipulated in the localdesign code (BST). Thus, the structure can be regarded to satisfythe first level performance requirement. Due to the two outriggertrusses forming a cell at every eight or ten stories, the inter-storydrift ratio of each cell is in the shape of an arc, as shown in Fig. 14.The drift ratios are small in the top and bottom stories and largein the middle inter-stories. Such an outrigger truss functions like aring, which controls the lateral structural deformation. The storey
Fig. 10. Finite element model.
displacement curves take the shape of a deforming cantilever andare relatively smoothwithout obvious inflexions, which imply thatthe distribution of equivalent rigidities along the height of thestructure is well proportioned.
5.2. Interior force analysis
Three representative columns were selected to analyze theinterior forces in order to study the structural deformationmechanisms. The selected columns are the exterior corner column

1212 H. Fan et al. / Journal of Constructional Steel Research 65 (2009) 1206–1215
Fig. 11. Mode shapes of the first six modes obtained from numerical analysis.
Fig. 12. Design response spectrum.
C9, exterior side column C1, and interior corner column C5, asshown in Fig. 3.It can be seen from Fig. 15 that the axial force is the dominant
interior force in each columnandother interior forces are relativelysmall. The mega-frame is a dual system, where the steel framesare composed of the mega-columns and perimeter columns alongeach sloping face of the building, working in parallel with thebraced core which is the secondary resistant system. Therefore,the exterior side column C1 carries the heaviest vertical loads onits huge section. Since the structure is symmetrical, the torsionalmoment in each column is small. C9 and C1 are sloping below the27th floor, and the torsional moments are great in some lowerfloors. Abrupt increases in shear forces and bending moment inthese columns are observed near the outrigger belts, especiallynear the 26th floor and 27th floor. This is because the stiffnessof the outrigger belt is generally much larger than that betweenadjoining stories. Consequently, there tends to be aweak story nearan outrigger belt. This issue should be adequately dealt with inearthquake-resistant design of outrigger-braced tall buildings.
5.3. Material efficiency index
Material efficiency index (MEI) is usually used to estimate theefficiency of concrete-filled steel tubular columns,which is definedas the ratio of average axial stress to the maximum principalstress, MEI = σn/σmax × 100%. Values of the MEI of the threerepresentative columns are listed in Table 5 and discussed below.The exterior corner column C9 and exterior side column C1, as
shown as Fig. 3, are the main load-resistant components, and thevalues of MEI of the two columns are above 80%. Due to a largecross-section, a mega-column provides stiffness to resist lateralforces and reduce lateral deformation. Due to efficient utilization of
Fig. 13. Lateral deformation curves.
Fig. 14. Inter-story drift ratios curves.
materials, amega-frame provides lateral load resistance to preventinstability of the global structure under compressive loads andmoments (i.e., p–∆ effect).As shown in Fig. 16, the MEI curves are wavy with disconti-
nuities near the outrigger belts. Since the outrigger belts transferlarge lateral forces to the columns under lateral loading, the flex-ural deformations of the columns are increased and the percent-age of bending stress are also increased, leading to a reduction ofMEI.
6. Time history analysis
The response spectrum analysis conducted previously onlyconsidered themaximum amplitude of seismic effect, but dynamicanalysis in the time domain can provide more information forearthquake-resistant design of structures. The latter approachconsists of a step-by-step direct integration in which the timedomain is discretized into a large number of small increments,and for each time interval the equations of motion are solvedto obtain the structural responses such as displacements. Fourrecorded accelerograms were selected as inputs in the present

H. Fan et al. / Journal of Constructional Steel Research 65 (2009) 1206–1215 1213
(a) Axial force. (b) Shear force.
(c) Bending-moment. (d) Torsional-moment.
Fig. 15. Interior forces of the columns.
Table 5MEI of the columns.
Floor C1 C5 C9 Floor C1 C5 C9 Floor C1 C5 C9
1 0.81 0.59 0.65 31 0.90 0.45 61 0.82 0.372 0.84 0.21 0.72 32 0.95 0.65 62 0.91 0.583 0.90 0.30 0.84 33 0.97 0.70 63 0.97 0.794 0.94 0.43 0.89 34 0.90 0.45 64 0.98 0.845 0.98 0.67 0.95 35 0.87 0.32 65 0.99 0.886 0.99 0.76 0.95 36 0.77 0.22 66 0.95 0.677 0.98 0.63 0.82 37 0.82 0.27 67 0.90 0.348 0.98 0.68 0.98 38 0.85 0.38 68 0.86 0.339 0.95 0.41 0.78 39 0.91 0.51 69 0.93 0.5110 0.95 0.42 0.87 40 0.96 0.73 70 0.96 0.7011 0.96 0.48 0.94 41 0.96 0.69 71 0.97 0.7512 0.98 0.61 0.96 42 0.88 0.47 72 0.98 0.7713 0.99 0.71 0.96 43 0.85 0.34 73 0.98 0.7414 0.97 0.56 0.95 44 0.75 0.24 74 0.95 0.4515 0.96 0.43 0.92 45 0.81 0.31 75 0.88 0.1116 0.95 0.37 0.87 46 0.85 0.43 76 0.79 0.1317 0.95 0.39 0.79 47 0.91 0.57 77 0.92 0.3418 0.97 0.59 0.96 48 0.97 0.78 78 0.97 0.7619 0.96 0.50 0.81 49 0.95 0.70 79 0.98 0.7520 0.96 0.53 0.88 50 0.87 0.49 80 0.98 0.6521 0.98 0.63 0.92 51 0.83 0.32 81 0.97 0.4122 0.97 0.57 0.92 52 0.73 0.23 82 0.93 0.2323 0.94 0.42 0.91 53 0.79 0.30 83 0.86 0.1524 0.93 0.35 0.87 54 0.84 0.43 84 0.67 0.0725 0.91 0.33 0.65 55 0.91 0.56 85 0.90 0.2726 0.92 0.44 0.60 56 0.96 0.75 86 0.93 0.5527 0.78 0.21 57 0.95 0.70 87 0.93 0.3828 0.81 0.29 58 0.86 0.46 88 0.92 0.2629 0.85 0.35 59 0.81 0.30 89 0.91 0.4930 0.99 0.59 60 0.72 0.23 90 0.84 0.55
time-history analysis: the El-Centro (N-S), Taft (E-W ), Chi-Chi andTaiwan1115. Each accelerogram is composed of two horizontal andone vertical components of ground acceleration excitation. Foreach accelerogram, the magnitude of the ground acceleration wasscaled. The scaled ground accelerations used in the present analysishave the peak ground accelerations of 70 gal, 195 gal and 390
gal, representing an earthquake event with 50-year, 100-year and950-year return period, respectively.The maximum lateral displacement and inter-story drift ratio
of the structure under the four recorded accelerograms are listedin Table 6. It is illustrated that the structure still remains elasticafter the action of the earthquake excitation with 50-year return

1214 H. Fan et al. / Journal of Constructional Steel Research 65 (2009) 1206–1215
Table 6Maximum displacement and inter-story drift radio.
Earthquake action Maximum displacement/mm ∆/H Maximum inter-story drift ratio
x y x y x y
50-yr return period 286 357 1/1491 1/1196 1/656 1/525100-yr return period 697 851 1/613 1/502 1/224 1/182950-yr return period 1127 1320 1/379 1/324 1/136 1/119
Fig. 16. MEI of the columns.
Fig. 17. Displacement envelope curves for Taiwan1115 record.
period and satisfies the first lever performance requirement. It isalso revealed that the structure deforms plastically under seismicaction with a 950-year return period; however, the maximuminter-story drift ratio is 1/119,which is less than the correspondingcriteria (1/70) stipulated in the local design code (BTS) [23].Fig. 17 shows the curves of the displacement envelope in the y
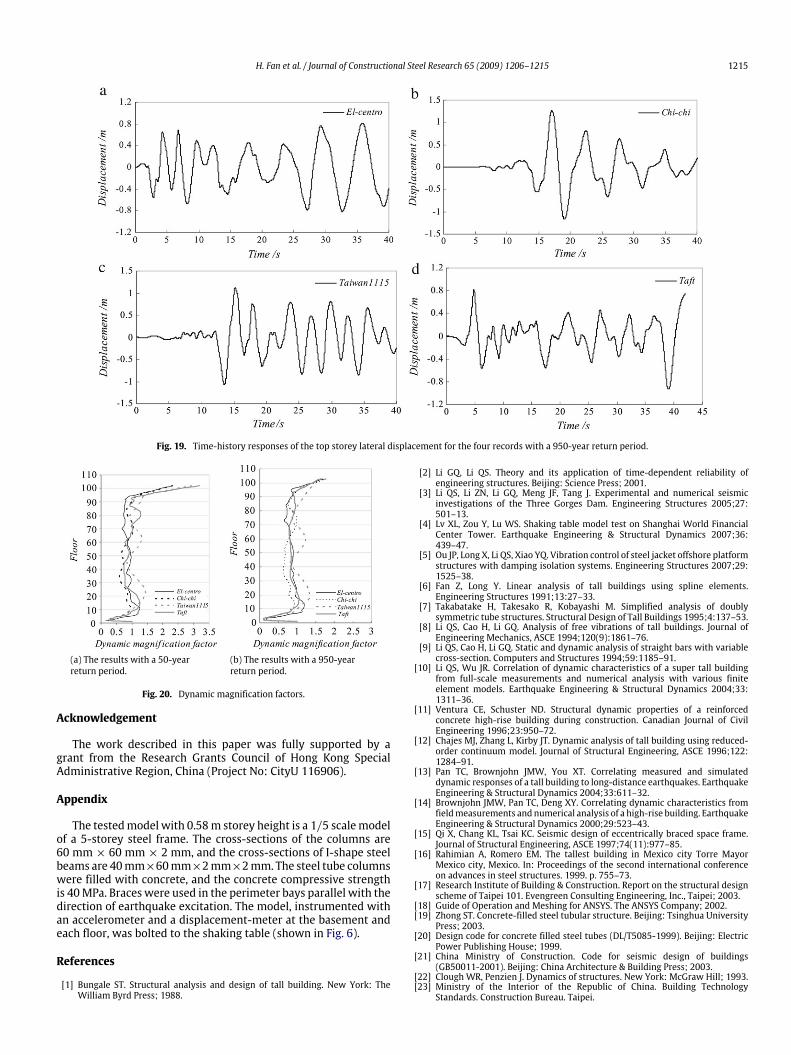
direction under the excitation of Taiwan1115 record with differentreturn periods, it is noted that under the seismic action with70 gal peak ground acceleration, the deformation curve is smoothwithout inflexions, similar to a deforming cantilever, indicatingthat the structure remains in an elastic stage. When the peakground acceleration is increased to 390 gal, the curve has aninflexion, which implies that some structural components havedeformed plastically. The curves of the displacement envelopein the y direction subjected to the four accelerograms with a950-year return period are shown in Fig. 18 and the seismicresponses of the lateral displacement at the top storey are shownin Fig. 19. Since the spectral compositions of the four earthquakerecords are different, there are differences in the curves of time-history responses of the lateral displacements. However, it isobserved from Fig. 18 that the curves of the displacement envelopehave a similar shape, showing that the mega-frame has a sheardeformation mode.Fig. 20 plots the dynamic amplification factors for the case of
earthquake events with a 50-year return period and a 950-year
Fig. 18. Displacement envelope curves for the four records with 950-year returnperiod.
return period. The dynamic magnification factors of the middlefloors are close to 1, which suggest that the equivalent rigiditiesalong the height of the structure is distributed well proportionally.Since the base of the finite elementmodel was assumed to be rigid,there is a discontinuity between the first floor and the ground. Thefloor area from the storeys 91st to 101st is smaller than that of astandard floor, so the rigidities of these floors are smaller, resultingin larger dynamic amplification factors.
7. Conclusions
A detailed study on the dynamic characteristics and seismicresponses of Taipei 101, theworld’s tallest building, was presentedin this paper. The constitutive relationships for rectangular CFTcolumns were established based on the unified theory, and thenwere verified through comparison between the shaking table testdata and numerical analysis results. A 3-D finite element modelof Taipei 101 structure was established based on the verifiedconstitutive relationships for the rectangular CFT columns andselected finite element types for the structural members. Theseismic analysis results of the super-tall building indicated that thestructural system, with belt trusses at every eighth or tenth story,provides equal stiffness along the height of the building, whichcan decrease the lateral deformation efficiently. Meanwhile, forsuch a mega-frame structural system with a central braced coreconnected to perimeter columns on each building face, the totaldead and live loads at every floor are transferred to the slopingexterior columns, thereby the structural capacity to withstandlateral loading is enhanced. The results of this research alsoshowed that Taipei 101 has relatively high earthquake resistanceand could guarantee the structural safety under a seismic actionwith a moderate seismic fortification, as stipulated in the localseismic design code. However, itwas revealed that there are abruptchanges in the shear force in the columns near the floors withoutrigger belts. This issue should be adequately dealt with in theearthquake-resistant design of high-rise structures of this type.
H. Fan et al. / Journal of Constructional Steel Research 65 (2009) 1206–1215 1215
Fig. 19. Time-history responses of the top storey lateral displacement for the four records with a 950-year return period.
(a) The results with a 50-yearreturn period.
(b) The results with a 950-yearreturn period.
Fig. 20. Dynamic magnification factors.
Acknowledgement
The work described in this paper was fully supported by agrant from the Research Grants Council of Hong Kong SpecialAdministrative Region, China (Project No: CityU 116906).
Appendix
The testedmodel with 0.58m storey height is a 1/5 scalemodelof a 5-storey steel frame. The cross-sections of the columns are60 mm × 60 mm × 2 mm, and the cross-sections of I-shape steelbeams are 40mm×60mm×2mm×2mm. The steel tube columnswere filled with concrete, and the concrete compressive strengthis 40MPa. Braces were used in the perimeter bays parallel with thedirection of earthquake excitation. The model, instrumented withan accelerometer and a displacement-meter at the basement andeach floor, was bolted to the shaking table (shown in Fig. 6).
References
[1] Bungale ST. Structural analysis and design of tall building. New York: TheWilliam Byrd Press; 1988.
[2] Li GQ, Li QS. Theory and its application of time-dependent reliability ofengineering structures. Beijing: Science Press; 2001.
[3] Li QS, Li ZN, Li GQ, Meng JF, Tang J. Experimental and numerical seismicinvestigations of the Three Gorges Dam. Engineering Structures 2005;27:501–13.
[4] Lv XL, Zou Y, Lu WS. Shaking table model test on Shanghai World FinancialCenter Tower. Earthquake Engineering & Structural Dynamics 2007;36:439–47.
[5] Ou JP, Long X, Li QS, Xiao YQ. Vibration control of steel jacket offshore platformstructures with damping isolation systems. Engineering Structures 2007;29:1525–38.
[6] Fan Z, Long Y. Linear analysis of tall buildings using spline elements.Engineering Structures 1991;13:27–33.
[7] Takabatake H, Takesako R, Kobayashi M. Simplified analysis of doublysymmetric tube structures. Structural Design of Tall Buildings 1995;4:137–53.
[8] Li QS, Cao H, Li GQ. Analysis of free vibrations of tall buildings. Journal ofEngineering Mechanics, ASCE 1994;120(9):1861–76.
[9] Li QS, Cao H, Li GQ. Static and dynamic analysis of straight bars with variablecross-section. Computers and Structures 1994;59:1185–91.
[10] Li QS, Wu JR. Correlation of dynamic characteristics of a super tall buildingfrom full-scale measurements and numerical analysis with various finiteelement models. Earthquake Engineering & Structural Dynamics 2004;33:1311–36.
[11] Ventura CE, Schuster ND. Structural dynamic properties of a reinforcedconcrete high-rise building during construction. Canadian Journal of CivilEngineering 1996;23:950–72.
[12] Chajes MJ, Zhang L, Kirby JT. Dynamic analysis of tall building using reduced-order continuum model. Journal of Structural Engineering, ASCE 1996;122:1284–91.
[13] Pan TC, Brownjohn JMW, You XT. Correlating measured and simulateddynamic responses of a tall building to long-distance earthquakes. EarthquakeEngineering & Structural Dynamics 2004;33:611–32.
[14] Brownjohn JMW, Pan TC, Deng XY. Correlating dynamic characteristics fromfieldmeasurements and numerical analysis of a high-rise building. EarthquakeEngineering & Structural Dynamics 2000;29:523–43.
[15] Qi X, Chang KL, Tsai KC. Seismic design of eccentrically braced space frame.Journal of Structural Engineering, ASCE 1997;74(11):977–85.
[16] Rahimian A, Romero EM. The tallest building in Mexico city Torre MayorMexico city, Mexico. In: Proceedings of the second international conferenceon advances in steel structures. 1999. p. 755–73.
[17] Research Institute of Building & Construction. Report on the structural designscheme of Taipei 101. Evengreen Consulting Engineering, Inc., Taipei; 2003.
[18] Guide of Operation and Meshing for ANSYS. The ANSYS Company; 2002.[19] Zhong ST. Concrete-filled steel tubular structure. Beijing: Tsinghua University
Press; 2003.[20] Design code for concrete filled steel tubes (DL/T5085-1999). Beijing: Electric
Power Publishing House; 1999.[21] China Ministry of Construction. Code for seismic design of buildings
(GB50011-2001). Beijing: China Architecture & Building Press; 2003.[22] Clough WR, Penzien J. Dynamics of structures. New York: McGraw Hill; 1993.[23] Ministry of the Interior of the Republic of China. Building Technology
Standards. Construction Bureau. Taipei.