screening of fresh water microalgae and swedish pulp...
TRANSCRIPT

Screening of fresh water microalgae and Swedish pulp and paper mill waste waters with the focus on high algal biomass production
Master of Science Thesis (in the Master Degree Programme, Biotechnology)
ZANNATUL FERDOWSHI Department of Chemical and Biological Engineering Division of Life Science Industrial Biotechnology Research Group CHALMERS UNIVERSITY OF TECHNOLOGY Gothenburg, Sweden, 2013 Master’s Thesis, 2013

ii
Screening of fresh water microalgae and Swedish pulp and paper mill waste waters with the focus on high algal biomass production
ZANNATUL FERDOWSHI
Department of Chemical and Biological Engineering CHALMERS UNIVERSITY OF TECHNOLOGY
Gothenburg, Sweden 2013

iii
THESIS SUBMITTED
FOR THE PARTIAL FULFILMENT
OF
MASTER PROGRAMME OF BIOTECHNOLOGY
Screening of fresh water microalgae and Swedish pulp and paper mill waste waters with the focus on high algal biomass production
ZANNATUL FERDOWSHI
Under the supervision of
Susanne Ekendahl &
Mathias Bark
SP Technical Research Institute of Sweden, Borås, Sweden
Examiner of
Dr. Eva Albers
Industrial Biotechnology Group, Department of Chemical and Biological Engineering
Chalmers University of Technology, Gothenburgg, Sweden

iv
Preface
This master thesis project was done at SP Technical Research Institute of Sweden and was funded by ÅF research program running in 2013.
I would like to thank my supervisor Susanne Ekendahl and Mathias Bark for the opportunity to do my master thesis project at SP and for their kind assistance and guidance throughout the project. SP provides a great platform for learning research and the people made me feel welcomed and appreciated. It was a wonderful working experience. I would like to thank my co-worker Ingrid Appelberg and Hanna Rosengren and other colleagues in SP for their infinite support and help during my work.
I would also like to express my gratitude to my examiner Eva Albers from Chalmers University of Technology for giving me the chance to work in this remarkable field of microalgae and support me with her constructive suggestions.
I also want to thank my family and friends for their unconditional support and inspirations.
Zannatul Ferdowshi
2013

v
Abstract
Microalgae as a source of feedstock for biofuels production recently have restored attention due to the current concerns regarding high oil prices and environmental impacts. Biomass derived from microalgae can positively contribute to the issue from two points of view: CO2 bio-fixation and concomitant reduction of nitrogen and phosphorus from waters would lead to environmental sustainability and the biomass yielded could be used to produce biofuel or other valuable products. Industrial waste waters are potential substitute of traditional media used for microalgae cultivation. For decades, algae have been used for treating waste water in different industries taking advantage of their high removal efficiency of nitrogen and phosphorus. However, using waste water for achieving a high algal biomass production is a different scenario. In this aspect, the focus is to get the highest possible cell mass when using the waste water, instead of just ensuring minimal levels of N and P in the treated water. Pulp and paper mills are major consumers of water resources and these industries discharge a huge amount of water to nearby lakes or rivers. The current research work investigated whether pulp and paper mill waste water is suitable for microalgae cultivation with the aim to achieve significant biomass production. Nine different process waters from five Swedish pulp and paper mills were tested with nine fresh water species of microalgae. Six of these waters were unable to support growth of microalgae due to color, turbidity and toxicity issues. Only three waters collected from Holmen Paper, Arctic Paper Munkedals AB, and Billerud Gruvön mill were able to support growth of the nine tested microalgae to a limited extent. During scale up, through a lab constructed gas distribution system, 1% CO2 was added to the cultures to enhance the algal growth (flow rate of 2000 ml/min. In these scaled-up cultivations, three fresh water microalgae were used: Chlamydomonas reinhardtii, Scenedesmus obliquus and Dictyosphaerium pulchellum. The highest cell concentration was achieved only when the waste waters were supplemented with nutrients (either with municipal water or with nitrate and phosphate salts), which indicated that one of the major limiting factors was low nutrient concentrations present in the waste waters. The order of growth for these three microalgae was similar (D. pulchellum> S. obliquus > C. reinhardtii), irrespective of type of water. There was no noticeable difference in growth, while growing in ammonium rich waste water and nitrate rich waste water. After two weeks of microalgae cultivation in Holmen Paper waste water supplied with nitrate and phosphate, the highest biomass was achieved by D. pulchellum (1.36 g/L). More than 90% of phosphate-P and around 65-81% nitrate-N was removed by the three fresh water microalgae. Thus, serious attention needs to be put on nutrient concentration levels while using pulp and paper mill waste water for microalgal biomass production.
Key words: Fresh water microalgae, Chlamydomonas reinhardtii, Scenedesmus obliquus, Dictyosphaerium pulchellum, biofuels, bio-fixation, waste water.
vi
TABLE OF CONTENT
1. INTRODUCTION .................................................................................................................................................. 1
1.1. BACKGROUND ......................................................................................................................................................... 1 1.2. TARGET GROUP ....................................................................................................................................................... 3 1.3. AIM ...................................................................................................................................................................... 3 1.4. CONSTRAINS ........................................................................................................................................................... 3
2. THEORY .............................................................................................................................................................. 5
2.1. INTRODUCTION TO ALGAE ......................................................................................................................................... 5 2.2. ALGAE GROWTH: AUTOTROPHY, HETEROTROPHY AND MIXOTROPHY .................................................................................. 5 2.3. ALGAE PHOTOSYNTHESIS ........................................................................................................................................... 5
2.3.1. Photosynthetic apparatus:.......................................................................................................................... 6 2.3.2. Light dependent reaction ............................................................................................................................ 6 2.3.3. Dark Reaction/ Light independent reaction ................................................................................................ 6
2.4. FACTORS AFFECTING MICROALGAE GROWTH ................................................................................................................. 7 2.4.1. Light ............................................................................................................................................................ 7 2.4.2. Temperature ............................................................................................................................................... 8 2.4.3. pH ............................................................................................................................................................... 9 2.4.4. Nutrients: .................................................................................................................................................. 10
Carbon .............................................................................................................................................................................. 10 Nitrogen and phosphorus ................................................................................................................................................. 10 Sulfur ................................................................................................................................................................................ 11
2.5. ALGAE CULTIVATION ............................................................................................................................................... 11 2.5.1. Mode of growth: Batch and Continuous ................................................................................................... 11 2.5.2. Algae culture medium ............................................................................................................................... 11 2.5.3. Growth rate .............................................................................................................................................. 12 2.5.4. Algae growth on waste water .................................................................................................................. 13
2.6. APPLICATION OF ALGAL BIOMASS .............................................................................................................................. 13 2.7. PULP AND PAPER MAKING PROCESS ........................................................................................................................... 14
Wood Preparation ............................................................................................................................................................ 14 Pulp production ................................................................................................................................................................ 14 Bleaching .......................................................................................................................................................................... 15 Paper making: ................................................................................................................................................................... 15
2.8. PULP AND PAPER MILL EFFLUENTS ............................................................................................................................. 16
3. MATERIALS AND METHODS .............................................................................................................................. 17
3.1. MICROALGAE SPECIES AND STRAINS ........................................................................................................................... 17 3.2. COLLECTING WATERS FROM SWEDISH PULP AND PAPER MILLS......................................................................................... 17
Holmen Paper, Braviken ................................................................................................................................................... 18 Stora Enso, Skoghall ......................................................................................................................................................... 18 Billerud Korsnäs, Gruvön .................................................................................................................................................. 19 Arctic Paper, Munkedals AB, Munkedal ........................................................................................................................... 20 Södra, Värö ....................................................................................................................................................................... 20
3.3. CULTURE CONDITION .............................................................................................................................................. 22 3.4. PRESCREENING ...................................................................................................................................................... 22 3.5. EQUIPMENT SETUP FOR SCALING-UP TO E-FLASKS ........................................................................................................ 23

vii
3.6. SCALED-UP SCREENINGS IN E-FLASKS WITH A GAS DISTRIBUTION SYSTEM .......................................................................... 25 3.6.1. Screening 1 - Algae growth in pulp and paper mill waste waters ............................................................ 26 3.6.2. Screening 2 – Algae growth in pulp and paper mill waste waters modified with municipal waste water 26 3.6.3. Screening 3 – Algae growth in Holmen Paper waste water supplemented with Nitrate and Phosphate . 26
3.5. ANALYTICAL METHODS ............................................................................................................................................ 27 3.5.1. Optical density (OD) measurement .......................................................................................................... 27 3.5.2 Algal biomass determination / dry weight ................................................................................................ 27 3.5.3 Measurement of pH ................................................................................................................................... 28 3.5.4. Phosphorous and nitrogen analysis .......................................................................................................... 28
4. RESULTS ........................................................................................................................................................... 29
4.1. PRESCREENING ...................................................................................................................................................... 29 4.1.1. Selection of waste water .......................................................................................................................... 29 4.1.2. Selection of microalgae species ................................................................................................................ 30
4.2. BATCH CULTIVATION IN A GAS DISTRIBUTION SYSTEM .................................................................................................... 30 4.2.1. Screening 1 with pulp and paper mill waste waters ................................................................................. 31 4.2.2. Screening 2 with the pulp and paper mill waste waters, modified with municipal waste water ............. 35 4.2.3. Screening 3 with Holmen Paper waste water supplemented with nitrate and phosphate ...................... 38
5. DISCUSSION ...................................................................................................................................................... 41
5.1. FRESH WATER MICROALGAE SPECIES SELECTION FOR THE SCALE UP .................................................................................. 41 5.2. IMPACT OF WASTE WATER QUALITY .......................................................................................................................... 42 5.3. GROWTH CHARACTERISTICS OF THE MICROALGAE IN THE PROCESS WATERS ....................................................................... 43 5.4. EFFECT OF NUTRIENT CONCENTRATION....................................................................................................................... 43 5.5. EFFECT OF PH ON THE CULTURE MEDIUM ................................................................................................................... 44
6. CONCLUSION .................................................................................................................................................... 45
7. REFERENCES ..................................................................................................................................................... 46
APPENDIX A ......................................................................................................................................................... 53
APPENDIX B .......................................................................................................................................................... 54
APPENDIX C .......................................................................................................................................................... 55
APPENDIX D ......................................................................................................................................................... 61

1
1. Introduction
Cultivation of microalgae in industrial process waters holds great potential from both bioremediation and biofuel production context. Resemblance in the research works regarding utilization of algae from 1980’s and 1990’s compared to the most recent papers is striking. However till this day, microalgae are in the center of attention, due to their advantages over the conventional biofuel feedstock. While growing, microalgae can fixate carbon dioxide from pollution sources (i.e. flue gas) and are able to take up inorganic compounds from waste water and use them as nutrients. In addition, the biomass from microalgae is a great source of feed stock for oil production. These characteristics of microalgae eliminates the need for using fresh water as media and also add value to the industries by utilizing effluents such as: waste water, flue gas etc. However, in practice, several factors are needed to be considered, while using industrial process water to grow microalgae. This is why the current thesis work is important. In this study, different pulp and paper mill effluents were investigated as media for nine fresh water microalgae species, with a goal to achieve high algae biomass production.
1.1. Background The two greatest challenges of this century are global warming and energy crisis. Fossil fuel is the major energy source for human civilization and diminishing natural resources of oil had led to the excessive cost of petroleum. In addition, the burning of fossil fuels causes release of enormous amounts of greenhouse gas, which in turn directly affects the climate change (1). Therefore, there is a growing demand to reduce our dependence of fossil fuel, and substitute it with alternative oils, which will be renewable and environmentally sustainable.
A lot of attention has been drawn to deriving oil from biomass, which can be used for production of biofuel. Biofuels can be in three states: solid, liquid and gaseous (2). In this report, only liquid biofuel will be discussed. Depending on feedstock used for the production, they are categorized as first, second, and third generation biofuels (2). Bioethanol and biodiesel are the two main types of liquid biofuels available in the market. First generation (1G) biofuel is the dominating biofuel in the current market. This category includes both bioethanol and biodiesel, where starch and sugar crops are used for bioethanol and vegetable oil are used as feedstock for biodiesel production (3). The major source for sugar to produce bioethanol are in USA and Brazil maize and sugar cane and in UK sugar beet and cereals Whereas, biodiesel produced comes in USA from soybeans (4) and in Europe 70% of the stock comes from rapeseed oil (1). The production in first generation biofuel involves conventional methods of fermentation and esterification (2). Although the technology for 1G biofuels already is established in the market, the question regarding the massive use of arable land for the production had stimulated interest in developing biofuels from non-food based resources. The second generation (2G) biofuel mainly comprises bioethanol, where lignocellulose is the fundamental raw material.

2
Therefore, besides low cost energy crops and short-rotation forests, other sources are used to get lignocellulosic material; including vegetative grasses, forest residues, cereal straw and certain waste sources, like municipal solid waste and wood process waste (5). These additional sources of feedstock enable a reduction of the land use for biofuel production compared to the production of 1G biofuels. On the other hand, the production for 2G is still capital intensive, as adequate water and nutrition is required to achieve high ethanol yield (5). The process technology is rather critical and still not established as compared to for the first generation biofuels. Improvements are required to enhance the efficacy of hydrolysing enzymes and occurrence of inhibitory by-product formation during the biochemical conversion of lignocellulose to ethanol needs to be minimized (5).
Microalgae as miniature cell factories for biofuel production, has the potential to overcome the limitations addressed in 1G and 2G biofuels. Although algae research in USA was begun in 1978, by Department of Energy (DoE), during 1996 the program was discontinued due to funding limitation owing to deceases in the oil price (6). However in the recent decade, drastic rises in oil price and climate concerns have rejuvenated the attention in algae research. In 2007, US government established Energy Independence and Security Act (EISA) to pursue non-corn ethanol production and mitigate greenhouse gas emission, through the provision of Renewable Fuels Standard (RFS) (6). In Europe, algae research also gained much attention recently, due the act by European Energy Commission, aiming to meet the one-fourth of transport fuel in EU from clean and CO2 efficient biofuel by 2030 (3) .
As a potential feedstock for biofuels, microalgae provide several advantages compared to terrestrial plants. The most popular is that algal feedstock could be non- competitive with the food resource. According to Uday Bhan Singh (7), the photosynthetic efficiency of microalgae is 10-20% higher than for terrestrial plants. Microalgae also require relatively less light intensity (7) and can tolerate a wide variety of waters (6) (7). Microalgae biomass productivity is relatively high due to fast growth. Generally, the doubling time during exponential growth for microalgae is 3.5 h (4) . Microalgae posses a simple structure and can accumulate carbohydrates and lipids under certain conditions. Therefore they are a potential source used in biorefinery.
Although the basic concept of utilizing microalgae for biofuel has been explored for decades, the algae biotechnology is still at its infancy. Algae oil promises sustainability relative to corn-ethanol, biodiesel from plant oil or even cellulosic ethanol. However, only around 5000 to 10000 tons of algal biomass is commercially produced worldwide (3). This holding back is due to the high expense regarding construction material for cultivation system, proper agitation, CO2 administration, and supply of large amount of water and nutrient resources. According to Chisti (4), approximately 183 t of CO2 is required to produce 100 t of algae biomass. If fresh water is used without recycling, in order to achieve 1 kg of biodiesel from microalgae biomass, would

3
require about 3726 kg water, 0.33 kg of nitrogen and 0.71 kg of phosphate (8) . Nevertheless, after deciding the microalgae species to use with a desired lipid profile, these are the problems anticipated during microalgae cultivation. In this context, industrial effluents such as waste water and CO2 emission provide a means to reduce the expenses in microalgae cultivation.
In this context, the present study will positively contribute to the knowledge regarding suitable microalgae cultivation in pulp and paper mill waste water.
1.2. Target Group The pulp and paper industry are one of the major industrial sectors in Sweden. It is the third largest in Europe, after Germany and Finland, contributing with about 28% of the pulp production and 12% of the paper and board production (9). Sweden’s pulp and paper industry maintains a strong competitive edge and has the interest to achieve more energy efficient technologies with less adverse environmental impact. Although there is no direct law enforcement or regulatory influence from the government, Sweden’s Pulp and paper industry are very keen to develop green technologies. Therefore they are collaborative partners for several research projects in this field. Consequently in this study, pulp and paper mill effluents are the target sources for using as cheap supply of media and CO2 in microalgae cultivation. In addition, pulp and paper mill waste water comes with excess heat, which has a positive impact, since Sweden has ambient temperatures during a large part of the year lower than the optimal temperature for growth of microalgae (10).
1.3. Aim This project objective is to investigate if Swedish pulp and paper mill waste waters is suitable medium for high microalgae growth production. Nine waste waters and nine fresh water microalgae were investigated in the prescreening experiment. In the scaled-up screening experiments, 1% CO2, with a flow rate of 2000 ml/min, was added to enhance the microalgae growth in waste waters. The focus was to follow the microalgae growth, specific growth rate, pH and nutrient uptake.
This project is a continuation of earlier research work conducted by Bark (11), where microalgae were tested in artificial growth medium with flue gas mimicked from paper mill effluents. Thus, the project also aims in finding microalgae species that might grow on both flue gas and waste water from Swedish pulp and paper mills.
1.4. Constrains There should be certain restrictions in this project. The number of microalgae species and process waters are limited due to equipment set up and as well as the time limitation. The equipment that was used has a capacity of 12 batch cultivations per run and one test run took around 5-10 days. Maintaining an optimal flow rate of the added flue gas that should affect

4
agitation of the culture is an important factor. Another important factor that needs consideration is the pH of the cultivation. As CO2 dissolves to carbonic acid the pH in the medium declines whereas growth of microalgae increases the pH. Although all the algal species have different optimum growth temperatures, for simplicity of the experiment, in this project the temperature for the cultures was maintained approximately at room temperature and fluorescence bulb lamps were used as light source.

5
2. Theory
2.1. Introduction to Algae Algae represent a large group of different organisms from different phylogenic groups with no particular taxonomic standing (12). In context of size and morphology, algae can be ranging from unicellular to filamentous and multicellular. Based on this feature algae is categorized into two groups: 1) macroalgae, also known as seaweeds normally found in the ocean and have plant-like appearance due to their considerable size (can grow up to about 50 meters) (12).; and 2) microalgae: the oxygen producing chlorophyll a containing photosynthetic type of algae, which are only visualized under microscope (13). This group of algae is highly diversified in morphology and usually is found in aquatic environment, including fresh water, brackish water, marine water and moist surroundings (lichen, symbiosis with fungi) (12). Due to the presence of chlorophyll, microalgae are generally green in color. Some types of microalgae contain different pigments, such as xanthophylls and carotenoids, which provide them brown or red appearance (12). Microalgae used in this study are all green algae grouped under Chlorophyta division (13).
2.2. Algae growth: Autotrophy, heterotrophy and mixotrophy Knowledge regarding algae growth is one of the key features that are essential to know for proper implementation of algae technology. Microalgae species that are capable of using energy obtained directly from light are referred to as autotrophic microalgae. These microalgae actively sequester carbon dioxide from the atmosphere as carbon source (14). In addition, some microalgae can also utilize organic compounds as their carbon and energy source, eliminating the need of CO2 and light. This mode of growth is called heterotrophic growth (14). When microalgae can use both organic and inorganic carbon source simultaneously, they are growing as a mixotrophic culture (14).
In this study, the selected microalgae are autotrophic microalgae in general. However, some of them are capable of heterotrophic growth: Chlamydomonas reinhardtii, Chlorella sorokiniana, Chlorella vulgaris and Chlorella protothecoides (15), and some can grow mixotrophically as well: Chlorella protothecoides (16), Chlorella vulgaris, and Scenedesmus obliquus (17). Chlorella sorokiniana is reported to grow heterophically at night and switch to mixotrophic growth during day time (14). Based on the growth mode, biomass productivity of microalgae may vary. According to Lee (17), heterotrophic culture shows relatively lower maximum specific growth rates compared to photosynthetic growth, but result in higher cell density and productivity.
2.3. Algae Photosynthesis In general Photosynthesis comprises a series of reactions where carbon, from its maximally oxidized state (CO2) is converted to reduced compounds (carbohydrates), using light energy. During respiration, these reduced compounds can be re-oxidized to CO2 (12).
6
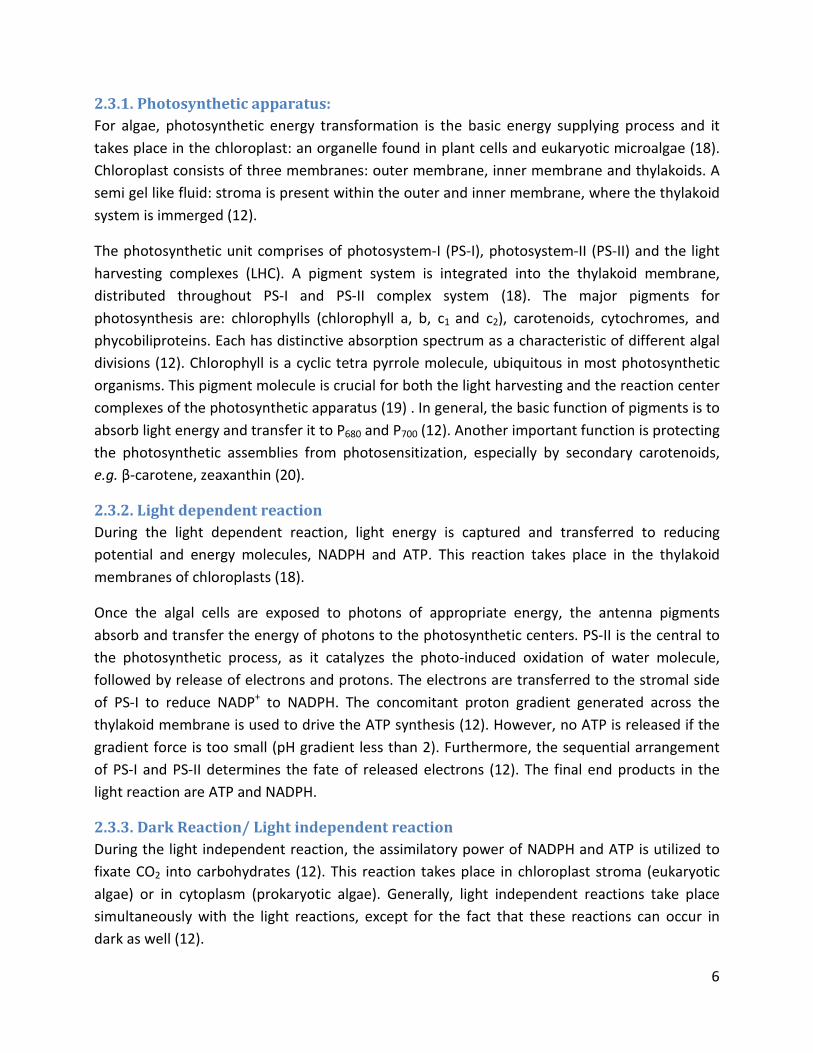
2.3.1. Photosynthetic apparatus: For algae, photosynthetic energy transformation is the basic energy supplying process and it takes place in the chloroplast: an organelle found in plant cells and eukaryotic microalgae (18). Chloroplast consists of three membranes: outer membrane, inner membrane and thylakoids. A semi gel like fluid: stroma is present within the outer and inner membrane, where the thylakoid system is immerged (12).
The photosynthetic unit comprises of photosystem-I (PS-I), photosystem-II (PS-II) and the light harvesting complexes (LHC). A pigment system is integrated into the thylakoid membrane, distributed throughout PS-I and PS-II complex system (18). The major pigments for photosynthesis are: chlorophylls (chlorophyll a, b, c1 and c2), carotenoids, cytochromes, and phycobiliproteins. Each has distinctive absorption spectrum as a characteristic of different algal divisions (12). Chlorophyll is a cyclic tetra pyrrole molecule, ubiquitous in most photosynthetic organisms. This pigment molecule is crucial for both the light harvesting and the reaction center complexes of the photosynthetic apparatus (19) . In general, the basic function of pigments is to absorb light energy and transfer it to P680 and P700 (12). Another important function is protecting the photosynthetic assemblies from photosensitization, especially by secondary carotenoids, e.g. β-carotene, zeaxanthin (20).
2.3.2. Light dependent reaction During the light dependent reaction, light energy is captured and transferred to reducing potential and energy molecules, NADPH and ATP. This reaction takes place in the thylakoid membranes of chloroplasts (18).
Once the algal cells are exposed to photons of appropriate energy, the antenna pigments absorb and transfer the energy of photons to the photosynthetic centers. PS-II is the central to the photosynthetic process, as it catalyzes the photo-induced oxidation of water molecule, followed by release of electrons and protons. The electrons are transferred to the stromal side of PS-I to reduce NADP+ to NADPH. The concomitant proton gradient generated across the thylakoid membrane is used to drive the ATP synthesis (12). However, no ATP is released if the gradient force is too small (pH gradient less than 2). Furthermore, the sequential arrangement of PS-I and PS-II determines the fate of released electrons (12). The final end products in the light reaction are ATP and NADPH.
2.3.3. Dark Reaction/ Light independent reaction During the light independent reaction, the assimilatory power of NADPH and ATP is utilized to fixate CO2 into carbohydrates (12). This reaction takes place in chloroplast stroma (eukaryotic algae) or in cytoplasm (prokaryotic algae). Generally, light independent reactions take place simultaneously with the light reactions, except for the fact that these reactions can occur in dark as well (12).

7
The reaction scheme involves three phases: first, carboxylation, where CO2 is added to a 5-carbon molecule, Ribulose bisphosphate (RuBP), resulting in a 6-carbon molecule that is later broken down to form 3-phosphoglycerate. The reaction is catalyzed by the enzyme Rubisco. In the second phase, reduction of 3-phosphoglycerate takes place by NADPH2 to form phosphoglyceraldehyde. In the final phase, ribulose bisphosphate is regenerated from triose phosphate, through a series of reactions to bind more CO2. ATP from the light reaction is utilized in the final step (12). The products of the dark reaction includes carbohydrates, fatty acids, amino acids, and organic acids (18).
Figure 1: Schematic drawing of the photosynthetic machinery, redrawn from (12).
2.4. Factors affecting microalgae growth
2.4.1. Light Light is one of the most important factors in aspect of microalgae growth, as it is the fundamental energy source for photosynthesis. In an outdoor cultivation system, natural sun is used to take advantage of the natural provided light, minimizing the cost of production. In an indoor/closed setup, artificial light is supplied uninterruptedly or in light and dark cycles.
8
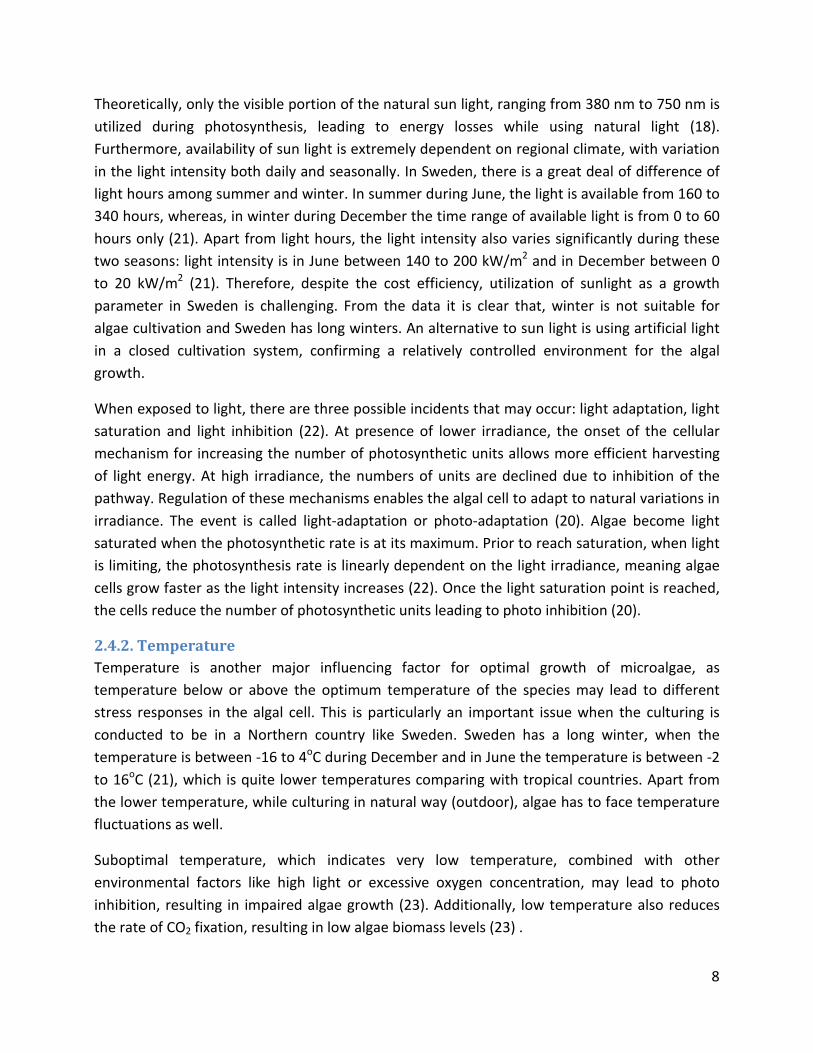
Theoretically, only the visible portion of the natural sun light, ranging from 380 nm to 750 nm is utilized during photosynthesis, leading to energy losses while using natural light (18). Furthermore, availability of sun light is extremely dependent on regional climate, with variation in the light intensity both daily and seasonally. In Sweden, there is a great deal of difference of light hours among summer and winter. In summer during June, the light is available from 160 to 340 hours, whereas, in winter during December the time range of available light is from 0 to 60 hours only (21). Apart from light hours, the light intensity also varies significantly during these two seasons: light intensity is in June between 140 to 200 kW/m2 and in December between 0 to 20 kW/m2 (21). Therefore, despite the cost efficiency, utilization of sunlight as a growth parameter in Sweden is challenging. From the data it is clear that, winter is not suitable for algae cultivation and Sweden has long winters. An alternative to sun light is using artificial light in a closed cultivation system, confirming a relatively controlled environment for the algal growth.
When exposed to light, there are three possible incidents that may occur: light adaptation, light saturation and light inhibition (22). At presence of lower irradiance, the onset of the cellular mechanism for increasing the number of photosynthetic units allows more efficient harvesting of light energy. At high irradiance, the numbers of units are declined due to inhibition of the pathway. Regulation of these mechanisms enables the algal cell to adapt to natural variations in irradiance. The event is called light-adaptation or photo-adaptation (20). Algae become light saturated when the photosynthetic rate is at its maximum. Prior to reach saturation, when light is limiting, the photosynthesis rate is linearly dependent on the light irradiance, meaning algae cells grow faster as the light intensity increases (22). Once the light saturation point is reached, the cells reduce the number of photosynthetic units leading to photo inhibition (20).
2.4.2. Temperature Temperature is another major influencing factor for optimal growth of microalgae, as temperature below or above the optimum temperature of the species may lead to different stress responses in the algal cell. This is particularly an important issue when the culturing is conducted to be in a Northern country like Sweden. Sweden has a long winter, when the temperature is between -16 to 4oC during December and in June the temperature is between -2 to 16oC (21), which is quite lower temperatures comparing with tropical countries. Apart from the lower temperature, while culturing in natural way (outdoor), algae has to face temperature fluctuations as well.
Suboptimal temperature, which indicates very low temperature, combined with other environmental factors like high light or excessive oxygen concentration, may lead to photo inhibition, resulting in impaired algae growth (23). Additionally, low temperature also reduces the rate of CO2 fixation, resulting in low algae biomass levels (23) .

9
Fluctuation in temperature leads to onset of stress response in algae cells, which thus counteracts the effects of an increase in temperature. In other words, even though the temperature is increased gradually to an optimum level, the initial exposure of the culture to suboptimal temperature for a short time may result in significant decrease in the photosynthetic parameters (23). This type of inhibition is more likely to happen in an open culturing system in Sweden, where temperature is lower relatively to the light irradiance. However this can be avoided in the closed cultivation system by exposing the microalgae to a fixed temperature from the beginning.
On contrarily, lower temperature than optimum level influences the lipid profile of algae species. In order to adapt to the lower temperature, cells begin to synthesize unsaturated fatty acids in the thylakoid membrane to enhance its stability and fluidity, which in turn helps to protect the photosynthetic machinery from photo inhibition (20). However, the impact of low temperature is more directed to the type of lipid rather than enhancing the total content of lipid (20).
Temperature also has a direct correlation to the nutrient concentration and cell constituent. The algae cell volume and biochemical content increases if the temperature is below or above the optimum level, thus more nutrients is required to grow microalgae compared to growth at optimum temperature (20). It has been found that, high temperature significantly increased the chlorophyll a content in S. obliquus when there was a fairly high amount (10 mg/L) of phosphorus present in the media (24). In another report (25), it was found that the inhibition of S. obliquus growth by excessive phosphorus was highly dependent on the culture temperature. However in this report, the temperature optimum for the phosphorus consumption (25o C) was found to be different compared to at the optimum temperature for the algal growth (30o C). Therefore the choice for temperature suitable for an algae culturing system needs to be decided strictly based on the original aim of algae cultivation.
2.4.3. pH The pH is another environmental factor crucial for microalgae growth. In the algae culture; pH is balanced by the interplay between photosynthesis and respiration. CO2 fixation during photosynthesis liberates OH- in the culture, which accumulates while the algae species grow and results in an elevated pH in the system. A similar reaction takes place, when bicarbonate is the inorganic carbon source (14). During respiration, the opposite reaction takes place, resulting in decreasing the pH in the culture (14).
Besides CO2 and bicarbonate, nitrate and ammonium also influence the pH level in a culture. When ammonium is the sole nitrogen source of a culture, due to release of H+ ions during assimilation a decrease in pH is obtained, whereas nitrate as major nitrogen source has the opposite effect (14).

10
It is very important to maintain the pH level in a culture medium, as very high pH (>9.0) inhibits the photosynthesis (26). Because at this pH most inorganic carbon is in the carbonate form, thus cannot be taken up by photosynthesis. High pH also influences the overall nutrient uptake, by mediating flocculation (26).
2.4.4. Nutrients: After the environmental parameters are fulfilled, microalgae require presence of nutrients in the water (or habitat) in order to grow. Microalgae have relatively simple nutritional demand, which make them an attractive package for commercial production. Carbon, nitrogen and phosphorous are the major nutrients for survival of microalgae. Among other nutrients some are macronutrients such as sulfur, potassium, calcium, magnesium and some are micronutrients, like manganese, copper, molybdenum, boron, iron, zinc, chloride, nickel etc (14). These trace elements has an important role in many enzymatic reactions and biosynthetic pathways (14). The requirement for nutrients may vary depending on the type of microalgae species. An overall stoichiometric formula for an algae cell including the most common elements is C106H181O45N16P (14) (10).
Carbon The carbon sources can be either organic or inorganic or both, depending on the growth mode. For an autotrophic system microalgae use mainly carbon dioxide and bicarbonate (HCO3
-) to make up most of the carbon skeleton. Heterotrophic microalgae grows on organic carbon sources such as glucose, fructose, and acetic acid (14).
Nitrogen and phosphorus Nitrogen (N) is the second most important nutrient, after carbon, contributing to the algae biomass production. Although several inorganic compounds can be utilized by algae, for most of them, nitrate, ammonium, and urea are the sole N-suppliers (14). However, when both nitrate and ammonium are present in a culture, algae often prefers ammonium over nitrate as their nitrogen source (14).
Phosphorus is another vital nutrient for algal growth, as it is an active participant in many metabolic processes, like energy transfer and different biosynthetic pathways. Algae take up phosphorus mostly as orthophosphate (PO4
2-) in an energy dependent way (14). Although a low amount of phosphorus is required for algae growth compared to C and N, phosphorus uptake can be limiting because orthophosphates can easily bind to other ions present in the culture (CO3
2-, iron etc.) and precipitate (14). High pH also mediates precipitation of phosphate, which re solubilizes when the pH drops (26).

11
Sulfur Sulfur is an essential macronutrient that is utilized by microalgae, primarily as the inorganic sulfate anion (27). In microalgae, metabolic changes take place in order to acclimate to any environmental stress including nutrient deficiency. It is known that, generally, microalgae in nutrient deprived conditions tend to accumulate lipids. In case of mineral deprivation, sulfur in particular, has been shown to increase hydrogen production (28). Morsy (29) reported that culturing Chlamydomonas reinhardtii in sulfur limiting condition leads to increase in anaerobic H2 production. Although both nitrogen and sulfur deficiency cause elevation of lipid content, according to Cakmak et al,2012, (30) tri acyl glycerol (TAG) production in Chlamydomonas reinhardtii is larger in a sulfur limiting culture.
2.5. Algae cultivation
2.5.1. Mode of growth: Batch and Continuous In a continuous culture, the medium is replenished with new medium, while the existing medium is continuously used up by the algae. Theoretically, new medium is fed in similar rate as the culture removed, thus the culture volume and rate of dilution is maintained (17). However, in practice, a continuous culture is rather complex to install and run. A major drawback is that it is difficult to maintain the reproducible cultivation set-up and quality of the feedstock (31).
In the batch culture, the culture medium and the algae species are prepared only once at the beginning of the cultivation. No more medium is fed during the growth, but CO2 and air can be added in order to enhance the growth (17). Unlike the continuous culturing mode, in a batch culture the growth rate varies throughout the culturing period because, when cell density becomes high, the light intensity begins to vary with time and location, leading to a light limiting situation. On the other hand, in a continuous culture the light varies only with location (32). If a small amount of the algae inoculum is added, a lag phase may occur representing the adaptation phase of the cells to the new environment (17). As the cells adapt to the new culturing condition, the lag phase is followed by an exponential growth phase (log phase), which shows to be linear due to photoautotrophic growth (17). The growing culture reaches to a state when the cell density, restrain the penetration of light to reach all cells and cause lack of light saturation to those cells. This may result in limited biomass production giving rise to the linear trend of growth (17).
2.5.2. Algae culture medium Choosing the right medium is a key factor in algae cultivation. However the choice is highly dependent on the target of cultivation and the algae species selected for the experiment. A different medium is required dependent on the type of algae, whether it is collected from a
12
marine source or from fresh water or from brackish water. The nutrients supplied to the medium directly affect the cellular constituent of the respected culture, which is another vital factor to be considered.
In this study, fresh water microalgae are under investigation. Some common media suggested for growing fresh water microalgae are: Bristol medium, BG-11, and Bold’s Basal Medium. Bristol medium is a well-known medium for fresh water microalgae, originated from the Bristol’s recipe done by H.C. Bold (33). BG-11, on the other hand, is a modification of G-11 medium of Hughes, Gorham, and Zehnderto (34). BG-11 medium is extensively used for culturing fresh water green algae and cyanobacteria (14) , with special consideration when culturing unicellular strain (34). Bold’s Basal Medium (BBM) is derived from a modified version of Bristol’s solution (33). This medium lacks vitamins and certain nutrients are present in high concentrations. BBM has been used as base for development of several modified medium such as: 3N-BBM, BBM enriched with three times nitrate (35), and 3N-BBM+V, 3 fold nitrate with vitamins added (36). The major characteristic of BBM over the two other medium is that, BBM is suitable for cultivation of a wide range of algae (14). However this media is unsuitable for algae with vitamin requirements, then the modified version should be chosen.
These entire three medium: Bristol, BG-11, and BBM are minimal defined media, where Bristol media lacks in carbon-containing compounds (33), BG-11 has low phosphate content with poor buffering characteristics (34) and BBM is limited in nitrogen (14). The N:P ratio in BG-11, according to Grobbelaar (14) is 45:1 indicating a P limitation, which is consistent with previous report by Stanier et al. (34).
In this study, one fundamental goal was to screen convenient microalgae from a vast range of fresh water microalgae collection. Therefore 3N-BBM+V media was chosen for maintaining the cultures.
2.5.3. Growth rate Microbial growth in a batch cultivation may be categorized into four phases: lag, log, stationary and death phases. A lag phase corresponds to the time when the cells adapt to the new environment. If they are moved from a similar environment, the culture may lack this phase (17). Once the environment is favorable, cells begins to grow exponentially, followed by a phase, where the biomass increased linearly over time (17).
Specific growth rate (µ), expressed as h-1, is calculated from the exponential phase to obtain the maximal specific growth rate, µmax, using the following equation, assuming biomass concentration at time 0 (initial), X0 and at time t, Xt and t corresponds to the time interval (17).
µ= 𝐿𝑛(𝑋𝑡 /𝑋𝑜)/t

13
2.5.4. Algae growth on waste water The waste water generated in different industries has been found to be potential source of nutrients for supporting algae growth. The concept of utilizing algae for waste water treatment, however flash backs to the early 50’s (37). Because purifying wastewater using microalgae provides the benefits of cost effectiveness, environmental friendliness and algae biomass productivity, microalgae research has retained its attention till date.
Different process waters have been reported to be tested as medium for different microalgae species with various aims: nutrient removal efficiency, high biomass productivity, feed stock for biofuel production (table 1). However, optimal condition for cultivation of microalgae in different waste waters is very species specific and varies significantly based on the quality of waste water and the environmental conditions.
Table 1: reported fresh water microalgae in different waste waters.
Waste water Algae investigated Olive-oil Mill waste water and urban wastewater
Scenedesmus obliquus (38)
Municipal waste water Chlorella sp. (39), Nannochloropsis sp. (40) Poultry liter extract, treated and untreated carpet industry waste water
Chlamydomonas globosa, Chlorella minutissima, Scenedesmus bijuga (41)
carpet industry effluents with municipal sewage
13 native algae starins (42)
Piggery waste water Botryococcus braunii (43) Domestic waste water Chlorella ellipsoidea Yj1 (44) Concentrated municipal waste water
Auxenochlorella protothecoides UMN280 (45)
Wood-based pulp and paper industry waste water
Mixed algae culture dominated with Chlorella sp, and diatom sp. (46)
Influent, effluent and concentrate collected from St. Paul Metro Plant(St. Paul, MN, USA)
Chlamydomonas reinhartii (47)
2.6. Application of algal biomass Microalgae are one of the oldest life forms on earth. Although commercial utilization of algae biomass dates back to fifteenth century, the first use of microalgae as food supplement has a 2000 years old history, when people eat edible algae like Nostoc to survive (48). With growing knowledge regarding algae physiology over the years, commercial use of algae biomass has been utilized over a vast array of areas including feed, food, cosmetics (49), pharmaceuticals (50) etc. Recently, the focus has been narrowed to environmental and fuel industries due to oil
14
crisis and climate concerns. Particularly, feedstock produced from industrial waste water or flue gas should be used for biofuel production, due to safety issues.
Microalgae are potential source for several types of fuel including biodiesel, bioethanol, biogas or hydrogen (51). However, the overall microalgae biomass to fuel system includes: production of biomass followed by processing of the raw biomass to the production of final biofuel. The first phase comprises strategy for cultivation technique to achieve highest biomass with desired end product (31). The later phase comprises chemical processing/ conversion, also known as refining and fermentation (bioprocess).
Microalgae with high starch content is exposed to fermentation for bioethanol production, whereas, high oil accumulation is good for biodiesel production, if the lipid profile fits the criteria. Triglycerides are the major raw material for biodiesel production (51). Fatty acids with C16-18 are subjected to trans- esterification reactions for biodiesel production. Hydrocarbons are another type of lipids found in certain microalgae that can be converted to biodiesel as well (52). Microalgae biomass can be concentrated to produce biogas or separated to yield hydrogen (51).
2.7. Pulp and Paper making process Different pulp and paper mill waste water were collected in this project to investigate them as culture media for microalgae growth. This section provides basic idea regarding the fundamental processing steps involved in pulp and paper manufacturing.
Wood Preparation:
Three types of raw material are commonly used: hard wood (oaks, maples, birches), soft wood (hemlock, pines, cider), and non-wood (straw, bamboo etc.). They are mainly composed of cellulose, hemi-cellulose, and lignin (53). Wood enters the mills as logs and is converted to chips before transported to the pulping process. Basic steps involves: debarking, wood chipping etc. The bark press waste water is generated during this part of the production line (53).
Pulp production:
There are several ways of pulping including mechanical pulping, chemical pulping or combination of both. The most common chemical pulping processes are Kraft pulping and Sulfite Pulping. Kraft pulping involves using alkaline cooking liquor consisting of NaOH and Na2S to digest the wood chips (53). According to Sumathi et al. (53) this cooking liquor is called white liquor and the reaction takes place in the digester. The content are later discharged from digester to the blow tank, where the chips are disintegrated into fibers or ‘’pulp’’. The spent liquor is called ‘black liquor’ and is subsequently separated from the pulp by a series of brown stock washer.
15
Sulfite pulping involves an acidic cooking liquor composed of sulfurous acid (H2SO3) and bisulfate ion (HSO3
-). The acid mixture is prepared by cooling SO2 in water containing one of four chemical bases: Mg, NH3, Na or Ca. This mixture works to degrade the lignin bonds between wood fibers (53). However, the pulp yielded by this process has less color, thus it is easily bleachable but has less strength than Kraft pulp (53).
In mechanical pulping, the fibers are separated from raw materials by physical energy such as grinding and shredding. Lignin is not removed completely thus imparts a dark color to the pulp and paper product (53).
Combination of mechanical and chemical pulping involves partial chemical treatment followed by a mechanical pulping step. Wood chips are partially processed in mild chemical liquor prior to be subjected to the physical treatment (53). However, the composition of the chemical cooking liquor varies in different process. NSSC (Neutral Sulfite Semi-chemical) pulping is an example of semi-chemical pulping process that uses sodium based sulfite cooking liquor (53). CTMP (Chemi Thermo Mechanical Pulping) is another example of a combinatorial pulping process where the chemical treatment consists of NaOH or sodium bisulfite, before or during the steaming of the wood chips. Chemically treated discs are then introduced to the mechanical refiner (53). To avoid economic and environmental impacts, chemical recovery is used to reclaim the spent cooking chemicals in chemical and semi-chemical pulping mills (53).
Bleaching:
Bleaching comprises a series of steps employing chemicals to remove the remaining residual lignin from the pulp providing a whiter/brighter pulp. In simplified words, during bleaching the pulp is sequentially treated with elemental chlorine(C1), alkali (E1), chlorine dioxide (D1) and alkali (E2), or chlorine dioxide (D2) (53). However, due to concerns over emissions of chlorinated organic substances, such as furan and dioxins, pulp and paper mills currently has adopted bleaching process that uses elemental chlorine free (ECF pulp) or total chlorine free (TCP pulp) processes. ECF bleaching uses chlorine dioxide and TCF uses oxygen containing compounds such as molecular oxygen, peroxide, ozone etc (53).
Paper making:
The pulp after pulping and bleaching is ready to use for producing the final product i.e. paper. In an integrated mill, the pulp manufactured on-site is used. In case of a non-integrated mill, the pulp is dried, baled and shipped off to the target paper mill. In general, the pulp is collected from the storage chest, screened, refined (if necessary), and placed in to a head box of paper machine, where the paper is made (54).

16
2.8. Pulp and Paper mill effluents The waste water generated from pulp and paper mills are diverse in quality due to implication of different processing methods. However, the effluent from the earlier stages of the manufacturing is much higher in toxic compounds than the final outflow (53). Especially waste water from pulping and bleaching is rich in toxic pollutants, than the effluent from paper making. The spent liquor from pulping and bleaching process is loaded with a range of chemicals. A number of chemicals found in this liquor have been reported to be toxic to Daphnia and fish populations. Especially hydrogen sulfide, methyl mercaptan, crude sulfate soap and salts of fatty and resin acids (53). The major classes of toxic compounds found in bleaching waste water are resin acids, fatty acids, and AOX (Absorbable organic halides) (53). Chlorinated organic compounds, including dioxins and furans, can affect the exposed organism at the genetic level, and are also carcinogenic for humans. Thus, it’s important to get rid of the AOX load before discharging the water to outer environment. Among commonly detected resin acids, isopimaric acid is the most toxic one (55). In addition to resins, unsaturated fatty acids also employed toxic effects on fish population (55). Tannins (polar phenolic polymeric compounds) are another group of highly reactive compounds found basically in the debarking process in pulp and paper mills. Tannins constitutes up to 50% of COD of this waste water (55). The final discharge from pulping has a distinct color due to the dissolved lignin (9). The effluent from bleaching, on the other hand, has relatively light color, but is rich in toxic chemicals. Spent water from paper making differs from the pulping as the water only comes from the rejects of cleaning, screening and de-inking (54).

17
3. Materials and methods
3.1. Microalgae species and strains In this study nine fresh water microalgae strains were selected based on previous studies done at SP (11), fast specific growth rates and high lipid content reported in the literature (Table 2).
Table 2: List of fresh water microalgae used in this study. Most of the species were collected from the Culture Collection of Algae and Protozoa CCAP (56).
Microalgae selected Strain Chlorella vulgaris CCAP 211/11B Ankistrodesmus falcatus CCAP 202/15A Chlamydomonas reinhardtii CCAP 11/32 CW15+ Botryococcus braunii CCAP 807/1 Chlorella sorokiniana CCAP 211/8K Chlorella protothecoides CCAP 211/54 Scenedesmus obliquus CCAP 276/50 Scenedesmus dimorphus UTEX417 or CCAP 276/48 Dictyosphaerium pulchellum CCAP 222/2A
Since all microalgae species used in the current study were from fresh water habitats all pre-cultures and control cultures were maintained in Bold’s Basal Medium with 3-fold Nitrogen and Vitamins (3N-BBM+V). The full recipe is included in the Appendix A. According to (14) the 3N-BBM+V medium provide broad range for wide variety of fresh water microalgae, which in turn makes this media suitable for the screening. Prior to the start of the experiment, the algae strains were pre-cultured and stored in 250 ml glass bottles containing 100 ml culture media (3N-BBM+V). The pre-cultures were kept in the laboratory with a night/day cycle of 20/4 hours. The caps were loosely bound on the glass bottles to allow gas exchange and the bottles were shaken manually every working day.
3.2. Collecting waters from Swedish pulp and paper mills With the target to investigate pulp and paper mill waste water as cheap means of cultivating fresh water microalgae, nine different process waters were collected from five Pulp and Paper mill companies located in Sweden (Table 3). The waters were taken from different processing steps at the mill and therefore were different in color, nutrient levels, pH etc. (Table 4).
18
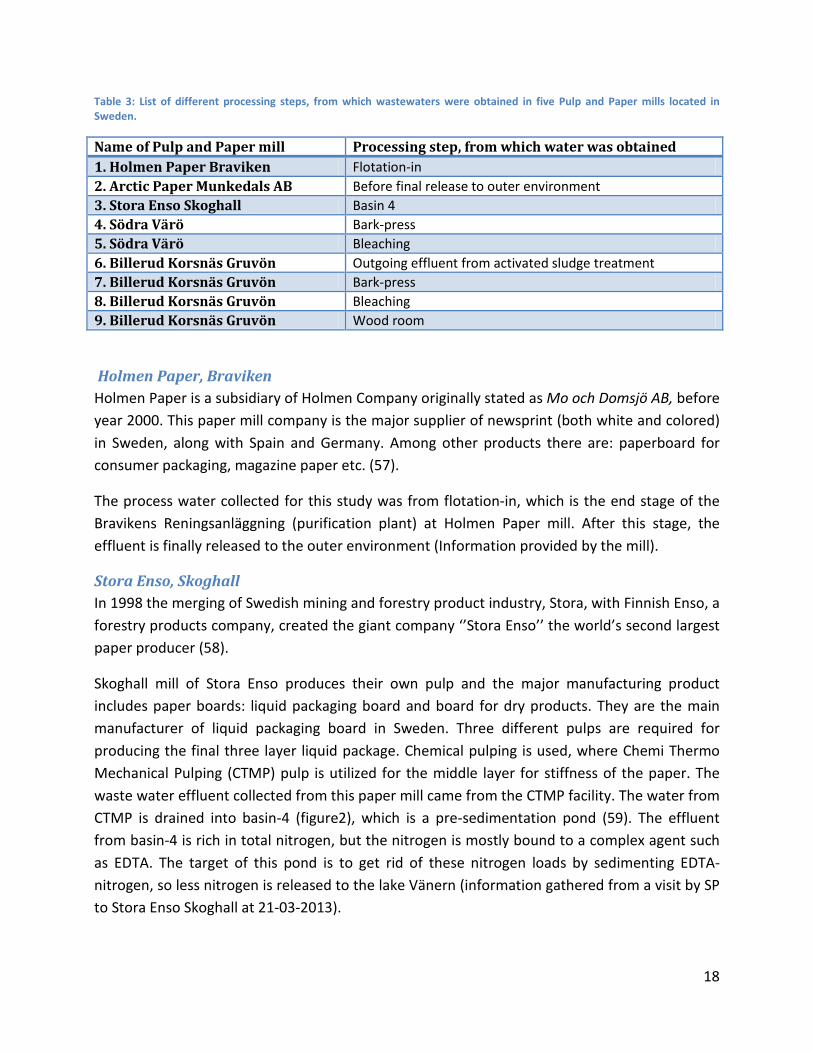
Table 3: List of different processing steps, from which wastewaters were obtained in five Pulp and Paper mills located in Sweden.
Name of Pulp and Paper mill Processing step, from which water was obtained 1. Holmen Paper Braviken Flotation-in 2. Arctic Paper Munkedals AB Before final release to outer environment 3. Stora Enso Skoghall Basin 4 4. Södra Värö Bark-press 5. Södra Värö Bleaching 6. Billerud Korsnäs Gruvön Outgoing effluent from activated sludge treatment 7. Billerud Korsnäs Gruvön Bark-press 8. Billerud Korsnäs Gruvön Bleaching 9. Billerud Korsnäs Gruvön Wood room
Holmen Paper, Braviken Holmen Paper is a subsidiary of Holmen Company originally stated as Mo och Domsjö AB, before year 2000. This paper mill company is the major supplier of newsprint (both white and colored) in Sweden, along with Spain and Germany. Among other products there are: paperboard for consumer packaging, magazine paper etc. (57).
The process water collected for this study was from flotation-in, which is the end stage of the Bravikens Reningsanläggning (purification plant) at Holmen Paper mill. After this stage, the effluent is finally released to the outer environment (Information provided by the mill).
Stora Enso, Skoghall In 1998 the merging of Swedish mining and forestry product industry, Stora, with Finnish Enso, a forestry products company, created the giant company ‘’Stora Enso’’ the world’s second largest paper producer (58).
Skoghall mill of Stora Enso produces their own pulp and the major manufacturing product includes paper boards: liquid packaging board and board for dry products. They are the main manufacturer of liquid packaging board in Sweden. Three different pulps are required for producing the final three layer liquid package. Chemical pulping is used, where Chemi Thermo Mechanical Pulping (CTMP) pulp is utilized for the middle layer for stiffness of the paper. The waste water effluent collected from this paper mill came from the CTMP facility. The water from CTMP is drained into basin-4 (figure2), which is a pre-sedimentation pond (59). The effluent from basin-4 is rich in total nitrogen, but the nitrogen is mostly bound to a complex agent such as EDTA. The target of this pond is to get rid of these nitrogen loads by sedimenting EDTA-nitrogen, so less nitrogen is released to the lake Vänern (information gathered from a visit by SP to Stora Enso Skoghall at 21-03-2013).

19
Figure 2: Effluent treatment plant in Stora Enso Skoghall Mill, the water used in this study was collected from the basin 4 (figure taken from (59).
Billerud Korsnäs, Gruvön Billerud Group is one of Europe’s largest manufacturers of packaging paper. From 2001, Billerud AB comprises paper mills located in Skärblacka, Karlsborg and Gruvön, Sweden. A number of different types of paper are produced by Billerud pulp and paper mills, such as brown paper bags, liquid packaging cardboard, fluting paper etc. However their specialized area also includes different wrapping paper, particularly, the one used to wrap disposable items and surgical instruments in health care system (60).
Waste waters for this study were collected from the Gruvön mill. Four waste waters were collected, of which three effluents were taken from different points of the pulping line that produce bleached paper. Gruvön mill uses NSSC (Neutral Sulfite Semi-chemical) pulp for their paper production. In 2006, Billerud Gruvön built the multi-biological treatment plant for their waste water treatment, which comprises five stages: Bio 1, Bio 2, Bio 3, AS 1 and AS 2 (Bio stands for biological and AS stands for activated sludge).One waste water for this study was collected from the outflow of the AS 2 stage in multi biological treatment (figure 3). Nitrogen content found in this water is mostly nitrate. However, because the retention time is small in this treatment plant, it is highly sensitive to disturbances. Hence, it is often difficult to maintain low nitrogen and phosphorus level at the final effluent released to the lake. The difference is sometimes quite high, e.g. 10 mg/l. As this is the final water released to the lake Vänern, it is of

20
course interesting to investigate whether or not microalgae can be used in an additional cleaning step to purify the water even more before releasing it (information gathered during a visit by SP to Gruvön mill at 21-03-2013).
Arctic Paper, Munkedals AB, Munkedal Arctic paper S. A. is one of the leading suppliers of book paper and graphic paper in Europe. The process water collected for this study was from one of their production facilities located in Sweden, Arctic Paper Munkedals AB and is a nonintegrated mill. Pulp is purchased from external supplier and the manufacturing involves only paper making.
The purification plant comprises of six stages: first the buffer tower, followed by a tank of bio-beds containing solid plastic materials. In this stage, biofilm of bacteria are formed, which works to break down the pollutants. Third, water passes through the tower with floating solid materials and biofilm attached to the surface. Added air ensures the circulation of the materials and the survival of the bacteria enclosed in the biofilms. The treated water then proceeds to the sedimentation tanks, from which the settled solid particles are transferred to the centrifuge, to get more thickened and the treated water proceeds to the ultra filtration tank. The collected water for the current project was taken from the final stage after ultra-filtration, just before discharging into Munkedal River (61).
Södra, Värö Södra Cell is a pulping mill and lacks manufacturing of paper. It is one of the leading market pulp producers around the world. Södra manufacture different types of pulp generally categorized as textile pulp and paper pulp. The waste water collected from Södra for this study is from the
Figure 3: Aeration tank in Billerud Gruvön Mill.
21
paper pulping facility. Bark-press effluent is generated in the very early stage of pulping, the barks after debarking, are pressed into pellets. The effluent is collected from this stage. Another effluent was collected from the bleaching step. This processing step enables removal of unwanted by-products, thereby whitening the pulp (62).
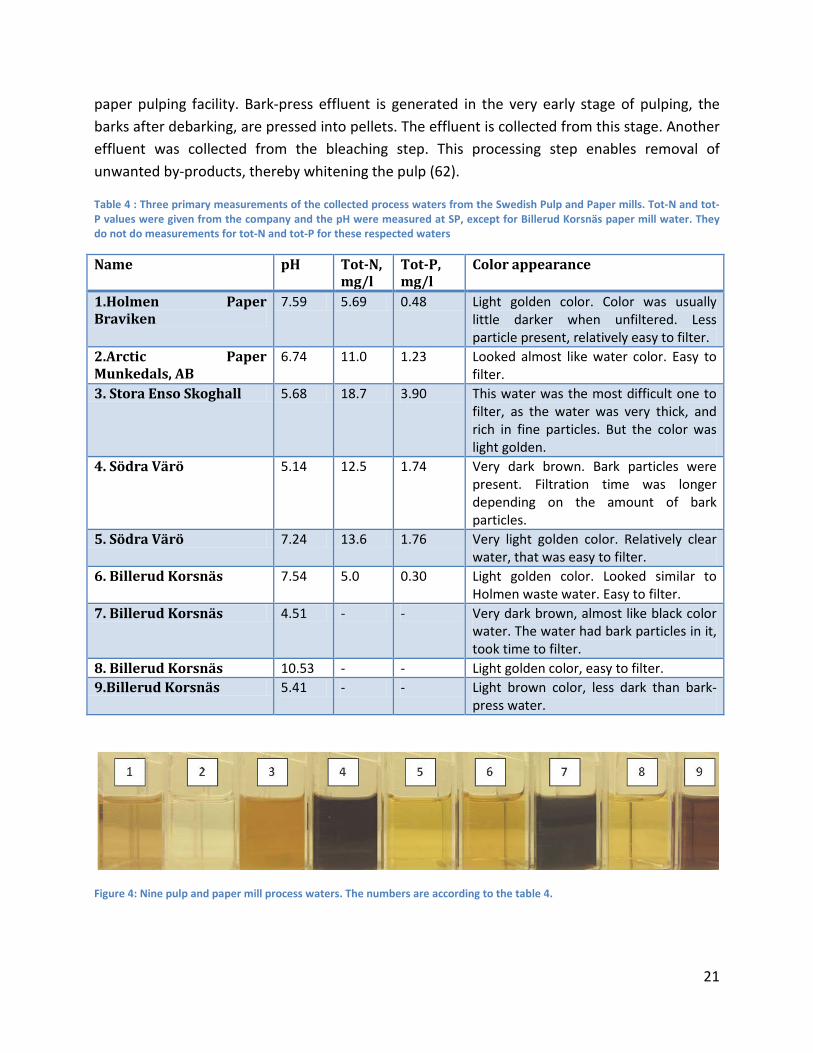
Table 4 : Three primary measurements of the collected process waters from the Swedish Pulp and Paper mills. Tot-N and tot-P values were given from the company and the pH were measured at SP, except for Billerud Korsnäs paper mill water. They do not do measurements for tot-N and tot-P for these respected waters
Name pH Tot-N, mg/l
Tot-P, mg/l
Color appearance
1.Holmen Paper Braviken
7.59 5.69 0.48 Light golden color. Color was usually little darker when unfiltered. Less particle present, relatively easy to filter.
2.Arctic Paper Munkedals, AB
6.74 11.0 1.23 Looked almost like water color. Easy to filter.
3. Stora Enso Skoghall 5.68 18.7 3.90 This water was the most difficult one to filter, as the water was very thick, and rich in fine particles. But the color was light golden.
4. Södra Värö 5.14 12.5 1.74 Very dark brown. Bark particles were present. Filtration time was longer depending on the amount of bark particles.
5. Södra Värö 7.24 13.6 1.76 Very light golden color. Relatively clear water, that was easy to filter.
6. Billerud Korsnäs 7.54 5.0 0.30 Light golden color. Looked similar to Holmen waste water. Easy to filter.
7. Billerud Korsnäs 4.51 - - Very dark brown, almost like black color water. The water had bark particles in it, took time to filter.
8. Billerud Korsnäs 10.53 - - Light golden color, easy to filter. 9.Billerud Korsnäs 5.41 - - Light brown color, less dark than bark-
press water.
Figure 4: Nine pulp and paper mill process waters. The numbers are according to the table 4.
22
3.3. Culture condition Two types of screenings were done in this study, one prescreening in tissue culture flasks examined by visual observations and three scaled-up screenings in E-flasks, with strains based on the results of the previous mentioned prescreening, where growth was followed by OD750.
For both the prescreening and the scaled-up experiments, the cultures had been maintained at similar conditions. 18W fluorescence lamps were used as a source of light and the light and dark cycle was 20/4 hours. During the prescreening in culture tissue flasks, the cultures were placed under these lamps and during the scaled-up screenings in E-flasks the lamps were directed from both sides of the cultures to ensure better light exposure. The cultures were kept at room temperature and the initial pH was always within the range from 6.5 - 7.5 approximately.
3.4. Prescreening In this study, during prescreening the investigation included nine fresh water microalgae and nine pulp and paper mill process waters. High cell growth of the fresh water microalgae in the testing process waters was the desired characteristics. The growth was followed by simply examining the growth visually where the green color indicated how the algae grew. The aim of this small screening was to select three species and waters to scale-up.
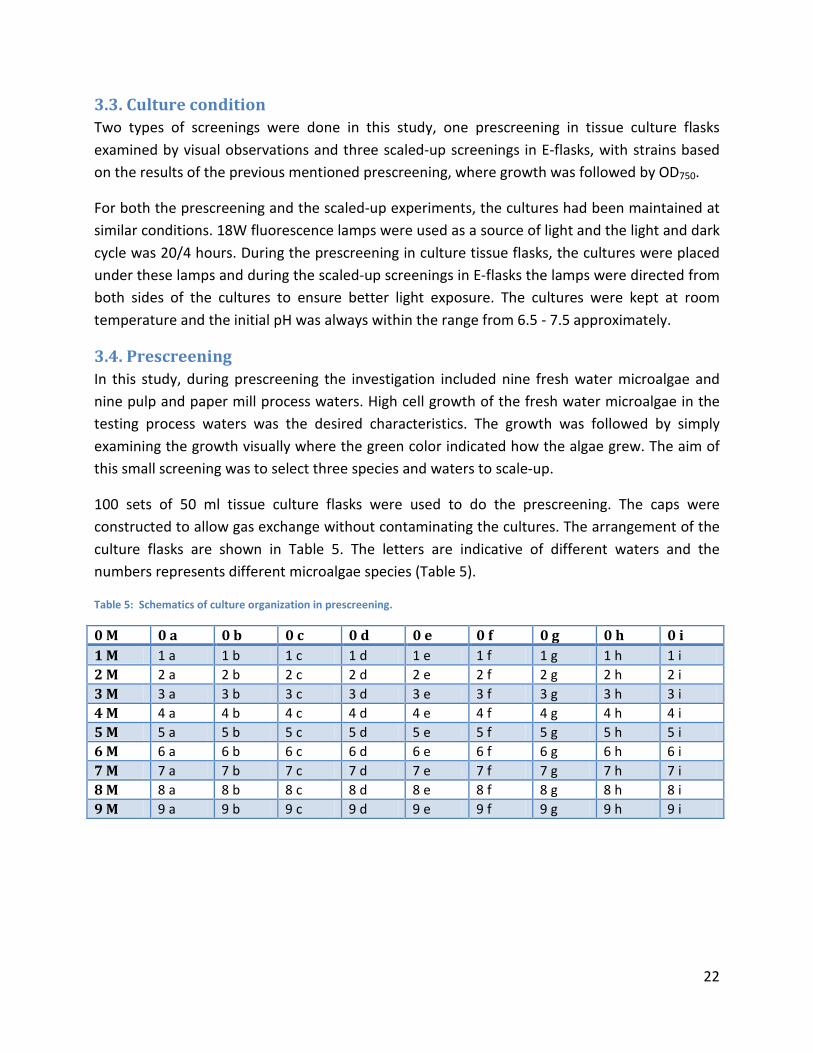
100 sets of 50 ml tissue culture flasks were used to do the prescreening. The caps were constructed to allow gas exchange without contaminating the cultures. The arrangement of the culture flasks are shown in Table 5. The letters are indicative of different waters and the numbers represents different microalgae species (Table 5).
Table 5: Schematics of culture organization in prescreening.
0 M 0 a 0 b 0 c 0 d 0 e 0 f 0 g 0 h 0 i 1 M 1 a 1 b 1 c 1 d 1 e 1 f 1 g 1 h 1 i 2 M 2 a 2 b 2 c 2 d 2 e 2 f 2 g 2 h 2 i 3 M 3 a 3 b 3 c 3 d 3 e 3 f 3 g 3 h 3 i 4 M 4 a 4 b 4 c 4 d 4 e 4 f 4 g 4 h 4 i 5 M 5 a 5 b 5 c 5 d 5 e 5 f 5 g 5 h 5 i 6 M 6 a 6 b 6 c 6 d 6 e 6 f 6 g 6 h 6 i 7 M 7 a 7 b 7 c 7 d 7 e 7 f 7 g 7 h 7 i 8 M 8 a 8 b 8 c 8 d 8 e 8 f 8 g 8 h 8 i 9 M 9 a 9 b 9 c 9 d 9 e 9 f 9 g 9 h 9 i

23
0= No species a = Holmen Paper 1= Chlorella vulgaris b = Arctic Paper Munkedals,AB 2= Ankistrodesmus falcatus c = Stora Enso Skoghall 3= Botryococcus braunii d = Södra Värö-Barkpress 4= Chlamydomonas reinhardtii e = Södra Värö-Bleaching 5= Chlorella sorokiniana f = Billerud Korsnäs Gruvön 6= Chlorella protothecoides g = Billerud Korsnäs-Barkpress 7= Scenedesmus obliquus h = Billerud Korsnäs-Bleaching 8= Scenedesmus dimorphus i = Billerud Korsnäs- wood room
9= Dictyosphaerium pulchellum M=3N-BBM+V medium
The prescreening was conducted for 15 days. Before starting, both the microalgae species and the industrial waste waters (WWs) were prepared for the test. The waters were filtered with 0.6µm filter paper and the pH was measured. Process waters with pH higher or lower than 7.0 were adjusted to pH around 7.0 (Table4). For the algae species, inoculum size was decided based on OD750 measurements taken for each microalga pre-culture. Simultaneously, different amount of Botryococcus braunii (50, 100, 150µl and so on) was added to the waste water with least color to estimate the inoculation size, and 250µl was chosen for B. braunii. From this visual observation and the OD750 measurements, the remaining inoculum sizes were calculated for each of the waste waters, including a control with 3N-BBM+V medium (calculation included in the Appendix B). To prepare for inoculation, 1ml of each algae culture was centrifuged at 5000 rpm for 5 min using Hettich Universal 1200 Centrifuge machine. The supernatants were discarded, followed by a re-suspension of pellet with the corresponding water. Finally, the calculated amount of each species was transferred to the corresponding tissue culture flasks with 30 ml of the respective media.
3.5. Equipment setup for scaling-up to E-flasks A cultivation system with twelve batches (E-flasks, 250 mL) was constructed by Bark (11) and (63) originally developed to screen several cultures of microalgae simultaneously with a coupled gas distribution system mimicking Valadi et.al. 2001 (64). A schematic diagram of the culture system is shown in Figure 5.
24
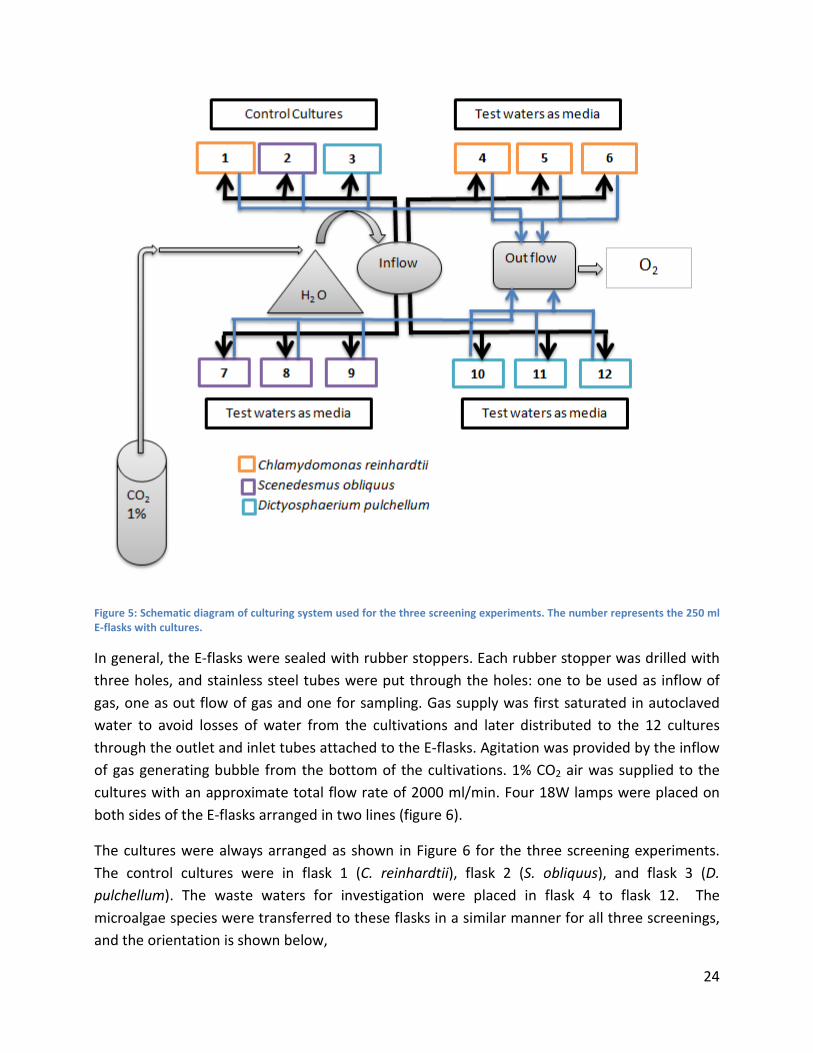
Figure 5: Schematic diagram of culturing system used for the three screening experiments. The number represents the 250 ml E-flasks with cultures.
In general, the E-flasks were sealed with rubber stoppers. Each rubber stopper was drilled with three holes, and stainless steel tubes were put through the holes: one to be used as inflow of gas, one as out flow of gas and one for sampling. Gas supply was first saturated in autoclaved water to avoid losses of water from the cultivations and later distributed to the 12 cultures through the outlet and inlet tubes attached to the E-flasks. Agitation was provided by the inflow of gas generating bubble from the bottom of the cultivations. 1% CO2 air was supplied to the cultures with an approximate total flow rate of 2000 ml/min. Four 18W lamps were placed on both sides of the E-flasks arranged in two lines (figure 6).
The cultures were always arranged as shown in Figure 6 for the three screening experiments. The control cultures were in flask 1 (C. reinhardtii), flask 2 (S. obliquus), and flask 3 (D. pulchellum). The waste waters for investigation were placed in flask 4 to flask 12. The microalgae species were transferred to these flasks in a similar manner for all three screenings, and the orientation is shown below,
25
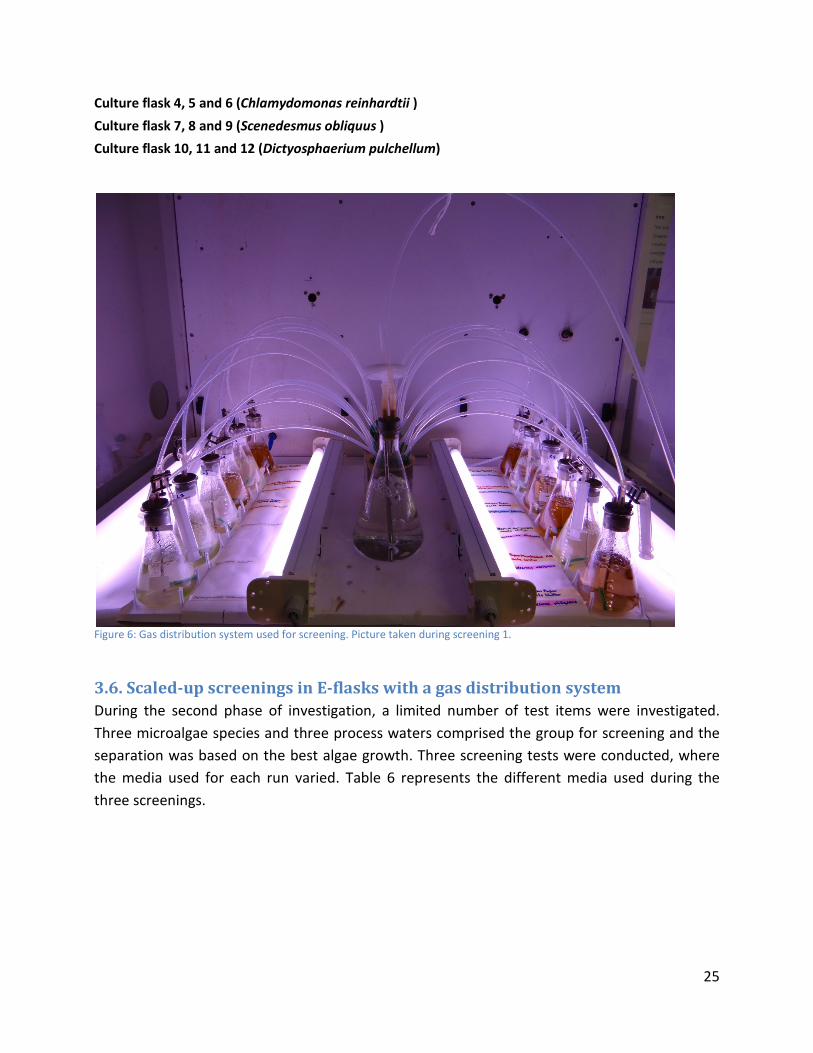
Culture flask 4, 5 and 6 (Chlamydomonas reinhardtii ) Culture flask 7, 8 and 9 (Scenedesmus obliquus ) Culture flask 10, 11 and 12 (Dictyosphaerium pulchellum)
Figure 6: Gas distribution system used for screening. Picture taken during screening 1.
3.6. Scaled-up screenings in E-flasks with a gas distribution system During the second phase of investigation, a limited number of test items were investigated. Three microalgae species and three process waters comprised the group for screening and the separation was based on the best algae growth. Three screening tests were conducted, where the media used for each run varied. Table 6 represents the different media used during the three screenings.

26
Table 6: Different control and test waters used during three screening experiments.
Screening Control Waste water for testing Screening 1 3N-BBM+V Holmen Paper, Arctic Paper Munkedals,AB and
Billerud Gruvön waste water Screening 2 100% Municipal waste water
(MWW) Holmen+20% MWW, Arctic +20% MWW, Billerud Gruvön+ 20% MWW
Screening 3 Holmen Paper Waste water with no added nutrients (negative control)
Holmen paper water + Nitrate and Phosphate
3.6.1. Screening 1 - Algae growth in pulp and paper mill waste waters For this screening, the waste waters were filtered with 0.2µm filter paper to minimize the number of other microorganisms coming from the test water. Control media was the nutrient rich 3N-BBM+V prepared according to the recipe (Appendix A). The cell concentration for the pre-cultures of Chlamydomonas reinhardtii, Scenedesmus obliquus and Dictyosphaerium pulchellum were measured by taking OD750 values. These values were used to calculate the inoculation size for the test cultures. The 12 cultures were arranged as shown in the schematic diagram (figure 5). Growth was followed daily by OD750 measurements and the pH was controlled on a daily basis. The screening was run for 15 days.
3.6.2. Screening 2 – Algae growth in pulp and paper mill waste waters modified with municipal waste water During the second screening, the tested waters from pulp and paper mills were modified. Assuming that, the limiting factor for algae growth in the first screening was nutrient concentration, municipal waste water was decided to be added to the pulp and paper mill waters. Municipal waste water is relatively rich in nutrients. This water was provided by Ingrid Appelberg, performing another master thesis project at SP (65).
In this screening, undiluted municipal waste water was used as control (100%), and for the test waters only 20% of Municipal water was mixed with the paper mill effluents before cultivation began. All the process waters were filtered prior to the screening. The pore size for filtering and the inoculum size were similar as Screening 1. Growth was followed daily by OD750 measurements and the pH was controlled on a daily basis. The screening was run for 12 days.
3.6.3. Screening 3 – Algae growth in Holmen Paper waste water supplemented with Nitrate and Phosphate One pulp and paper mill process water was selected for Screening 3. All the waters were filtered with 0.2µm filter paper, before the test began. The control water was the pure pulp and paper mill effluent. For the test waters, three inorganic compounds: NaNO3, K2HPO4 ·3 H2O and KH2PO4 were incorporated into Holmen Paper waste water, according to the 3N-BBM+V recipe.
27
The adjustment was done to increase the nutrient levels even more and to achieve high biomass production and also to investigate if the growth was only a function of nutrient levels. The way of calculating the inoculation size for the microalgae species was same as for the first screening. Growth was followed daily by OD750 measurements. The final dry weight was measured and the biomass concentration in g/l was calculated. The pH was controlled throughout the cultivation. The screening continued for 15 days.
3.5. Analytical methods The growth of the microalgae was monitored and followed by taking optical density (OD) and a final dry weight measurement.
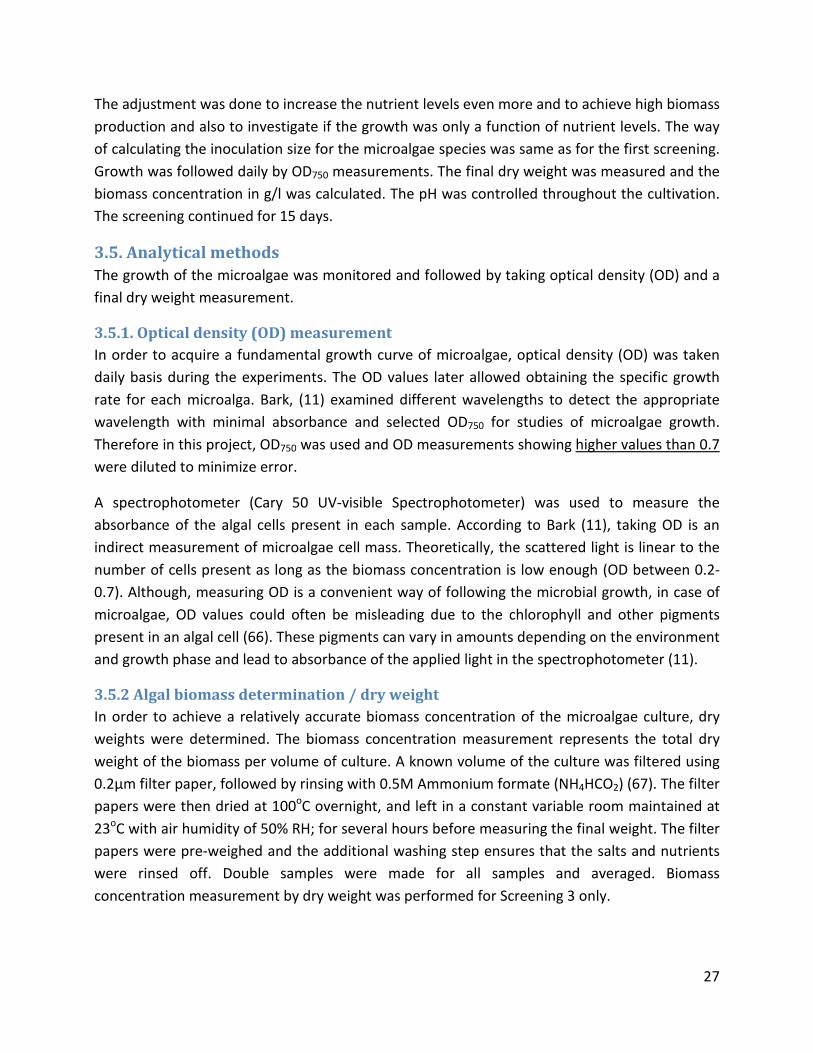
3.5.1. Optical density (OD) measurement In order to acquire a fundamental growth curve of microalgae, optical density (OD) was taken daily basis during the experiments. The OD values later allowed obtaining the specific growth rate for each microalga. Bark, (11) examined different wavelengths to detect the appropriate wavelength with minimal absorbance and selected OD750 for studies of microalgae growth. Therefore in this project, OD750 was used and OD measurements showing higher values than 0.7 were diluted to minimize error.
A spectrophotometer (Cary 50 UV-visible Spectrophotometer) was used to measure the absorbance of the algal cells present in each sample. According to Bark (11), taking OD is an indirect measurement of microalgae cell mass. Theoretically, the scattered light is linear to the number of cells present as long as the biomass concentration is low enough (OD between 0.2-0.7). Although, measuring OD is a convenient way of following the microbial growth, in case of microalgae, OD values could often be misleading due to the chlorophyll and other pigments present in an algal cell (66). These pigments can vary in amounts depending on the environment and growth phase and lead to absorbance of the applied light in the spectrophotometer (11).
3.5.2 Algal biomass determination / dry weight In order to achieve a relatively accurate biomass concentration of the microalgae culture, dry weights were determined. The biomass concentration measurement represents the total dry weight of the biomass per volume of culture. A known volume of the culture was filtered using 0.2µm filter paper, followed by rinsing with 0.5M Ammonium formate (NH4HCO2) (67). The filter papers were then dried at 100oC overnight, and left in a constant variable room maintained at 23oC with air humidity of 50% RH; for several hours before measuring the final weight. The filter papers were pre-weighed and the additional washing step ensures that the salts and nutrients were rinsed off. Double samples were made for all samples and averaged. Biomass concentration measurement by dry weight was performed for Screening 3 only.

28
3.5.3 Measurement of pH In order monitor the influence of pH on the cultures, the pH of each culture was measured regularly using a pH meter (Symphony SP80PD).
3.5.4. Phosphorous and nitrogen analysis Analysis was performed for only one screening experiment. The selected process water and the water with added nutrients were analyzed for five measurements: tot-N, tot-P, NH4-N, NO3-N and PO4-P at AK-lab in Borås. Then to follow the nutrient removal efficiency of the respected microalgal species, all 12 cultures were prepared for N and P analysis. The culture was first centrifuged at 5000 rpm for 10 minutes followed by filtering with 0.2µm filter paper and send to AK-lab for analysis.

29
4. Results
4.1. Prescreening For prescreening, the result was made basically from visual observations. Color and turbidity of the cultures were the main indicators. Pictures were taken daily to follow the cultures, where turbidity was an indication of low cell concentration. Dense cultures were recognized by the color intensity, varying from light to darker green. Often microscopic examinations were done to check if the cultures were contaminated or not. Therefore the decision for selecting waste water and microalgae species were mainly based on visual impression and rough estimation of the algal cell concentration.
4.1.1. Selection of waste water From the inspection, it was absolutely clear that only three waste waters, Holmen Paper (a), Arctic Paper Munkedals AB water (b) and Billerud-Gruvön waste water (f), were suitable for microalgae growth. The cultures with other waters had no color development or turbidity visible by naked eyes (Figure 7). These three waters that could support algal growth were selected for further studies.
Figure 5 Pictures from the last day of prescreening (day 15), comparing all the waste waters with nine algae species. The black line box indicates the selected waters (a, b, and f).The number 0-10 represents the microalgae species. Where 0 indicates no microalgae. 1=C. vulgaris, 2=A. falcatus, 3= B. braunii, 4= C. reinhardtii, 5= C. sorokiniana, 7= S. obliquus, 8= S. dimorphus and 9= D. pulchellum.

30
4.1.2. Selection of microalgae species All nine microalgae species showed growth, which was visible as color development in the cultures. No OD750 measurements were taken during prescreening, because it was not feasible due to the firm attachment of the cells to the culture flasks. Under microscope, the two Scenedesmus species had clear morphological changes by the end of prescreening. Usually Scenedesmus sp. are found as colony of 4 or 6 cells. Each cell is long in diagonal and pointy near the edges. In the end of prescreening, due to the impact of waste water, the cells became relatively larger and roundish than their normal size and shape. No indigenous microorganisms were visible in three cultures with S. obliquus, S. dimorphus and. D. pulchellum. The remaining microalgae species were interfered with some indigenous microorganism growth. Ankistrodesmus falcatus, was contaminated with another round microorganism from the beginning and the culture was not over taken by A. falcatus.
Three of them were chosen for the screening experiments: Chlamydomonas reinhardtii, Scenedesmus obliquus, and Dictyosphaerium pulchellum (figure8). Although C. reinhardtii was contaminated in the prescreening this species was selected because this species is extensively studied as model microalgae and is the only microalgae with full genome sequenced (68). Other two selected species showed relatively good growth in prescreening.
4.2. Batch Cultivation in a gas distribution system Three screenings were conducted where the cultures were scaled up to 250 ml E-flasks. Different media were used in these screenings (table 6). Five parameters were measured for these waste waters (analysis done at Ak lab, Borås) and the data are shown in table 7.
Figure 6 Selected microalgae species in prescreening

31
Table 7: Initial nutrient content in the waste waters used in three screenings .
Media Tot-N (mg/l)
Tot-P (mg/l)
NO3-N (mg/l)
PO4-P (mg/l)
NH4-N (mg/l)
Holmen Paper 4.5 0.17 3.74 0.14 0.012 Arctic Paper Munkedals,AB 3.4 0.025 <0.03 0.012 0.007 Billerud Gruvön 2.2 0.13 0.240 0.12 0.45 Municipal waste water* 4.1 0.46 <0.03 0.33 2.9 Holmen with NO3-N,PO4-P$ 120 53 122 53 0.012 3N-BBM+V 124 50 124 50 - * Data provided by Bäckhammar for municipal waste water, was quite different from the analysis by Ak lab. According to Bäckhammar, the measurements were: tot-N 21.1 mg/l, tot-P 2.4 mg/l, NH4-N 18.3 mg/l, NO3-N 0.29 mg/l.
$ This water had a little lower value for tot-N, than NO3-N. This is because of the measurement error, as the sample had very low nitrogen. Therefore according to AK lab, the actual value might be in between 120-124 mg/l.
4.2.1. Screening 1 with pulp and paper mill waste waters In 3N-BBM+V medium (Control cultures), Chlamydomonas reinhardtii, Scenedesmus obliquus and Dictyosphaerium pulchellum reached the highest OD750: 1.2, 7.1 and 7.4, respectively (figure 9, 14). In Holmen Paper waste water, the highest OD750 at 0.6 was found for D. pulchellum, whereas both Arctic Paper waste water and Billerud Gruvön waste water gave maximum OD750 below 0.3 (figures 10, 11, 12).
Figure 7: Growth curves for three microalgae species in the control water (3N-BBM+V), during screening 1.
012345678
0 50 100 150 200 250 300 350
OD 7
50
Time(h)
3N-BBM+V C.reinhardtiiS. obliquus D. pulchellum
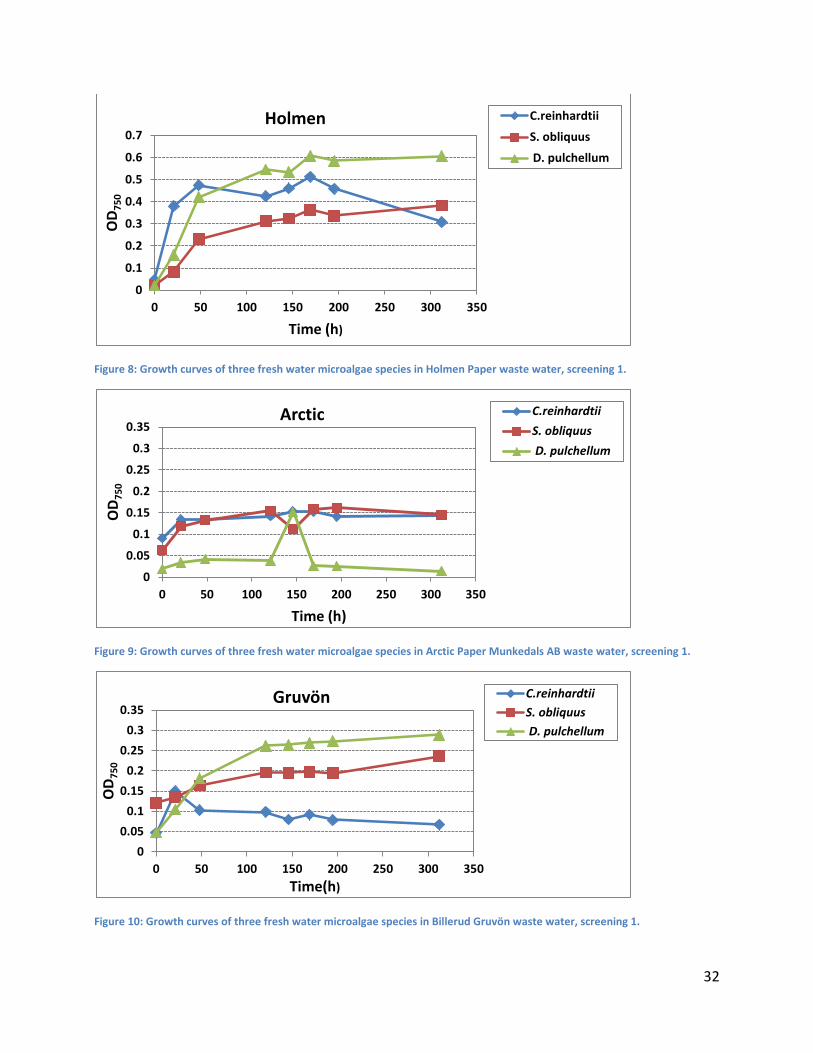
32
Figure 8: Growth curves of three fresh water microalgae species in Holmen Paper waste water, screening 1.
Figure 9: Growth curves of three fresh water microalgae species in Arctic Paper Munkedals AB waste water, screening 1.
Figure 10: Growth curves of three fresh water microalgae species in Billerud Gruvön waste water, screening 1.
0
0.1
0.2
0.3
0.4
0.5
0.6
0.7
0 50 100 150 200 250 300 350
OD 7
50
Time (h)
Holmen C.reinhardtii
S. obliquus
D. pulchellum
0
0.05
0.1
0.15
0.2
0.25
0.3
0.35
0 50 100 150 200 250 300 350
OD 7
50
Time (h)
Arctic C.reinhardtiiS. obliquus D. pulchellum
00.05
0.10.15
0.20.25
0.30.35
0 50 100 150 200 250 300 350
OD 7
50
Time(h)
Gruvön C.reinhardtiiS. obliquus D. pulchellum

33
No contamination was encountered during this screening experiment, confirmed by microscopic inspection. In both control and test waters, the D. pulchellum cells were smaller in size and found as colonies. After day 5, C. reinhardtii in control medium began to settle and the cells were always found as cluster of colonies under the microscope. S. obliquus in control medium were present as colonies of 4 or 6 cells where cells are pointy near the two edges of the cells and 4 or 6 cells are attached as one colony( usual morphology). By the end of screening the cells were found relatively larger compared to usual and the cells were relatively round in the corners.
The microalgae species growing in control (3N-BBM+V) media were also shown to have higher specific growth rates, compared to growing the species in waste waters. However, the specific growth rate of different species varied based on the process water. For C. reinhardtii, the highest growth rate was found in Billerud Gruvön water and for both S. obliquus and D. pulchellum; the rate was highest in Holmen Paper waste water (Table 8).
Table 8: Specific growth rate calculations for 12 cultures during screening test 1 . Doubling time is regarded as (ln2/µ).
Culture Specific growth rate µ(h-1)
Doubling time (h)
1. C. reinhardtii, 3N-BBM+V 0.043 16.1
2. C. reinhardtii, Holmen 0.100 06.9 3. C. reinhardtii, Arctic 0.018 38.5 4. C. reinhardtii, Gruvön 0.055 12.6 5. S. obliquus, 3N-BBM+V 0.053 13.1
6. S. obliquus, Holmen 0.049 14.1 7. S. obliquus, Arctic 0.030 23.1 8. S. obliquus, Gruvön 0.006 115.5 9. D. pulchellum, 3N-BBM+V 0.067 10.3
10. D. pulchellum, Holmen 0.061 11.4 11. D. pulchellum, Arctic 0.027 25.7 12. D. pulchellum, Gruvön 0.027 25.7
There was no significant fluctuation in the pH, throughout the cultivation period, except that the control cultures had relatively lower pH (around 6.0) at start, compared to the cultures with waste water. However, the pH found in all the cultures showed a trend of gradual increase and reached around 8.5-9.2 at the end of screening (figure 13).
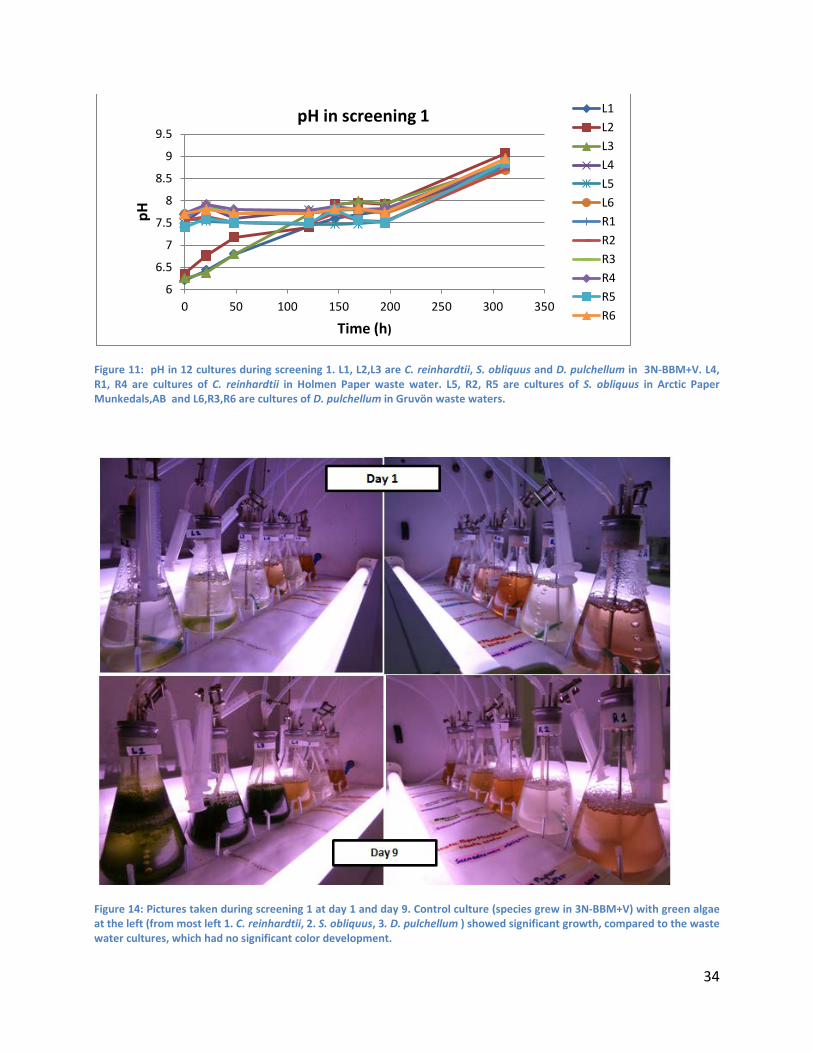
34
Figure 11: pH in 12 cultures during screening 1. L1, L2,L3 are C. reinhardtii, S. obliquus and D. pulchellum in 3N-BBM+V. L4, R1, R4 are cultures of C. reinhardtii in Holmen Paper waste water. L5, R2, R5 are cultures of S. obliquus in Arctic Paper Munkedals,AB and L6,R3,R6 are cultures of D. pulchellum in Gruvön waste waters.
Figure 14: Pictures taken during screening 1 at day 1 and day 9. Control culture (species grew in 3N-BBM+V) with green algae at the left (from most left 1. C. reinhardtii, 2. S. obliquus, 3. D. pulchellum ) showed significant growth, compared to the waste water cultures, which had no significant color development.
6
6.5
7
7.5
8
8.5
9
9.5
0 50 100 150 200 250 300 350
pH
Time (h)
pH in screening 1 L1L2L3L4L5L6R1R2R3R4R5R6

35
4.2.2. Screening 2 with the pulp and paper mill waste waters, modified with municipal waste water In screening 2, the microalgae species in 100% municipal waste water (the control, MMW) showed rapid increase in cell concentration until day 5 (figure15). At this point, D. pulchellum reached OD750 2.93, which is the highest among all the cultures in screening 2. However, there was a sudden drop in cell concentration for D. pulchellum, and the culture turned white. Considering this incidence as an indication for nutrient deficiency, on day 5, additional 20% of municipal waste water was added to all the cultures (indicated by arrow in the figures).
After this addition, the remaining two microalgae: C. reinhardtii and S. obliquus in 100% municipal waste water continued growing until last day of the experiment, whereas D. pulchellum failed to recover (Figure15). In Holmen Paper waste water, microalgal growth was enhanced by the addition of municipal waste water. The OD750 for D. pulchellum in Holmen Paper waste water was nearly as high as for D. pulchellum in the control medium (figure16). For the remaining two waste waters, no significant algal growth was detected (figure 17, 18).
Figure 15: Growth curves for three microalgae species in 100% municipal waste water in screening 2.
0
0.5
1
1.5
2
2.5
3
0 50 100 150 200 250 300
OD 7
50
Time (h)
100% Municipal water
C. reinhardtiiS. obliquusD. pulchellum

36
‘
Figure 16: Growth curves of three fresh water microalgae species in Holmen Paper water with 20% municipal waste water.
Figure 17: Growth curves of three fresh water microalgae species in Arctic water with 20% municipal waste water.
Figure 18: Growth curves of three fresh water microalgae species in Billerud Gruvon water with 20% municipal waste water.
0
0.5
1
1.5
2
2.5
3
0 50 100 150 200 250 300
OD 7
50
Time (h)
Holmen + 20% Municipal water
C. reinhardtiiS. obliquusD. pulchellum
0
0.5
1
1.5
2
2.5
3
0 50 100 150 200 250 300
OD 7
50
Time (h)
Arctic+20% Municipal water C. reinhardtii
S. obliquus
D. pulchellum
0
0.5
1
1.5
2
2.5
3
0 50 100 150 200 250 300
OD 7
50
Time(h)
Gruvon+20% Municipal water C. reinhardtiiS. obliquusD. pulchellum

37
The specific growth rates for the three microalgae species in 100% municipal waste water (the control) were slightly higher than the rates found in the other tested waters, except for D. pulchellum. This species in Holmen water with 20% MWW had almost similar specific growth rate as found in the control cultivation (Table 9).
Table 9: Specific growth rate values for 12 cultures during screening 2.
Culture Specific growth rate, µ(h-1)
Doubling time (h)
1. C. reinhardtii, 100% MWW 0.055 12.60 2. C. reinhardtii, Holmen+20% MWW 0.033 21.00 3. C. reinhardtii, Arctic+20% MWW 0.026 26.65 4. C. reinhardtii, Gruvön+20% MWW 0.033 21.00 5. S. obliquus, 100% MWW 0.040 17.32 6. S. obliquus, Holmen+20% MWW 0.036 19.25 7. S. obliquus, Arctic+20% MWW 0.023 30.13 8. S. obliquus, Gruvön+20% MWW 0.023 30.13 9. D. pulchellum, 100% MWW 0.066 10.50 10. D. pulchellum, Holmen+20% MWW 0.059 11.74 11. D. pulchellum, Arctic+20% MWW 0.035 19.80 12. D. pulchellum, Gruvön+20% MWW 0.052 13.32
When starting the cultivations of screening 2, there was no added CO2 only air was supplied. As a result, at this point a significant higher starting pH was found (around 9.0) for all cultures (figure19). Once CO2 was added to the culturing system, the pH declined to around 7.0, showed in figure 19. Later no critical change in the pH was found throughout the screening experiment.

38
Figure 19:12 pH in 12 cultures during screening 2. L1, L2, L3 are C. reinhardtii, S. obliquus and D. pulchellum in 100% municipal waste waters. L4, R1, R4 are cultures of C. reinhardtii in Holmen + 20% MWW. L5, R2, R5 are cultures of S. obliquus in Arctic + 20% MWW and L6, R3,R6 are cultures of D. pulchellum in Gruvön +20% MWW.
4.2.3. Screening 3 with Holmen Paper waste water supplemented with nitrate and phosphate As Holmen Paper waste water supported the best growth of microalgae in both screening 1 and screening 2, therefore, this water was selected for screening 3. To better understand the effect of waste water on microalgae growth, extra nutrients was instead added as nitrate and phosphate salts.
In continuation with the previous screenings, D. pulchellum was the best microalgae with highest amount of biomass formed, followed by S. obliquus, which was found to be contaminated with another microorganism. The order of cell concentration (OD750 value) was D. pulchellum> S. obliquus > C. reinhardtii, (figure 20), also reflected in the final biomass (g/l) 1.36 >1.09 >0.97, respectively. This was also consistent with the percent removal of nitrate-N and phosphorus-P; 81 % > 73 % > 65 % and 94% >93% >92%, respectively, with the same order of good performance for the species: D. pulchellum> S. obliquus > C. reinhardtii (Table 10 and 11).
From microscopic examination at last day of screening, C. reinhardtii cells in control water were found mostly as clusters of 4-5 and 5-8 cells. However there was also some fiber like structure seen, which were also visible by naked eye as white lining floating in the culture. Whereas, the cells were in big clusters, almost no single cell were seen under microscope, in all three cultures with nutrient rich waste water. For S. obliquus, both in control and test cultures, the cells were found as consortium with another green round microorganism. Only the differences were found in the morphology and cell number. In control the cells were few in number and S. obliquus was mostly found as pairs of 4 and the cells were pointy near the edges. In test waters the cells
7
7.5
8
8.5
9
9.5
10
0 50 100 150 200 250 300
pH
Time(h)
pH in screening 2 L1
L2
L3
L4
L5
L6
R1
R2
R3
R4
R5
R6

39
became relatively larger and roundish than pointy. The other microorganism was found as small clusters rather than single cells inhabitant with S. obliquus. For D. pulchellum, the cells were found as round and single cells in the control. In three triplicate cultures of test water, they were found as small round cells, most in dividing phase (dividing to 3-4 cells). Some single cells were also seen often.
Figure 20: Three microalgae species in Holmen waste water with nutrient supplement during screening 3.
As anticipated, the negative controls without additions of extra nutrients had lower amounts of biomass formed compared to the test waters and by the end of screening both nitrate-N and phosphorus-P were mostly removed (Table 10 and 11).
Table 10: Final biomass concentration at 350 h from start and specific growth rate for the three microalgae species in screening 3. Standard deviations are included as ± values for cultures growing in nutrient rich Holmen WW. No triplicate of cultures were made for the controls thus, no standard deviations are added (marked as *).
Microalgae sp. Culture medium Final biomass, (g/l)
Specific growth rate, µ(h-1)
C. reinhardtii Holmen(Control)* 0.15 0.03 C. reinhardtii Holmen +nitrate and phosphate 0.97 ± 0.05 0.03 ± 0.00
S. obliquus Holmen WW (Control)* 0.39 0.04 S. obliquus Holmen +nitrate and phosphate 1.08 ±0.27 0.04 ±0.01 D. pulchellum Holmen WW(Control)* 0.42 0.06 D. pulchellum Holmen +nitrate and phosphate 1.36 ±0.04 0.03 ±0.00
00.5
11.5
22.5
33.5
0 50 100 150 200 250 300 350
OD 7
50
Time(h)
Holmen with nitrate and phosphate
C. reinhardtii
S.obliquus
D. pulchellum

40
Table 11: The percent reduction of NO3-N and PO4-P for three test microalgae species cultured in Holmen waste water (WW) and Holmen Paper WW supplemented with nitrate and phosphate. Standard deviations are included as ± values for cultures growing in nutrient rich Holmen WW. No triplicate of cultures were made for the controls thus, no standard deviations are added (marked as *).
Culture Medium NO3-N (% Reduction)
PO4-P(% Reduction)
C. reinhardtii Holmen(Control)* 93.18 90.71 C. reinhardtii, Holmen +nitrate and phosphate 65.30± 06.43 92.89± 01.57 S. obliquus Holmen WW (Control)* 99.19 95.71 S. obliquus Holmen +nitrate and phosphate 73.41± 13.74 93.27± 01.47 D. pulchellum Holmen WW(Control)* 99.19 94.28 D. pulchellum, Holmen +nitrate and phosphate 81.22± 04.33 94.40± 02.71
Little fluctuation in pH was perceived during screening 3. In some cultures the pH were elevated (became around 9.00) due to default in the gas distribution system followed by no CO2 supply and zero agitation. Once the fault was fixed, the pH was resumed to its original range, which was approximately 7.5- 8.5 (figure 20).
Figure21: The pH in 12 cultures during screening 3. C1, CL2, CL3 are C. reinhardtii, S. obliquus and D. pulchellum in Holmen Paper waste waters. S 1.1, S1.2 S1.3 is triplicates of C. reinhardtii in Holmen waste water with nutrients. S2.1, S2.2, S2.3 are triplicates of S. obliquus in Holmen waste water with nutrients and S3.1, S3.2 S3.3 are triplicates of D. pulchellum in Holmen with nutrient supplement.
7
7.5
8
8.5
9
9.5
10
0 50 100 150 200 250 300 350
pH
Time (h)
pH in screening 3
C1
C2
C3
S1.1
S1.2
S1.3
S2.1
S2.2
S2.3

41
5. Discussion
5.1. Fresh water microalgae species selection for the scale up From the prescreening, three fresh water microalgae species were chosen for the screening investigation using gas distribution system.
D. pulchellum were selected because this strain was occasionally found in an open pond cultivation system in Umeå, Sweden1, using waste water and directed to produce algal biomass. In addition, several reports have indicated that D. pulchellum has a broad range of tolerance to a variety of conditions, including pH, temperature, color, turbidity, CO2 availability, and light intensity (68). Especially, this species has a wide range of pH tolerance, between 2.4 to 10.7 and even between pH 3.3 to 8.5 optimum growth could occur (69). Frequent encounter of this species with high growth in lakes with extreme conditions has been reported, which made it quite interesting to investigate this species to be used for biomass production. There was also no literature found reporting using D. pulchellum for biofuels production, or in waste water treatment, which made it even more interesting for further research.
Of the two Scenedesmus species, S. obliquus was selected particularly because it had shown good growth in cultivation with flue gas from Swedish pulp and paper mills (11). This species has also a wide range of tolerance in temperature, ranging between 15 to 40oC, with an optimal growth temperature around 30o C (25). In another report it was found that, the highest specific growth rate is possible to reach by culturing S. obliquus at pH 7.0 (38). Therefore this microalga was interesting to select for further screening, as it would enable an opportunity in the future to couple waste water with flue gas from pulp and paper mills.
Recently genetic and metabolic alterations to enhance the economy of microalgae derived biodiesel production has been considered as an way of improving algae biofuel production (4). In this aspect, C. reinhardtii seemed a potential candidate since the full genetic information of this species is available (70) and this microalga has been studied extensively at the molecular level regarding its cellular behavior/regulatory system under different nutrient conditions (71) (72) . This species has also been reported to give a high biomass production at 2.0 g/l/day with a lipid content of around 25 %, while growing in waste water (73). Therefore, this species was found interesting for further investigation.
Moreover, these three species has quite distinctive morphological features, which were considered as an additional benefit, as it made easy to detect the specific algae cells by microscopic examination. This was important, as contamination was a common scenario in the prescreening experiments.
1 Information found from Francesco Gentili (Assistant researcher, SLU Swedish University of Agricultural Sciences) via personal communication.

42
5.2. Impact of Waste water quality Waste water collected from the Stora Enso Skoghall mill was spent liquor from the CTMP pulping process. Therefore this water is likely to be toxic to microalgae as it is heavily loaded with chemicals from the pulping treatment. Another fact is, despite the light color, this water was very thick due to fine particles, which was not possible to remove completely by filtering. As mentioned earlier, this water was also loaded with nitrogen mostly bound to EDTA (ethylene diamine tetraacetic acid). However, Eklund et al. (74) reported that EDTA works as a growth stimulator, while culturing algae in pulp and paper mill waste water, as it enables the availability of essential metals for algae growth. Therefore the negative result for microalgae growth in this water is either due to the thick water, impairing light penetration or due to presence of other toxic compounds, but not for EDTA.
In this study, there were two waste waters collected from bleaching step and no microalgae growth was visible in these waters. This is because bleaching spent liquor is rich in toxic compounds like resin acids, which are incorporated to the waste water generally during the pulping process. These compounds come from the washing of unbleached pulps of the bleaching step (53).According to Ali et al. (55) , algae species such as Microcystis sp., Chlorella sp., and Chlamydomonas sp., were found to be used to decolorize and reduce AOX( Absorbable Organic Halides) load from diluted bleach Kraft mill effluents, however in this study, no color removal or color development due to algae growth were visible in the bleaching effluent.
During prescreening, there were two waste waters from debarking process steps, which showed no microalgae growth. The cause of the absent growth might be tannins, which are present in these waters and absorb a significant amount of light and heat and less oxygen can be retain compared to other waste waters (55).
Positive microalgae growth was found only in three waste waters, which were collected from different waste water treatment plants. This fact indicates that the toxic compounds were already removed from the water. However, these waters had relatively low nitrogen and phosphate amount as they were ready to be discharged to the outer environment (shown in table 3 and 4).
Therefore, to know whether or not the waters can be used as growth medium, even if the nutrient levels are high, more thorough water analyses are needed to know the water composition. The biomass quality can vary a lot and the use of the final product, e.g. the oil, depends on how the quality is. If the algae accumulates for example heavy metals the water is clean, but the product is more or less not useful. If diluting with municipal wastewater is a way to increase the nutrient levels, there might also be an addition of toxins, medicines and other unwanted components following. Other ways of increasing the nutrient levels therefore need to

43
be investigated, maybe have a dialogue with the mills to map their wastes and see where other nitrogen and phosphorous sources can be found close to the power plant.
5.3. Growth characteristics of the microalgae in the process waters Initially during the prescreening (first five days), the visual observations indicated that the microalgae had slow growth in the nutrient rich 3N-BBM+V media compared to the waste waters. This was probably because the nutrient rich medium primarily inhibits the cell growth at start and prolongs the lag phase (73). However, no lag phase was detected during screening experiments which was reflected in the specific growth rates, indicating that the microalgae species were well adapted in the scaled up cultivation with the waste waters.
5.4. Effect of nutrient concentration Nutrient concentration was a great influencing factor in the scaled up experiment. The microalgae growth was significantly improved by the addition of nutrients in the form of municipal waste water (screening 2) or with direct addition of nitrate and phosphate (screening 3). Addition of nitrate and phosphate salts according to 3N-BBM+V greatly enhanced the microalgae growth in Holmen waste water, but were not enough to reach the cell concentration as found in only 3N-BBM+V culture in screening 1( figure 9 and 20). This is because besides nitrogen and phosphate, microalgae growth also requires additional vitamins, minerals and sulfur in order to reach their full biomass production capacity. The impact of these trace elements can be easily dignified, while comparing figur9 and 20. There were significant difference in cell concentration between the control cultures in screening 1 ( highest OO750 around 7.0), and the cultures with supplemented Holmen water in screening 3 ( highest OD750 around 3.5). Although compared to nitrate and phosphate, only a small amount of trace elements and vitamins are needed, however the cell reached only half of its potential in absence of these components in screening 3 (figure 9 and 20). Therefore, it was conclusive that, nutrient concentration is one of the major limiting factors in microalgae growth in waste waters, after selecting the right water with no toxins and less color.
Although microalgae prefer ammonium as sole nitrogen source (14), no significant difference in microalgae growth was found while culturing microalgae in ammonium rich media (screening 2) or nitrate rich media (screening 3). This was also evident by the rapid growth of D. pulchellum found in screening 2., where after only five days of cultivation, the culture of D. pulchellum in control turned white( figure15) ,an incident also reported by An et al. (43) . According this report, nitrogen depletion in the medium induces a stress response where chlorophyll contents are masked by carotenoide pigments and the cells begins to accumulate lipid and carbohydrate as a result of defense mechanism.
However, in context of this study, using ammonium rich medium could be a disadvantage. As the final idea of this project is to couple real industrial flue gas as the carbon source, a problem

44
for the algae is that the pH in the culture medium decrease as the gas components is dissolved. When ammonium (NH4
+) is used as nitrogen source the cells release H+ to keep the electrical neutrality and the pH decreases in the culture medium. Vice versa occurs as nitrate (NO3
-) is used as the nitrogen source and the culture medium increases (26). Moreover ammonium influences phosphorus uptake (26) and can be lost in the form of ammonia in the atmosphere at high temperature and at high pH (37). The range of pH at which the loss of ammonium is avoided is between 6.8 and 8.1 (43). Therefore it could be better to add nutrients in the form of nitrate to be able to dissolve more of the flue gas in the culture as the flue gas probably will be driven by a pH-control.
5.5. Effect of pH on the culture medium The starting pH for all cultures was always maintained in between 6.0-7.0. There was no drastic pH change during the three screening experiments. In first screening, the initial pH (around 6.0) gradually raised to around 8.0, because algae growth cause elevation of pH which is usually reduced up on dissolving CO2 (14). This was also evident in screening 2. The first pH was found around 9.0, because no CO2 was present, thus only microalgae growth occurred resulting in increased pH. In screening 3, certain cultures (figure 21) had temporary bubbling problem, which was overcome by tapping the culture flask the day after, showed slightly higher pH. This was because at that point CO2 was not available to those cultures, thus algae growth increased the pH. Other than that, no significant fluctuation was encountered.
Overall, it was conclusive that 1% CO2 with 2000 ml/ min flow rate had no critical effect on the pH level of the twelve cultures during the screenings.

45
6. Conclusion
It was conclusive that, Holmen, Arctic and Billerud Gruvön waste waters were able to support growth of fresh water microalgae species (microalgae chosen for this study). However the potential was limited to some extent. Nutrient concentration was found to be the major limiting factors, therefore addition of nitrogen, phosphorus and trace elements are highly required in order to achieve the highest biomass production. Not all pulp and paper mill effluents were suitable for microalgae growth. Particularly, spent liquor from debarking, pulping, and bleaching waters did not support growth at all due to dark color and presence of toxins. It was also certain that, 1% CO2 added at 2000 ml/min flow rate do not affect the pH balance of the cultures.
Among the nine microalgae species, during scale up, D. pulchellum had the best growth followed by S. obliquus and C. reinhardtii. S. obliquus had cell concentration almost close to D. pulchellum and this species had been successfully cultured in Swedish pulp and paper mill flue gas (11), therefore S. obliquus might be a potential candidate if the aim is to couple microalgae cultivation in waste water with flue gas. Another additional advantage over D. pulchellum is S. obliquus can settle relatively better when biomass is high. This is a good characteristic, as it reduces expense during harvest. On the other hand, D. pulchellum was found very interesting to grow in waste water and had showed a promising cell growth in Swedish pulp and paper mill waste water. Further investigation is essential while using this microalga, because there is no literature found where it has been used for biofuel production. Thus the quality of the biomass from D. pulchellum is unknown. Effect of addition flue gas from Swedish pulp and paper mill is also needed to be tested.
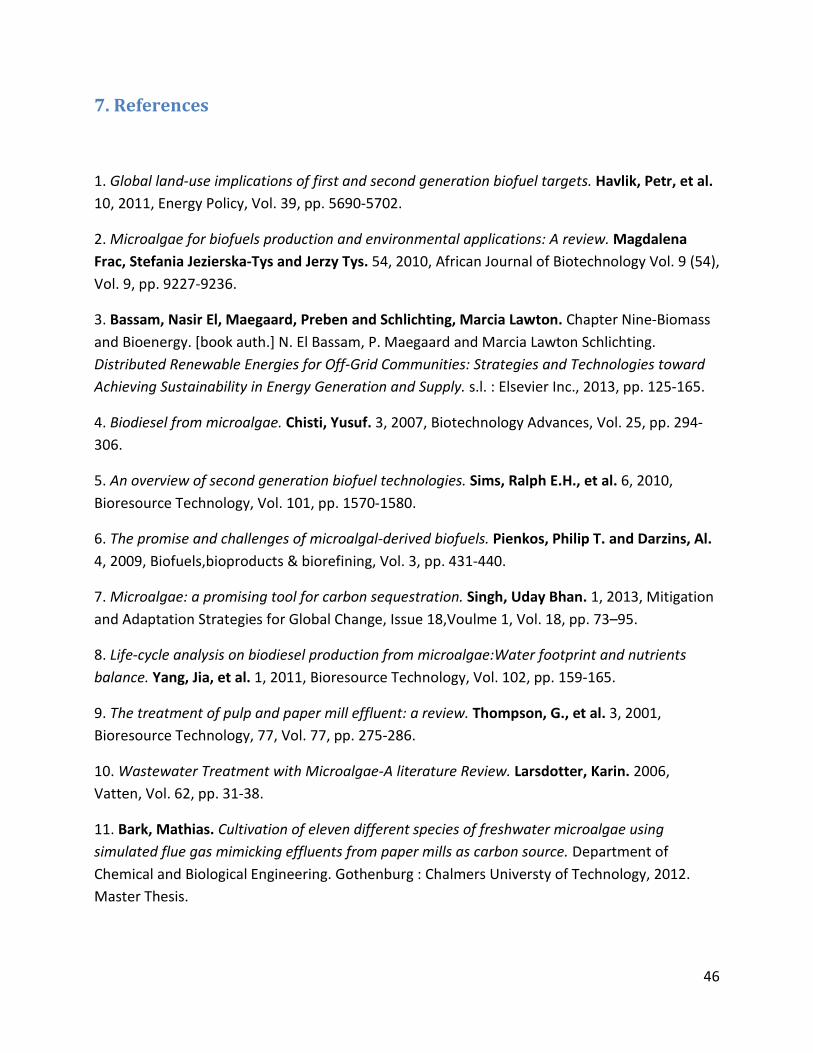
46
7. References
1. Global land-use implications of first and second generation biofuel targets. Havlik, Petr, et al. 10, 2011, Energy Policy, Vol. 39, pp. 5690-5702.
2. Microalgae for biofuels production and environmental applications: A review. Magdalena Frac, Stefania Jezierska-Tys and Jerzy Tys. 54, 2010, African Journal of Biotechnology Vol. 9 (54), Vol. 9, pp. 9227-9236.
3. Bassam, Nasir El, Maegaard, Preben and Schlichting, Marcia Lawton. Chapter Nine-Biomass and Bioenergy. [book auth.] N. El Bassam, P. Maegaard and Marcia Lawton Schlichting. Distributed Renewable Energies for Off-Grid Communities: Strategies and Technologies toward Achieving Sustainability in Energy Generation and Supply. s.l. : Elsevier Inc., 2013, pp. 125-165.
4. Biodiesel from microalgae. Chisti, Yusuf. 3, 2007, Biotechnology Advances, Vol. 25, pp. 294-306.
5. An overview of second generation biofuel technologies. Sims, Ralph E.H., et al. 6, 2010, Bioresource Technology, Vol. 101, pp. 1570-1580.
6. The promise and challenges of microalgal-derived biofuels. Pienkos, Philip T. and Darzins, Al. 4, 2009, Biofuels,bioproducts & biorefining, Vol. 3, pp. 431-440.
7. Microalgae: a promising tool for carbon sequestration. Singh, Uday Bhan. 1, 2013, Mitigation and Adaptation Strategies for Global Change, Issue 18,Voulme 1, Vol. 18, pp. 73–95.
8. Life-cycle analysis on biodiesel production from microalgae:Water footprint and nutrients balance. Yang, Jia, et al. 1, 2011, Bioresource Technology, Vol. 102, pp. 159-165.
9. The treatment of pulp and paper mill effluent: a review. Thompson, G., et al. 3, 2001, Bioresource Technology, 77, Vol. 77, pp. 275-286.
10. Wastewater Treatment with Microalgae-A literature Review. Larsdotter, Karin. 2006, Vatten, Vol. 62, pp. 31-38.
11. Bark, Mathias. Cultivation of eleven different species of freshwater microalgae using simulated flue gas mimicking effluents from paper mills as carbon source. Department of Chemical and Biological Engineering. Gothenburg : Chalmers Universty of Technology, 2012. Master Thesis.
47
12. Barsanti, Laura and Gualtieri, Paolo. Algae: Anatomy, Biochemistry and Biotechnology. s.l. : CRC Press,Taylor & Francis Group, 2006.
13. Tomaselli, Luisa. The Microalgal Cell. [book auth.] Amos Richmond. Hand Book of Microalgal Culture: Biotechnology and Applied Phycology. s.l. : Blackwell Science Ltd., 2004, pp. 3-19.
14. Grobbelaar, Johan U. Algal Nutrition: Mineral Nutrition. [book auth.] Amos Richmod. Hand Book Of Microalgal Culture: Biotechnology and Applied Phycology. s.l. : Blackwell Science Ltd., 2005, pp. 97-115.
15. Lee, Yuang-Kun. Heterotrophic Carbon Nutrition. [book auth.] Amos Richmond. Hand Book Of Microalgal Culture:Biotechnology and Applied Phycology. s.l. : Blackwell Science Ltd., 2004, pp. 116-124.
16. Effect of light intensity on algal biomass accumulation and biodiesel production for mixotrophic strains Chlorella kessleri and Chlorella protothecoide cultivated in highly concentrated municipal wastewater. Li, Yecong, et al. 9, 2012, Biotechnology and Bioengineering, Vol. 109, pp. 2222-2229.
17. Lee, Yuan-Kun and Shen, Hui. Basic Culturing Techniques. [book auth.] Amos Richmond. Hand Book of Microalgal Culture: Biotechnology and Applied Phycology. s.l. : Blackwell Science Ltd., 2004, pp. 40-56.
18. Masojidek, Jiri, Koblizek, Michal and Torzillo, Giuseppe. Photosynthesis in Microalgae. [book auth.] Amos Richmond. Hand Book of Microalgal Culture: Biotechnology and Applied Phycology. s.l. : Blackwell Science Ltd, 2004, pp. 20-39.
19. Chlamydomonas reinhartii in the landscape of pigments. Grossman, Arthur R, Lohr, Martin and Im, Chung Soon. 2004, Annual review of Genetics, Vol. 38, pp. 119-173.
20. Hu, Qiang. Environmental Effects on Cell Composition. [book auth.] Amos Richmond. Hand Book Of Microalagl Culture: Biotechnology and Applied Phycology. s.l. : Blackwell Science Ltd., 2004, pp. 83-93.
21. Li, Yuanjun. Inexpensive culturing of freshwater algae in a simulated warm environment using chicken manure medium. Department of Chemical and Biological Engineering, Chalmers University of Technology. Gothenburg : s.n., 2011. Master Thesis.
22. Effect of light intensity and nitrogen starvation on CO2 fixation and lipid/carbohydrate production of an indigenous microalga Scenedesmus obliquus CNW-N. Ho, Shin-Hsin, Chen, Chun-Yen and Chang, Jo-Shu. 2012, Bioresource Technology, Vol. 113, pp. 244-252.

48
23. Vonshak, Avigad and Torzillo, Giuseppe. Environmental Stress Physiology. [book auth.] Amos Richmond. Hand Book of Microalgal Culture: Biotechnology and Applied Phycology. s.l. : Blackwell Science Ltd., 2004, pp. 57-82.
24. Effects of phosphorus and temperature on the chlorophyll a contents and cell sizes of Scenedesmus obliquus and Microcystis aeruginosa. Chen, Meijun, et al. 2, 2011, Limnology, Vol. 12, pp. 187-192.
25. Influence of phophorus concentration and temperature on growth and phosphorus uptake by the microalga Scenedesmus obliquus. Martinez, M. E., Jimenez, J. M. and Yousufi, F. El. 3, 1999, Bioresource Technology, Vol. 67, pp. 233-240.
26. Borowitzka, Michael A. Limits to Growth. [book auth.] Yuk-Shan Wong and Nora F.Y. Tam. Wastewater Treatment with Algae. s.l. : Springer, 1998, pp. 203-226.
27. Sulfur economy and cell wall biosynthesis during Sulfur limitation of Chlamydomonas reinhardtii. Takahashi, Hideki, Barby, Caren E. and Grossman, Arthur R. 2, 2001, Plant Physiology, Vol. 127, pp. 665-673.
28. Photobiological production of hydrogen gas as a biofuel. McKinlay, JB and Hardwood, CS. 3, 2010, Current Opinion in Biotechnology, Vol. 21, pp. 244-251.
29. Acetate versus sulfur deprivation role in creating anaerobiosis in light for hydrogen production by Chlamydomonas reinhardtii and Spirulina platensis:Two different organisms anf two different mechanisms. Morsy, Fatthy Mohamed. 1, 2011, Photochemistry and Photobiology, Vol. 87, pp. 137-142.
30. Differential effects of nitrogen and sulfur deprivation on growth and biodiesel feedstock production of Chlamydomonas reihardtii. Cakmak, Turgay, et al. 8, 2012, Biotechnology and Bioengineering, Vol. 109, pp. 1947-1957.
31. Characterstics and potential of micro algal cultivation strategies: a review. Koller, Martin, et al. 2012, Journal of Cleaner Production, Vol. 37, pp. 377-388.
32. Photoautotrophic consumption of phosphorus by Scenedesmus obliquus in a continuous culture. Influence of light intensity. Sancho, M E. Martinez, Castillo, J.M. Jimenez and Yousfi, Farida El. 8, 1999, Process Biochemistry, Vol. 34, pp. 811-818.
33. The morphology of Chlamydomonas chlamydogama sp. Bold, Harold C. 1949, Bulletin of the Torrey Botanical Club, pp. 101-108.

49
34. Purification and properties of unicellular blue-green algae (order Chroococcales). Stanier, R. Y., et al. s.l. : American Scociety for Microbiology, 1971, Bacteriological Reviews, Vol. 35, pp. 171-205.
35. Spectrophotometrically Assayed Inhibitory Effects of Mercuric Compounds on Anabaena Flos-Aquae and Anacystis niduans(Cyanophyceae). Thomas, Dempsey L. and Mantes, Joseph G. 1978, Journal of Phycology, Vol. 14, pp. 494-499.
36. Growth and Differentiation of Axial and Lateral Filaments in Batrachospermum sirodotii (Rhodophyta). Aghajanian, John G. and Hommersand, Max H. 1979, Journal of Phycology, Vol. 16, pp. 15-28.
37. Nitrogen budget in Scenedesmus obliquus cultures with artificial waste water. Nunez, Victor J., et al. 2, 2001, Bioresource Technology, Vol. 78, pp. 161-164.
38. Biomass production of Scenedesmus obliquus from mixtures of urban and olive-oil mill wastewaters used as culture medium. Hodaifa, Gassan, et al. 2013, Applied Energy, Vol. 104, pp. 345-352.
39. Cultivation of green algae Chlorella sp. in different wastewaters from Municipal wastewater treatment plant. Wang, Liang, et al. 4, 2010, Applied Biochemistry and Biotechnology, Vol. 162, pp. 1174-1186.
40. Biomass and lipid production of marine microalgae using municipal wastewater and high concentration of CO2. Jiang, Liling, et al. 10, 2011, Applied Energy, Vol. 88, pp. 3336-3341.
41. Renewable biomass production by mixotrophic algae in the presence of various carbon sources and wastewaters. Bhatnagar, Ashish, et al. 10, 2011, Applied Energy, Vol. 88, pp. 3425-3431.
42. Microalgae cultivation in a wastewater dominated by carpet mill effluents for biofuel applications. Chinnasamy, Senthil, et al. 9, 2010, Bioresource Technology, Vol. 101, pp. 309-3105.
43. Hydrocarbon production from secondarily treated piggery wastewater by the green algaa Botryococcus braunii. An, Jin-Young, et al. 2-3, 2003, Journal of Applied Phycology, Vol. 15, pp. 185-191.
44. Growth and lipid accumulation properties of a freshwater microalgae, Chlorella ellipsoidea Yj1 in domestic secondary effluents. Yang, Jia, et al. 10, 2011, Applied Energy, Vol. 88, pp. 3295-3299.

50
45. Growing wastewater-born microalga Auxenochlorella protothecoides UMN280 on concentrated municipal wastewater for simultaneous nutrient removal and energy feedstock production. Zhou, Wenguang, et al. 2012, Applied Energy, Vol. 98, pp. 433-440.
46. Effectiveness of algae in the treatment of a wood-based pulp and paper industry water. Tarlan, Esra, Dilek, Filiz B. and Yetis, Ulku. 1, 2002, Bioresource Technology, Vol. 84, pp. 1-5.
47. Culture of Microalgae Chlamydomonas reinhardtii in wastewater for biomass feedstock production. Kong, Qing-xue, et al. 1, 2010, Applied Biochemistry and Biotechnology, Vol. 160, pp. 9-18.
48. Review: Commercial Applications of Microalgae. Spolaore, Pauline, et al. 2006, Journal of Bioscience and Bioengineering, Vol. 101, pp. 87-96.
49. Mini Review: Valuable products from biotechnology of microalgae. Pulz, Otto and Gross, Wolfgang. 2004, Applied Microbiology and Biotechnology, Vol. 65, pp. 635-648.
50. Commercial development of microalgal biotechnology: from the test tube to the marketplace. Olaizla, Miguel. 2003, Biomolecular Engineering, Vol. 20, pp. 459-466.
51. Review: Microalgae and terrestrial biomass as source for fuels-A process view. Posten, Clemens and Schaub, Georg. 2009, Journal of Biotechnology, Vol. 142, pp. 64-69.
52. Microalgae for biofuels production and environmental applications: A review. Frac, Magdalena, Jezierska-Tys, Stefania and Tys, Jerzy. 2010, African Journal of Biotechnology, Vol. 9, pp. 9227-9236.
53. Sumathi, Suresh and Hung, Yung-Tse. Treatment of Pulp and Paper Mill Wastes. [book auth.] Lawrence K. Wang, et al. Waste Treatment in the Process Industries. s.l. : CRC Press, 2005.
54. EPA. Available and Emerging Technologies for Reducing Greenhouse Gas Emissions from the Pulp and Paper Manufacturing Industry. North Carolina : Sector Policies and Programs Division,Office of Air Quality Planning and Standards,U.S. Environmental Protection Agency(EPA), October 2010.
55. Aquatic toxicity from pulp and paper mill effluents: a review. Ali, Muna and Sreekrishnan, T. R. 2, 2001, Advances in Environmental Research, Vol. 5, pp. 175-196.
56. CCAP-Culture Collection of Algae and Protozoa. http://www.ccap.ac.uk/. [Online]
57. Holmen. http://en.wikipedia.org/wiki/Holmen_company. [Online] May 31, 2013.
58. Stora Enso. http://en.wikipedia.org/wiki/Stora_Enso. [Online] May 31, 2013.
51
59. Calle Albinsson. Environmental Statement 2011, Skoghall mill. s.l. : Stora Enso, 2011.
60. Environmental report and description of activities 2011. s.l. : Billerud Skärblacka AB, 2011.
61. Göran Lindqvist. Arctic Paper Munkedals,AB Environmental Report 2011. s.l. : Arctic Paper Munkedals,AB, 2011.
62. Södra. http://www.sodra.com/en/pulp/pulp-production/. [Online] May 31, 2013.
63. Engström, Niklas. Cultivation of seven different species of marine microalgae using simulated flugas mimicking effluents from paper mills as carbon source. Department of Chemical and Biological Engineering. Gothenburg : Chalmers University of Technology, 2012. Master Thesis.
64. An improved gas distribution system for anaerobic screening of multiple microbial cultures. Valadi, Hadi, et al. 1, 2001, Journal of Microbiological Methods, Vol. 47, pp. 51-57.
65. Appelberg, Ingrid. Cultivation of freshwater microalgae in wastewater from the Swedish pulp and paper mill Nordic Paper Bäckhammar. Department of Chemical and Biological Engineering. Gothenburg : Chalmers University of Technology, 2013. Master Thesis (unpublished).
66. Interference by pigment in the estimation of microalgal biomass concentration by optical density. Griffiths, Melinda J., et al. 2, 2011, Journal of Microbiological Methods, Vol. 85, pp. 119-123.
67. Determination of biomass dry weight of marine microalgae. Zhu, C. J. and Lee, Y. K. 2, 1997, Journal of Applied Phycology, Vol. 9, pp. 189-194.
68. Effects of pH and predation by Chaborus larvae on the plankton of a shallow and acidic forest lake. Irfanullah, Haseeb Md. and Moss, Brian. 12, 2005, Freshwater Biology, Vol. 50, pp. 1913-1926.
69. Ecology of Dictyosphaerium pulchellum Wood ( Cholorophyta, Chlorococcales) in a shallow, acid, forest lake. Irfanullah, Haseeb Md. and Moss, Brian. 1, 2006, Aquatic Ecology, Vol. 40, pp. 1-12.
70. The Chlamydomonas Database. http://probe.nalusda.gov:8300/cgi-bin/browse/chlamydb. [Online] 2013.
71. Chlororespiration: An adaptation to nitrogen deficiency in Chlamydomonas reinhardtii. Peltier, Gilles and Schmidt, Gregory W. 11, 1991, Proceedings of the National Academy of Sciences of the United States of America, Vol. 88, pp. 4791-4795.

52
72. Acclimiation of Chlamydomonas reinhardtii to different growth irradiance. Bonente, Giulia, et al. 8, 2012, The Journal of Biological Chemistry, Vol. 287, pp. 5833-5847.
73. Culture of microalgae Chlamydomonas reinhardtii in wastewater for biomass feedstock production. Kong, Quing-xue, et al. 1, 2010, Applied Biochemistry and Biotechnology, Vol. 160, pp. 9-18.
74. Use of Ethylenediaminetetraacetic acid in pulp mills and effects on metal mobility and primary production. Eklund, Britta, et al. 2002, Environmental Toxicology and Chemistry, Vol. 21, pp. 1040-1051.

53
Appendix A
3N-BBM+V Composition
3N-BBM+V (Bold’s Basal Medium with 3 fold Nitrogen and vitamins, modified)
Stock solution in g/ 1000ml water For 1 liter final medium 25.0 g NaNO3 30.0 ml 2.5 g CaCl2.2 H2O 10.0 ml 7.5 g MgSO4. 7 H2O 10.0 ml 7.5 g K2HPO4 3 H2O 10.0 ml 17.5 g KH2 PO4 10.0 ml 2.5 g 10.0 ml Trace element solution 6.0 ml Vitamin B1 1.0 ml Vitamin B12 1.0 ml Make up to 1 liter with distilled water, autoclaved, stored in the fridge.

54
Appendix B
Calculation of inoculum for prescreening
Initially, in order to rough estimate the algae needed, B. braunii were added to Arctic Paper waste water (this had the lightest color) and from visual inspection, 250µl of the culture was decided to be used for calculating the other microalgae inoculum size. The calculation were calculated using the following equation, where Vinoculum refers to the volume of inoculation for the desired species, OD750,species refers to respective OD of that species and OD750, B. braunii is the OD750 for B. braunii.
𝑉𝑖𝑛𝑜𝑛𝑢𝑙𝑢𝑚 = 𝜋250µl ∗ OD750,𝐵.𝑏𝑟𝑎𝑢𝑛𝑖i
OD750,spciecies
The Od750 for the nine microalgae and the calculated inoculum size are shown in table .
Table 12: The OD750 for nine microalgae precultures. The inoculum size were calculated based on 250 µl of B. braunii
Microalgae species OD750 Inoculum size (ml) 1. Chlorella vulgaris 1.294 0.258 2. Ankistrodesmus falcatus 1.113 0.301 3. Botryococcus braunii 1.341 0.250 4. Chlamydomonas reinhardtii 1.309 0.256 5. Chlorella sorokiniana 1.321 0.253 6. Chlorella protothecoides 1.126 0.297 7. Scenedesmus obliquus 1.179 1.872 8. Scenedesmus dimorphus 0.141 2.362 9. Dictyosphaerium pulchellum 0.182 1.834
Calculation for inoculum for screenings
During three screenings, the OD750 for the pre-cultures of C. reinhardtii, S. obliquus and D. pulchellum were measured just before starting the experiment. Then based on the cell concentration indicated by OD750, the desired OD750 in the culture is decided. Then using the following equation inoculum size for each species was calculated.
𝐶1 ∗ 𝑉1 = 𝐶2 ∗ 𝑉2
Where, C1 is the OD750 that is found for the species, V1 is the desired volume( inoculum) and C2 is the concentration of cell that is desired and V2 is the final volume (where the culture would be inoculated).

55
Appendix C
Calculation of specific growth rate
Calculations of specific growth rates (µ) were calculated from the growth curve plotted with OD750 in logarithmic scale against time. The linear phase was estimated to create a linear regression. The µ value was correspondent to the slope of the linear regression.
y = 0.043x - 3.2945 R² = 0.9992
-4
-3
-2
-1
0
1
0 50 100 150
ln O
D 750
Time(h)
L1
y = 0.0494x - 3.7436 R² = 0.9752
-5
-4
-3
-2
-1
0
0 50 100 150ln
OD 7
50
Time(h)
R1
y = 0.0533x - 2.631
R² = 0.9781
-4
-2
0
2
4
0 50 100 150
ln O
D 750
Time(h)
L2
y = 0.0307x - 2.771 R² = 1
-3-2.5
-2-1.5
-1-0.5
0
0 50 100 150
ln O
D 750
Time(h)
R2
y = 0.0677x - 3.9347 R² = 1
-6-4-2024
0 50 100 150
ln O
D 750
Time(h)
L3
y = 0.0063x - 2.1203
R² = 0.9908
-2.5-2
-1.5-1
-0.50
0 50 100 150
ln O
D 750
Time(h)
R3

56
Figure 2213: Linear regression fit to the exponential phase of the growth curve found in screening 1. LI, L2, L3 represents µ for C. reinhardtii, S. obliquus and D. pulchellum in 3N-BBM+V. L4, R1,R4 represents µ for C. reinhardtii, S. obliquus and D. pulchellum in Holmen Paper waste water, L5,R2, R5 represents µ for C. reinhardtii, S. obliquus and D. pulchellum in Arctic Paper waste water and L6,R3, R6 represents C. reinhardtii, S. obliquus and D. pulchellum in Billerud Gruvön waste water.
y = 0.1002x - 3.0712 R² = 1
-4
-3
-2
-1
0
0 50 100 150
ln O
D 750
Time(h)
L4
y = 0.0616x - 3.611
R² = 0.9276
-5
-4
-3
-2
-1
0
0 50 100 150
ln O
D 750
Time(h)
R4
y = 0.0188x - 2.4013 R² = 1
-3
-2.5
-2
-1.5
-1
-0.5
0
0 50 100 150
ln O
D 750
Time(h)
L5
y = 0.0272x - 3.9494 R² = 1
-5
-4
-3
-2
-1
0
0 50 100 150
ln O
D 750
Time(h)
R5
y = 0.0557x - 3.0712 R² = 1
-3.5-3
-2.5-2
-1.5-1
-0.50
0 50 100 150
ln O
D 750
Time(h)
L6
y = 0.0276x - 2.971
R² = 0.9704
-4
-3
-2
-1
0
0 50 100 150
ln O
D 750
Time(h)
R6
y = 0.0552x - 3.0735
R² = 0.9954
-4-3-2-1012
0 50 100
ln O
D 750
Hours
L1
y = 0.0368x - 3.1111 R² = 1
-4
-3
-2
-1
0
1
0 50 100
ln O
D 750
Hours
R1
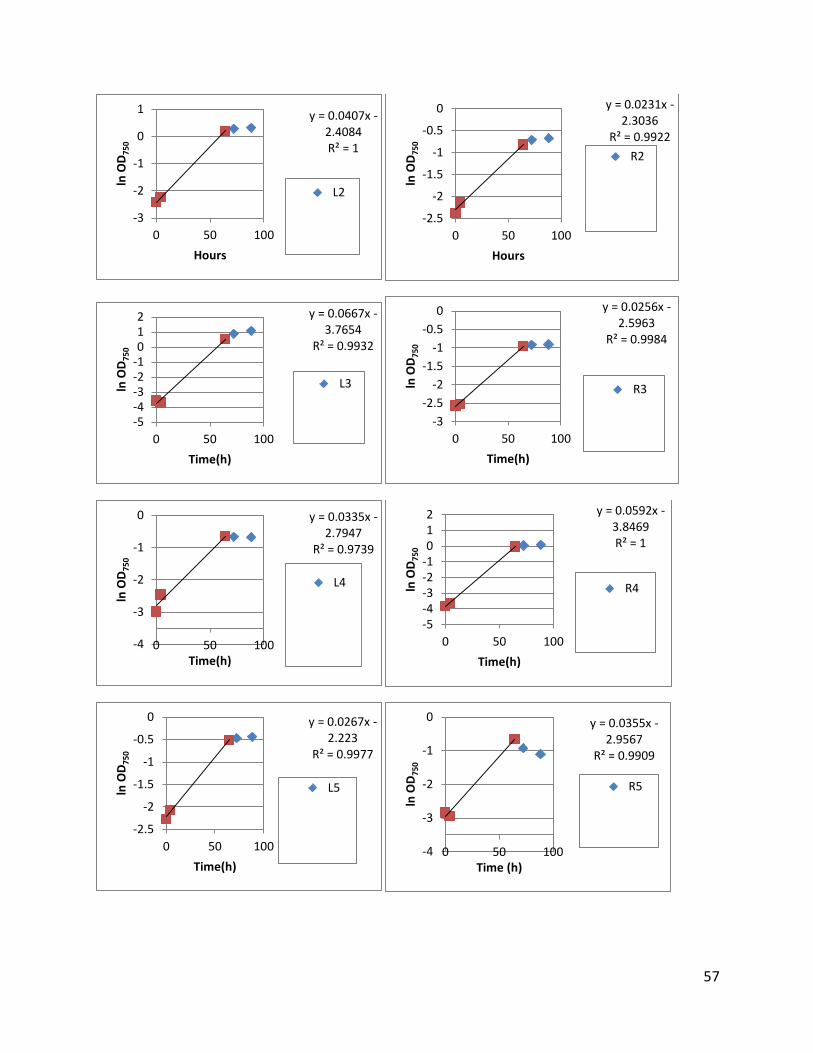
57
y = 0.0407x - 2.4084 R² = 1
-3
-2
-1
0
1
0 50 100
ln O
D 750
Hours
L2
y = 0.0231x - 2.3036
R² = 0.9922
-2.5
-2
-1.5
-1
-0.5
0
0 50 100
ln O
D 750
Hours
R2
y = 0.0667x - 3.7654
R² = 0.9932
-5-4-3-2-1012
0 50 100
ln O
D 750
Time(h)
L3
y = 0.0256x - 2.5963
R² = 0.9984
-3-2.5
-2-1.5
-1-0.5
0
0 50 100
ln O
D 750
Time(h)
R3
y = 0.0335x - 2.7947
R² = 0.9739
-4
-3
-2
-1
0
0 50 100
ln O
D 750
Time(h)
L4
y = 0.0592x - 3.8469 R² = 1
-5-4-3-2-1012
0 50 100
ln O
D 750
Time(h)
R4
y = 0.0267x - 2.223
R² = 0.9977
-2.5
-2
-1.5
-1
-0.5
0
0 50 100
ln O
D 750
Time(h)
L5
y = 0.0355x - 2.9567
R² = 0.9909
-4
-3
-2
-1
0
0 50 100
ln O
D 750
Time (h)
R5
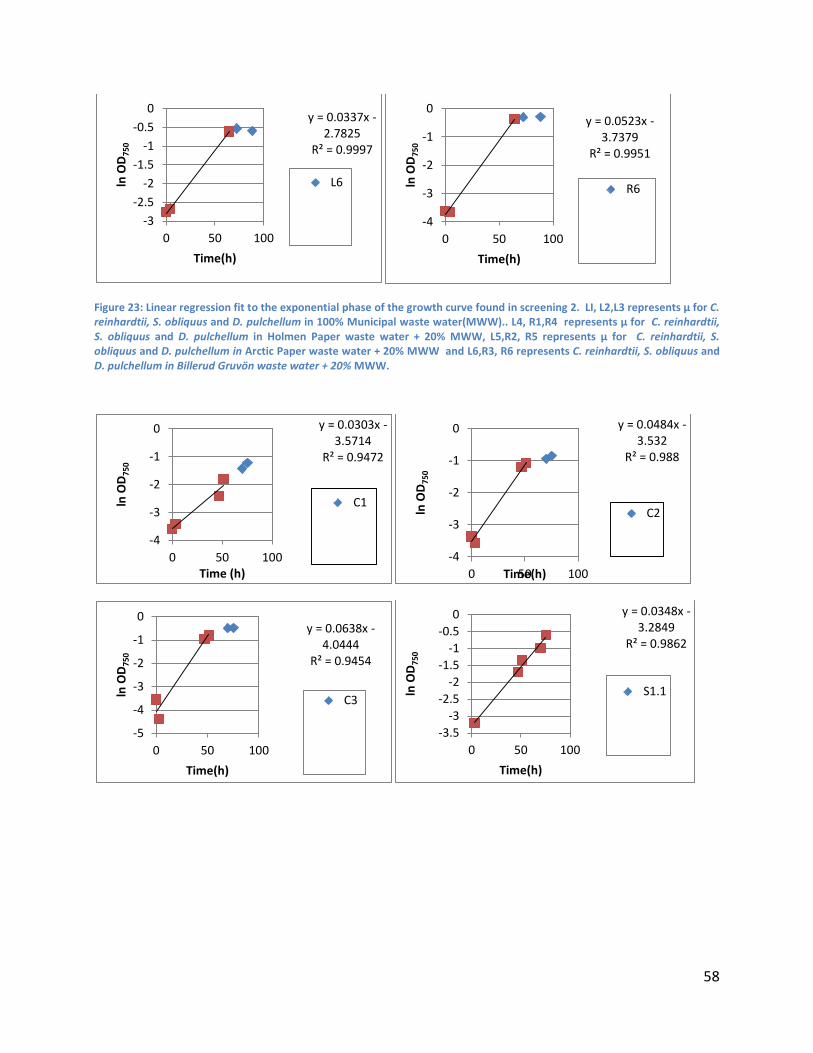
58
Figure 23: Linear regression fit to the exponential phase of the growth curve found in screening 2. LI, L2,L3 represents µ for C. reinhardtii, S. obliquus and D. pulchellum in 100% Municipal waste water(MWW).. L4, R1,R4 represents µ for C. reinhardtii, S. obliquus and D. pulchellum in Holmen Paper waste water + 20% MWW, L5,R2, R5 represents µ for C. reinhardtii, S. obliquus and D. pulchellum in Arctic Paper waste water + 20% MWW and L6,R3, R6 represents C. reinhardtii, S. obliquus and D. pulchellum in Billerud Gruvön waste water + 20% MWW.
y = 0.0337x - 2.7825
R² = 0.9997
-3-2.5
-2-1.5
-1-0.5
0
0 50 100
ln O
D 750
Time(h)
L6
y = 0.0523x - 3.7379
R² = 0.9951
-4
-3
-2
-1
0
0 50 100
ln O
D 750
Time(h)
R6
y = 0.0303x - 3.5714
R² = 0.9472
-4
-3
-2
-1
0
0 50 100
ln O
D 750
Time (h)
C1
y = 0.0484x - 3.532
R² = 0.988
-4
-3
-2
-1
0
0 50 100
ln O
D 750
Time(h)
C2
y = 0.0638x - 4.0444
R² = 0.9454
-5
-4
-3
-2
-1
0
0 50 100
ln O
D 750
Time(h)
C3
y = 0.0348x - 3.2849
R² = 0.9862
-3.5-3
-2.5-2
-1.5-1
-0.50
0 50 100
ln O
D 750
Time(h)
S1.1

59
y = 0.0314x - 3.1356
R² = 0.978
-3.5-3
-2.5-2
-1.5-1
-0.50
0 50 100
ln O
D 750
Time(h)
S1.2
Specificgrowth rate
y = 0.0341x - 3.4098
R² = 0.935
-4
-3
-2
-1
0
1
0 50 100
ln O
D 750
Time(h)
S1.3
y = 0.0367x - 3.1958
R² = 0.9826
-3.5-3
-2.5-2
-1.5-1
-0.50
0.51
0 50 100
ln O
D 750
Time(h)
S2.1
y = 0.0426x - 3.2758
R² = 0.9803
-4
-3
-2
-1
0
1
2
0 50 100
ln O
D 750
Time(h)
S2.2
y = 0.0552x - 3.7519
R² = 0.9743
-4
-3
-2
-1
0
1
0 50 100
ln O
D 750
Time(h)
S2.3
y = 0.0492x - 3.5586
R² = 0.9807
-4
-3
-2
-1
0
1
2
0 50 100
ln O
D 750
Time(h)
S3.1
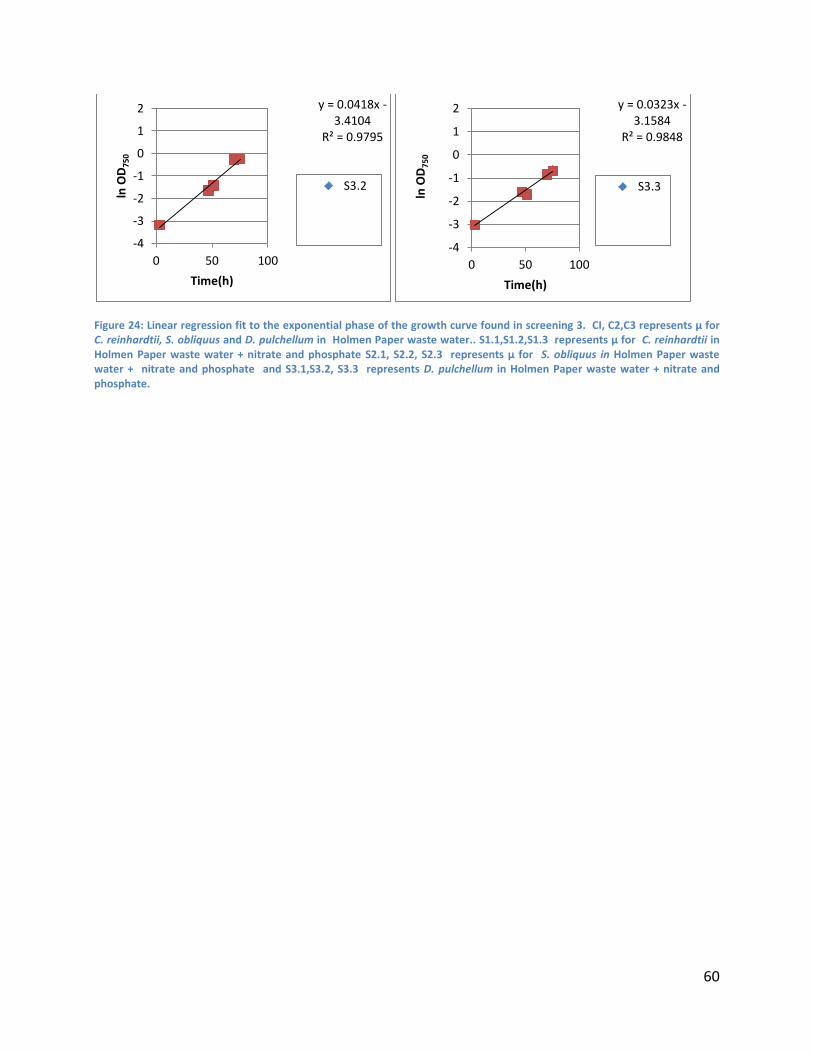
60
Figure 24: Linear regression fit to the exponential phase of the growth curve found in screening 3. CI, C2,C3 represents µ for C. reinhardtii, S. obliquus and D. pulchellum in Holmen Paper waste water.. S1.1,S1.2,S1.3 represents µ for C. reinhardtii in Holmen Paper waste water + nitrate and phosphate S2.1, S2.2, S2.3 represents µ for S. obliquus in Holmen Paper waste water + nitrate and phosphate and S3.1,S3.2, S3.3 represents D. pulchellum in Holmen Paper waste water + nitrate and phosphate.
y = 0.0418x - 3.4104
R² = 0.9795
-4
-3
-2
-1
0
1
2
0 50 100
ln O
D 750
Time(h)
S3.2
y = 0.0323x - 3.1584
R² = 0.9848
-4
-3
-2
-1
0
1
2
0 50 100
ln O
D 750
Time(h)
S3.3

61
Appendix D
Calculation of dry weight
The differences of weight for filter paper before and after filtration were measured. The weight for blank filter were subtracted from the weight of filter with the dried cell
mass There were duplicates for each sample, thus, average was calculated. The weight was coveted as g per L