scotia howard weil annual energy conferencefilecache.investorroom.com/mr5ir_anadarko/844...scotia...
TRANSCRIPT

w w w . a n a d a r k o . c o m | N Y S E : A P C
A N A D A R K O P E T R O L E U M C O R P O R A T I O N
JOHN COLGLAZIERSenior Vice President
832 636 2306
JEREMY SMITHDirector
832 636 1544
SHANDELL SZABODirector
832 636 3977
I N V E S T O RR E L A T I O N S
SCOTIA HOWARD WEIL44TH ANNUAL ENERGY CONFERENCE
Al WalkerChairman, President & CEO
March 2016

w w w . a n a d a r k o . c o m | N Y S E : A P C A N A D A R K O P E T R O L E U M C O R P O R A T I O NA N A D A R K O P E T R O L E U M C O R P O R A T I O Nw w w . a n a d a r k o . c o m | N Y S E : A P C 2
Cautionary LanguageRegarding Forward-Looking Statements and Other Matters
This presentation contains forward-looking statements within the meaning of Section 27A of the Securities Act of 1933 and Section 21E of the Securities Exchange Act of 1934. Anadarko believes that its expectations are based on reasonable assumptions. No assurance, however, can be given that such expectations will prove to have been correct. A number of factors could cause actual results to differ materially from the projections, anticipated results, or other expectations expressed in this presentation, including Anadarko’s ability to realize its expectations regarding performance in this challenging economic environment and meet financial and operating guidance; timely complete and commercially operate the projects and drilling prospects identified in this presentation; reduce its net debt; consummate the transactions described in this presentation and identify and complete additional transactions; achieve further drilling cost reductions and efficiencies; successfully plan, secure necessary government approvals, enter into long-term sales contracts, finance, build, and operate the necessary infrastructure and LNG park in Mozambique; and achieve production expectations on its mega projects. See “Risk Factors” in the company’s 2015 Annual Report on Form 10-K, Quarterly Reports on Form 10-Q and other public filings and press releases. Anadarko undertakes no obligation to publicly update or revise any forward-looking statements.
Please also see our website at www.anadarko.com under “Investor Relations” for reconciliations of the differences between any non-GAAP measure used in this presentation, including the appendix slides, and the most directly comparable GAAP financial measures. Also on our website at www.anadarko.com is a glossary of terms.
Cautionary Note to Investors - The U.S. Securities and Exchange Commission (SEC) permits oil and gas companies, in their filings with the SEC, to disclose only proved, probable and possible reserves that meet the SEC’s definitions for such terms. We may use terms in this presentation, such as “resources,” “net resources,” “net discovered resources,” “recoverable resources,” and similar terms that the SEC’s guidelines strictly prohibit us from including in filings with the SEC. U.S. Investors are urged to consider closely the oil and gas disclosures in our Form 10-K for the year ended December 31, 2015, File No. 001-08968, available from us at www.anadarko.com or by writing to us at: Anadarko Petroleum Corporation, 1201 Lake Robbins Drive, The Woodlands, Texas 77380 Attn: Investor Relations. You can also obtain this form from the SEC by calling 1-800-SEC-0330.

w w w . a n a d a r k o . c o m | N Y S E : A P C A N A D A R K O P E T R O L E U M C O R P O R A T I O NA N A D A R K O P E T R O L E U M C O R P O R A T I O Nw w w . a n a d a r k o . c o m | N Y S E : A P C
Focus on Enhancing and Preserving ValueReduce Capital Program ~50% YOYReduce DividendsAchieve Additional Cost Savings and Efficiency GainsContinue Active Monetization ProgramReduce Net Debt
3
Successfully Navigating a Volatile Environment
Note: All amounts are approximate
Shenandoah
Colombia
Côte d’Ivoire
Mozambique
$1.5~ 1 Y E A R
$0.51 - 3 Y E A R S
$0.53 + Y E A R S
2 0 1 6 E & P I N V E S T M E N T S ( B i l l i o n s )
Delaware Basin
GOM Appraisals
DJ Basin
GOM Tiebacks
TEN Startup

w w w . a n a d a r k o . c o m | N Y S E : A P C A N A D A R K O P E T R O L E U M C O R P O R A T I O NA N A D A R K O P E T R O L E U M C O R P O R A T I O Nw w w . a n a d a r k o . c o m | N Y S E : A P C 4
2016 Expectations
~$1.3 Billion Monetized Thru 2/16 $420 Million Soda Ash and Coal Royalties $750 Million WES Transaction $105+ Million East Chalk Divestiture
Additional Monetizations Under Way
2016E 2015
CAPITAL1
(BILLIONS) $2.6 - $2.8 $5.4 ~50%SALES VOLUMES2
(MMBOE) 282 - 286 292 ~3%OIL SALES VOLUMES2
(MBOPD) 308 - 313 312 ~Flat1 Excludes capital expenditures by WES2 Excludes all sales volumes associated with EOR, Bossier, PRB-CBM and East Chalk
GOM$0.7 B
International$0.7 B
Midstream & Other$0.2 B
U.S. Onshore$1.1 B
2016E CAPITAL PROGRAM$2.6 - $2.8 BILLION*
* Excludes capital expenditures by WES

w w w . a n a d a r k o . c o m | N Y S E : A P C A N A D A R K O P E T R O L E U M C O R P O R A T I O NA N A D A R K O P E T R O L E U M C O R P O R A T I O Nw w w . a n a d a r k o . c o m | N Y S E : A P C 5
Benefits of a Balanced Portfolio~18% Base DeclineLeveraging IDUC InventoryMega Project Contribution Full-Year Lucius Contribution Heidelberg First Oil 1Q16 TEN First Oil Expected 3Q16
$2.0 $2.2 $2.5 $2.9 $2.9 $2.7 ~$1.8
$0.5$1.1 $1.3
$1.8$2.9
$0.1$2.0
$1.6$1.9
$2.1$2.0
$2.4
$0
$4
$8
2010 2011 2012 2013 2014 2015 2016E
E&P
Cap
ital A
lloca
tion
(Bill
ions
)
Advantaged Maintenance Capital Provides Flexibility
Maintenance Capital Short-Cycle Growth Capital Mid- & Long-Cycle Capital
L I Q U I D S M I X ~43% ~56%
Note: Maintenance capital is defined as capital investments necessary to keep current-year sales volumes flat to previous year

w w w . a n a d a r k o . c o m | N Y S E : A P C A N A D A R K O P E T R O L E U M C O R P O R A T I O NA N A D A R K O P E T R O L E U M C O R P O R A T I O Nw w w . a n a d a r k o . c o m | N Y S E : A P C
Increasing Flexibility 50% YOY Capital Reduction 80% Dividend Reduction Improving Cost Structure
Targeting up to $3 Billion Monetizations ~$1.3 Billion Monetized Thru 2/16
$0.9
$2.5 - $3.0$2.1 - $2.2
$2.0 - $3.0 $2.6 - $2.8
$0.1
$0
$6
YE15 Cash Adj. DCF* Monetizations Capital Investments** Dividends YE16E Cash
Bill
ions
2016: Building Cash & Reducing Net Debt(Excludes Working Capital Changes)
6
Financial Discipline: Investing Within Cash Inflows
* Based on consensus prices as of 3/11/2016: WTI $39.50/Bbl and HH $2.50/Mcf** Excludes capital expenditures by WESNote: See Appendix for non-GAAP definitions
$1.3

w w w . a n a d a r k o . c o m | N Y S E : A P C A N A D A R K O P E T R O L E U M C O R P O R A T I O NA N A D A R K O P E T R O L E U M C O R P O R A T I O Nw w w . a n a d a r k o . c o m | N Y S E : A P C
Successfully Refinanced Near-Term MaturitiesAmple Liquidity $900+ Million Cash-on-Hand YE15 $3 Billion 5-Year Revolving Credit Facility $2 Billion 364-Day Facility
Substantial Flexibility
7
Maintaining Financial StrengthInvestment-Grade Quality, Investment-Grade Approach
Rating Outlook Last Update
S&P BBB Negative 2016
FITCH BBB Negative 2016
MOODY’S Ba1 Negative 2016
-$3
$15
Bill
ions
Differentiating Capital Allocation & Portfolio Management
Adj. DCF Monetizations TPE Capital DWH/TRX Adj. FCF (Cumulative) Adj. FCF (CumulativeIncluding DWH/TRX)
2011 2012 2013 2014 2015 2016E*
* Based on consensus prices as of 3/11/2016: WTI $39.50/Bbl and HH $2.50/McfNote: See Appendix for non-GAAP definitions and reconciliations

w w w . a n a d a r k o . c o m | N Y S E : A P C A N A D A R K O P E T R O L E U M C O R P O R A T I O NA N A D A R K O P E T R O L E U M C O R P O R A T I O Nw w w . a n a d a r k o . c o m | N Y S E : A P C
U.S. Onshore: Enhancing & Preserving Value~70% Capital Reduction YOY Decrease Average Rig Count to 5 from 25
Focus on Base ProductionReduce Costs and Improve EfficienciesLeverage 230 IDUCs When Returns Compelling ~170 IDUCs Expected YE16
8
U . S . O N S H O R E N E T S A L E S V O L U M E S * 2 0 1 5 2 0 1 6 E
TOTAL (MBOE/D) 616 596 - 601LIQUIDS (MBBL/D) 283 266 - 270
Delaware Basin~$800 MM
DJ Basin~$1,300 MM
Midstream~$400 MM
Other Onshore~$600 MM
Eagleford$500
Delaware Basin~$500 MM
DJ Basin~$500 MM
Midstream~$100 MM
Other~$100 MM
2016E CAPITAL PROGRAM~$1.2 BILLION
2015 CAPITAL PROGRAM~$3.6 BILLION
* Excludes all sales volumes associated with EOR, Bossier, PRB-CBM and East ChalkNote: See Appendix for non-GAAP definitions
D J B A S I NP L A N N E D A C T I V I T Y
~1 Rig~2 Frac Crews
$6/BOE Development Cost <$15,000/Flowing Barrel
Activation Cost
D E L A W A R E B A S I NP L A N N E D A C T I V I T Y
~4 Rigs~1 Frac Crew
Delineation and Lease Maintenance
2+ BBOE: Doubled Net Resources

w w w . a n a d a r k o . c o m | N Y S E : A P C A N A D A R K O P E T R O L E U M C O R P O R A T I O NA N A D A R K O P E T R O L E U M C O R P O R A T I O Nw w w . a n a d a r k o . c o m | N Y S E : A P C
$5.1
$4.4
$3.7
$2.7
$0
$3
$6
2013 2014 2015 2016E
Mill
ions
Driving Down Well Costs(4,800’ Short-Lateral Equivalent)
CONSOLIDATED CORE ACREAGEWITH MINERALS-INTEREST UPLIFT
OILLIGHT OIL
5 MILES
~$30
~$25
$0
$20
$40
New Drills IDUCs
WTI
Pric
e ($
/Bbl
)
BTAX PV-10 Breakeven**
9
DJ Basin: World-Class Asset1.5+ BBOE Net Resources ~4,000 Identified Drilling Locations
Leveraging Competitive Advantages Minerals-Interest Ownership Infrastructure in Place IDUC Inventory APC Acreage
APC Mineral Interest
D J B A S I NNet Acres: ~350,000
C O L O R A D O
2 0 1 6 P L A N N E D O P E R A T E D A C T I V I T Y
R I G S W E L L S - S L E F R A C C R E W S Y E 1 6 I D U C S
~1 ~45 ~2 ~60
0
100
200
300
$0
$1
$2
$3N
et S
ales
Vol
umes
(MB
OPD
)
Bill
ions
Differentiating Capital Allocation & Portfolio Management(E&P Only)
EBITDAX Capital MonetizationsAdj. FCF (Cumulative) Net Sales Volumes
2011 2012 2013 2014 2015 2016E*
* Based on consensus prices as of 3/11/2016: WTI $39.50/Bbl and HH $2.50/McfNote: EBITDAX excludes corporate G&A; see Appendix for non-GAAP definitions ** Assumes HH $2.50/Mcf
w w w . a n a d a r k o . c o m | N Y S E : A P C A N A D A R K O P E T R O L E U M C O R P O R A T I O NA N A D A R K O P E T R O L E U M C O R P O R A T I O Nw w w . a n a d a r k o . c o m | N Y S E : A P C 10
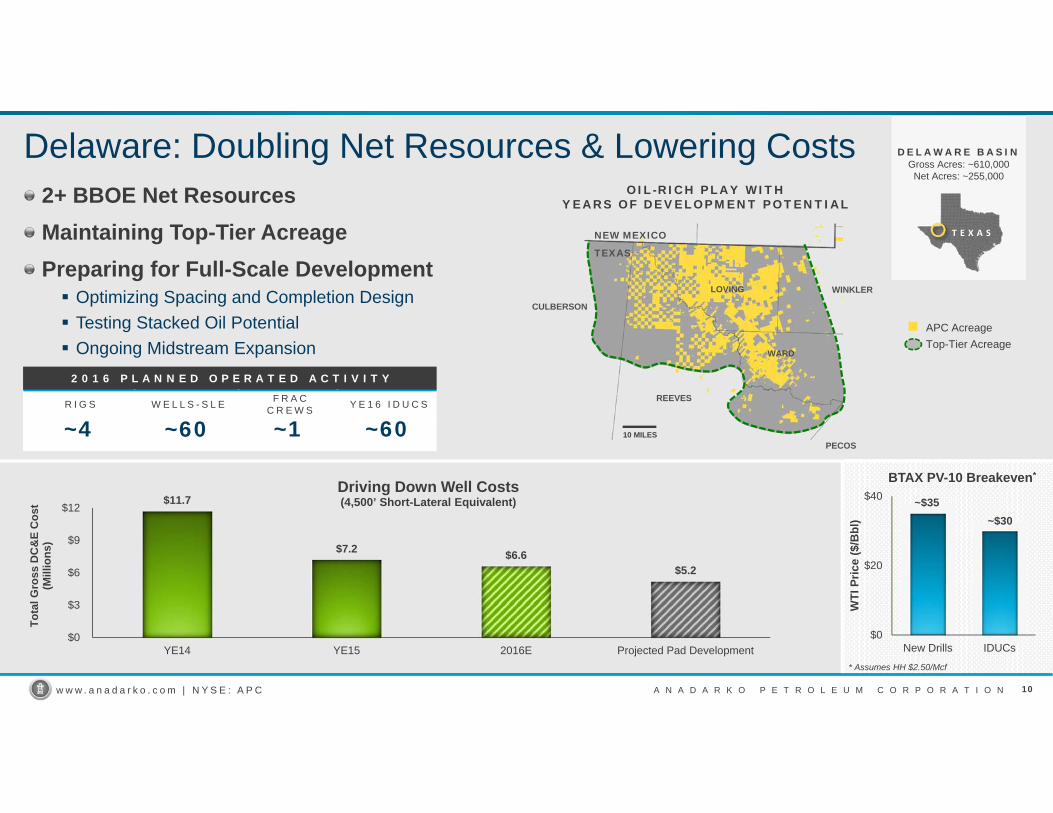
Delaware: Doubling Net Resources & Lowering Costs
T E X A S
DE L AWARE BAS IN Gross Acres: ~610,000
Net Acres: ~255,000
2+ BBOE Net ResourcesMaintaining Top-Tier Acreage Preparing for Full-Scale Development Optimizing Spacing and Completion Design Testing Stacked Oil Potential Ongoing Midstream Expansion
CULBERSON
REEVES
NEW MEXICO
TEXAS
WARD
WINKLER
PECOS
LOVING
OIL-RICH PLAY WITH YEARS OF DEVELOPMENT POTENTIAL
10 MILES
APC AcreageTop-Tier Acreage
~$35~$30
$0
$20
$40
New Drills IDUCs
WTI
Pric
e ($
/Bbl
)
BTAX PV-10 Breakeven*
$11.7
$7.2 $6.6$5.2
$0
$3
$6
$9
$12
YE14 YE15 2016E Projected Pad Development
Tota
l Gro
ss D
C&
E C
ost
(Mill
ions
)
Driving Down Well Costs(4,500’ Short-Lateral Equivalent)
2 0 1 6 P L A N N E D O P E R A T E D A C T I V I T Y
R I G S W E L L S - S L E F R A C C R E W S Y E 1 6 I D U C S
~4 ~60 ~1 ~60
* Assumes HH $2.50/Mcf
w w w . a n a d a r k o . c o m | N Y S E : A P C A N A D A R K O P E T R O L E U M C O R P O R A T I O NA N A D A R K O P E T R O L E U M C O R P O R A T I O Nw w w . a n a d a r k o . c o m | N Y S E : A P C
CONSTITUTION
MARCO POLO
LUCIUS
11
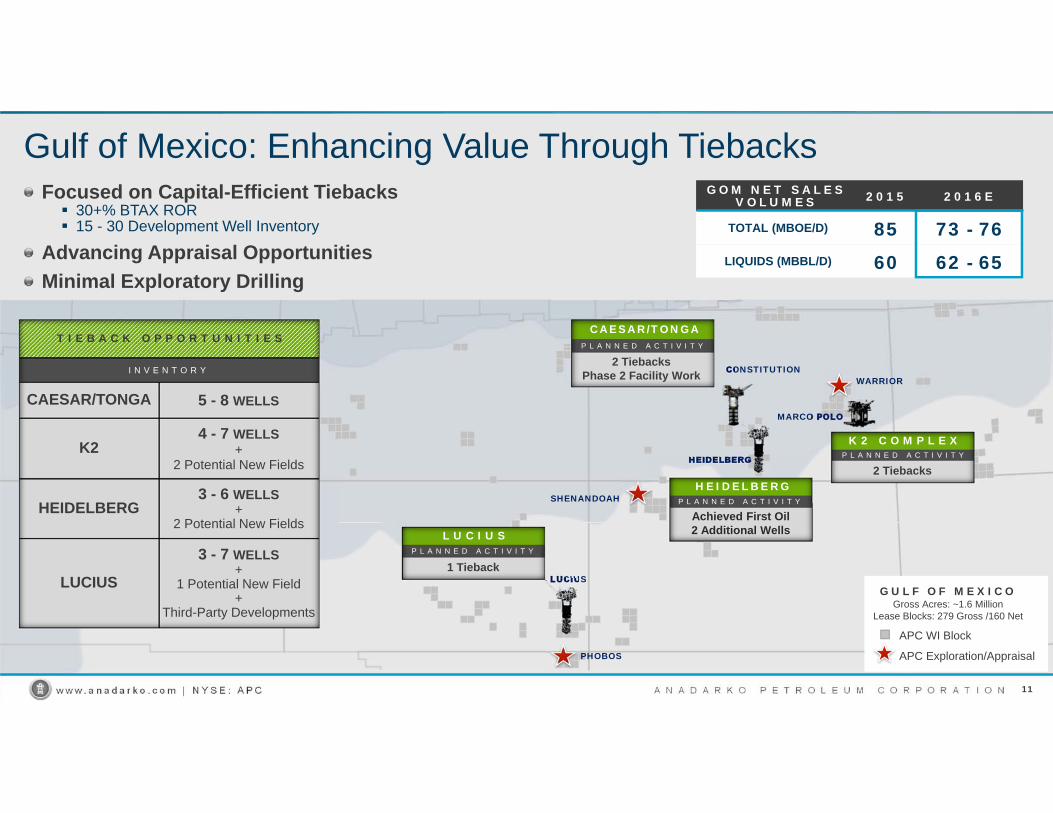
Gulf of Mexico: Enhancing Value Through TiebacksFocused on Capital-Efficient Tiebacks 30+% BTAX ROR 15 - 30 Development Well Inventory
Advancing Appraisal OpportunitiesMinimal Exploratory Drilling
HEIDELBERG
L U C I U SP L A N N E D A C T I V I T Y
1 Tieback
HEIDELBERGP L A N N E D A C T I V I T Y
Achieved First Oil2 Additional Wells
K 2 C O M P L E XP L A N N E D A C T I V I T Y
2 Tiebacks
CAESAR/TONGAP L A N N E D A C T I V I T Y
2 TiebacksPhase 2 Facility Work
G U L F O F M E X I C OGross Acres: ~1.6 Million
Lease Blocks: 279 Gross /160 Net
APC WI Block
APC Exploration/Appraisal
G O M N E T S A L E S V O L U M E S 2 0 1 5 2 0 1 6 E
TOTAL (MBOE/D) 85 73 - 76LIQUIDS (MBBL/D) 60 62 - 65
T I E B A C K O P P O R T U N I T I E S
I N V E N T O R Y
CAESAR/TONGA 5 - 8 WELLS
K24 - 7 WELLS
+2 Potential New Fields
HEIDELBERG3 - 6 WELLS
+2 Potential New Fields
LUCIUS
3 - 7 WELLS+
1 Potential New Field+
Third-Party Developments
WARRIOR
PHOBOS
SHENANDOAH

w w w . a n a d a r k o . c o m | N Y S E : A P C A N A D A R K O P E T R O L E U M C O R P O R A T I O N
A F R I C A
Ghana & Algeria: Growing Higher-Margin Oil
Algeria 2+ Billion Barrels Cumulative Gross Production Flat YOY Volumes for <$40 Million Capital
Ghana Jubilee: Flat YOY Volumes for <$50 Million Capital TEN: First Oil Expected 3Q16
APC WI BlockOil FieldGas CondensateAppraisal AreaExport Pipeline
BLOCK 404A
PK0
BLOCK208
10 MILES16 KMS
OURHOUD CPF
HBNS CPF
EL MERK CPF
A L G E R I A
WEST CAPE THREE POINTS
MAHOGANY
TEAK
Jubilee Unit24% WI
20 MILES32 KMS
DEEPWATER TANO
NTOMME
Planned FPSO Location
TWENEBOA
WAWA
ENYENRA
TEN Complex19% WI
G H A N A
12
0
40
80
2011 2012 2013 2014 2015 2016E
MB
bl/d
Algeria Net Sales Volumes
0
20
40
2013 2014 2015 2016E 2017E 2018E
MB
OPD
Ghana Net Sales Volumes
Jubilee TEN
G H A N A &A L G E R I A

w w w . a n a d a r k o . c o m | N Y S E : A P C A N A D A R K O P E T R O L E U M C O R P O R A T I O N
FID WHEN UNCERTAINTY
REMOVED
Mozambique LNG: Working Parallel Processes
APPROVE PLAN OF DEVELOPMENT
SECURE 8+ MMTPA SPAs
ADVANCE TOWARD ~2/3 LEVERAGE
Legal &Contractual Framework
OfftakeAgreements
Project Financing
MINIMAL 2016 CAPITAL REQUIRED
13

w w w . a n a d a r k o . c o m | N Y S E : A P C A N A D A R K O P E T R O L E U M C O R P O R A T I O NA N A D A R K O P E T R O L E U M C O R P O R A T I O Nw w w . a n a d a r k o . c o m | N Y S E : A P C
2016 International & Deepwater Exploration ActivityG O M
L A N D P O S I T I O N
~1.7 MM Gross Acres2 0 1 6 A C T I V I T Y
PHOBOSAppraisal Well
SHENANDOAHAppraisal Well
WARRIORExploration Well
C O L O M B I AL A N D P O S I T I O N
~16 MM Gross Acres2 0 1 6 A C T I V I T Y
PURPLE ANGEL-1 Exploration Well GRAND COL
3D Seismic Acquisition
14
2 0 1 6 P L A N N E D A C T I V I T Y
C A P I T A L D R I L LT A R G E T N E T D I S C O V E R E D R E S O U R C E S
~$500Million
~8Wells
~250Million
C Ô T E D ’ I V O I R EL A N D P O S I T I O N
~1 MM Gross Acres2 0 1 6 A C T I V I T Y
PAON Appraisal Well
PELICAN Exploration WellROSSIGNOL
Exploration Well

w w w . a n a d a r k o . c o m | N Y S E : A P C A N A D A R K O P E T R O L E U M C O R P O R A T I O N
Net Discovered Resources
~6.5 BBOE
~$14 Billion
Monetized
~5 BBOE ~250 MBOE/d
Resources RetainedNet Production
Exploration: Creating Unmatched Value with Optionality
15
D R I V I N G V A L U EE X P L O R I N G A P P R A I S I N G D E V E L O P I N G
Colombia Côte d’Ivoire GOM (Warrior)
Shenandoah Paon Phobos
Heidelberg TEN Mozambique LNG
~$10 Billion Capital Invested

w w w . a n a d a r k o . c o m | N Y S E : A P C A N A D A R K O P E T R O L E U M C O R P O R A T I O NA N A D A R K O P E T R O L E U M C O R P O R A T I O Nw w w . a n a d a r k o . c o m | N Y S E : A P C 16
Successfully Navigating a Volatile EnvironmentMaintain Financial Discipline and Invest Within Cash InflowsFocus on Value Reduce Capital Spending and Cost StructurePosition U.S. Onshore for the FutureCapitalize on Portfolio Diversification and FlexibilityContinue Active Monetization Program
PRODUCTION
EXPLORATION
EAST AFRICA
WEST AFRICA
GULF OF MEXICO
U.S. ONSHORENORTH AFRICA
ALASKA
COLOMBIA
NEW ZEALAND