scoring the data using association rules - uic - computer
TRANSCRIPT
Scoring the Data Using Association Rules
Abstract
In many data mining applications, the objective is to select data cases of a target class. For example, in direct marketing, marketers want to select likely buyers of a particular product for promotion. In such applications, it is often too difficult to predict who will definitely be in the target class (e.g., the buyer class) because the data used for modeling is often very noisy and has a highly imbalanced class distribution. Traditionally, classification systems are used to solve this problem. Instead of classifying each data case to a definite class (e.g., buyer or non-buyer), a classification system is modified to produce a class probability estimate (or a score) for the data case to indicate the likelihood that the data case belongs to the target class (e.g., the buyer class). However, existing classification systems only aim to find a subset of the regularities or rules that exist in data. This subset of rules only gives a partial picture of the domain. In this paper, we show that the target selection problem can be mapped to association rule mining to provide a more powerful solution to the problem. Since association rule mining aims to find all rules in data, it is thus able to give a complete picture of the underlying relationships in the domain. The complete set of rules enables us to assign a more accurate class probability estimate to each data case. This paper proposes an effective and efficient technique to compute class probability estimates using association rules. Experiment results using public domain data and real-life application data show that in general the new technique performs markedly better than the state-of-the-art classification system C4.5, boosted C4.5, and the Naïve Bayesian system.
1. Introduction
Classification is an important data mining task. The dataset used in a typical classification
task consists of the descriptions of N data cases. Each data case is described by l distinct
attributes. The N cases are also pre-classified into q known classes. The objective of the
classification task is to find a set of characteristic descriptions (e.g., classification rules) for
the q classes. This set of descriptions is often called a predictive model or classifier, which is
used to classify future (or test) cases into the q classes. We call this binary classification
Philip S. Yu IBM T. J. Watson Research Center
Yorktown Heights, NY 10598
Bing Liu, Yiming Ma, and Ching Kian Wong School of Computing
National University of Singapore 3 Science Drive 2, Singapore 117543
{liub, maym, wongck}@comp.nus.edu.sg

1
because each data case is classified to belong to only a single class.
The classification problem has been studied extensively in the past. Many systems have
also been built [e.g., 33, 5, 18, 10, 34, 21, 24], which are widely used in real-life applications.
However, for many situations, building a predictive model or classifier to accurately predict
or classify future cases is not always easy or even possible. The resulting classifier may have
very poor predictive accuracy because the training data used is typically very noisy and has a
highly imbalanced (or skewed) class distribution. To make matters worse, the user is often
only interested in data cases of a minority class, which is even harder to predict. We call this
problem the target selection problem. Let us have an example.
Example 1: In direct marketing applications, marketers want to select likely buyers of certain
products and to promote the products accordingly. Typically, a past promotion database
(training data) is used to build a predictive model, which is then employed to select likely
buyers from a large marketing database of potential customers (each data record or data
case in the database represents a potential customer). The training data used to build the
model is typically very noisy and has an extremely imbalanced class distribution because
the response rate to a product promotion (the percentage of people who respond to the
promotion and buy the product) is often very low, e.g., 1-2% [17, 23, 31]. Building a
classifier to accurately predict buyers is clearly very difficult, if not impossible. If an
inaccurate classifier is used, it may only identify a very small percentage of actual buyers,
which is not acceptable for marketing applications. In such applications, it is common that
the model is used to score the potential customers in the database and then rank them
according to their scores. Scoring means to assign a probability estimate to indicate the
likelihood that a potential customer represented by a data record will buy the product. This
gives marketers the flexibility to choose a certain percentage of likely buyers for
promotion. Binary classification is not suitable for such applications. Assigning a
likelihood value to each data case is more appropriate.
The above example shows that target selection through scoring and ranking is very useful for
applications where the classes are hard to predict.
In many other applications, scoring and ranking the data can also be important even if the
class distribution in the data is not extremely imbalanced and the predictive accuracy of the
classifier built is acceptable. The reason is that we may need more cases of a particular class
(the target class) than what the classifier can predict. In such a situation, we would like to
have the extra cases that are most likely to belong to the target class.

2
Example 2: In an education application, we need to admit students to a particular course. We
wish to select students who are most likely to do well when they graduate. We can build a
classifier or model using the past data. Assume the classifier built is quite accurate. We
then apply the classifier to the new applicants. However, if we only admit those applicants
who are classified as good students, we may not admit enough students. We would then
like to take extra applicants who are most likely to do well. In this situation, assigning a
probability estimate to each applicant becomes crucial because it allows us to admit, as
many applicants as we want and to be assured that these applicants are those who are most
likely to do well.
Currently, classification systems are often used to score the data [23, 31]. Although such
systems are not originally designed for the purpose, they can be easily modified to output a
confidence factor or a probability estimate as a score. The score is then used to rank the data
cases. Existing classification systems, however, only aim to discover a small subset of the
rules that exist in data to form a classifier. Many more rules in data are left undiscovered.
This small subset of rules can only give a partial picture of the domain.
In this paper, we show that association rule mining [2] provide a more powerful solution
to the target selection problem because association rule mining aims to discover all rules in
data and is thus able to provide a complete picture of the domain. The complete set of rules
enables us to assign a more accurate class probability estimate (or likelihood) to each new
data case. This paper proposes an effective and efficient technique to score the data using
association rules. We call this technique Scoring Based on Associations (SBA). Experiments
using both public domain data and real-life application data show that the new method
outperforms the state-of-the-art classification system C4.5, a Naïve Bayesian classifier [21,
10] and boosted C4.5 [34, 13, 39].
2. Related Work
Although target selection via scoring and ranking is an important problem and has many
practical applications, limited research has been done in the past. The common practice is to
use existing classification systems (e.g., decision trees and Naïve Bayes) to solve the
problem. [23, 31] report a number of such applications. No new scoring method is proposed
in either [23] or [31].
Highly imbalanced class distribution of the data is one of the central characteristics of the

3
tasks that we are interested in. For such datasets, it is often too hard to accurately predict the
cases of minority classes. This problem was recognized and studied in the machine learning
community [e.g., 20, 7, 8, 30, 19, 32]. A commonly used approach is to increase the number
of cases (or records) of the minority classes by over-sampling with replacement [e.g., 7, 23].
However, their purpose is to improve predictive accuracy (to decide whether a case is
positive or not), not to improve the result of scoring (to assign a good probability estimate to
each case). In [23], it is shown (with a number of practical marketing applications) that
imbalanced data is not a problem if the classification system is made to output a confidence
factor (or probability estimate) rather than a definite class 1. In the evaluation section (Section
5) of this paper, we also give some evidence to show that increasing the minority class data
does not improve the scoring result.
[24] proposes a technique to use association rules for classification. The technique first
generates all rules and then selects a subset of the rules to produce a classifier. It is shown
that such a classifier is very competitive to the existing classification systems. However, the
technique is not suitable for scoring. When it is applied to scoring, it does not perform as well
as the proposed technique in this paper. Since [24], a number of other classification systems
using association rules have also been reported [e.g., 9, 27, 26]. However, to the best of our
knowledge, there is no existing technique that makes use of association rules for scoring.
3. Problem Statement
3.1. The problem
The dataset D used for our task is a relational table, which consists of N data cases (records)
described by l distinct attributes, Attr1, ..., Attrl. An attribute can be a categorical or a numeric
attribute. The N cases are pre-classified into 2 known classes, C1, and C2. In applications, we
are only interested in the data cases of a target class, which is often the minority class, e.g.,
the buyer class in direct marketing. We also call this class the positive class, and the data
cases of this class the positive cases. We call the other class the negative class.
Note that for classification, we can have more than two classes in a dataset. However, for
target selection we use only two classes because in such applications the user is only
interested in one class of data, i.e., the positive class. The rest of the data are assigned the
1 When the data is badly imbalanced, it is possible that the classification systems may not be able to generate classifiers
(although we have not met such a situation). Our association rule mining based scoring method has an advantage as it aims to find all rules in the data.

4
negative class.
The objective of our task is to produce a model:
1. to score each case in the test (or future) data, e.g., to assign a probability estimate to
indicate how likely the case belongs to the positive class, and
2. to rank the cases in the test set using their scores. When some data cases have the same
score, conflict resolution is performed to decide the ordering among the conflicting cases.
3.2. Evaluation criteria: lift curve and lift index
Our target selection problem is related to classification. In classification, predictive accuracy
(or error rate) is commonly used as the measure to evaluate classifiers. However, for scoring,
this is inadequate. The reasons are as follows:
1. Classification accuracy measures the percentage of data cases that are classified correctly
(or wrongly) by a classifier. It cannot be used to evaluate the results of scoring because in
scoring we do not have the concept of correct/wrong classification. Each data case is only
given a class probability estimate to indicate how likely it belongs to the positive class.
2. Classification accuracy treats false positive and false negative equally. But for scoring,
this is not the case. False negative (e.g., recognize buyers as non-buyers) is highly
undesirable. False positive (e.g., recognize non-buyers as buyers), although still
undesirable, is less harmful.
Traditionally, cumulative lift curve (or simply lift curve) is used to evaluate scoring models
[23, 31]. It is based on lift analysis used in marketing research. Lift analysis works as follows
[17]: A predictive model is first built using the training data, which is then applied to the test
data to give each test case a score to express the likelihood that the test case belongs to the
positive class. The test cases are then ranked according to their scores in a descending order.
After that, the ranked list is divided into 10 equal deciles (could be more), with the cases that
are most likely to be positive being in decile 1 (the top decile), and the cases that are least
likely to be positive in decile 10 (the bottom decile). Let us see an example.
Example 3: In a marketing application, we have a test data of 10,000 cases or potential
customers (thus each decile has 1,000 cases or 10% of the total size). Out of these 10,000
cases, there are 500 positive cases (or buyers). After scoring and ranking (assume a
predictive model has been built), the distribution of the positive cases is shown in the lift
table below (Table 1).
Row 1 in Table 1 shows the number of positive cases in each decile. We can see that

5
more positive cases are gathered in the higher deciles than the lower deciles. This
represents a lift due to modeling [17]. Without modeling, the positive cases would be
randomly distributed in the 10 deciles.
Row 2 in Table 1 gives the percentage of positive cases in each decile, and row 3 gives
the cumulative percentage of positive cases from decile 1 to each subsequent decile. Row
3 of the lift table can be represented with a cumulative lift curve in Figure 1. The diagonal
line in the figure represents the random distribution of the positive cases. From both Table
1 and the lift curve, we can see that the modeling helps to identify the real customers.
Table 1: An example lift table Decile 1 2 3 4 5 6 7 8 9 10
Figure 1. (Cumulative) lift curve for the lift table in Table 1
It is, however, not convenient to use lift tables or lift curves to evaluate the performances of
different scoring models because there are too many numbers to compare with and the
numbers are also in different deciles. In practice, the number of positive cases in the top few
deciles is commonly used to evaluate the scoring results [17, 23, 31]. For example, in KDD-
97-Cup competition, two measurements are used separately to evaluate the competing data
mining tools. The first one is the number of positive cases in the top decile, and the other is
the total number of positive cases in the top 4 deciles. Using the number of positive cases in
the top few deciles may not be appropriate because the distribution within the top few deciles
and within the rest of the deciles can be skewed. Due to this problem, [23] proposes a single
210 120 60 40 22 18 12 7 6 542% 24% 12% 8% 4.40% 3.60% 2.40% 1.40% 1.20% 1%42% 66% 78% 86% 90.40% 94% 96.40% 97.80% 99% 100%
0102030405060708090
100
0 10 20 30 40 50 60 70 80 90 100Percent of testing cases
Perc
ent o
f tot
al p
ositi
ve c
ases
liftrandom
x %
Lift %
6
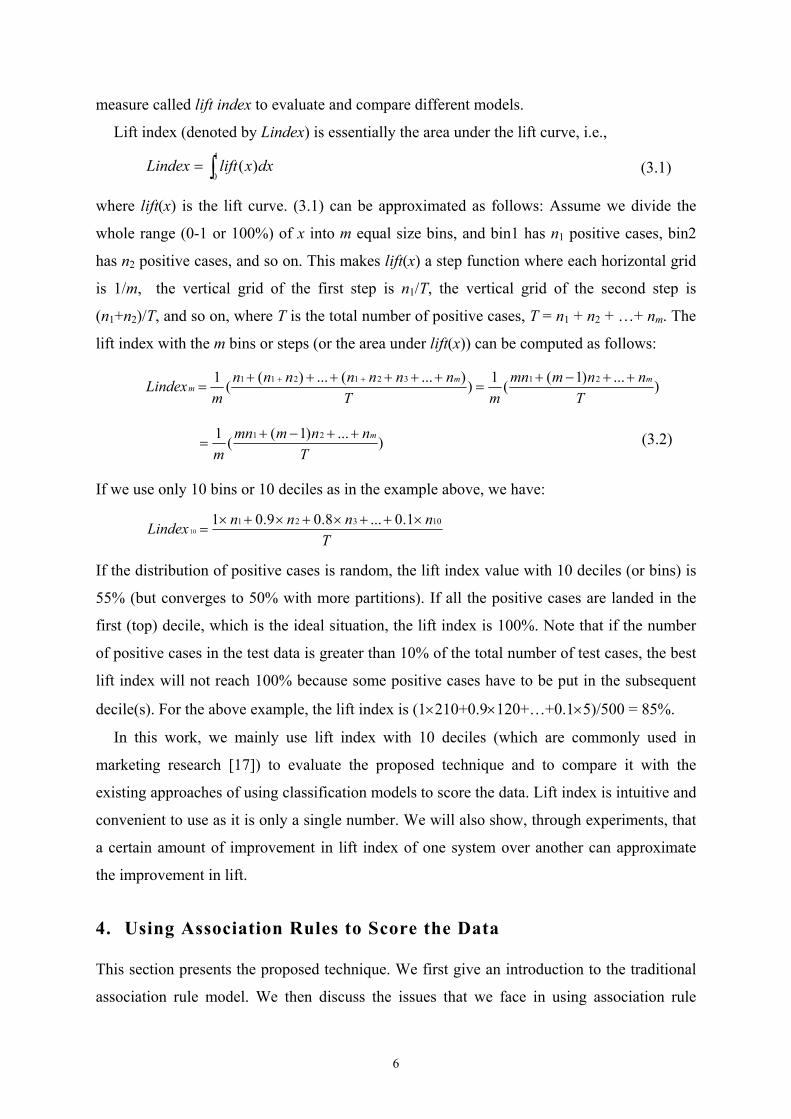
measure called lift index to evaluate and compare different models.
Lift index (denoted by Lindex) is essentially the area under the lift curve, i.e.,
where lift(x) is the lift curve. (3.1) can be approximated as follows: Assume we divide the
whole range (0-1 or 100%) of x into m equal size bins, and bin1 has n1 positive cases, bin2
has n2 positive cases, and so on. This makes lift(x) a step function where each horizontal grid
is 1/m, the vertical grid of the first step is n1/T, the vertical grid of the second step is
(n1+n2)/T, and so on, where T is the total number of positive cases, T = n1 + n2 + …+ nm. The
lift index with the m bins or steps (or the area under lift(x)) can be computed as follows:
If we use only 10 bins or 10 deciles as in the example above, we have:
If the distribution of positive cases is random, the lift index value with 10 deciles (or bins) is
55% (but converges to 50% with more partitions). If all the positive cases are landed in the
first (top) decile, which is the ideal situation, the lift index is 100%. Note that if the number
of positive cases in the test data is greater than 10% of the total number of test cases, the best
lift index will not reach 100% because some positive cases have to be put in the subsequent
decile(s). For the above example, the lift index is (1×210+0.9×120+…+0.1×5)/500 = 85%.
In this work, we mainly use lift index with 10 deciles (which are commonly used in
marketing research [17]) to evaluate the proposed technique and to compare it with the
existing approaches of using classification models to score the data. Lift index is intuitive and
convenient to use as it is only a single number. We will also show, through experiments, that
a certain amount of improvement in lift index of one system over another can approximate
the improvement in lift.
4. Using Association Rules to Score the Data
This section presents the proposed technique. We first give an introduction to the traditional
association rule model. We then discuss the issues that we face in using association rule
TnnnnLindex 10321 1.0...8.09.01
10×++×+×+×
=
∫=1
0)( dxxliftLindex (3.1)
)...)1((1))...(...)((1 21321211
Tnnmmn
mTnnnnnnn
mLindex mm
m++−+
=++++++
=++
)...)1((1 21
Tnnmmn
mm++−+
= (3.2)

7
mining for scoring. Finally, we describe the scoring function used in SBA.
4.1. Association rule mining
Association rules are an important class of regularities that exist in databases. Since it was
first introduced in [2], the problem of mining association rules has received a great deal of
attention [e.g., 1, 3, 6, 14, 16, 29, 35, 37, 38]. The classic application of association rules is
the market basket analysis [2]. It analyzes how the items purchased by customers are
associated. An example association rule is as follows, cheese → beer [sup = 10%, conf =
80%]. This rule says that 10% of customers buy cheese and beer together, and those who buy
cheese also buy beer 80% of the time.
The association rule mining model can be stated as follows: Let I = {i1, i2, …, im} be a set
of items. Let D be a set of transactions (the database), where each transaction d is a set of
items such that d ⊆ I. An association rule is an implication of the form, X → Y, where X ⊂ I,
Y ⊂ I, and X ∩ Y = ∅. The rule X → Y holds in the transaction set D with confidence c if c%
of transactions in D that support X also support Y. The rule has support s in D if s% of the
transactions in D contains X ∪ Y.
Given a set of transactions D (the database), the problem of mining association rules is to
discover all association rules that have support and confidence greater than or equal to the
user-specified minimum support (called minsup) and minimum confidence (called minconf).
4.2. Issues faced
To use a traditional association rule algorithm to mine rules for scoring, we face a number of
problems. We discuss them below. Solutions to these problems are also proposed.
Mining association rules from a relational table: In our applications, we need to mine
association rules from a relational table (rather than a set of transactions) as our target
selection task uses this form of data. For association rule mining to work on this type of
data, we need to discretize each numeric attribute into intervals since association rule
mining only takes categorical values or items. After discretization, we can treat each data
case (record) in the dataset as a set of (attribute, value) pairs and a class label. An
(attribute, value) pair is an item. With this transformation, each data case becomes a
transaction. An existing association rule mining algorithm can be applied to the dataset.
Discretization of continuous attributes will not be discussed in this paper (see [12]).

8
In traditional association rule mining, any item can appear on the left-hand-side or the
right-hand-side of a rule. For scoring, we have a fixed class attribute with two classes.
Thus, we are only interested in rules that use a single class on their right-hand-sides. That
is, we only mine association rules of the form:
X → Ci
where Ci is a class of the class attribute, and X is a set of items from the rest of the
attributes. We say a rule is large if it meets the minimum support.
Using an existing association rule mining algorithm to mine this type of rules is
straightforward. We simply find all large itemsets (or rules) of the form:
<item1, …, itemk, Ci>, where Ci is fixed beforehand.
In the mining process, each iteration adds a new item to every itemset. That is, in the
first iteration we find all itemsets of the form < item1, Ci>. In the second iteration, we find
all itemsets of the form < item1, item2, Ci>, and so on.
Problems with minsup and minconf: Traditional association rule mining uses a single
minsup and a single minconf in the mining process. This is not appropriate for our task
because the class distribution of our data is often extremely imbalanced. Let us discuss the
problems with minsup first. Using a single minsup causes the following problems:
• If the minsup is set too high, we may not find those rules that involve the minority class
(or the positive class), which is the class that we are interested in.
• In order to find rules that involve the minority class, we have to set the minsup very
low. This may cause combinatorial explosion because the majority class may have too
many rules and most of them are overfitted with many conditions and covering very
few data cases. These rules have little predictive value. They also cause increased
execution time.
While a single minsup is inadequate for our application, a single minconf also causes
problems. For example, in a database, it is known that only 5% of the people are buyers
and 95% are non-buyers. If we set the minconf at 96%, we may not be able to find any rule
of the buyer class because it is unlikely that the database contains reliable rules of the
buyer class with such a high confidence. If we set a lower confidence, say 50%, we will
find many rules that have the confidence between 50-95% for the non-buyer class and such
rules are meaningless (see also [3]).
We solve these problems by using different minsups and minconfs for rules of different

9
classes. For minimum supports, we only require the user to specify one total or overall
minimum support (called t_minsup) 2, which is then distributed to each class according to
the class distribution in the data as follows:
where f(Ci) is the number of Ci class cases in the training data. |D| is the total number of
cases in the training data. The reason for using this formula is to give rules with the
frequent (negative) class a higher minsup and rules with the infrequent (positive) class a
lower minsup. This ensures that we will generate enough rules with the positive class and
will not produce too many meaningless rules for the negative class.
For minimum confidence, we use the following formula to automatically assign
minimum confidence to each class:
The reason for using this formula is that we should not produce rules of class Ci whose
confidence is less than f(Ci)/|D| because such rules do not contribute to our task.
Although we have different minsups and minconfs for rules of different classes, no
change needs to be made to the original association rule mining algorithm [2] as the
downward closure property [2] still holds for mining <item1, …, itemk, Ci>. The reason is
that itemsets of different classes do not interact.
Pruning of association rules (optional): It is well known that many association rules are
redundant and minor variations of others. Those insignificant rules should be pruned.
Pruning can remove a huge number of rules (see appendix) with no loss of accuracy (see
Section 5). It also improves the efficiency of scoring.
Our pruning function uses the pessimistic error rate based method in C4.5 [33]. Note
that the error rate of a rule is 1 – ‘the confidence of the rule’. The technique prunes a rule
as follows: If rule r’s estimated error rate is higher than the estimated error rate of rule r−
(obtained by deleting one condition from the conditions of r), then rule r is pruned. Note
that when r is a 1-condition rule of the form, x → y, then r− is, → y, which has no
condition. See [33] for the detailed computation of the pruning method. Pruning can be
done very efficiently because if r is a rule then r− must also be a rule and in memory.
2 It is a commonly belief that the minsup (or t_minsup) is very difficult to set. We will show in the evaluation section that
when it is sufficiently low, it does not affect the lift index results a great deal.
||)(
)(DCf
t_minsupCminsupi
i ×=
||)(
)(DCf
Cminconfi
i =

10
An important point to note is that when attempting to prune a rule r, the r− rule used (for
a k-condition rule r, there are k r−’s) may have been pruned previously. Then, the
procedure needs to go back to the rule that prunes r−, and uses that rule to prune r.
Using association rules for scoring: The key feature of association rule mining is its
completeness, i.e., it aims to find all rules in data. This presents a great opportunity to
design good scoring functions by making use of the rules, i.e., we have abundant
information. However, it also represents a challenge because when we want to score a data
case, there are often many rules that can be applied. Different rules may give different
information, and many of them even give conflicting information. For example, one rule
may say that the data case should belong to the positive class with a probability of 0.9,
while another rule may say that it should belong to the negative class also with a
probability of 0.9. The question is which rule we should trust. In the next sub-section, we
focus on this issue and present a score function that makes use of all rules.
4.3. Scoring using association rules
After the rules are generated (from training data), we can use them to score the new (or test)
data. Since each rule is attached with a support and a confidence, there can be many
alternative ways to design methods to score the data. For example, we can simply score each
data case using the highest confidence rule that can cover the data case (a rule covers a data
case if the data case satisfies the conditions of the rule). The score is simply the confidence
value of the rule in the positive class. We call this method the best rule method. This method
is reasonable because confidence can be seen as a probability estimate indicating the
likelihood that the data case belongs to the positive class. We will see in Section 5 that on
average this simple method actually outperforms C4.5.
To design the best scoring method based on association rules, however, is very difficult.
This is because there are an infinite number of possible methods. Below, we describe a
heuristic technique that is both effective (i.e., produce good lift indices) and efficient.
We begin by analyzing the problems with the best rule method. This method is a greedy
method that tries to give each data case the highest score possible so that it can appear in a
higher decile. However, since the highest confidence rules are often unreliable due to
imbalanced class distribution, we will end up with poor results, i.e., many data cases that are
put into the higher deciles do not actually belong there. This method is also very biased
11
because it does not make use of all the information available. Many rules that cover the data
case are not considered in scoring. We believe more reliable scores can be produced if all the
relevant rules are used because every relevant rule contains a certain amount of information.
In SBA, we use a more balanced approach, which aims to achieve the following effects:
1. When there are many confident positive class rules that can cover the data case, the data
case should be assigned a high score so that it will appear in a higher decile.
2. When the positive class rules that cover the data case are not confident, but the negative
class rules are very confident, the data case should be given a low score.
Basically, we try to push data cases toward both ends. If this is done reliably, we will achieve
good lift indices. We now present the proposed scoring function.
In the context of association rules, we have the following types of useful information:
• Confidence: Rule confidence is an essential piece of information because confidence is
basically a probability estimate. Thus, confidence in the positive class (we are only
interested in the positive class) should play an important role in the score function.
• Support: Rule support, to certain extent, reflects the reliability of the rule. A rule that
covers too few data cases is often overfitted and unreliable.
• Two types of rules: There are two types of rules that we may use, positive class rules and
negative class rules. For a data case, there may be both types of rules that can cover it.
Thus, we need to resolve this situation.
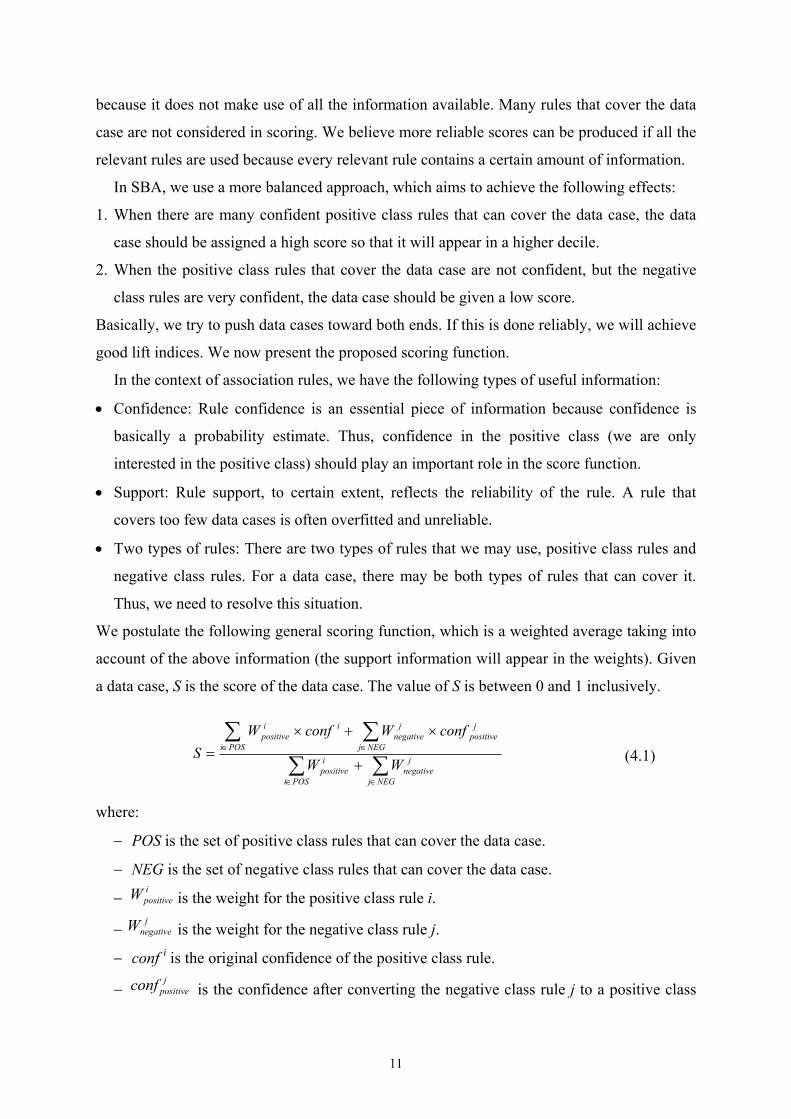
We postulate the following general scoring function, which is a weighted average taking into
account of the above information (the support information will appear in the weights). Given
a data case, S is the score of the data case. The value of S is between 0 and 1 inclusively.
where:
− POS is the set of positive class rules that can cover the data case.
− NEG is the set of negative class rules that can cover the data case.
− is the weight for the positive class rule i.
− is the weight for the negative class rule j.
− conf i is the original confidence of the positive class rule.
− is the confidence after converting the negative class rule j to a positive class
∑∑∑ ∑
∈∈
∈ ∈
+
×+×=
NEGj
jnegative
POSi
ipositive
POSi NEGj
jpositive
jnegative
iipositive
WW
confWconfWS
ipositiveW
jpositiveconf
jnegativeW
(4.1)

12
rule, i.e., = 1- ‘the confidence of rule j’.
Now the problem is what should be the weights. Since we want to achieve the two
desirable effects discussed above, the weights should reflect their needs. We have two pieces
of information about each rule to use: support and confidence. We performed a large number
of experiments, and found that for both the negative weight and the positive weight, the
combination of both confidence and support performs the best. That is:
where conf i and supi are the original confidence and support of the positive class rule i, and
where conf j and sujj are the original confidence and support of the negative class rule j, and k
is a constant to reduce the impact of negative class rules (which often have high supports and
high confidences). We performed many experiments to determine k and found that when k =
3, the system performs the best (see Section 5.1).
It is important to note that to compute the weight for a negative class rule, we do not
convert the rule to a positive rule and then use the support and confidence in the positive
class. Instead, we still use their original support and confidence in the negative class. This
helps us to achieve the two effects discussed above. Let us see why.
(1) When there are many strong (confident) positive class rules for a particular data case, the
following term will be large and dominate the numerator:
The weight term below,
will be small because in this case it is unlikely that there are also many strong negative
rules that can cover the data case. Then, this data case will be given a high score. The
first effect is achieved.
(2) When the data case can be covered by many confident negative class rules, the following
term in the denominator will be large:
∑∈
×POSi
iipositive confW
∑∈NEGj
jnegativeW
∑∈NEGj
jnegativeW
ksupconf
Wjj
jnegative
×=
iiipositive supconfW ×=
jpositiveconf
(4.2)
(4.3)

13
However, the following term in the numerator
will be very small because is very small. In this case, a low score will be given
to the data case. This achieves the second effect.
Finally, in ranking, when more than one data case has the same score, we compute a priority
value (P) using the following formula:
Where |POS| and |NEG| are the numbers of rules in POS and NEG respectively. This formula
uses supports of the rules to calculate the priority. Basically, we give those data cases with
higher positive supports and lower negative supports higher priorities. Note that when a data
case does not satisfy any rule (i.e., POS = NEG = ∅), we assign S = 0 and P = 0.
The combined algorithm for computing both S and P for each test data case d is given
below (Figure 2). Each variable in the algorithm is initialized to 0.
1 for each r in the set of discovered rules do 2 if r covers the data case d then /* d satisfies the conditions of r */ 3 if r is a positive class rule then 4 = r.conf i * r.sup i; 5 temp_s = * r.conf I + temp_s; 6 W i = W i + ; 7 temp_p = temp_p + 8 else /* r is a negative class rule */ 9 = r.conf j * r.sup j; 10 temp_s = ( * r. ) / 3 + temp_s; 11 W j = W j + ; 12 temp_p = temp_p − ; 13 endif 14 numRules = numRules + 1 15 endif 16 endfor 17 S = temp_s / (W i + W j); /* Note that this algorithm does not consider numRules = 0, */ 18 P = temp_p / numRules; /* which is easy to add */
Figure 2. The scoring algorithm in SBA
ipositiveW
ipositiveW
jpositiveconf
isupipositiveW
jnegativeW
jnegativeW
jsup
jnegativeW
∑∈
×NEGj
jpositive
jnegative confW
jpositiveconf
(4.4) |||| NEGPOS
supsupP POSi NEGj
ji
+
−=∑ ∑∈ ∈
14
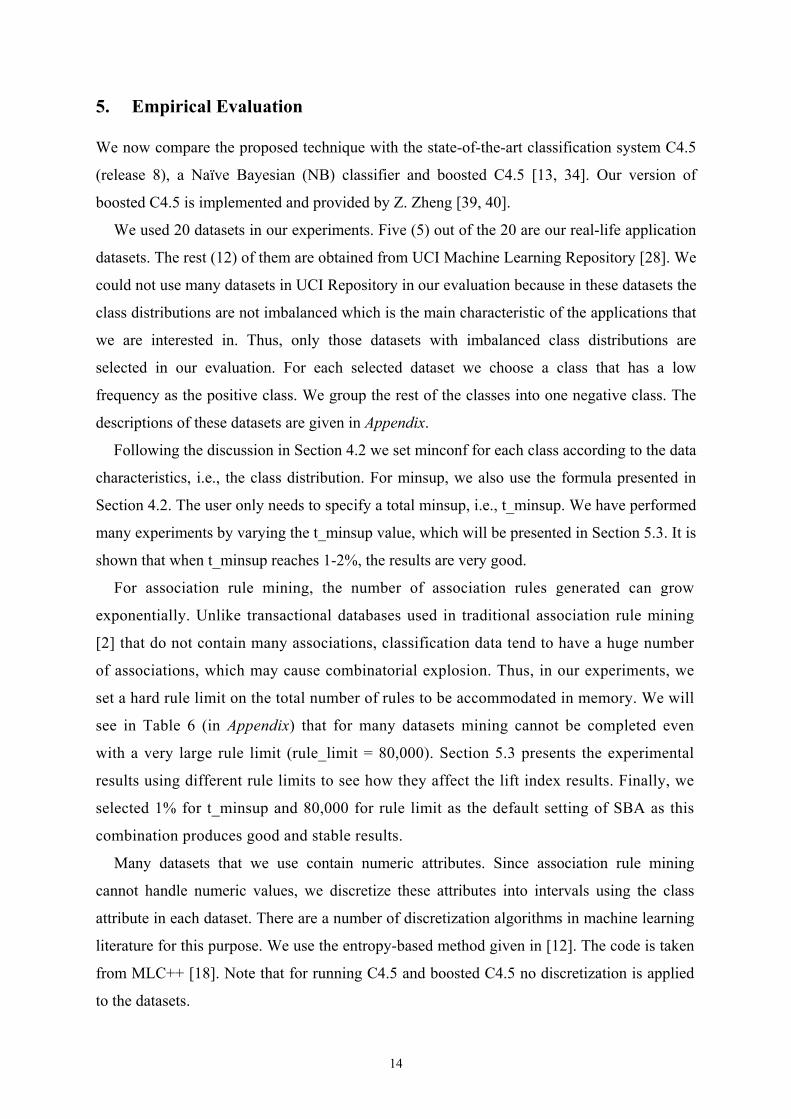
5. Empirical Evaluation
We now compare the proposed technique with the state-of-the-art classification system C4.5
(release 8), a Naïve Bayesian (NB) classifier and boosted C4.5 [13, 34]. Our version of
boosted C4.5 is implemented and provided by Z. Zheng [39, 40].
We used 20 datasets in our experiments. Five (5) out of the 20 are our real-life application
datasets. The rest (12) of them are obtained from UCI Machine Learning Repository [28]. We
could not use many datasets in UCI Repository in our evaluation because in these datasets the
class distributions are not imbalanced which is the main characteristic of the applications that
we are interested in. Thus, only those datasets with imbalanced class distributions are
selected in our evaluation. For each selected dataset we choose a class that has a low
frequency as the positive class. We group the rest of the classes into one negative class. The
descriptions of these datasets are given in Appendix.
Following the discussion in Section 4.2 we set minconf for each class according to the data
characteristics, i.e., the class distribution. For minsup, we also use the formula presented in
Section 4.2. The user only needs to specify a total minsup, i.e., t_minsup. We have performed
many experiments by varying the t_minsup value, which will be presented in Section 5.3. It is
shown that when t_minsup reaches 1-2%, the results are very good.
For association rule mining, the number of association rules generated can grow
exponentially. Unlike transactional databases used in traditional association rule mining
[2] that do not contain many associations, classification data tend to have a huge number
of associations, which may cause combinatorial explosion. Thus, in our experiments, we
set a hard rule limit on the total number of rules to be accommodated in memory. We will
see in Table 6 (in Appendix) that for many datasets mining cannot be completed even
with a very large rule limit (rule_limit = 80,000). Section 5.3 presents the experimental
results using different rule limits to see how they affect the lift index results. Finally, we
selected 1% for t_minsup and 80,000 for rule limit as the default setting of SBA as this
combination produces good and stable results.
Many datasets that we use contain numeric attributes. Since association rule mining
cannot handle numeric values, we discretize these attributes into intervals using the class
attribute in each dataset. There are a number of discretization algorithms in machine learning
literature for this purpose. We use the entropy-based method given in [12]. The code is taken
from MLC++ [18]. Note that for running C4.5 and boosted C4.5 no discretization is applied
to the datasets.

15
5.1. Experiment results
The main experiment results are presented in Table 2. Here, we use lift index with 10 deciles
(10 deciles are commonly used in marketing research [17]) to compare different methods. In
the next subsection, we will see that the improvement in lift index of one system over another
can approximate the improvement in lift in each decile quite well.
In the experiments, SBA takes its default settings of t_minsup = 1% and rule_limit =
80,000 in rule generation. Each column of the table is explained below. Later in the sub-
section, we will also discuss some alternative scoring functions that we have experimented.
Table 2: Experiment results (SBA uses t_minsup = 1%, rule_limit = 80,000)
Column 1: It lists all the datasets used in our experiments. See Appendix for the descriptions
of both the training data and the testing data for each dataset. The first 15 datasets are the
public domain datasets, and the last 5 are our real-life datasets. For the 15 public domain
datasets, all the training sets and test sets are obtained from UCI Machine Learning
Repository (they are separated from each other in the Repository). For our 5 real-life
application datasets, we use data from some years to generate the rules and then use the
data from other years to test. For rows 3 and 4, the training data and the testing data used
are the same respectively, but with different positive classes. In row 3, the positive class
2 3 4 5 6 7 8 9 10
1 Adult 81.7 86.6 83.3 83.0 82.8 94.52 82.9 84.5 350.812 allbp 95.2 95.2 96.4 98.8 98.0 7.20 98.8 99.6 19.343 anneal_5 100.0 100.0 100.0 100.0 100.0 0.11 100.0 100.0 0.774 anneal_U 100.0 99.3 100.0 96.4 99.3 0.05 96.4 100.0 0.505 auto 93.0 75.0 87.0 88.0 89.0 0.16 87.0 91.0 42.186 breast 87.5 89.6 89.4 89.7 89.7 0.22 89.7 89.9 1.547 german 60.0 77.4 70.8 73.0 75.8 3.51 72.4 76.4 12.258 hepati 70.0 84.3 80.0 78.6 80.0 0.22 78.6 78.6 29.179 hypo 98.4 95.8 98.9 98.2 98.7 6.92 98.0 98.6 20.93
10 labor 85.0 88.3 83.3 86.7 88.3 0.00 88.3 88.3 0.0611 led7_0 88.7 86.0 88.6 95.0 95.3 0.54 94.0 95.6 0.9412 led7_7 84.3 85.8 94.0 93.9 94.7 0.28 94.4 95.7 1.3813 pima 72.4 77.5 72.4 76.3 77.5 0.05 76.4 77.4 0.0614 sick 98.0 97.7 100.0 98.2 96.8 6.20 98.2 91.3 20.4915 vehicle 67.3 65.1 70.7 64.1 72.8 0.55 64.8 72.7 9.1716 xcar 95 65.4 68.6 63.3 68.7 69.2 14.39 68.8 67.8 60.6917 xcar 96 64.5 63.4 62.2 59.6 61.5 16.31 59.6 64.1 66.7418 xcar 97 61.9 60.1 60.5 56.2 62.1 12.20 56.4 60.8 49.4419 xMoe po 59.4 60.8 68.5 55.6 66.5 1.59 55.6 68.2 4.5020 xMoe poa 56.2 46.8 62.3 67.7 70.5 1.76 65.6 70.0 4.67
79.4 80.1 81.6 81.4 83.4 8.34 81.3 83.5 34.78
15-4-1 11-5-4 12-6-2 15-3-2
Boosted C4.5NB
1
Average
C4.5 treeDatasets SBA exe. time (sec.)SBA
With rule pruning Without rule pruning
Best rule SBA
won-lost-tied: SBA vs other methods
Best ruleSBA exe. time (sec.)

16
used (a minority class) is “5”, and in row 4, the positive class used (another minority class)
is “U”. The same applies to rows 11 and 12. For rows 16, 17, and 18, which are for an
insurance application, we use the dataset (training) collected before 1995 to generate the
rules, and test on the datasets from 1995, 1996, and 1997 respectively.
Column 2: It gives C4.5tree's lift index for each dataset (unseen test set). In C4.5, there are
two programs that can produce classifiers, C4.5tree and C4.5rules. C4.5tree produces a
decision tree for classification, while C4.5rules generates a set of rules from the decision
tree and then uses the rules for classification (see [33] for details). We also experimented
with C4.5rules. But it does not produce good result (78.4% on average) because too many
test cases fall into the default class, which is used when no rule can classify a test case.
The default class tends to favor the majority class, which is bad for the type of applications
that we are interested in (as we are interested in the minority class). We also used
classifiers built by CBA [24] (CBA builds classifiers using association rules) for scoring.
It also does not perform well (78.6% on average) because of the default class problem as
in C4.5rules.
Since SBA requires numeric attributes to be discretized before rule generation, we also
ran C4.5tree using the same set of discretized data. C4.5tree produces similar results as
without discretization. Using discretized data, the average lift index of C4.5tree is slightly
lower than that without discritization, i.e., 78.9% on average.
As mentioned in the related work section, a commonly used technique in machine
learning research for handling imbalanced class distributions is to boost up the number of
positive cases by over-sampling with replacement, while keeping the same number of
negative cases. In [7], it is suggested that the desired distribution is 50:50, i.e., 50%
positive cases and 50% negative cases. We experimented with this distribution in rule
generation. The result is almost the same. For C4.5tree, the average lift index over the 20
test sets is 79.0%. For SBA, it is 83.2%.
Column 3: It gives the lift index of the Naïve Bayesian (NB) method for each test set.
Column 4: It gives the lift index of boosted C4.5 for each test set.
Column 5: It gives the lift index of the best rule method for each test set using rules after
pruning. We can see that although on average its lift index is not as good as that of SBA
(column 6), it is better than those of C4.5tree and NB, and comparable to boosted C4.5.
This shows the power of more rules.
Column 6: It gives the lift index of SBA for each dataset using rules after pruning.

17
Column 7: It shows the execution time of SBA for scoring, ranking and computing the lift
index for each test dataset (the rule generation time is not included, which is given in
Appendix). We can see that SBA is quite efficient. All the experiments with SBA were run
on a Pentium II 350 PC with 128MB of memory. The execution times of the other systems
are given in Appendix.
Comparing the results of C4.5tree, NB, boosted C4.5 and SBA (Column 6), we make the
following observations:
• The average lift index of SBA over the 20 datasets is higher than that of C4.5tree by 4%.
In Section 5.2, we will show that 4% improvement in lift index means approximately 4%
increases in lift at each decile. This is a significant improvement for marketing. It means
that SBA is able to catch 4% more customers or buyers than C4.5tree. SBA’s won-lost-tied
record against C4.5tree is 15-4-1. In 7 datasets, SBA makes dramatic gains over C4.5tree.
It increases the lift index by more than 10% for 4 test sets.
• On average, NB has a similar performance as C4.5tree. SBA is better than NB by 3.3%. In
6 datasets, SBA makes significant gains over NB. SBA’s won-lost-tied record against NB
is 11-5-4.
• SBA also performs better than boosted C4.5, which is regarded one of the best classifiers.
SBA’s won-lost-tied record against boosted C4.5 is 12-6-2. On average, SBA improves the
lift index of boosted C4.5 by 1.8%. Comparing C4.5tree, NB and boosted C4.5, we can see
that on average boosted C4.5 performs the best and its results are also more consistent.
From Column 8 to Column 10, we show the results of the best rule method and SBA using
association rules without pruning. From Column 9, we can see that the lift index of SBA
using the complete set of rules (without pruning) is almost the same as SBA using the rules
after pruning (Column 6). The best rule method also produces very similar results (Column
8). The running times, however, are drastically different. The execution time of SBA using
the complete set of rules without pruning (Column 10) is much higher than SBA using the set
of rules after pruning (Column 7). This is because pruning reduces the number of rules
drastically. The numbers of rules generated with or without pruning and the executions time
used in rule generation with or without pruning are given in Appendix.
Alternative scoring functions tested: In the course of this work, we experimented many
different scoring functions based on association rules. Below, we summarize the
experiments using alterative weights and k values in the framework of formula (4.1).
• Using supports alone as weights gives us an average lift index of 81.2% over the 20

18
datasets.
• When k = 3 in formula (4.3), we obtain the best result. When k is below 3 or above 3,
the farther the k value is from 3, the worse the result gets (we tried k = 1, 2, 3, 4, 5, and
6). The average lift index results are in the range of 81-83%.
• In formula (4.3), we use the original support and confidence in the negative class to
compute the weight for each negative class rule. This is to achieve the second effect of
pushing those highly probable negative cases to lower deciles. We also performed
experiments that compute the weights using the support and confidence in the positive
class alone. It does not give good results. The average lift index obtained is only 80.6%.
This suggests that pushing data cases toward both ends is an effective strategy.
We also tried to use positive class rules alone for scoring. It performs badly because in
many datasets, very few positive class rules can be found due to highly imbalanced
distribution.
5.2 Lift curve and lift index
We have shown in Section 5.1 that the proposed method SBA can improve the lift indices of
C4.5, NB and boosted C4.5. However, in practice, the user often wants to know the amount
of lift at different deciles [17, 31]. This information is normally directly used in making
marketing decisions [17], e.g., selecting a certain percent of potential customers for
promotion. Thus, we need to know how the improvement in lift index can be translated into
improvement in percentage of lift at each decile.
Table 3 below shows the average cumulative lift of each decile (from 1-10) for each
system. The detailed lift tables of the four systems for all datasets can be found at
http://www.comp.nus.edu.sg/~liub/applied-AI-exp-results.ps. Row 1 in Table 3 gives the average
cumulate lift of SBA (with pruning) in each decile over the 20 datasets. Row 2, 3 and 4 show
the average cumulative lift in each decile for C4.5tree, Boosted C4.5, and NB respectively.
From Table 3, we can see in each column that the improvements of SBA over the other
systems approximately reflect the amounts of improvement in lift index of SBA over these
systems. For instance, in the second decile of SBA has 4.2% more positive cases than C4.5,
2.7% more positive cases than Boosted C4.5, and 4.7% more positive cases than NB. These
improvements of SBA are maintained approximately after decile 2. In decile 1, the
improvement is less. This is mainly caused by three small datasets, auto, hepatic and labor.
These datasets have few than 10 positive cases in their test data. Too few positive cases tend

19
to cause extreme situations, i.e., moving a single positive case up or down can result in
drastic change in lift.
Figure 3 plots the lift curve of each system (average over the 20 datasets). Clearly, we can
see that SBA has the best performance. Boosted C4.5 is better than C4.5tree and NB.
Figure 3. Lift curves of the 4 systems (20 datasets)
5.3 Effects of t_minsup and rule limit
To show how total minimum support (or t_minsup) affects the lift index results of SBA, we
performed experiments by varying the t_minsup value using the default rule limit of 80,000.
Figure 4 shows the average lift index over the 20 test datasets at various total minimum
support levels for SBA (using rules after pruning).
From Figure 4, we see that on average the lift indices do not change a great deal as the
t_minsup value increases. We believe that this is due to the fact that our scoring function is
Table 3. Average lift of each system (20 datasets)
0
10
20
30
40
50
60
70
80
90
100
0 10 20 30 40 50 60 70 80 90 100Percent of testing cases
Perc
ent o
f tot
al p
ositi
ve c
ases
SBA
C4.5tree
BoostedC4.5
NB
Random
1 2 3 4 5 6 7 8 9 10SBA 47.5 63.4 73.3 80.5 86.8 90.2 95.4 97.8 99.4 100.0C4.5tree 46.2 59.2 69.1 75.0 79.9 84.5 90.2 93.7 96.6 100.0BoostedC4.5 45.1 60.7 70.0 78.6 84.4 88.9 93.6 96.1 98.8 100.0NB 44.7 58.7 68.8 75.9 81.7 86.8 91.4 95.8 97.7 100.0

20
based on weighted average. At 1-2%, the results are the best.
Figure 4. Effects of t_minsup on lift index
The rule limit is another parameter that can affect the lift index results. At t_minsup = 1%,
we experimented SBA with various rule limits, 30,000, 50,000, …, and 150,000. The results
are shown in Figure 5 (using rules after pruning).
We can see that the lift indices do not vary a great deal as the rule limit increases. We
finally choose t_minsup = 1% and rule limit of 80,000 as the default setting of our system
because this combination produces good and stable results.
Figure 5. Effects of rule limit on lift index
6. Conclusion
This paper proposed a method to use association rules for target selection. This task is
75
76
77
78
79
80
81
82
83
84
0.50% 1% 2% 5% 6% 8% 10%
75
76
77
78
79
80
81
82
83
84
30k 50k 80k 100k 150k
21
traditionally done using classification systems. The new technique first generates all
association rules with different minimum supports and minimum confidences for rules of the
target class and the other class. It then uses these rules to score the test (or future) data.
Experimental results show that the proposed technique performs significantly better than the
state-of-the-art classification system C4.5, boosted C4.5 and the Naïve Bayesian system. In
addition, experiments with a simple scoring method (the best rule method) indicate that any
reasonable technique using association rules could potentially outperform existing
classification systems. This demonstrates the power of more rules as association rule mining
aims to find all rules in the data. These rules give a complete picture of the underlying
relationships of the domain. A classification system, on the other hand, only generates a small
subset of the rules that exist in data to form a classifier. This small subset of rules only gives
a partial picture of the domain.
By no means, we say that the proposed method is the optimal method for the task. There
can be many other methods. This work represents the beginning. We believe that there is a
great deal of potential for designing even better techniques for scoring and ranking using
association rules.
Acknowledgement: We are very grateful to Zijian Zheng for giving us his boosted C4.5 program. We also thank Yiyuan Xia for modifying the C4.5 program to produce the confidence factor for scoring purposes.
References
1. Aggarwal, C., and Yu, P. "Online Generation of Association Rules." Proceedings of IEEE International Conference on Data Engineering (ICDE-98), pp. 402-411, 1998.
2. Agrawal, R. and Srikant, R. “Fast algorithms for mining association rules.” Proceedings of International Conference on Very Large Databases (VLDB-94), pp. 487-499, 1994.
3. Bayardo, R., Agrawal, R, and Gunopulos, D. "Constraint-based rule mining in large, dense databases." Proceedings of IEEE International Conference on Data Engineering (ICDE-99), pp. 188-197, 1999.
4. Bayardo, R., Agrawal, R. “Mining the most interesting rules.” Proceedings of ACM SIGKDD International Conference on Knowledge Discovery and Data Mining (KDD-99), pp. 145-154, 1999.
5. Breiman, L., Friedman, J., Ohlsen, R., and Stone. C. Classification and regress trees. Wadsworth & Brooks, Pacifc Grove, CA, 1984.
6. Brin, S. Motwani, R. Ullman, J. and Tsur, S. “Dynamic Itemset counting and implication rules for market basket data.” Proceedings of the ACM SIGMOD International Conference on Management of Data (SIGMOD-97), pp. 255-264, 1997.
7. Chan, P. K., and Stolfo, S. J. “Towards scaleable learning with non-uniform class and cost distributions: a case study in credit card fraud detection”, Proceedings of ACM

22
SIGKDD International Conference on Knowledge Discovery and Data Mining (KDD-98), pp. 164-168, 1998.
8. Dietterich, T and Baskiri, G. “Solving multiclass learning problems via error-correcting output code.” Journal or AI research, vol 2. 263-286.
9. Dong. G. Zhang, X. Wong, L. Li, J. 1999. “CAEP: classification by aggregating emerging patterns.” Proceedings of Discovery-Science-99, pp. 30-42, 1999.
10. Domingos, P. & Pazzani, M. “On the optimality of the simple bayesian classifier under zero-one loss.” Machine Learning, 29(2-3), pp. 103-130, 1997.
11. Fawcett, T., and Provost, F. “Combining data mining and machine learning for effective user profile.” Proceedings of ACM SIGKDD International Conference on Knowledge Discovery and Data Mining (KDD-96), pp. 8-13, 1996.
12. Fayyad, U. M. and Irani, K. B. "Multi-interval discretization of continuous-valued attributes for classification learning." Proceedings of International Joint Conference on Artificial Intelligence (IJCAI-93), pp. 1022-1029, 1993.
13. Freund, Y. and Schapire, R. E. “Experiments with a new boosting algorithm.” Proceedings of the International Conference on Machine Learning (ICML-96), pp. 148-156, 1996.
14. Fukuda, T. Morimoto, Y. Morishita, S and Tokuyama, T. “Data mining using two-dimensional optimized association rules: scheme, algorithms and visualization.” Proceedings of the ACM SIGMOD International Conference on Management of Data (SIGMOD-96), pp. 13-23, 1996.
15. Gehrke, J., Ganti, V., Ramakrishnan, R. and Loh, W. “BOAT-optimistic decision tree construction.” Proceedings of the ACM SIGMOD International Conference on Management of Data (SIGMOD-99), pp. 169-180, 1999.
16. Han, J. and Fu, Y. “Discovery of multiple-level association rules from large databases.” Proceedings of International Conference on Very Large Databases (VLDB-95), pp. 420-431, 1995.
17. Hughes, A. M. The complete database marketer. Chicago, Ill.: Irwin Professional, 1996. 18. Kohavi, R., John, G., Long, R., Manley, D., and Pfleger, K. “MLC++: a machine
learning library in C++.” Tools with artificial intelligence, pp. 740-743, 1994. 19. Kubat, M. Holte, R., and Matwin, S. “Learning when negative examples abound.”
Proceedings of the European International Conference on Machine Learning (ECML-97), pp. 146-153, 1997.
20. Kubat, M. and Matwin, S. “Addressing the curse of imbalanced training sets.” Proceedings of the International Conference on Machine Learning (ICML-97), pp. 179-186, 1997.
21. Langley, P., Iba, W., and Thomson, K. “An analysis of Bayesian classifiers.” Proceeding of National Conference on Artificial Intelligence (AAAI-92), pp. 223-228, 1992.
22. Lee, W., Stolfo, S. J., and Mok, K. W. “Mining audit data to build intrusion detection models.” Proceedings of ACM SIGKDD International Conference on Knowledge Discovery and Data Mining (KDD-98), pp. 66-72 , 1998.
23. Ling, C. and Li C. "Data mining for direct marketing: problems and solutions," Proceedings of ACM SIGKDD International Conference on Knowledge Discovery and Data Mining (KDD-98), pp. 73-79, 1998.
24. Liu, B., Hsu, W. and Ma, Y. “Integrating classification and association rule mining.” Proceedings of ACM SIGKDD International Conference on Knowledge Discovery and Data Mining (KDD-98), pp. 80-86, 1998.
25. Liu, B., Hsu, W. and Ma, Y. “Mining association rules with multiple minimum supports." Proceedings of ACM SIGKDD International Conference on Knowledge Discovery and Data Mining (KDD-99), pp. 337-341, 1999.

23
26. Mannila, H., Pavlov, D and Smyth, P “Prediction with local patterns using cross-entropy.” Proceedings of ACM SIGKDD International Conference on Knowledge Discovery and Data Mining (KDD-99), pp. 357-361, 1999.
27. Meretkis, D. & Wuthrich, B. “Extending naïve bayes classifiers using long itemsets.” Proceedings of ACM SIGKDD International Conference on Knowledge Discovery and Data Mining (KDD-99), pp. 165-174, 1999.
28. Merz, C. J, and Murphy, P. UCI repository of machine learning databases [http://www.cs.uci.edu/~mlearn/MLRepository.html], 1996.
29. Ng. R. T. Lakshmanan, L. Han, J. “Exploratory mining and pruning optimisation of constrained association rules.” Proceedings of the ACM SIGMOD International Conference on Management of Data (SIGMOD-98), pp. 13-24, 1998.
30. Pazzani, M., Merz, C., Murphy, P., Ali, K., Hume, T., and Brunk, C. “Reducing misclassification costs.” Proceedings of the International Conference on Machine Learning (ICML-97), 1997.
31. Piatetsky-Shapiro, G. and Massand, B. “Estimating campaign benefits and modelling lift.” Proceedings of ACM SIGKDD International Conference on Knowledge Discovery and Data Mining (KDD-99), pp. 185-193, 1999.
32. Provost, F., and Fawcettt, T. “Analysis and visualization of classifier performance: comparison under imprecise class and cost distributions.” Proceedings of ACM SIGKDD International Conference on Knowledge Discovery and Data Mining (KDD-97), pp. 43-48, 1997.
33. Quinlan, R. C4.5: program for machine learning. Morgan Kaufmann, 1992. 34. Quinlan, R. “Bagging, Boosting, and C4.5.” Proceeding of National Conference on
Artificial Intelligence (AAAI-96), pp. 725-730, 1996. 35. Rastogi, R. and Shim, K. 1998. “Mining optimized association rules with categorical and
numeric attributes.” Proceedings of IEEE International Conference on Data Engineering (ICDE –98), pp. 503-512, 1998.
36. Shafer, J., Agrawal, R. & Mehta, M. "SPRINT: A scalable parallel classifier for data mining." Proceedings of International Conference on Very Large Databases (VLDB-96), pp. 544-555, 1996.
37. Toivonen, H. “Sampling large databases for association rules.” Proceedings of International Conference on Very Large Databases (VLDB-96), pp. 134-145, 1996.
38. Tong, A. Lu, H., Han, J. and Feng, L. “Break the barrier of transactions: mining inter-transaction association rules” Proceedings of ACM SIGKDD International Conference on Knowledge Discovery and Data Mining (KDD-99), pp. 297-301, 1999.
39. Zheng, Z. Webb, G. and Ting, K.M. “Lazy Bayesian rules: A lazy semi-naive Bayesian learning technique competitive to boosting decision trees. Proceedings of the International Conference on Machine Learning (ICML-99), pp. 493-502, 1999.
40. Zheng, Z. and Webb, G. “Stochastic attribute selection committees with multiple boosting: Learning more accurate and more stable classifier committees.” Proceedings of Pacific Asia International Conference on Knowledge Discovery and Data Mining (PAKDD-99), pp. 123-132, 1999.
Appendix
Table 4 summarizes the training and testing datasets used in our experiments. Results on rule
generation using SBA are also included. Table 5 gives the execution times of the systems
used. Below, we present Table 4 first.
24
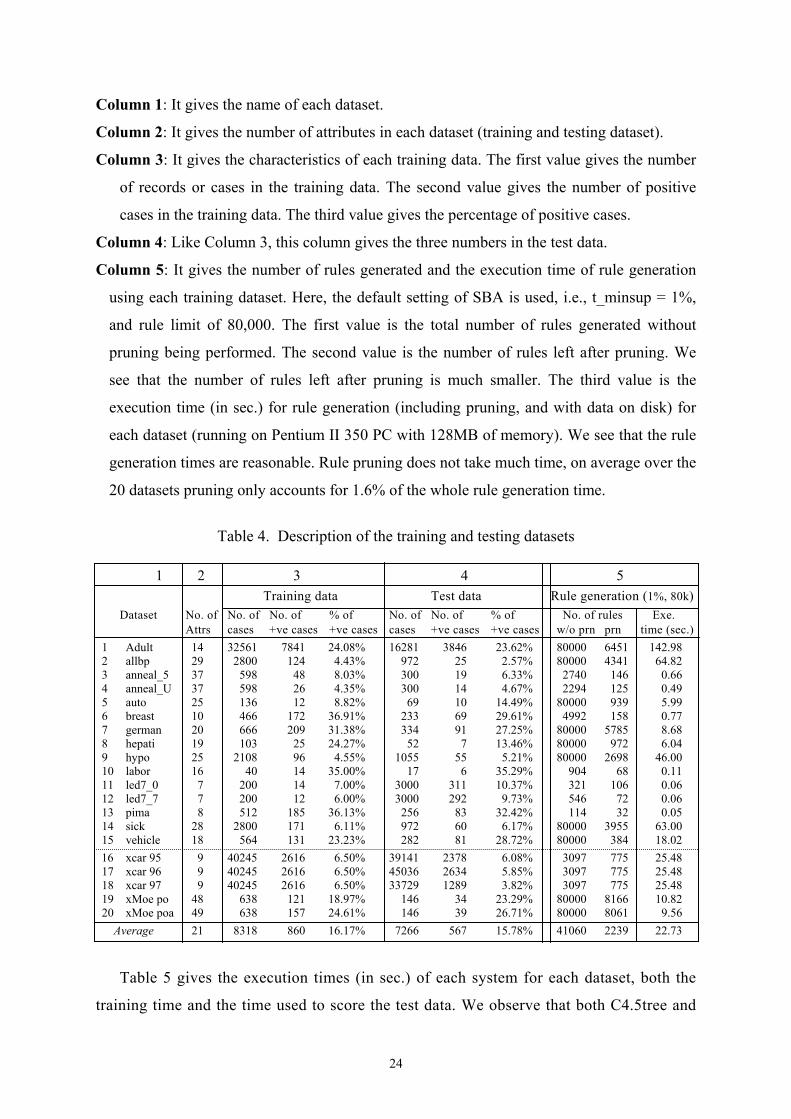
Column 1: It gives the name of each dataset.
Column 2: It gives the number of attributes in each dataset (training and testing dataset).
Column 3: It gives the characteristics of each training data. The first value gives the number
of records or cases in the training data. The second value gives the number of positive
cases in the training data. The third value gives the percentage of positive cases.
Column 4: Like Column 3, this column gives the three numbers in the test data.
Column 5: It gives the number of rules generated and the execution time of rule generation
using each training dataset. Here, the default setting of SBA is used, i.e., t_minsup = 1%,
and rule limit of 80,000. The first value is the total number of rules generated without
pruning being performed. The second value is the number of rules left after pruning. We
see that the number of rules left after pruning is much smaller. The third value is the
execution time (in sec.) for rule generation (including pruning, and with data on disk) for
each dataset (running on Pentium II 350 PC with 128MB of memory). We see that the rule
generation times are reasonable. Rule pruning does not take much time, on average over the
20 datasets pruning only accounts for 1.6% of the whole rule generation time.
Table 4. Description of the training and testing datasets 1 2 3 4 5 Training data Test data Rule generation (1%, 80k) Dataset No. of No. of No. of % of No. of No. of % of No. of rules Exe. Attrs cases +ve cases +ve cases cases +ve cases +ve cases w/o prn prn time (sec.) 1 Adult 14 32561 7841 24.08% 16281 3846 23.62% 80000 6451 142.98 2 allbp 29 2800 124 4.43% 972 25 2.57% 80000 4341 64.82 3 anneal_5 37 598 48 8.03% 300 19 6.33% 2740 146 0.66 4 anneal_U 37 598 26 4.35% 300 14 4.67% 2294 125 0.49 5 auto 25 136 12 8.82% 69 10 14.49% 80000 939 5.99 6 breast 10 466 172 36.91% 233 69 29.61% 4992 158 0.77 7 german 20 666 209 31.38% 334 91 27.25% 80000 5785 8.68 8 hepati 19 103 25 24.27% 52 7 13.46% 80000 972 6.04 9 hypo 25 2108 96 4.55% 1055 55 5.21% 80000 2698 46.00 10 labor 16 40 14 35.00% 17 6 35.29% 904 68 0.11 11 led7_0 7 200 14 7.00% 3000 311 10.37% 321 106 0.06 12 led7_7 7 200 12 6.00% 3000 292 9.73% 546 72 0.06 13 pima 8 512 185 36.13% 256 83 32.42% 114 32 0.05 14 sick 28 2800 171 6.11% 972 60 6.17% 80000 3955 63.00 15 vehicle 18 564 131 23.23% 282 81 28.72% 80000 384 18.02 16 xcar 95 9 40245 2616 6.50% 39141 2378 6.08% 3097 775 25.48 17 xcar 96 9 40245 2616 6.50% 45036 2634 5.85% 3097 775 25.48 18 xcar 97 9 40245 2616 6.50% 33729 1289 3.82% 3097 775 25.48 19 xMoe po 48 638 121 18.97% 146 34 23.29% 80000 8166 10.82 20 xMoe poa 49 638 157 24.61% 146 39 26.71% 80000 8061 9.56 Average 21 8318 860 16.17% 7266 567 15.78% 41060 2239 22.73
Table 5 gives the execution times (in sec.) of each system for each dataset, both the
training time and the time used to score the test data. We observe that both C4.5tree and

25
NB are more efficient than SBA, which is understandable because SBA generates all rules
in data. However, SBA is more efficient than boosted C4.5.
Although the worst-case time and space complexities of association rule mining are
both exponential, due to the minimum support and minimum confidence constraints, the
execution time on actual data normally grows linearly [2, 24]. The memory also does not
present a problem as the dataset resides on disk and only a few scans of the data are
needed in rule mining [2]. Our approach for scoring also does not need a huge number of
rules in memory, i.e., we have a limit on the number of rules needed (see Section 5.3).
The time complexity of C4.5tree is O(nlogn) [33], and the time complexity of NB is O(n)
[10], where n is the number of cases (or data records) in the database. Boosted C4.5
basically runs C4.5tree 10 times.
Table 4. Execution times (in sec.) of each system for training and for scoring the test data
2 3 4 5 6 7 8 9C4.5tree
train.C4.5tree
test NB train. NB testBoosted
C4.5 train.Boosted C4.5 test SBA train. SBA test
1 Adult 39.70 2.50 8.70 8.60 410.24 10.50 142.98 94.522 allbp 1.50 0.90 1.20 0.70 15.34 8.65 64.82 7.203 anneal_5 1.20 0.50 1.10 0.60 13.21 6.34 0.66 0.114 anneal_U 1.10 0.50 0.80 0.60 12.10 4.67 0.49 0.055 auto 0.90 0.40 0.70 0.40 9.34 4.56 5.99 0.166 breast 0.40 0.10 0.20 0.40 5.10 1.02 0.77 0.227 german 1.50 0.50 1.20 0.60 15.78 5.68 8.68 3.518 hepati 1.60 0.50 1.30 0.60 17.55 5.56 6.04 0.229 hypo 1.90 0.40 1.70 0.80 20.14 4.89 46.00 6.92
10 labor 1.10 0.10 0.90 0.30 12.02 1.42 0.11 0.0011 led7_0 1.30 0.20 1.10 0.40 13.45 2.30 0.06 0.5412 led7_7 1.30 0.20 1.10 0.40 14.56 1.46 0.06 0.2813 pima 1.20 0.60 0.90 0.70 11.57 6.55 0.05 0.0514 sick 1.50 0.90 1.30 0.90 16.20 9.10 63.00 6.2015 vehicle 1.10 0.90 1.80 1.10 11.45 8.22 18.02 0.5516 xcar-95 6.80 5.60 2.00 15.40 69.50 52.34 25.48 14.3117 xcar-96 5.20 5.20 2.00 16.20 54.28 50.12 25.48 16.3118 xcar-97 6.30 5.10 2.00 14.50 65.47 49.34 25.48 12.2019 xMoe-po 1.30 0.70 1.00 0.80 14.26 5.68 10.82 1.5920 xMoe-poa 1.50 0.70 1.00 0.80 16.55 6.43 9.56 1.76
Average 3.92 1.33 1.60 3.24 40.91 12.24 22.73 8.34
1
Dataset