score report interpretation guide - state board of … · iv 2014 u2015 parcc score report...
TRANSCRIPT

Score Report Interpretation Guide
Fall 2014 AND
Spring 2015

2014–2015 PARCC SCoRe RePoRt inteRPRetAtion guide iii
Table of Contents1.0 General Information for Parents and Educators ........................................ 11.1 Background ......................................................................................................................... 11.2 PARCC Assessment ............................................................................................................. 11.3 Confidentiality of Reporting Results ................................................................................... 11.4 Purpose of this Guide ......................................................................................................... 12.0 Understanding the PARCC Individual Student Report (ISR) ....................... 22.1 Types of Scores on the PARCC ISR....................................................................................... 2
2.1.1 Scale Score ...........................................................................................................................22.1.2 Performance Level ...............................................................................................................22.1.3 Subclaim Performance Indicators ........................................................................................2
2.2 Sample ISR (ELA/L).............................................................................................................. 32.3 Sample ISR (Mathematics).................................................................................................. 52.4 Description of Individual Student Reports.......................................................................... 7
2.4.1 General Information ............................................................................................................72.4.2 Overall Assessment Scores ..................................................................................................72.4.3 Performance by Reporting Category ....................................................................................82.4.4 Performance by Subclaim Category .....................................................................................8
3.0 Understanding the PARCC School and District Reports .......................... 103.1 Purpose and Use of PARCC Results .................................................................................. 103.2 PARCC School and District Reports ................................................................................... 10
3.2.1 Types of Scores on the PARCC School and District Reports ...............................................103.2.2 Scale Score .........................................................................................................................103.2.3 Performance Level .............................................................................................................103.2.4 Subclaim Performance Indicators ......................................................................................11
3.3 Sample Student Roster Report (ELA/L) ............................................................................. 113.4 Sample Student Roster Report (Mathematics) ................................................................ 123.5 Description of Student Roster Reports ............................................................................. 12
3.5.1 General Information ..........................................................................................................123.5.2 Overall Assessment Scores ................................................................................................123.5.3 Performance by Reporting Category ..................................................................................133.5.4 Performance by Subclaim Category ...................................................................................13
3.6 Sample District Summary of Schools Report (ELA/L) ........................................................ 143.7 Sample District Summary of School Report (Mathematics) ............................................ 153.8 Description of District Summary of Schools Reports ........................................................ 15
3.8.1 General Information ..........................................................................................................153.8.2 Overall Assessment Scores ................................................................................................153.8.3 Performance by Reporting Category ..................................................................................163.8.4 Performance by Subclaim Category ...................................................................................16
Appendices ................................................................................................. 18Appendix A Scale Score Ranges .............................................................................................. 18Appendix B Performance Level Descriptors ........................................................................... 23
Grades 3–11 English Language Arts/Literacy ..............................................................................24Grades 3–8 Mathematics ............................................................................................................24Algebra I, Algebra II, Geometry, Integrated Math I, II, and II ......................................................24

2014–2015 PARCC SCoRe RePoRt InteRPRetAtIon GuIdeiv
2014–2015 PARCC SCoRe RePoRt inteRPRetAtion guide 1
General Inform
ationfor Parents and
Educators
1.0 General Information for Parents and Educators
1.1 BackgroundThe Partnership for Assessment of Readiness for College and Careers (PARCC) is a consortium of states developing assessments to measure student achievement in English language arts/literacy (ELA/L) and mathematics based on the learning standards expressed by the Common Core State Standards (CCSS) for grades 3–8 and high school. Arkansas, Colorado, District of Columbia, Illinois, Maryland, Massachusetts, Mississippi, New Jersey, New Mexico, Ohio, and Rhode Island participated in the 2014–2015 PARCC administrations.
1.2 PARCC AssessmentThe primary purpose of PARCC is to provide high-quality assessments to measure students’ progress toward college and career readiness.
The 2014–2015 (fall and spring) administrations of the PARCC assessment included two test windows for the administration of two separate components: the Performance-Based Assessment (PBA) and the End-of-Year (EOY) assessment. The fall administration was offered in a paper based format, and the spring administration was offered in both paper based and computer based formats. The first window was for administration of the PBA, and the second window was for administration of the EOY. A student must have participated in both windows to receive a summative PARCC score.
The PBA administration occurred after approximately 75 percent of instructional time was complete. The ELA/L PBA focused on writing effectively when analyzing text. The mathematics PBA focused on applying skills and concepts and solving multi-step problems that require abstract reasoning, precision, perseverance, and strategic use of tools.
The EOY administration occurred after approximately 90 percent of instructional time was complete. For the EOY, students demonstrated their acquired skills and knowledge by responding to machine-scored item types.
1.3 Confidentiality of Reporting ResultsIndividual student performance results on PARCC assessments are confidential and may be released only in accordance with the Family Educational Rights and Privacy Act of 1974 (20 U.S.C. Section 1232g). Aggregated student performance data are made available to the public and do not contain the names of individual students or teachers.
1.4 Purpose of this GuideThis guide provides information on the individual student reports, school reports, and district reports provided for PARCC assessment results. Section 2.0, which outlines and explains elements of the individual student report, may be shared with parents. This section will help parents understand their child’s test results. Section 3.0 outlines and explains elements of the school and district reports. Individual state policies and calculations for accountability reporting may differ from the policies and calculations used for assessment reports. Note: Educators in Washington, DC should refer to LearnDC.org to access the DC score reports.
Note that the sample reports included in this guide are for illustration purposes only. They are provided to show the basic layout of the reports and the information they provide. Sample reports do not include actual data from any administration.
2014–2015 PARCC SCoRe RePoRt inteRPRetAtion guide2
Und
erst
andi
ng th
e PA
RCC
Indi
vidu
al
Stud
ent R
epor
t (IS
R)
2.0 Understanding the PARCC Individual Student Report (ISR)
2.1 Types of Scores on the PARCC ISRStudent performance on PARCC assessments is described on the individual student report using scale scores, Performance Levels, and subclaim performance indicators. PARCC, state, district, and school average results are included in relevant sections of the report to help parents understand how their child’s performance compares to that of other students. In some instances, a dash (–) will appear in place of average results for a school and/or district. This indicates that there are too few students to maintain student privacy and still report the school or district’s results.
2.1.1 Scale ScoreA scale score is a numerical value that summarizes student performance. Not all students respond to the same set of test items, so each student’s raw score (actual points earned on test items) is adjusted for the slight differences in difficulty among the various forms and administrations of the test. The resulting scale score allows for an accurate comparison across test forms and administration years within a grade and subject area. PARCC reports provide overall scale scores for English language arts/literacy and mathematics, which determine a student’s Performance Level. PARCC scale scores range from 650 to 850 for all tests. Additionally, PARCC English language arts/literacy reports provide separate scale scores for both Reading and Writing. PARCC Reading scale scores range from 10 to 90 and PARCC Writing scale scores range from 10 to 60.
For example, a student who earns an overall scale score of 800 on one form of the grade 8 mathematics assessment would be expected to earn an overall scale score of 800 on any other form of the grade 8 mathematics assessment. Furthermore, the student’s overall scale score and level of mastery of concepts and skills would be comparable to a student who took the same assessment the previous year or following year.
2.1.2 Performance LevelEach Performance Level is a broad, categorical level defined by a student’s overall scale score and used to report overall student performance by describing how well students met the expectations for their grade level/course. Each Performance Level is defined by a range of overall scale scores for the assessment. There are five Performance Levels for PARCC assessments:
•• Level 1: Did not yet meet expectations•• Level 2: Partially met expectations•• Level 3: Approached expectations•• Level 4: Met expectations•• Level 5: Exceeded expectations
Students performing at levels 4 and 5 met or exceeded expectations, have demonstrated readiness for the next grade level/course and, ultimately, are on track for college and careers.
Performance Level Descriptors (PLDs) describe the knowledge, skills, and practices that students should know and be able to demonstrate at each Performance Level in each content area (ELA/L and mathematics), and at each grade level/course. PLDs are available at http://avocet.pearson.com/PARCC/Home.
2.1.3 Subclaim Performance IndicatorsSubclaim performance for PARCC assessments is reported using graphical representations that indicate how the student performed relative to the overall performance of students who met or nearly met expectations for the content area. Students may have subclaim performance indicators of:
•• Below Expectations – represented by a down arrow
2014–2015 PARCC SCoRe RePoRt inteRPRetAtion guide 3
Understanding the
PARCC Individual Student Report (ISR)
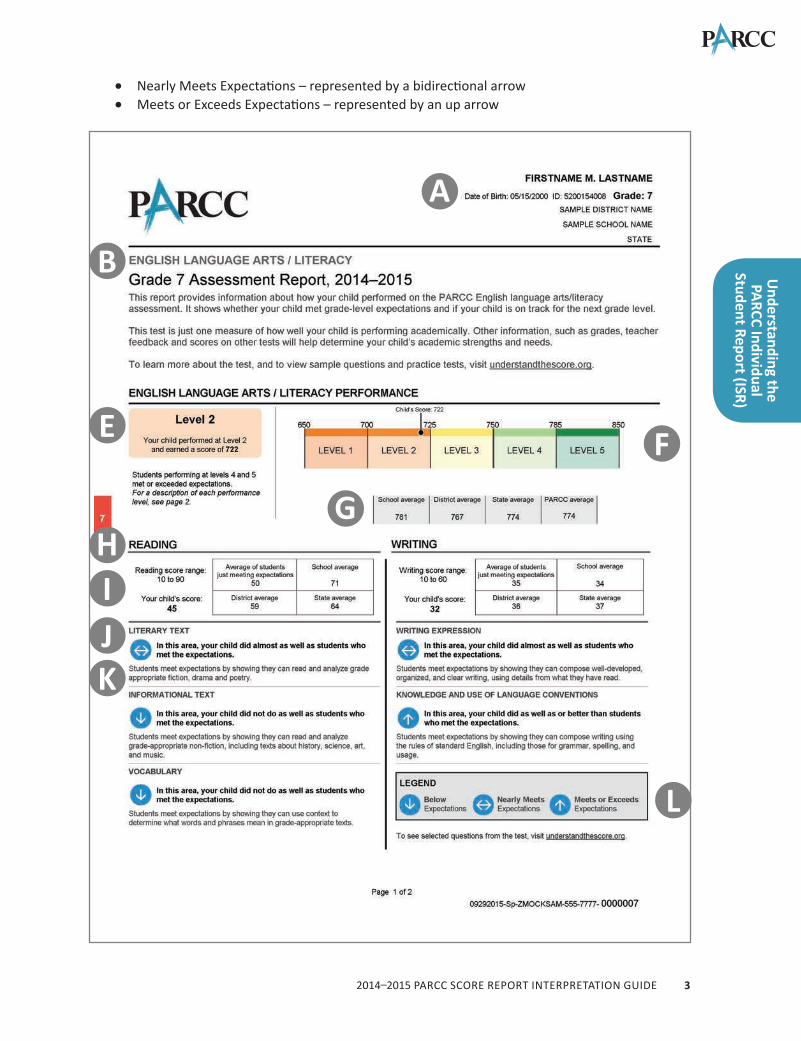
•• Nearly Meets Expectations – represented by a bidirectional arrow•• Meets or Exceeds Expectations – represented by an up arrow
A
B
E F
GHIJK
L
2014–2015 PARCC SCoRe RePoRt inteRPRetAtion guide4
Und
erst
andi
ng th
e PA
RCC
Indi
vidu
al
Stud
ent R
epor
t (IS
R)
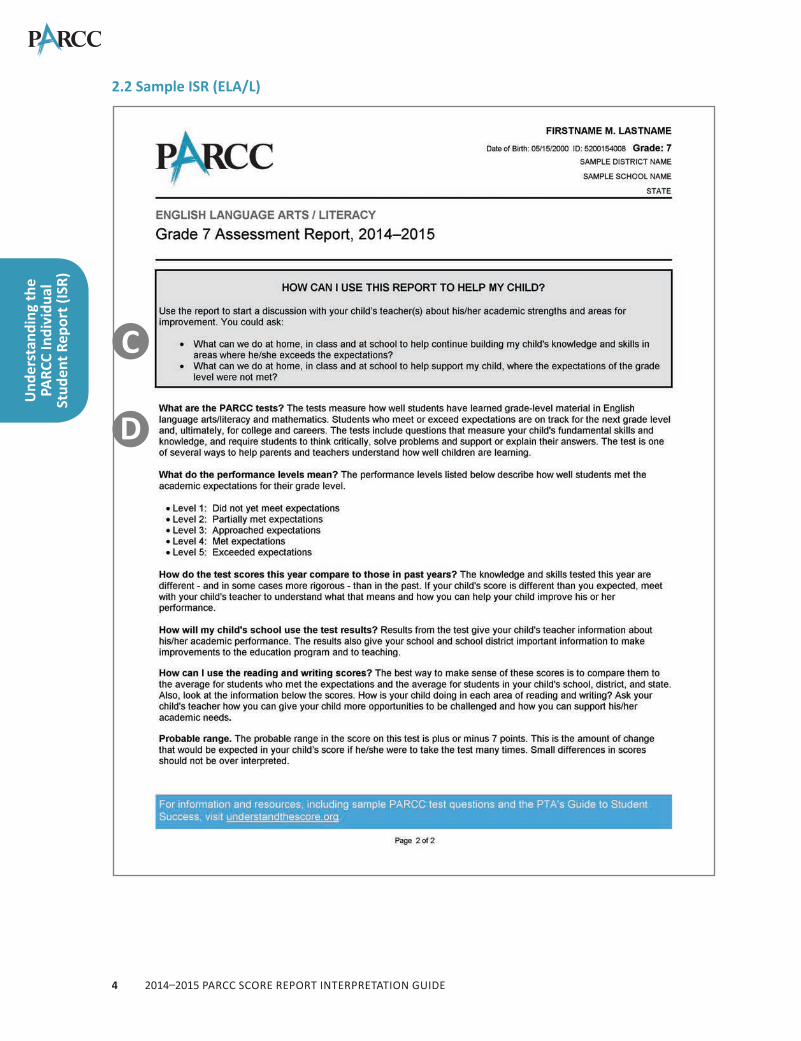
2.2 Sample ISR (ELA/L)
C
D
2014–2015 PARCC SCoRe RePoRt inteRPRetAtion guide 5
Understanding the
PARCC Individual Student Report (ISR)
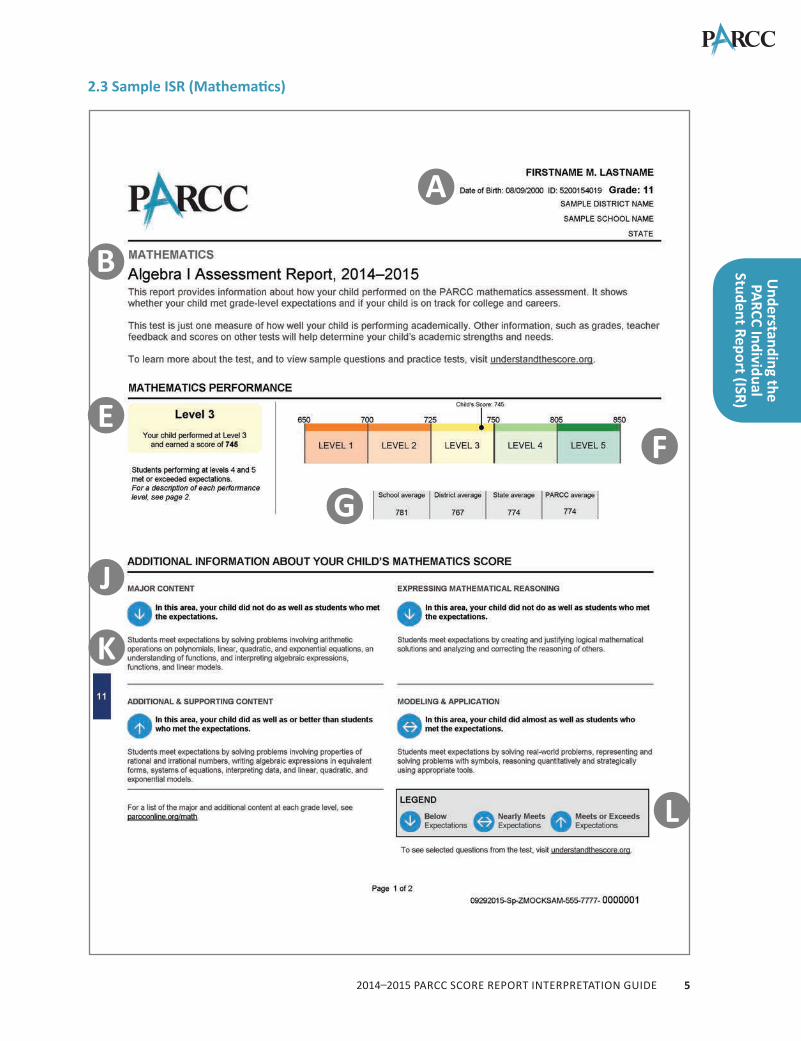
2.3 Sample ISR (Mathematics)
A
B
EF
G
J
K
L
2014–2015 PARCC SCoRe RePoRt inteRPRetAtion guide6
Und
erst
andi
ng th
e PA
RCC
Indi
vidu
al
Stud
ent R
epor
t (IS
R)
C
D
2014–2015 PARCC SCoRe RePoRt inteRPRetAtion guide 7
Understanding the
PARCC Individual Student Report (ISR)
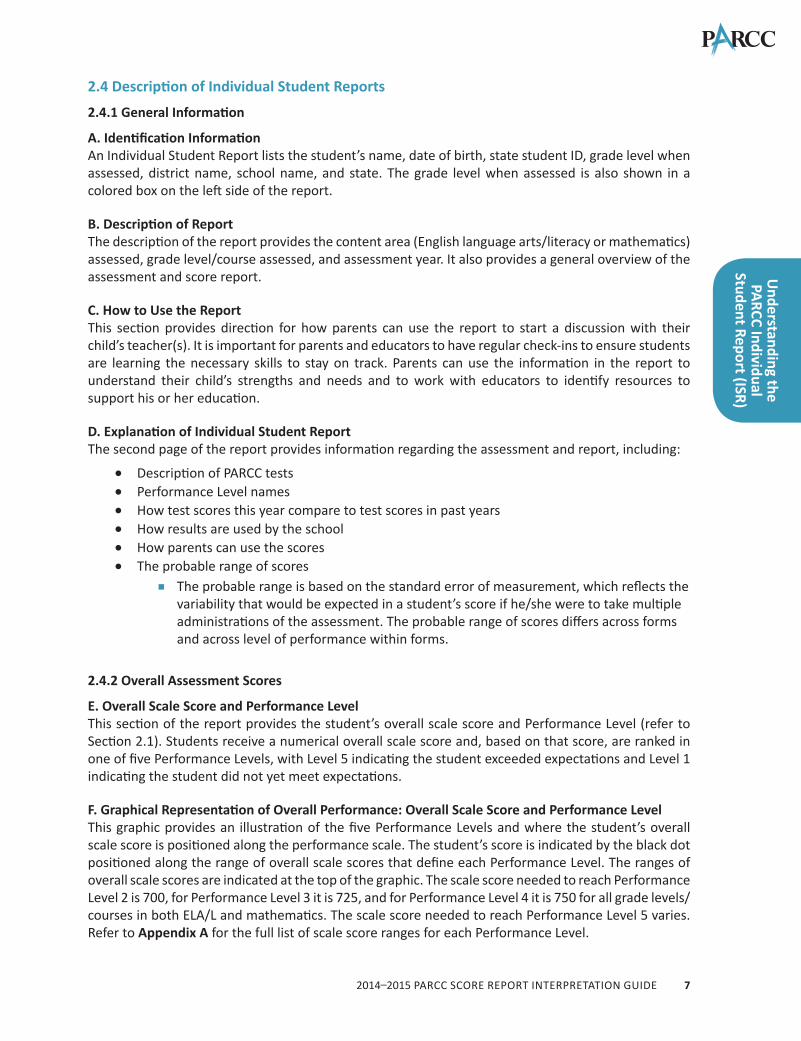
2.4 Description of Individual Student Reports
2.4.1 General Information
A. Identification InformationAn Individual Student Report lists the student’s name, date of birth, state student ID, grade level when assessed, district name, school name, and state. The grade level when assessed is also shown in a colored box on the left side of the report.
B. Description of ReportThe description of the report provides the content area (English language arts/literacy or mathematics) assessed, grade level/course assessed, and assessment year. It also provides a general overview of the assessment and score report.
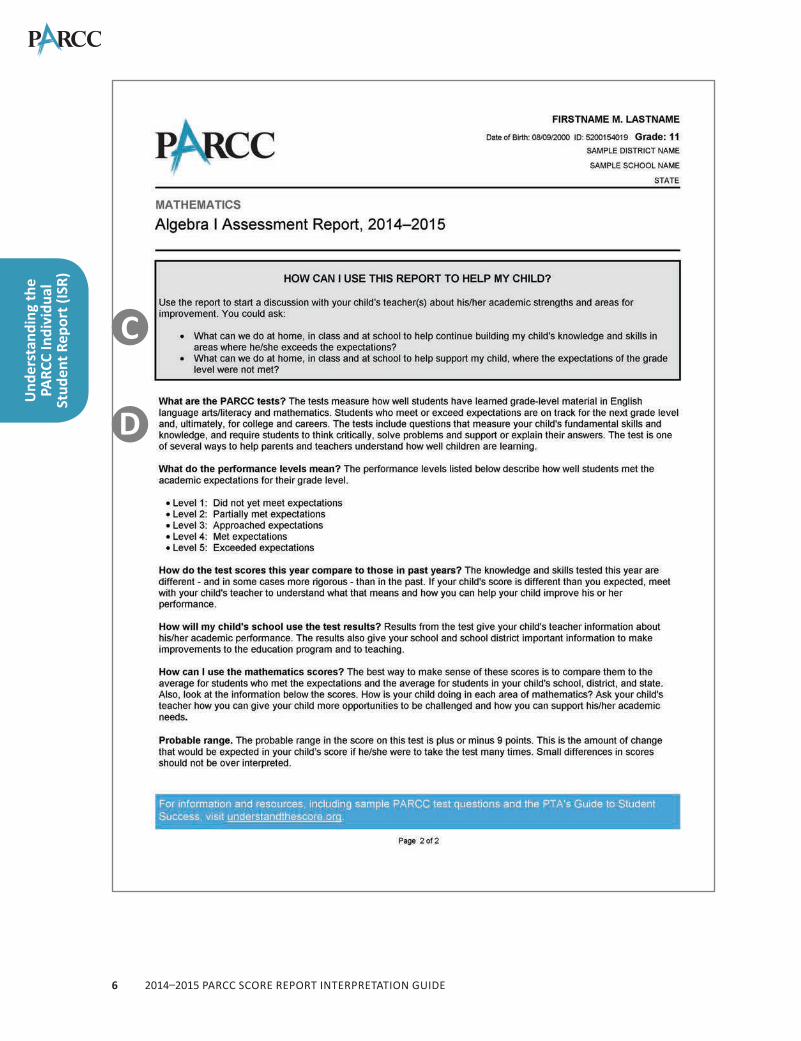
C. How to Use the ReportThis section provides direction for how parents can use the report to start a discussion with their child’s teacher(s). It is important for parents and educators to have regular check-ins to ensure students are learning the necessary skills to stay on track. Parents can use the information in the report to understand their child’s strengths and needs and to work with educators to identify resources to support his or her education.
D. Explanation of Individual Student Report The second page of the report provides information regarding the assessment and report, including:
•• Description of PARCC tests•• Performance Level names•• How test scores this year compare to test scores in past years •• How results are used by the school•• How parents can use the scores•• The probable range of scores
•■ The probable range is based on the standard error of measurement, which reflects the variability that would be expected in a student’s score if he/she were to take multiple administrations of the assessment. The probable range of scores differs across forms and across level of performance within forms.
2.4.2 Overall Assessment Scores
E. Overall Scale Score and Performance LevelThis section of the report provides the student’s overall scale score and Performance Level (refer to Section 2.1). Students receive a numerical overall scale score and, based on that score, are ranked in one of five Performance Levels, with Level 5 indicating the student exceeded expectations and Level 1 indicating the student did not yet meet expectations.
F. Graphical Representation of Overall Performance: Overall Scale Score and Performance LevelThis graphic provides an illustration of the five Performance Levels and where the student’s overall scale score is positioned along the performance scale. The student’s score is indicated by the black dot positioned along the range of overall scale scores that define each Performance Level. The ranges of overall scale scores are indicated at the top of the graphic. The scale score needed to reach Performance Level 2 is 700, for Performance Level 3 it is 725, and for Performance Level 4 it is 750 for all grade levels/courses in both ELA/L and mathematics. The scale score needed to reach Performance Level 5 varies. Refer to Appendix A for the full list of scale score ranges for each Performance Level.
2014–2015 PARCC SCoRe RePoRt inteRPRetAtion guide8
Und
erst
andi
ng th
e PA
RCC
Indi
vidu
al
Stud
ent R
epor
t (IS
R)
G. Average of School, District, State, and PARCCThe average overall scale scores of the school, district, state, and PARCC consortium are shown below the overall scale score and Performance Level graphic. This allows for comparing a student’s overall scale score to the average overall scale score of students at the school, district, state, and PARCC consortium levels for the same grade level/course and content area.
2.4.3 Performance by Reporting CategoryNote: For mathematics, reporting categories are not included. For this reason, there are no markers for H and I on the sample Mathematics ISR.
H. Reporting CategoryFor English language arts/literacy, there are two reporting categories, Reading and Writing. The bold heading indicates the claim (Reading or Writing) being reported.
I. Performance by Reporting Category Scale ScoreFor English language arts/literacy, student performance for each reporting category is provided as a scale score (refer to Section 2.1.1) on a different scale from the overall scale score. For this reason, the sum of the scale scores for each reporting category will not equal the overall scale score. For reference, this section includes the range of possible scale scores for each reporting category (i.e., 10–90 for Reading and 10–60 for Writing).
Important to the PARCC assessments is the ability to compare student performance to a variety of reference points. Listed to the right of the individual student’s scale score are the average scale scores of all students in the same grade at the school, district, and state levels. The “Average of students just meeting expectations” is the scale score in Reading/Writing that students who just achieve Level 4 on the entire test are expected to obtain.
2.4.4 Performance by Subclaim Category
J. Subclaim CategoryWithin each reporting category for English language arts/literacy are specific skill sets (subclaims) students demonstrate on the PARCC assessments. Subclaims are provided for mathematics but are not listed under reporting categories as they are for English language arts/literacy. Each subclaim category includes the header identifying the subclaim, an explanatory icon representing the student’s performance, and an explanation of whether students have met the expectations of the subclaim.
K. Subclaim Performance IndicatorsA student’s subclaim indicator represents how well the student performed in a subclaim category relative to how well the reference group performed in that same subclaim category.
Subclaim categories are not reported using scale scores or Performance Levels.
To determine a student’s subclaim performance, the performance of all students in the PARCC consortium taking the same test form whose overall scale score identified them as having just achieved Performance Level 3 (i.e., overall scale score = 725) or having just achieved Performance Level 4 (i.e., overall scale score = 750) were considered, as described below. Once these reference groups were identified, their average performance in each subclaim was noted.
•• Below Expections – represented by a down arrow•• Nearly Meets Expectations – represented by a bidirectional arrow•• Meets or Exceeds Expectations – represented by an up arrow

2014–2015 PARCC SCoRe RePoRt inteRPRetAtion guide 9
Understanding the
PARCC School and District Reports
L. Description of Subclaim Performance Indicator GraphicsStudent performance for each subclaim is marked with a subclaim performance indicator.
•• An up arrow for the specified subclaim for “Meets or Exceeds Expectations” indicates that the student’s performance for the subclaim was equal to or better than the average performance of students who just achieve Performance Level 4 (i.e., students whose overall scale score is 750).
•• A bidirectional arrow for the specified subclaim for “Nearly Meets Expectations” indicates that the student's performance was below the average performance of students who just achieve Performance Level 4 (i.e., students whose overall scale score is 750) but better than or equal to the average performance of students who just achieve Performance Level 3 (i.e., students whose overall scale score is 725).
•• A down arrow for the specified subclaim for “Below Expectations” indicates that the student’s performance for the subclaim was below the average performance for students who just achieve Performance Level 3 (i.e., students whose overall scale score is 725).

2014–2015 PARCC SCoRe RePoRt inteRPRetAtion guide10
Und
erst
andi
ng th
ePA
RCC
Scho
ol a
nd
Dist
rict R
epor
ts
3.0 Understanding the PARCC School and District Reports
3.1 Purpose and Use of PARCC Results The primary purpose of PARCC is to provide high-quality assessments to measure students’ progress toward college and career readiness. PARCC results are a helpful tool in evaluating educational programs and student progress. These reports:
•• Summarize student achievement•• Describe student performance relative to meeting standards•• Support improvement planning (e.g., prioritize professional learning and resource decisions,
advise program alignment with academic standards, reflect on the effectiveness of school initiatives)
3.2 PARCC School and District ReportsIn addition to Individual Student Reports, schools will receive a Student Roster Report, and districts will receive a District Summary of Schools Report. These reports summarize how students in the school or district performed and are described later in this section.
3.2.1 Types of Scores on the PARCC School and District ReportsPerformance on PARCC assessments is described on the school and district reports using scale scores, Performance Levels, and subclaim performance indicators. Information about PARCC, state, district, and school average results is included in relevant sections of the report to help schools and districts understand how student and school performance compares to other students and schools. A dash (–) will appear on the report when there are too few students in a school to maintain student privacy and still report the school’s results.
3.2.2 Scale ScoreA scale score is a numerical value that summarizes student performance. Not all students respond to the same set of questions, so each student’s raw score (actual points earned on test items) is adjusted for the slight differences in difficulty among the various forms and administrations of the test. The resulting scale score allows for an accurate comparison across test forms and administration years within a grade or course and subject area. PARCC reports provide overall scale scores for English language arts/literacy and mathematics, which determine a student’s Performance Level, as described below. Additionally, PARCC English language arts/literacy reports provide separate scale scores for both Reading and Writing.
For example, a student who earns an overall scale score of 800 on one form of the grade 8 mathematics assessment would be expected to earn an overall scale score of 800 on any other form of the grade 8 mathematics assessment. Furthermore, the student’s overall scale score and level of mastery of concepts and skills would be comparable to a student who took the same assessment the previous year or following year.
3.2.3 Performance LevelEach Performance Level is a broad, categorical level defined by a student’s overall scale score and used to report overall student performance by describing how well students met the expectations for their grade level/course. Each Performance Level is defined by a range of overall scale scores for the assessment. There are five Performance Levels for PARCC assessments:
•• Level 1: Did not yet meet expectations•• Level 2: Partially met expectations•• Level 3: Approached expectations•• Level 4: Met expectations•• Level 5: Exceeded expectations
2014–2015 PARCC SCoRe RePoRt inteRPRetAtion guide 11
Understanding the
PARCC School and District Reports
Students whose performance on the assessment placed them at levels 4 and 5 met or exceeded expectations, have demonstrated readiness for the next grade level/course and, ultimately, are on track for college and careers.
Performance Level Descriptors (PLDs) describe the knowledge, skills, and practices that students should know and be able to demonstrate at each Performance Level in each content area (ELA/L and mathematics), and at each grade level/course. PLDs are available at http://avocet.pearson.com/PARCC/Home.
3.2.4 Subclaim Performance IndicatorsSubclaim performance for PARCC assessments is reported using graphical representations that indicate how the student performed relative to the overall performance of students who met or nearly met expectations for the content area. Students may have subclaim performance indicators of:
•• Below Expectations – represented by a down arrow•• Nearly Meets Expectations – represented by a bidirectional arrow•• Meets or Exceeds Expectations – represented by an up arrow
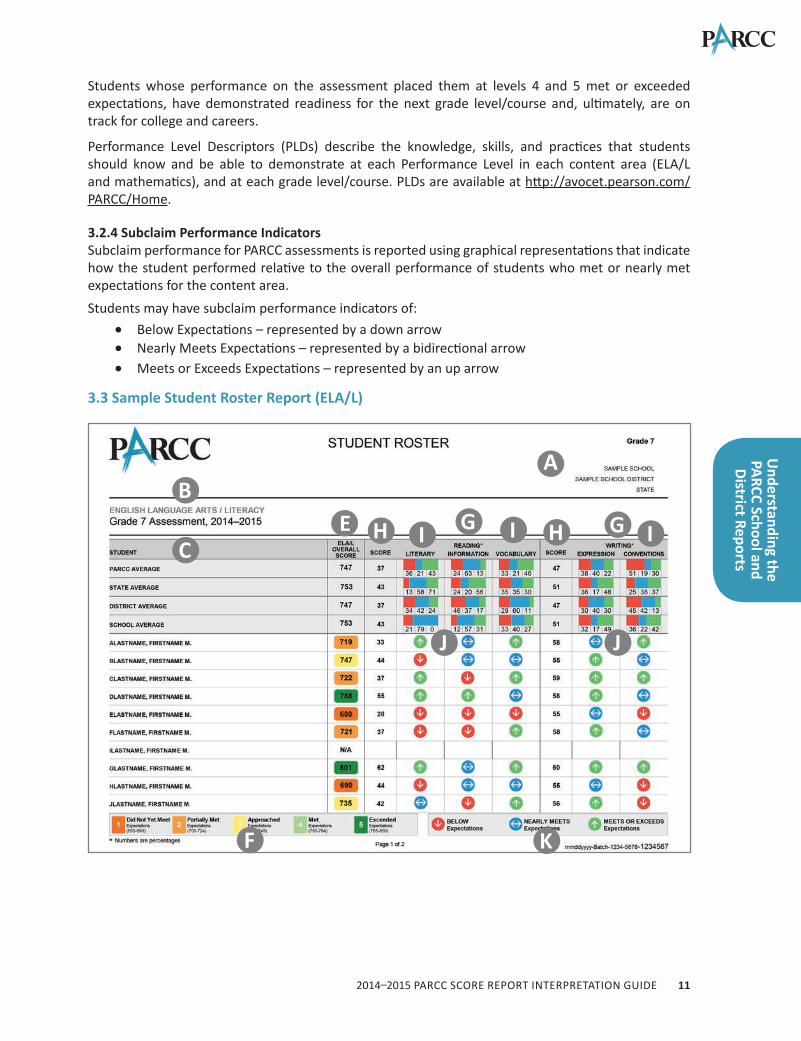
3.3 Sample Student Roster Report (ELA/L)
AB
CE G HI
F K
H I G I
J J
2014–2015 PARCC SCoRe RePoRt inteRPRetAtion guide12
Und
erst
andi
ng th
ePA
RCC
Scho
ol a
nd
Dist
rict R
epor
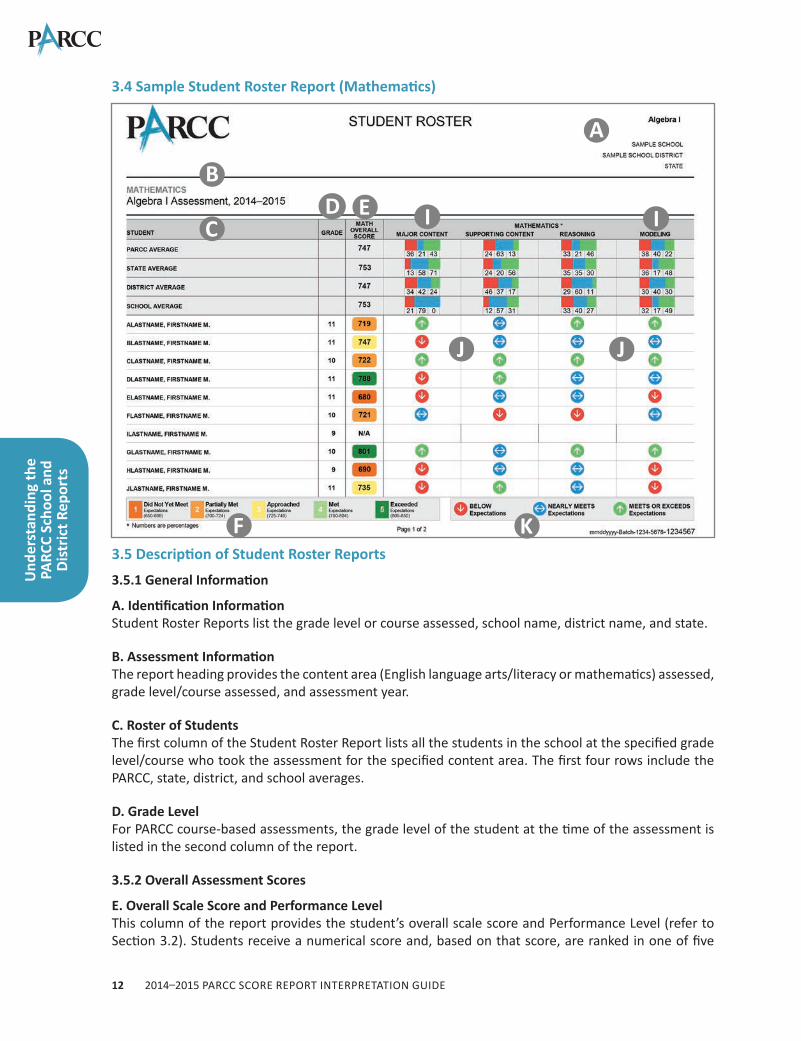
ts3.4 Sample Student Roster Report (Mathematics)
3.5 Description of Student Roster Reports
3.5.1 General Information
A. Identification InformationStudent Roster Reports list the grade level or course assessed, school name, district name, and state.
B. Assessment InformationThe report heading provides the content area (English language arts/literacy or mathematics) assessed, grade level/course assessed, and assessment year.
C. Roster of StudentsThe first column of the Student Roster Report lists all the students in the school at the specified grade level/course who took the assessment for the specified content area. The first four rows include the PARCC, state, district, and school averages.
D. Grade LevelFor PARCC course-based assessments, the grade level of the student at the time of the assessment is listed in the second column of the report.
3.5.2 Overall Assessment Scores
E. Overall Scale Score and Performance LevelThis column of the report provides the student’s overall scale score and Performance Level (refer to Section 3.2). Students receive a numerical score and, based on that score, are ranked in one of five
A
B
CD E I
J
F K
I
J
2014–2015 PARCC SCoRe RePoRt inteRPRetAtion guide 13
Understanding the
PARCC School and District Reports
Performance Levels, with Level 5 indicating the student exceeded expectations and Level 1 indicating the student has not yet met expectations. Performance Levels are indicated by the color highlighting behind the number. Refer to F for the color key.
Note: The first four rows contain PARCC, state, district, and school averages.
F. Description of Performance Level GraphicsThis graphic provides a colored illustration of the five Performance Levels and helps to quickly show the Performance Level for each student's scale score.
3.5.3 Performance by Reporting CategoryNote: For mathematics, reporting categories are not included. For this reason, there are no markers for G and H on the sample Mathematics Student Roster Report.
G. Reporting CategoryFor English language arts/literacy, there are two reporting categories, Reading and Writing. The bold heading indicates the claim (Reading and Writing) being reported.
H. Performance by Reporting Category Scale ScoreFor English language arts/literacy, student performance for each reporting category is provided as a scale score (refer to Section 2.1.1) on a different scale from the overall scale score. For this reason, the sum of the scale scores for each reporting category will not equal the overall scale score. The first four rows contain PARCC, state, district, and school averages.
Important to the PARCC assessments is the ability to compare student performance to a variety of reference points. By reviewing each column, student scores can quickly be compared to the averages.
3.5.4 Performance by Subclaim Category
I. Subclaim Categories Within each reporting category for English language arts/literacy are specific skill sets (subclaims) students demonstrate on the PARCC assessments. Subclaims are provided for mathematics but are not listed under reporting categories as they are for English language arts/literacy. Each subclaim category includes the header identifying the subclaim; PARCC, state, district, and school averages; and an explanatory icon representing the student’s performance.
J. Subclaim Performance IndicatorsA student’s subclaim indicator represents how well the student performed in a subclaim category relative to how well the reference group performed in that same subclaim category.
Subclaim categories are not reported using scale scores or Performance Levels.
To determine a student’s subclaim performance, the performance of all students in the PARCC consortium taking the same test form whose overall scale score identified them as having just achieved Performance Level 3 (i.e., overall scale score = 725) or having just achieved Performance Level 4 (i.e., overall scale score = 750) were considered, as described below. Once these reference groups were identified, their average performance in each subclaim was noted.
•• Below Expections – represented by a down arrow•• Nearly Meets Expectations – represented by a bidirectional arrow•• Meets or Exceeds Expectations – represented by an up arrow
PARCC, state, district, and school subclaim performance in the first four rows is reported by the percentage (both graphically and numerically) of students who are below, nearly meet, or meet/exceed
2014–2015 PARCC SCoRe RePoRt inteRPRetAtion guide14
Und
erst
andi
ng th
ePA
RCC
Scho
ol a
nd
Dist
rict R
epor
tsexpectations. The numerical values appearing below the graph indicate the percentage of students performing at the Below Expectations, Nearly Meets Expectations, and Meets or Exceeds Expectations levels from left to right, respectively. Due to rounding, percentages may not total 100%.
Note: In most cases, numbers will NOT appear directly under each color.
K. Description of Subclaim Performance GraphicsStudent performance for each subclaim is marked with a subclaim performance indicator.
•• An up arrow for the specified subclaim for “Meets or Exceeds Expectations” indicates that the student’s performance for the subclaim was equal to or better than the average performance of students who just achieve Performance Level 4 (i.e., students whose overall scale score is 750).
•• A bidirectional arrow for the specified subclaim for “Nearly Meets Expectations” indicates that the student’s performance was below the average performance of students who just achieve Performance Level 4 (i.e., students whose overall scale score is 750) but better than or equal to the average performance of students who just achieve Performance Level 3 (i.e., students whose overall scale score is 725).
•• A down arrow for the specified subclaim for “Below Expectations” indicates that the student’s performance for the subclaim was below the average performance for students who just achieve Performance Level 3 (i.e., students whose overall scale score is 725).
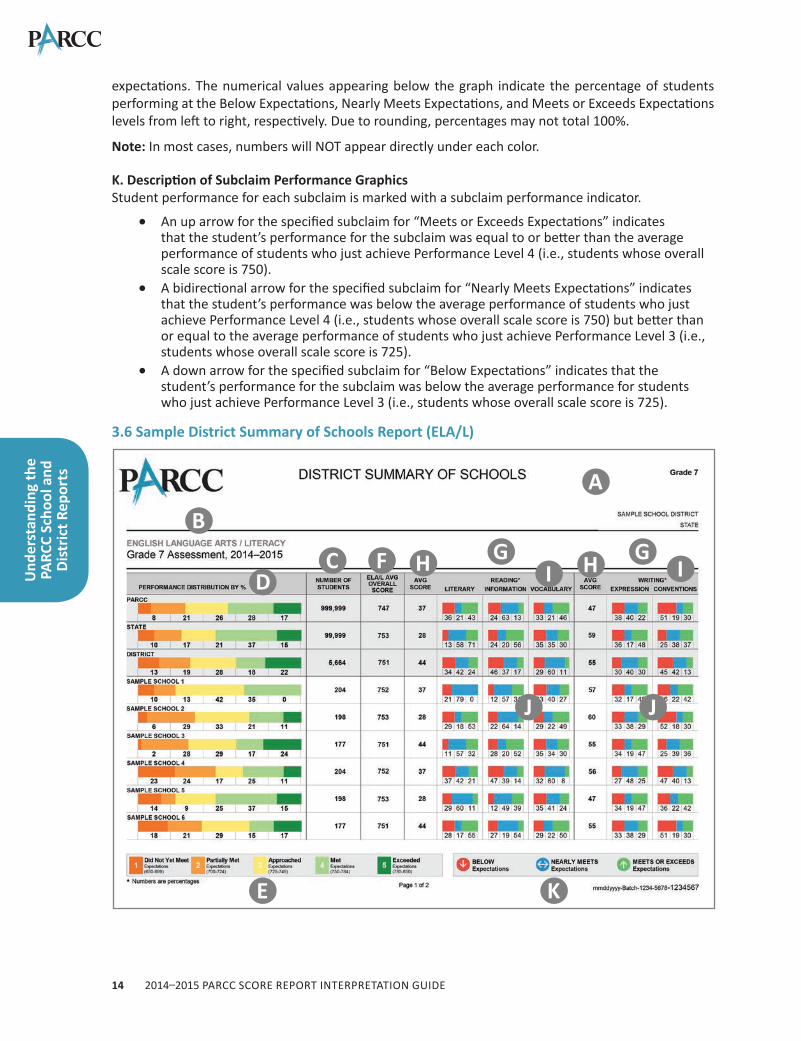
3.6 Sample District Summary of Schools Report (ELA/L)
A
B
CD
F GH I
E K
H
J
IG
J

2014–2015 PARCC SCoRe RePoRt inteRPRetAtion guide 15
Understanding the
PARCC School and District Reports
3.7 Sample District Summary of School Report (Mathematics)
3.8 Description of District Summary of Schools Reports
3.8.1 General Information
A. Identification InformationDistrict Summary of Schools Reports list the grade level/course, district name, and state.
B. Assessment InformationThe report heading provides the content area (English language arts/literacy or mathematics) assessed, grade level/course, and assessment year.
C. Number of StudentsThe first three rows contain the number of assessed students for the PARCC consortium, state, and district. Subsequent rows contain the number of students assessed at each school within the district.
3.8.2 Overall Assessment Scores
D. Percentage of Students at Each Performance LevelThe first column of the report shows the distribution of students achieving each Performance Level— indicated both graphically and numerically. Each colored section of the graph represents a Performance Level, beginning with Level 1 on the left through Level 5 on the right. The numerical values appearing below the graph indicate the percentage of overall scale scores in Performance Levels 1 through 5, left to right repectively. Due to rounding, percentages may not total 100%.
AB
CD
F
J
I
E K
I
2014–2015 PARCC SCoRe RePoRt inteRPRetAtion guide16
Und
erst
andi
ng th
ePA
RCC
Scho
ol a
nd
Dist
rict R
epor
tsNote: In most cases, numbers will NOT appear directly under each color.
The name of the school is listed in each row above the graph.
E. Description of Performance Level GraphicsThis graphic provides a colored illustration of the five Performance Levels and helps to quickly show the percentage of students in each Performance Level.
F. Average Overall Scale ScoreThis column of the report provides the average overall scale score (refer to Section 3.2) for all students assessed at the school for the specified assessment on the report.
Note: The first three rows contain PARCC, state, and district averages.
3.8.3 Performance by Reporting CategoryNote: For mathematics, reporting categories are not included. For this reason, there are no markers for G and H on the sample Mathematics District Summary of Schools Report.
G. Reporting CategoryFor English language arts/literacy, there are two reporting categories, Reading and Writing. The bold heading indicates the claim (Reading and Writing) being reported.
H. Performance by Reporting Category Scale ScoreFor English language arts/literacy, student performance for each reporting category is provided as a scale score (refer to Section 3.2) on a different scale from the overall scale score. For this reason, the sum of the average scale scores for each reporting category will not equal the average overall scale score. The first three rows contain PARCC, state, and district averages. The remaining rows contain the school averages.
Important to the PARCC assessments is the ability to compare performance across many levels. By reviewing the average overall scale score column, school data can quickly be compared to the district, state, and PARCC averages.
3.8.4 Performance by Subclaim Category
I. Subclaim Category Within each reporting category are specific skill sets (subclaims) students demonstrate on the PARCC assessments. Each subclaim category includes the column header identifying the subclaim, as well as PARCC, state, district, and school averages.
J. Subclaim Performance IndicatorsSubclaim indicators represents how well students performed in a subclaim category relative to how well the reference group performed in that same subclaim category.
Subclaim categories are not reported using scale scores or Performance Levels.
To determine a student’s subclaim performance, the performance of all students in the PARCC consortium taking the same test form whose overall scale score identified them as having just achieved Performance Level 3 (i.e., overall scale score = 725) or having just achieved Performance Level 4 (i.e., overall scale score = 750) were considered, as described below. Once these reference groups were identified, their average performance in each subclaim was noted.
•• Below Expections – represented by a red down arrow•• Nearly Meets Expectations – represented by a blue bidirectional arrow•• Meets or Exceeds Expectations – represented by a green up arrow

2014–2015 PARCC SCoRe RePoRt inteRPRetAtion guide 17
Understanding the
PARCC School and District Reports
On District Summary of Schools Reports, subclaim performance for PARCC, the state, district, and schools is reported by the percentage (both graphically and numerically) of students who are below, nearly meet, or meet/exceed expectations. The numerical values appearing below the graph indicate the percentage of students performing at the Below Expectations, Nearly Meets Expectations, and Meets or Exceeds Expectations levels from left to right, respectively. Due to rounding, percentages may not total 100%.
Note: In most cases, numbers will NOT appear directly under each color.
K. Description of Subclaim Performance GraphicsStudent performance for each subclaim is illustrated with an explanatory icon. For District Summary of Schools Reports only the colors of the icons are used in the graphical representation under each subclaim.
•• The green section (right section) of the graph for the specified subclaim for “Meets or Exceeds Expectations” indicates that the students’ performance for the subclaim was equal to or better than the average performance of students who just achieve Performance Level 4 (i.e., students whose overall scale score is 750).
•• The blue section (middle section) of the graph for the specified subclaim for “Nearly Meets Expectations” indicates that the student’s performance was below the average performance of students who just achieve Performance Level 4 (i.e., students whose overall scale score is 750) but better than or equal to the average performance of students who just achieve Performance Level 3 (i.e., students whose overall scale score is 725).
•• The red section (left section) of the graph for the specified subclaim for “Below Expectations” indicates that the students’ performance for the subclaim was below the average performance for students who just achieve Performance Level 3 (i.e., students whose overall scale score is 725).
2014–2015 PARCC SCoRe RePoRt inteRPRetAtion guide18
Appe
ndix
Appendix A
Scale Score Ranges

2014–2015 PARCC SCoRe RePoRt inteRPRetAtion guide 19
Appendix
Grade 3 ELA/LLevel 1 Cut 650 Level 1 Range 650-699Level 2 Cut 700 Level 2 Range 700-724Level 3 Cut 725 Level 3 Range 725-749Level 4 Cut 750 Level 4 Range 750-809Level 5 Cut 810 Level 5 Range 810-850
Grade 4 ELA/LLevel 1 Cut 650 Level 1 Range 650-699Level 2 Cut 700 Level 2 Range 700-724Level 3 Cut 725 Level 3 Range 725-749Level 4 Cut 750 Level 4 Range 750-789Level 5 Cut 790 Level 5 Range 790-850
Grade 5 ELA/LLevel 1 Cut 650 Level 1 Range 650-699Level 2 Cut 700 Level 2 Range 700-724Level 3 Cut 725 Level 3 Range 725-749Level 4 Cut 750 Level 4 Range 750-798Level 5 Cut 799 Level 5 Range 799-850
Grade 6 ELA/LLevel 1 Cut 650 Level 1 Range 650-699Level 2 Cut 700 Level 2 Range 700-724Level 3 Cut 725 Level 3 Range 725-749Level 4 Cut 750 Level 4 Range 750-789Level 5 Cut 790 Level 5 Range 790-850
Grade 7 ELA/LLevel 1 Cut 650 Level 1 Range 650-699Level 2 Cut 700 Level 2 Range 700-724Level 3 Cut 725 Level 3 Range 725-749Level 4 Cut 750 Level 4 Range 750-784Level 5 Cut 785 Level 5 Range 785-850
Grade 8 ELA/LLevel 1 Cut 650 Level 1 Range 650-699Level 2 Cut 700 Level 2 Range 700-724Level 3 Cut 725 Level 3 Range 725-749Level 4 Cut 750 Level 4 Range 750-793Level 5 Cut 794 Level 5 Range 794-850
2014–2015 PARCC SCoRe RePoRt inteRPRetAtion guide20
Appe
ndix
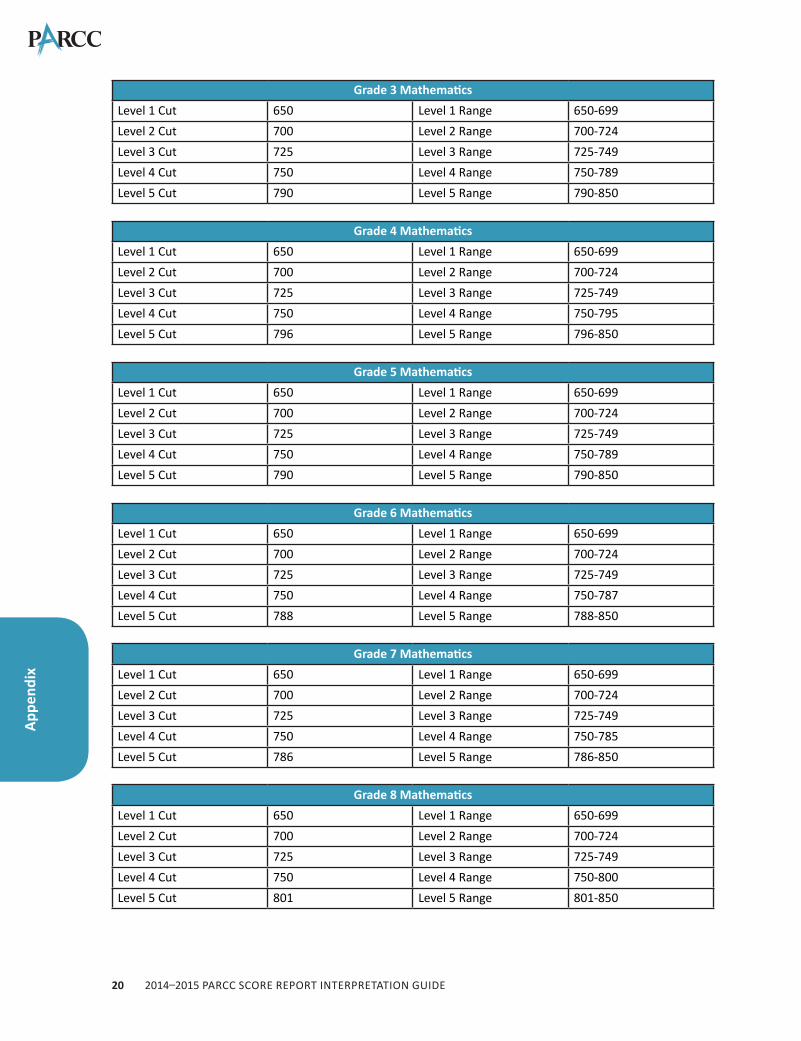
Grade 3 MathematicsLevel 1 Cut 650 Level 1 Range 650-699Level 2 Cut 700 Level 2 Range 700-724Level 3 Cut 725 Level 3 Range 725-749Level 4 Cut 750 Level 4 Range 750-789Level 5 Cut 790 Level 5 Range 790-850
Grade 4 MathematicsLevel 1 Cut 650 Level 1 Range 650-699Level 2 Cut 700 Level 2 Range 700-724Level 3 Cut 725 Level 3 Range 725-749Level 4 Cut 750 Level 4 Range 750-795Level 5 Cut 796 Level 5 Range 796-850
Grade 5 MathematicsLevel 1 Cut 650 Level 1 Range 650-699Level 2 Cut 700 Level 2 Range 700-724Level 3 Cut 725 Level 3 Range 725-749Level 4 Cut 750 Level 4 Range 750-789Level 5 Cut 790 Level 5 Range 790-850
Grade 6 MathematicsLevel 1 Cut 650 Level 1 Range 650-699Level 2 Cut 700 Level 2 Range 700-724Level 3 Cut 725 Level 3 Range 725-749Level 4 Cut 750 Level 4 Range 750-787Level 5 Cut 788 Level 5 Range 788-850
Grade 7 MathematicsLevel 1 Cut 650 Level 1 Range 650-699Level 2 Cut 700 Level 2 Range 700-724Level 3 Cut 725 Level 3 Range 725-749Level 4 Cut 750 Level 4 Range 750-785Level 5 Cut 786 Level 5 Range 786-850
Grade 8 MathematicsLevel 1 Cut 650 Level 1 Range 650-699Level 2 Cut 700 Level 2 Range 700-724Level 3 Cut 725 Level 3 Range 725-749Level 4 Cut 750 Level 4 Range 750-800Level 5 Cut 801 Level 5 Range 801-850

2014–2015 PARCC SCoRe RePoRt inteRPRetAtion guide 21
Appendix
Algebra ILevel 1 Cut 650 Level 1 Range 650-699Level 2 Cut 700 Level 2 Range 700-724Level 3 Cut 725 Level 3 Range 725-749Level 4 Cut 750 Level 4 Range 750-804Level 5 Cut 805 Level 5 Range 805-850
Algebra IILevel 1 Cut 650 Level 1 Range 650-699Level 2 Cut 700 Level 2 Range 700-724Level 3 Cut 725 Level 3 Range 725-749Level 4 Cut 750 Level 4 Range 750-807Level 5 Cut 808 Level 5 Range 808-850
GeometryLevel 1 Cut 650 Level 1 Range 650-699Level 2 Cut 700 Level 2 Range 700-724Level 3 Cut 725 Level 3 Range 725-749Level 4 Cut 750 Level 4 Range 750-782Level 5 Cut 783 Level 5 Range 783-850
Integrated Mathematics ILevel 1 Cut 650 Level 1 Range 650-699Level 2 Cut 700 Level 2 Range 700-724Level 3 Cut 725 Level 3 Range 725-749Level 4 Cut 750 Level 4 Range 750-798Level 5 Cut 799 Level 5 Range 799-850
Integrated Mathematics IILevel 1 Cut 650 Level 1 Range 650-699Level 2 Cut 700 Level 2 Range 700-724Level 3 Cut 725 Level 3 Range 725-749Level 4 Cut 750 Level 4 Range 750-784Level 5 Cut 785 Level 5 Range 785-850
Integrated Mathematics IIILevel 1 Cut 650 Level 1 Range 650-699Level 2 Cut 700 Level 2 Range 700-724Level 3 Cut 725 Level 3 Range 725-749Level 4 Cut 750 Level 4 Range 750-803Level 5 Cut 804 Level 5 Range 804-850
2014–2015 PARCC SCoRe RePoRt inteRPRetAtion guide22
Appe
ndix
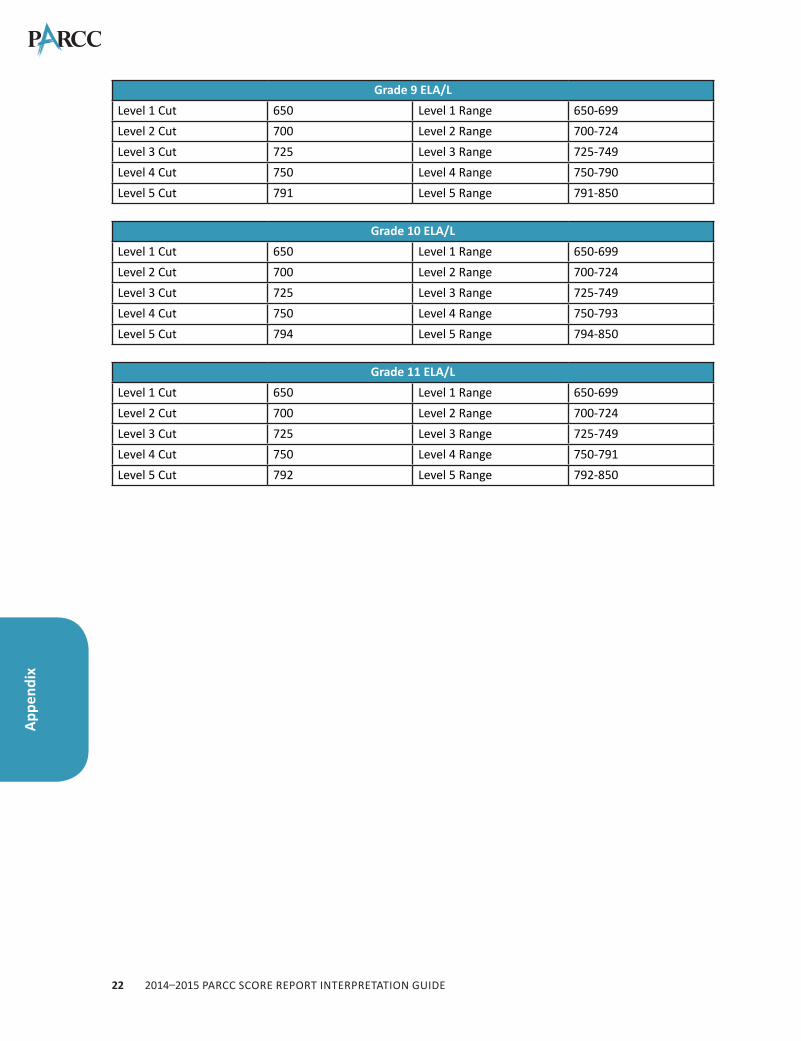
Grade 9 ELA/LLevel 1 Cut 650 Level 1 Range 650-699Level 2 Cut 700 Level 2 Range 700-724Level 3 Cut 725 Level 3 Range 725-749Level 4 Cut 750 Level 4 Range 750-790Level 5 Cut 791 Level 5 Range 791-850
Grade 10 ELA/LLevel 1 Cut 650 Level 1 Range 650-699Level 2 Cut 700 Level 2 Range 700-724Level 3 Cut 725 Level 3 Range 725-749Level 4 Cut 750 Level 4 Range 750-793Level 5 Cut 794 Level 5 Range 794-850
Grade 11 ELA/LLevel 1 Cut 650 Level 1 Range 650-699Level 2 Cut 700 Level 2 Range 700-724Level 3 Cut 725 Level 3 Range 725-749Level 4 Cut 750 Level 4 Range 750-791Level 5 Cut 792 Level 5 Range 792-850
2014–2015 PARCC SCoRe RePoRt inteRPRetAtion guide 23
Appendix
Appendix B
Performance Level Descriptors
2014–2015 PARCC SCoRe RePoRt inteRPRetAtion guide24
Appe
ndix
Performance Level DescriptorsGrades 3–11 English Language Arts/LiteracyPLDs for grades 3–11 English language arts/literacy are available at http://avocet.pearson.com/PARCC/Home.
Grades 3–8 MathematicsPLDs for grades 3–8 mathematics are available at http://avocet.pearson.com/PARCC/Home.
Algebra I, Algebra II, Geometry, Integrated Math I, II, and IIPLDs for high school mathematics courses are available at http://avocet.pearson.com/PARCC/Home.
2014–2015 PARCC SCoRe RePoRt inteRPRetAtion guide 25
Appendix
