scoping and specifying a dual economic ... and specifying a dual economic analysis of forestry in...
TRANSCRIPT

SCOPING AND SPECIFYING A DUAL
ECONOMIC ANALYSIS OF FORESTRY IN
SCOTLAND AND SCOTLAND’S NATIONAL
FOREST ESTATE
Final report for the Forestry Commission
July 2013

Dual economic analysis
Scoping and Specifying a Dual Economic
Analysis of Forestry in Scotland and
Scotland’s National Forest Estate
Final Report
CJC Consulting
in association with
Steve Westbrook Economist
July 2013
CJC Consulting Ltd
45 Southmoor Road
Oxford OX2 6RF
Tel: 01865 310088
M: 07884436514
Email: [email protected]
Email: [email protected]
www.cjcconsulting.co.uk

Dual economic analysis
2
CONTENTS
1 INTRODUCTION AND OBJECTIVES ............................................. 1
1.1 Background .................................................................................................................................. 1 1.2 Scoping study objectives ............................................................................................................. 3 1.3 Defining the Scottish forestry sector ............................................................................................ 3
2 ECONOMIC CONTRIBUTION AND ECONOMIC ANALYSIS ........ 5
2.1 The economic contribution of forestry and woodlands ................................................................ 5 2.2 Economic analysis of the forestry sector ..................................................................................... 6 2.3 Conclusion ................................................................................................................................... 7
3 SECTORAL ESTIMATION OF EMPLOYMENT AND INCOME ..... 8
3.1 Measuring sectoral contributions ................................................................................................. 8 3.2 Area under woodland ................................................................................................................... 8 3.3 Timber production ........................................................................................................................ 9 3.4 Contribution of forestry to employment and the economy ........................................................... 9 3.5 Input-output models ................................................................................................................... 10 3.6 Disaggregation ........................................................................................................................... 11 3.7 Other forest-related contributions to the economy .................................................................... 12 3.8 Non-timber wood outputs ........................................................................................................... 12 3.9 Communities, recreation, tourism and environment .................................................................. 12 3.10 Other activities linked to forest land ........................................................................................... 15
4 REGIONAL ESTIMATION OF EMPLOYMENT AND INCOME ... 17
4.1 Introduction ................................................................................................................................ 17 4.2 Forestry in Moray ....................................................................................................................... 17 4.3 Regional multipliers ................................................................................................................... 18 4.4 Conclusion ................................................................................................................................. 18
5 DATA SOURCES AND ESTIMATES OF FORESTRY-RELATED EMPLOYMENT AND INCOME ........................................................... 20
5.1 FES/FCS data sources .............................................................................................................. 20 5.2 Forestry sector employment ...................................................................................................... 20 5.3 Forestry sector Gross Value Added .......................................................................................... 25 5.4 Trends in Employment and GVA ............................................................................................... 27 5.5 Employment and GVA: conclusions .......................................................................................... 28 5.6 More recent data sources .......................................................................................................... 29
6 OPTIONS FOR ANALYSIS OF THE FORESTRY SECTOR AND THE NFE ...................................................................................................... 31
6.1 Introduction ................................................................................................................................ 31 6.2 Options for assessing impacts for the forestry sector ............................................................... 31 6.3 Options for the NFE/FES ........................................................................................................... 35 6.4 Potential for linking the research for the two studies ................................................................. 39 6.5 Potential for collaboration with Scottish Enterprise and HIE ..................................................... 40

Dual economic analysis
1
1 Introduction and objectives 1.1 Background
Government economic strategy
The 2011 Scottish government economic strategy1 focussed on strategic priorities to strengthen the recovery, drive sustainable growth and develop a more resilient and adaptable economy. One of the priorities was the transition to a low carbon economy. Although forestry was not specifically mentioned within the strategy it could have a role in driving economic growth and clearly provides a source of renewable energy and a location for wind and hydro power. Forestry is also an option for reducing net greenhouse gas emissions through new woodland planting.
Scottish forestry strategy and indicators
The strategy published in 2006 listed two key indicators2 under the Business development theme:
� Forestry’s contribution to Scottish GDP (value added).
� Employment in the forestry sector.
Forestry Commission Scotland (FCS) plan to update these economic indicators every four years. The indicators were first quantified in the Forest Research 2008 ‘Forestry for People’ report (F4P)3 where five indicators dealt with employment in forestry and the contribution of the forestry sector to Gross Value Added (GVA), as follows:
� Number of people employed in forestry.
� Number of full-time equivalent jobs (FTEs) in forestry.
� Number of FTEs due to forest-related and forest-associated visitor spending.
Full-time equivalent job (FTE)
This employment measure converts part-time jobs to their full-tome equivalent. A full-time employee has an FTE of 1.0, whereas someone working half time would have an FTE of 0.5.
� GVA of forest-related activities and forest-associated visitor spending.
� GVA of forest products and services.
1 http://www.scotland.gov.uk/News/Releases/2011/09/12101424 2 http://www.forestry.gov.uk/forestry/infd-7awmz2 3 http://www.forestry.gov.uk/fr/forestryforpeople

Dual economic analysis
2
Gross Value Added (GVA)
Gross value added is a measure of the value of goods and services produced in an area, industry or sector of an economy. Generally, it is measured by the income generated by the business, industry or sector less their intermediate consumption of goods and services used up in order to produce their output, labour costs (for example, wages and salaries) and an operating surplus (or loss). The latter is a good approximation for profits prior to payment of any profits tax, from which the cost of capital investment, financial charges and the payment of dividends to shareholders are met.
In the UK’s national accounts GVA is linked to GDP as follows:
GVA +taxes on products –subsidies on products = GDP at market prices
Scottish GDP4 is published at basic prices (excluding taxes and subsidies) and this is identical to GVA. Scottish GDP (GVA) in 2011 was £124billion.
Value Added (individual firm)
For an individual firm (or all businesses in a sector), value added measures the contribution to national output. It can be broadly calculated as:
� The value of sales less the cost of purchases (excluding taxes and subsidies, and depreciation of fixed assets).
Alternatively, value added can be calculated as:
� Employment costs plus operating surplus (before depreciation and business rates are deducted).
FTE employment in forestry is of interest as a regional and national indicator of how labour is allocated in the economy, but employment statistics must be interpreted with care. They reflect resource use in a sector rather than the contribution to the national or regional economy. In particular, a trend towards increasing or decreasing employment in forestry can reflect a number of underlying changes which are of more significance – such as the output of the sector or associated sectors, technological change and improvements to labour productivity.
GVA is significant in national statistics because it is the major determinant of GDP. However, “forestry” as a sector in the national GDP accounts is limited to planting, maintenance, management and harvesting. Only in Input-output models are the inter-linkages between forestry and other sectors accounted for. These aspects are discussed in subsequent chapters.
The National Forest Estate
The F4P study did not separately identify the contribution to the Scottish economy of the national forest estate (NFE) managed by Forest Enterprise Scotland (FES) and FCS. FES not only has a commercial operation based principally on timber production but also delivers a range of benefits to the public including the provision of recreation, biodiversity and community involvement. The last detailed economic assessment of the NFE was in 20045. This was primarily a strategic assessment but noted that the NFE produced an accounting loss which was broadly covered by the value of recreational and environmental benefits (estimated at £40-43m per year).
4 http://www.scotland.gov.uk/Topics/Statistics/Browse/Economy/GDP 5 CJC Consulting (2004). Economic Analysis of the Contribution of the Forest Estate Managed by Forestry Commission Scotland. www.cjcconsulting.co.uk

Dual economic analysis
3
There is a perceived need for an up to date assessment of the NFE contribution to the Scottish economy.
1.2 Scoping study objectives Specifically, the Commission has two requirements for the scoping study:
(i) To update aspects of the 2008 study ‘A valuation of the economic and social contribution of Forestry for People in Scotland’ (F4P)6.
(ii) To provide estimates for the employment and income generated by Scotland’s National Forest Estate (NFE).
The first requirement is to provide options for estimating the:
� Number of people employed and full-time-equivalent jobs associated with all forestry in Scotland, including that attributable to forest-related visitor spending.
� Gross Value-added generated by the sector.
� Income from employment7.
The second requirement is to provide options for estimating the employment and income specifically associated with the NFE. Scoping this second study requires the feasibility of regional analysis to be explored together with an analysis of the following specific activities associated with the NFE:
� Timber production
� Planting and forest management
� Deer management
� Agriculture
� Communities, recreation and tourism
� Renewable energy
� Property, development, sale and acquisitions.
FES publishes annual accounts8 indicating the income and expenditure associated with the management of the NFE. In 2011/12 timber production and forest management produced a net income of £4.1m. Overall, the accounts show a loss of around £30m which is covered by government grant. There is no charge on the capital tied up in the estate.
The direct employment and net income of FES are readily available from FCS. It is the additional knock-on economic effects of operating the NFE on the wider economy that is the main focus of the NFE element of the study.
1.3 Defining the Scottish forestry sector The two studies have different concepts of what constitutes ‘forestry’ and its contribution to the Scottish economy. The F4P study, which is to be updated, defined the sector in terms of types of businesses and other bodies associated with forestry operating in Scotland (Table 1).
The NFE element of the study has a different focus. It is concerned with the economic contribution of the land that comprises the NFE and its management by
6 Forest Research (2008). A valuation of the economic and social contribution of forestry for people in Scotland. http://www.forestry.gov.uk/fr/INFD-6S8CSP 7 agreed as an indicator at the first Steering Group meeting of the scoping study. 8 http://www.forestry.gov.uk/pdf/fcs-annual-accounts-2011-12.pdf/$FILE/fcs-annual-accounts-2011-12.pdf

Dual economic analysis
4
FES. It is therefore focussed on the output of home-grown timber9, includes non-forestry aspects (e.g. agriculture, communities and environment) and elements that were not included in F4P such as renewable energy. The NFE is not therefore a perfect subset of the forestry sector.
Despite these differences between the two elements of the study, however, there could be common ground in which the economic contribution of the NFE is treated in part as a subset of the contribution of the whole sector.
Table 1: F4P sub-sectors
Forest planting and harvesting
Forestry Commission (FC)
FC contractors (except haulage)
FC contractors haulage
Private (non-farm) woodland owners
Forestry companies and contractors
Other forest and wood-related sub-sectors
Farm woodland
Haulage
Wood processing
Pulp and paper
Local authorities
Membership organisations
Research and education
Recreation and tourism (forest-related visitor spending)
Game sector (forest-related)
Neither the F4P definition of the forest sector nor the NFE concurs with the definition of the forestry sector(s) used in the 2009 Scottish Input-output tables10. In this publication, forestry is defined much more restrictively by two sectors:
� Forestry planting.
� Forestry harvesting.
The Input-output table multipliers identify the backward linkages between these and other sectors. FC and FES operations are included in the Input-output tables within the Public administration industry group.
Differences in how forestry as an industry is defined for economic reporting purposes are considered in more detail in Chapter 3.
9 This contrasts with the forestry sector which would include the processing in Scotland of imported wood. 10 //www.scotland.gov.uk/Topics/Statistics/Browse/Economy/Input-Output/Downloads/IO1998-2009latest

Dual economic analysis
5
2 Economic contribution and econom ic analysis 2.1 The economic contribution of forestry and woodland s
In official economic statistics the Scottish government typically describes a sector in terms of its employment and contribution to value added. These measures are central to the first element of this scoping study. However, forestry is a multi-output, multi-benefit activity that contributes to the Scottish economy, environment and society in diverse ways. Only part of its contribution is captured by regarding forestry as an industrial sector which contributes to Scotland’s employment and GVA.
Forests and woodlands make an important contribution to policies for the provision and management of ecosystem services including recreation and health, biodiversity and landscape. The consequence is that forest policy has evolved in recent years in ways which enhance its delivery of benefits to the public. Forests are appreciated as having an increasing role in reducing net carbon emissions and contributing to the supply of renewable energy though biomass and locations for wind and hydro power.
Whilst it has been possible to quantify many of forestry’s non-market contributions in monetary terms, some have proved more difficult to measure (such as the role in energy security and biodiversity protection).
Contribution to employment and GVA
Forestry provides direct employment associated with planting, maintaining and harvesting, and transporting and processing Scottish timber after harvesting. There are indirect effects on the economy through the supply chain and from the multiplier due to spending from the additional income generated through direct and indirect impacts (induced impacts). Where forests are managed with commercial objectives they will normally contribute to the GVA of the sector (especially when trees are felled).
Forests may also provide benefits to agriculture (from shelter and screening) and the role of woodlands in the life cycle of deer (whose economic benefits include deerstalking, deer as part of Scotland’s tourism “product”, and venison). These “gross” contributions, however, do not take into account the possible alternative uses of some of the land on which trees have been planted for agricultural production, game shooting, etc.
F4P estimated the employment supported by the Scottish forestry sector (as defined at 1.3 above) at 10,253-13,190 FTE jobs and the GVA associated with the use of Scottish timber by the Scottish forest sector as £458.6m. These direct impacts do not take include the benefits from venison and deer stalking or from the contribution of forests to tourism.
Environmental and social benefits
The 2011 UK National Ecosystem Assessment11 described the considerable range of ecosystem services supported by woodlands. Many of these services are provided at zero or minimal cost outside the ‘market’ but are valued by the public. They are not captured in annual government accounts but can be valued using appropriate techniques. Willis et al. (2003)12 estimated the value of benefits to the public from recreation, landscape, biodiversity, carbon sequestration and air pollution absorption
11 http://uknea.unep-wcmc.org/Resources/tabid/82/Default.aspx Also see https://www.gov.uk/ecosystems-services 12 Willis K. et al. (2003). The Social and Environmental Benefits of Forests in Great Britain. http://www.forestry.gov.uk/Pdf/Sebreport0703.Pdf/$File/Sebreport0703.Pdf.

Dual economic analysis
6
as £104m13 per year, with recreation and carbon sequestration providing the main benefits. Subsequent studies on the benefits from more specialised recreation and the health benefits14 from greenspace provision suggest that the benefits identified in 2003 by Willis et al. may substantially underestimate the total non-market benefits from forests and woodlands.
The contribution of new planting to the reduction in net CO2e emissions could be considerable if CO2e is priced at the levels indicated by DECC15. This mainly applies to private sector activity since the NFE area is not expanding. CJC Consulting (2009)16 analysed the cost-effectiveness of several woodland types for reducing net CO2e emissions and found that short rotation forestry and harvested coniferous crops were the most cost-effective planting options.
The National Forest Land Scheme17 can provide benefits to communities and NGOs through the right to buy forest land. These will be realised where a community perceives benefits from the woodland either for commercial, environmental or amenity benefits and is able to raise the necessary finance (e.g. through the Scottish Land Fund).
Renewable energy
Forests have an increasing role in the provision of renewable energy. In part this is from biomass supply for heat and power generation. Around 12% of Scottish wood output is now estimated to be used for commercial woodfuel and another 2.5% for firewood. But Scottish forests also provide locations for wind turbines and hydro installations, and landowners, including FCS, can receive income from leases. These activities also generate indirect and induced economic employment and income. Much of this activity is allocated to other sectors in the economy, which results in under-reporting of the forestry contribution in official statistics.
Over and above their economic contribution, these renewable energy sources contribute to the nation’s security of energy supply. The First Minister has indicated18 that “an expansion of green power is essential for Scotland’s energy security, economic prosperity, and environmental sustainability”. The Scottish government aims to obtain 50% of Scotland’s electricity demand from green power by 2015.
2.2 Economic analysis of the forestry sector Forestry is a unique industry in which the time lag between investment (planting) and the major cash element of returns (harvesting) is 40 plus years. This long investment cycle is very difficult to encapsulate within annual accounts (such as those produced by the Scottish government), and means that:
� The original planting will not be captured in conventional Input-output analysis as
13 CJC Consulting (2004) estimated the corresponding value of the NFE to be £40-43m per year. Economic Analysis of the Contribution of the Forest Estate Managed by Forestry Commission Scotland. www.cjcconsulting.co.uk 14 Christie M et al. (2006). Valuing Forest Recreation Activities. http://www.forestry.gov.uk/pdf/VFRFCFinalReportv5.pdf/$file/VFRFCFinalReportv5.pdf CJC Consulting (2005). Economic Benefits of Accessible Green Spaces for Physical and Mental Health: Scoping Study. http://www.forestry.gov.uk/pdf/fchealth10-2final.pdf/$file/fchealth10-2final.pdf 15 DECC (2012). http://www.decc.gov.uk/en/content/cms/about/ec_social_res/iag_guidance/iag_guidance.aspx Table 3 of the 'Guidance tables 1-24' 16 In ADAS (2009). Analysis of policy options for reducing greenhouse gas Emissions from agriculture, forestry and land use: Forestry options. Report to the Forestry Commission. 17 http://www.forestry.gov.uk/forestry/infd-66re5j 18 http://www.scotland.gov.uk/News/Releases/2012/10/Renewables30102012

Dual economic analysis
7
an indirect impact from harvesting or processing.
� Future planting made possible by felling trees on land suitable for re-planting will also not be captured in Input-output analysis.
� There can be an increasing value over time of the stock of trees in Scotland not yet harvested where annual planting exceeds annual harvesting, and where the price per tonne of harvested timber is increasing in real terms (which has been the case recently), or is forecast to increase in the future.
When interpreting national statistics on forest-related employment and GVA, it is also important to appreciate that more businesses will be wholly or partially forest or forest product related than those included in the Standard Industrial Classifications (SICs). In addition, the employment and income benefits from these other categories will also not be included. This consideration is more important for forestry than for most of Scotland’s industries because the sizeable forest area in Scotland plays a role in many aspects of life with limited annual management and maintenance expenditure.
Other impacts from forestry developments and downstream processing (e.g. by major sawmills) that are not normally quantified in economic analysis of the forestry sector are capital investments that include:
� The construction of roads prior to planting or extraction (or the improvement of public roads for timber transport).
� The manufacture and supply of plant, equipment, vehicles, and buildings used in harvesting, transport, processing and renewable energy production (a proportion of this value added will benefit Scotland’s economy).
2.3 Conclusion Forestry is a multi-output activity that contributes both to the national economy and to society in a wide variety of ways. Government economic statistics underestimate the public benefits from forestry and its contribution to policy objectives for environment, recreation, health, tourism and renewable energy.
The long time frame typical of forest investment is difficult to accommodate in annual reporting because of the time lapse between planting and harvest. An investment appraisal framework in which the different economic returns over the life of a forest are analysed would have advantages in assessing forestry’s rate of return.

Dual economic analysis
8
3 Sectoral estimation of employment and income
3.1 Measuring sectoral contributions Studies that measure the income and employment contributions (or impacts) of an activity or policy intervention can take various forms. They are typically geographical in that they aim to measure impacts at local, regional or national levels. They may be associative in that they attempt to measure the impacts associated with current activity. In this case no alternative options are examined. They may be additional in the sense of assessing the net impacts from the defined activity as compared with those expected in the absence of the current activity or intervention, or in relation to a proposed change in policy (what if?).
In this scoping study, changes to the size or management of the forest estate are of less interest than the economic impact of the current estate. It therefore appears most appropriate to take an associative approach and assess what economic activities are associated with forests and associated activity in Scotland. In some cases the associative approach may not be appropriate or may require additional analysis. For example, in estimating impacts from tourism and biomass for energy production there is a case for assessing the additionality of forests given that there are substitution possibilities for forest-associated tourism and for biomass.
The geographical framework for analysis was to be national for both studies and, in addition, regional for the NFE study. The key questions are what the forestry sector and the NFE currently contribute to the economy in Scotland. These impacts will change over time, reflecting changes in the area under forestry and the amount harvested per year, changes to forest technology and management, and changes in prices for inputs and products. However, analysing such longer-term analysis of forestry’s impact was not included in the remit of the scoping study.
3.2 Area under woodland Forests as a physical entity in Scotland can be defined adequately for the purposes of this study by the area recorded in the National Forest Inventory (NFI)19. This is 1,392m20 ha, of which 0.481m ha is Forestry Commission and 0.912m ha in the ‘private’ forest estate’ (PFE). The PFE is defined for convenience as non-NFE land, even though not all of this is in private ownership (for example, some is owned by Local Authorities).
The public estate differs in a number of ways from the private estate. For example, the NFE is 93% conifers and the planted area is static, whereas the private estate area has 37% broadleaves and has expanded over time, mainly due to the planting of trees on farmland21. Whilst the NFE is primarily a forest estate it incorporates unforested land, including land under agriculture and estate management. Also, Forest Enterprise Scotland (FES) engages in activities such as leasing land for wind turbines which have a stronger link to location and topography than to forestry.
There are some differences between the requirements of this scoping study for the impact of the NFE as a business (which includes some activities not usually regarded as falling within the forestry sector) and those of the TFE which would exclude these activities.
19 http://www.forestry.gov.uk/forestry/infd-8eyjwf 20 Forestry Facts and Figures 2012. Forestry Commission. 21 Forestry Facts and Figures 2012. Forestry Commission.

Dual economic analysis
9
Hence in a physical sense we can identify three elements:
� National Inventory forest land in non-NFE ownership (‘private’ forestry) – in as far as this is comprehensively identified. Trees planted on farms might or might not be included.
� National Inventory forest land in NFE ownership
� Other land within the NFE
3.3 Timber production Softwood extraction in Scotland has increased markedly in the past decade, particularly in the private (non-FC/FS) sector. Overall, the increase has been 45% from 2002 reaching 6.31m t in 2011. Purchase of softwood by mills in Scotland has increased steadily to 3.08m t in 201122, a 42% increase from 2002. Softwood supplies are forecast to increase from 8.36m t in 2012-2016 to 12.44mt in 2027-203123.
The production context is thus one of increasing softwood supply and output of processed timber in recent years, a trend which is expected to continue. Utilisation of wood as energy biomass in power generation and combined heat and power plants has grown significantly as part of this increasing trend. The purchase of woodfuel by major users in Scotland is expected to be around 0.85mt in 2013, rising to around 1mt in 201424.
3.4 Contribution of forestry to employment and the eco nomy There are two main ways of measuring employment, income from employment, turnover and/or GVA in a sector of an economy such as Scotland. The first is by modelling the whole economy (by sector) and linking sectors through their interactions. This is most typically done through Input-output modelling (see below) based on data from national surveys on output and employment by sector. Input-output analysis allows identification of direct, indirect and induced impacts due to sectoral activity through Type 1 multipliers (for indirect impacts) and Type 2 multipliers (for indirect and induced impacts). Input-output methodologies are often used to estimate the indirect or indirect plus induced impacts from direct output and/or employment.
Forestry and forest-related activities are distinguished as sectors in a range of government statistics – normally using Standard Industrial Classifications (SICs), which facilitates comparisons across surveys and the blending of the results from different surveys. It is then a question of which forestry-related primary production, manufacturing or service activities are regarded as within the ‘forestry’ sector for the purposes of a particular study.
The Scottish Input-output tables25 have forest planting and forest harvesting as Industry groups. Supply chain linkages within these sectors and with other sectors are taken into account in the tables to enable the total economic effects from activities in these industry groups to be calculated in terms of FTEs and GVA.
The main alternative approach has been to measure direct sectoral employment and income from sectoral surveys. This could be through a census or omnibus survey of
22 Forestry Statistics 2012. Forestry Commission. 23 Forestry Statistics 2012. Forestry Commission. 24 Woodfuel. Demand and usage in Scotland Report 2012 http://www.forestry.gov.uk/forestry/infd-7tdhjn 25 http://www.scotland.gov.uk/Topics/Statistics/Browse/Economy/Input-Output/Downloads

Dual economic analysis
10
the whole population (or a sample of it), or through sectoral or regional surveys. Such approaches in forestry have typically defined the sector as consisting of growers, first hand suppliers and first hand timber processors. Once direct employment and GVA impacts have been assessed through survey, Input-output analysis (see above) could be used to assess indirect or indirect and induced impacts. Also, downstream impacts (i.e. impacts from the use of timber in secondary processing in Scotland) could be assessed for a more complete account of forestry’s contribution towards Scotland’s economic output.
Where sector-specific approaches are used to estimate economic impacts, it is necessary to determine what boundary to place on the forestry sector. This can be done in several ways – by activity, by organisation, or by expenditures. In practice, forestry impacts have usually been restricted to:
� Direct impacts from forest creation, management and timber production (Forestry Commission and other forest owners)
� First round suppliers of services (forest contractors and companies)
� First round processors of Scotland’s forest outputs (selected wood processing companies) – i.e. activity that relates to home-grown timber. Haulage to and/or from the processors might or might not be included.
Forest-related recreation impacts and other non-timber outputs from forests may or may not be analysed as part of Scotland’s forestry impacts in particular studies.
The main rationale for using this approach is practicability. Second and subsequent round impacts are usually difficult and costly in terms of study time to estimate robustly, and these might contribute relatively little to the total impact. However, where second (and further) round employment and income is significantly dependent on Scotland’s forest production this may be included in studies.
One approach which can be applied at national level is to estimate total impacts by applying multiplier estimates based on the national Input-output tables to the direct impacts. However, impacts should not be double-counted.
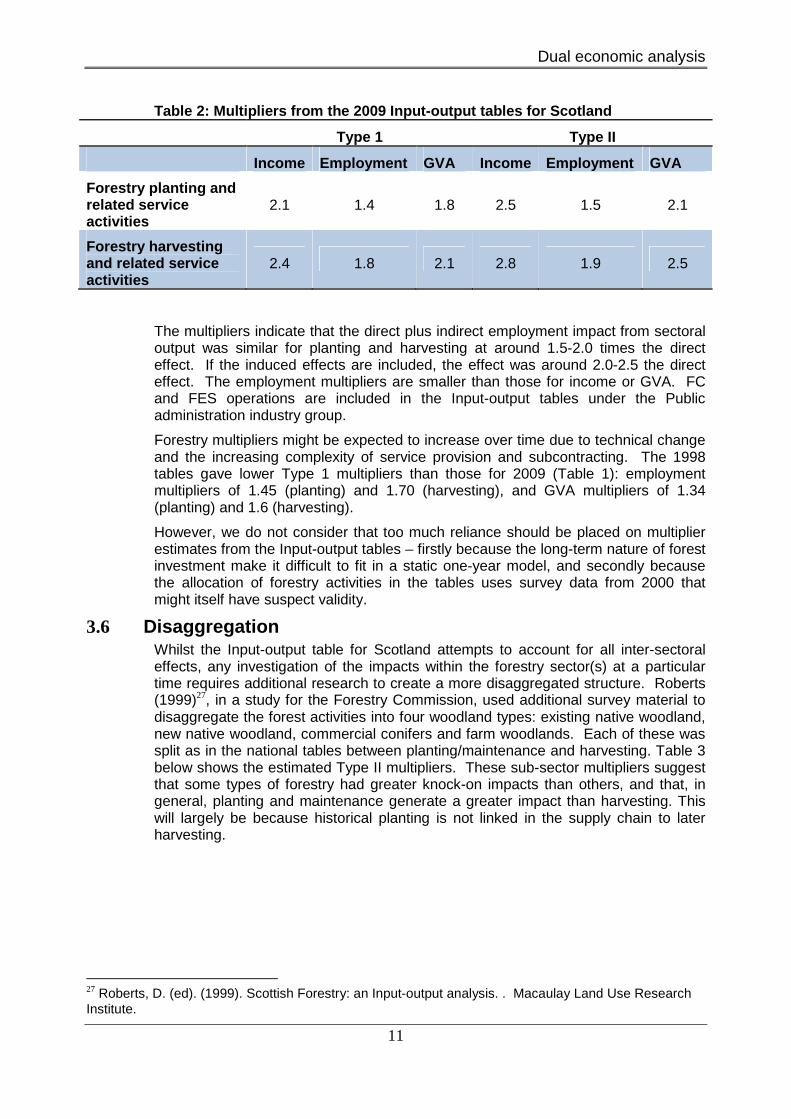
3.5 Input-output models Input-output models quantify the linkages between the different sectors in a national economy. Using the multipliers given in the tables, it is possible to estimate (with caveats) the overall impact of the direct output of a sector on the total output, employment and GVA of the economy. The Scottish input-output tables for 2009 give the following Type 1 and Type II multipliers26 for the forestry sector (see Table 2 below). The Scottish Government statisticians corrected their employment multipliers for the two forestry industry groups following our feedback on the implausibility of their original figures.
26 Type I multipliers sum direct and indirect effects. Type II multipliers also include induced effects. The Type 1 multiplier is the ratio of direct plus indirect output to the direct output (in employment, income or GVA). The Type II multiplier is the ratio of direct plus indirect plus induced output to the direct output. http://www.scotland.gov.uk/Topics/Statistics/Browse/Economy/Input-Output/Downloads/IO1998-2009latest
Dual economic analysis
11
Table 2: Multipliers from the 2009 Input-output tab les for Scotland
Type 1 Type II
Income Employment GVA Income Employment GVA
Forestry planting and related service activities
2.1 1.4 1.8 2.5 1.5 2.1
Forestry harvesting and related service activities
2.4 1.8 2.1 2.8 1.9 2.5
The multipliers indicate that the direct plus indirect employment impact from sectoral output was similar for planting and harvesting at around 1.5-2.0 times the direct effect. If the induced effects are included, the effect was around 2.0-2.5 the direct effect. The employment multipliers are smaller than those for income or GVA. FC and FES operations are included in the Input-output tables under the Public administration industry group.
Forestry multipliers might be expected to increase over time due to technical change and the increasing complexity of service provision and subcontracting. The 1998 tables gave lower Type 1 multipliers than those for 2009 (Table 1): employment multipliers of 1.45 (planting) and 1.70 (harvesting), and GVA multipliers of 1.34 (planting) and 1.6 (harvesting).
However, we do not consider that too much reliance should be placed on multiplier estimates from the Input-output tables – firstly because the long-term nature of forest investment make it difficult to fit in a static one-year model, and secondly because the allocation of forestry activities in the tables uses survey data from 2000 that might itself have suspect validity.
3.6 Disaggregation Whilst the Input-output table for Scotland attempts to account for all inter-sectoral effects, any investigation of the impacts within the forestry sector(s) at a particular time requires additional research to create a more disaggregated structure. Roberts (1999)27, in a study for the Forestry Commission, used additional survey material to disaggregate the forest activities into four woodland types: existing native woodland, new native woodland, commercial conifers and farm woodlands. Each of these was split as in the national tables between planting/maintenance and harvesting. Table 3 below shows the estimated Type II multipliers. These sub-sector multipliers suggest that some types of forestry had greater knock-on impacts than others, and that, in general, planting and maintenance generate a greater impact than harvesting. This will largely be because historical planting is not linked in the supply chain to later harvesting.
27 Roberts, D. (ed). (1999). Scottish Forestry: an Input-output analysis. . Macaulay Land Use Research Institute.

Dual economic analysis
12
Table 3: Type II forestry backward linked multiplie rs (Roberts, 1999 )28
Woodland type Income Employment
Forestry planting/maintenance
Existing native woodland 1.94 2.09
New native woodland 2.44 2.56
Commercial conifers 1.54 1.58
Farm woodland 2.67 2.79
All woodland types 1.74 1.81
Forestry harvesting Existing native woodland 1.81 1.22
Commercial conifers 3.21 1.86
All woodland types 2.97 1.77
3.7 Other forest-related contributions to the economy As highlighted in Chapter 1, economic impacts from forests are not restricted to the growing of trees or the harvesting and processing of timber. Among the more important other impacts are:
� Non-timber wood outputs (e.g. biomass for energy, horticultural compost).
� Community, recreation, tourism and environmental use of forests.
� Other activities linked to forest land and forestry (e.g. research, wind turbines in woodland, deer stalking, game, fungi).
3.8 Non-timber wood outputs Woodfuel usage (including pellet production) in Scotland has increased from almost nothing in 2000 to a forecast 123m odt in 201429. There are now 302 industrial/commercial plants using woodfuel and four wood pellet manufacturing plants. NFE sales of woodfuel are forecast to be around 6% of its total wood sales by value in 2013. It is therefore an important developing sector.
The normal definitions of the forestry sector will capture the direct and upstream economic impacts of these activities (in forestry planting, maintenance and harvesting), but the downstream impacts will be omitted. These activities should be captured in other sectors of the Annual Business Survey (ABS) and Input-output tables, but the dual problems of identifying such activity within other sectors with a broad definition and then establishing what proportion of activity is associated with forestry output make quantifying these activities problematic.
3.9 Communities, recreation, tourism and environment FES gross spending on these aspects of forestry is forecast to be around £27m for 2013/14 – 24% of its total spend. There is also expenditure by private forest owners on these aspects but the amount is not known and is probably much lower.
28 Roberts, D. (ed.)(1999). Scottish Forestry: an Input output Analysis. Macaulay Land Use Research Institute. 29 Woodfuel. Demand and usage in Scotland Report 2012 http://www.forestry.gov.uk/forestry/infd-7tdhjn

Dual economic analysis
13
These expenditures support both direct and indirect employment and income generation, but it is the indirect economic effects, and especially those from recreation and tourism through “externalities”, that are most important to the economy. Externalities are expenditures by visitors to forests that are incurred outwith the forests but are considered to be generated by the visits (e.g. on overnight accommodation, local meals, local shopping, etc).
There is an argument that a proportion of the expenditures associated with visits that include time spent in forests should be attributed to the forestry sector. Since entry into most forests is free, the main expenditures that can be linked to visits are on travel, food and drink and accommodation. However, forest visits are often part of day visits or longer holidays, and it is difficult to determine the basis on which to allocate visitor expenditures between forest and non-forest sectors (assuming that visitor expenditures have been, or could be, estimated).
On an associative basis, recreational expenditure is allocated according to the proportion of time spent in forests in people’s overall visits to the countryside (or days out), whether a visit to a forest is the ‘main’ or an ‘important’ reason for the trip, or whether the visit is close to home or more distant. A more demanding analysis might ask whether the visits are forest-dependent, i.e. whether a visit to a particular area would have taken place to the area if it did not have a forest. For example, visits to Roseisle forest in Moray (for which FCS levies a parking charge) can be principally for beach access through the forest. Such a distinction is considered too complex to be useful for impact analysis, however, and it is considered preferable to use the associative basis for estimating economic impacts.
Categories of visitors
From the perspective of impacts on the Scottish economy, inbound tourists from other parts of GB and abroad are especially important. These visitors clearly inject additional spending into the economy – although if a holiday in Scotland by a Scottish resident is taken instead of a holiday outside Scotland, their holiday spending is just as “additional” in Scotland as that by a visitor from the rest of the UK or overseas. In terms of regional economic impacts, residents who travel and spend money away from home are also important. In terms of national impact, however, such forest visits can be readily substituted by other outlets for expenditure and there is generally assumed to be no net impact on the national economy.
Hence we can distinguish three main categories of visitor:
1. Non-domestic residents who visit Scotland and whose expenditure in Scotland is at least partially ‘forest-related’ (inbound tourists resident outside Scotland).
2. Domestic residents whose expenditure away from home in Scotland30 is ‘forest-related’ (Scottish residents who spend leisure time on day or overnight trips in Scottish locations other than where they reside).
3. Domestic residents whose expenditure near home in Scotland is ‘forest-related’ (Scottish residents making trips in their home locality).
In order to estimate the employment, income from employment and GVA attributable to forest-related recreation and tourism it is necessary to estimate:
� The number of visits in each category to Scottish forests in a year (and visits to 30 VisitScotland has a category of ‘Tourism Day Visits’ (visits not taken on a regular basis and outside the ‘usual environment’). These would fit within this second category of visitor. Other ‘Leisure Day Visits’ fit within category 3. See http://www.visitscotland.org/pdf/GBDVS Main Annual Report 2011 Final - 26 April 2012.pdf

Dual economic analysis
14
the NFE).
� The mean expenditure per visit in each category that can be related to forestry (and the NFE).
� The impact of this expenditure on employment, income and GVA – direct, indirect and induced.
A number of recreation surveys have been carried out that provide some relevant data, but data are especially weak for the most critical group – the non-domestic tourists.
Data sources
The Scottish Recreation Survey (SRS) is an annual Omnibus survey of households, launched in 2003, which measures participation by Scottish adults in outdoor recreation. The survey also provides information on the types of environments which recreational users visit and expenditure. The latest published results are for 2011 (although 2012 results are available). The SRS is to be replaced by the Scotland’s People and Nature Survey (SPANS). This, however, will not provide expenditure data and will therefore be much less useful for economic analysis.
The Forestry Commission undertakes its own All-forest survey at selected FC sites. The latest set of results is from 2004 to 2007, but the survey is re-starting in 2013.
Table 4: Sources of information on Scottish tourism and the impact of forestry.
Source Context Method Comments
VisitScotland Main source of basic Scottish tourism data
Compiled from various sources including GB Day Visitor survey 2011
No information about role of forests in tourism.
Hayes and Boag (2003)31; McNicoll (2003)32.
Tourism satellite account (TSA) for Scotland
Sets tourism within the national accounting framework
No information about role of forests in tourism.
Hill et al. (2003)33
Specific study for FC on the role of forests in tourism
Primary visitor data from 44 GB woodland sites
Unable to raise sample to the overall population. Main study output is the model of trip generation.
FC All-forest survey
Visitors to FE forests in Scotland 2004-2007
Visitor survey at a sample of FE forests in Scotland
Substantial data on characteristics of visitors, including non-resident users. Latest dataset 2004-2007 but to be re-started in 2013. Not clear if suitable for modelling trip generation.
Scottish recreation survey (SRS) 2011
Leisure and recreation activities in Scotland
Omnibus survey with 12,200 interviews per year.
Visits to the outdoors for leisure and recreation from home or while on holiday in Scotland. These visits include urban destinations. Scottish residents only – no information on non-resident visitors. Some data on forests as a destination. Expenditure data.
There have also been numerous research studies that measure the expenditures of forest visitors, and some studies that model visitor numbers in relation to site characteristics. Such studies may be helpful in aggregating sample surveys to a
31 Hayes, C. and Boag, C. (2003). Development of a Tourism Satellite Account for Scotland. http://www.scotland.gov.uk/Resource/Doc/933/0007934.pdf 32 McNicoll, I. (2003). Towards a Tourism Satellite Account for Scotland. University of Strathclyde. 33 Hill, G., Courtney, P., Burton, R., Potts, J., Shannon, P., Hanley, N., Spash, C., DeGroote, J., Macmillan, D. and Gelan, A. (2003). Forests’ Role in Tourism. Report to the Forestry Commission.

Dual economic analysis
15
national total. In the study by Hill et al. (2003) primary and secondary data were collected for 44 forest sites, and a model developed to predict ‘tourism visits’ at un-surveyed sites by model transfer from surveyed sites. Table 4 above summaries the main datasets currently available.
It should be noted that recreational and tourism impact studies are often undertaken by organisations who wish to demonstrate high economic benefits from sites with which they are associated. The methodologies used may therefore be less than robust. This was demonstrated by Bryden, Westbrook et al. (2010)34 in a study of the economic impacts of nature based tourism in Scotland. They reviewed all relevant publications between 2000 and 2010 and found that many were biased through their sampling techniques and, for this and other reasons, visitor expenditures estimated in studies were often unrealistically high.
The effect of arbitrary assumptions is evident in a recent RSPB (2011)35 in-house study on the local economic impact of its reserves. Visitor spending was estimated across the reserves at £44m per year which supported an estimated 1,005 FTE jobs. These impacts were largely derived from the expenditure of holidaymakers where 75% of the total holiday spend (for an average of 5.1 nights) was attributed to the reserve if it was the ‘main reason’ for visiting the area. This is a very questionable allocation of expenditure to a reserve when the number of visits to the reserve is not documented and the additionality of the reserve not explored. Also, because of the displacement of expenditure within the country, it is not valid simply to aggregate gross local impacts to derive national impacts.
Tourism multipliers
The most comprehensive dataset on Scottish tourism multipliers was produced by SRG (1993)36. The study is now very dated but more recent estimates are not available. The study estimated impacts on the national economy and selected local economies in different locations in Scotland. Estimates of GVA were not made. The report gave output and income multipliers and employment impacts by type of accommodation (including day trips as an accommodation-free trip). More recent employment and income impacts from estimated visitor expenditure are available from STEAM reports (Scarborough Tourism Economic Activity Model37) produced for local areas.
3.10 Other activities linked to forest land The game sector is important to the Scottish economy mainly through sport shooting, including deer stalking and game processing. As with recreational forest visits, the local expenditure of shooters who arrive specifically for game shooting is considered as part of the economic impact from the activity. The difficulty is in deciding what proportion of the employment and GVA of the sector can be attributed to woodland. F4P estimated that 40% of the area managed for sport shooting in Scotland was woodland and took 40% of the estimated GVA as attributable to woodland. This assumption is open to question.
34 Scottish Natural Heritage (2010). Assessing the economic impacts of nature based tourism in Scotland. Report 338. http://www.snh.gov.uk/docs/B726802.pdf 35 RSPB (2011). Reserves and local economies. http://www.rspb.org.uk/Images/reserves_localeconomies_tcm9-290937.pdf 36 SRG (1993). Scottish Tourism Multiplier Study. ESU Research Paper 31. Surrey Research Group. 37 Global Tourism Solutions (UK) Ltd. 2 Barleycroft, Filey Road, Scarborough, North Yorks YO11 3AR. Tel: 01723 506310,[email protected].

Dual economic analysis
16
Data on this sector can only be collected by survey, and F4P relied on the PACEC (2006)38 survey of the game sector. This is the only economic analysis of the game sector that has been undertaken in recent years.
A small amount of employment is associated with edible fungi collection in woods. In Moray this amounted to 7 FTEs including processing. These activities should theoretically be captured in relevant sectors of the ABS and Input-output tables (where formal), but this is problematic for the reasons indicated earlier.
Some research and education can be directly linked to forestry. This is mainly forest schools, and academic research and consultancy. F4P estimated total employment of 105 FTEs.
In addition, a number of activities on the NFE are associated more with land management than forestry. These include leasing of land for wind turbines or hydro schemes, land sales and purchases and, more recently, the establishment of starter farms on purchased land. The economic contribution of these does not appear to have been studied in any detail and it is not clear how they are accounted for in existing employment and GVA estimates (where they are specifically identified).
38 PACEC (2006). Economic and Environmental Impacts of Sporting Shooting in the UK. Report for British Association for Shooting and Conservation by The Countryside Alliance and Country Land and Business Association in consultation with the Game Conservancy Trust.

Dual economic analysis
17
4 Regional estimation of employment and income
4.1 Introduction Forest Enterprise Scotland is interested in regional estimates of employment and income relating to the NFE. Where there are significant inter-regional dependencies it may be necessary to consider inter-regional effects. Processing regions can be dependent to varying extents on supplies from producing regions where production and supply are separated. These regional inter-relationships are not identifiable from conventional statistical sources.
Regional employment data for forestry and related manufacturing are available from the Business Register Employment Survey (BRES), which relates to workplace. However, many people work in regions other than where they live, and forestry work can be peripatetic. Regional employment may thus be defined by:
� Place of residence of the employee.
� Location of the employing firm.
� Location of the actual work.
What is of principal importance in regional economic analysis is where expenditures take place, and this is usually determined by place of residence (for the employee expenditures) and location of the firm (for business expenditure). The question of where expenditures actually take place becomes more problematic the smaller the region because of cross-border transfer of labour (and other economic flows).
Regional data on forestry employment and income from the SBS (which uses ABS data) are limited due to confidentiality. Also, FC, as a public body, does not make returns to the ABS.
The FC employment survey has given regional statistics on employment, but the latest survey was 1988/89. Apart from this and the Population Census (every ten years), very little regional economic data on forestry is available.
To obtain up-to-date data on employment and income for forestry sectors within and between regions requires specific surveys. Surveys can track not only the magnitude of employment and expenditures but also their location – i.e. whether expenditure is inside or outside a region. Asking for this is demanding on respondents, and this tends to have a negative effect on response rates and the accuracy of responses.
4.2 Forestry in Moray 39 A good example of the problems facing regional analysis was the analysis of the forest economy in Moray (CJC Consulting, 2005). We used postal surveys and interviews with forest owners (growers), timber processors and suppliers. This provided the basic data on employment and income within the region. However, responses are never 100% and results depend critically on obtaining cooperation from major businesses (usually processors). Without cooperation the analysis is incomplete.
39 Economic evaluation of the forestry sector in Moray 2005. Study for Forestry Commission Scotland. www.cjcconsulting.co.uk

Dual economic analysis
18
GRIT derived multipliers (see 4.3 below) proved unsatisfactory probably because of the small size of the region, and survey-based multipliers were used instead.
As a guide for other regional studies we concluded that:
� Regions larger than Moray should be used to avoid problems with cross-border transfers, confidentiality and imprecise GRIT estimates.
� A combination of local surveys and GRIT estimated multipliers provides the most cost-effective method for obtaining estimates for overall economic impacts of forestry at regional level40.
� The methods that were used to derive social and environmental benefits are transferable but would be improved by more reliable estimates of visitor and tourist numbers.
4.3 Regional multipliers Regional Input-output tables can be developed from bespoke regional surveys which mirror the construction of the national tables but at regional level. Numerous studies have used this approach, but it is costly and only relevant for modelling the whole regional economy. The tables that have been produced for local economies such as Shetland and the Western Isles (where forestry is relatively unimportant) have been found to include inconsistencies and implausible figures for certain sectors (due to inadequate survey responses, grossing up methods, or combining figures from different sources) – which gives a lack of confidence in using the figures for sectors that are not obviously wrong.
A less costly but less precise approach is to abstract from the national table. One commonly adopted approach is the Generation of Regional Input-Output Tables (GRIT) technique (Jensen, 199041; Johns and Leat, 198742) which uses the national Input-output table but adjusts for the regional share of employment. In some cases, additional survey material is collected in order to improve the regional dataset.
The smaller and more specialised the regional economy in relation to the national economy the less accurate this method becomes. We used GRIT in the study of forestry in Moray (see above), where it failed to produce acceptable results – probably due to the small size of the Moray economy. For larger regional economies, GRIT might be a sufficiently acceptable method – although there will always be doubts about the degree of accuracy of figures for a particular sector.
4.4 Conclusion Regional surveys are costly to undertake and are likely to prove unsatisfactory where regions are small and highly interconnected with other regions. They depend highly on a satisfactory postal (or e-mail) address database. This is simple to obtain for FCS, but not for other forestry businesses. This suggests limiting the number of regions in Scotland if surveys are to be held, and asking regional questions as part of a national survey. This could also be used to obtain information about inter-regional linkages.
However, businesses are now so over-surveyed that obtaining responses even from those well-disposed to the purposes of a survey is becoming increasingly difficult
40 However, GRIT estimates are derived from the national input-output table and the most recent Scottish table is 2007. 41 Jensen, RC (1990). ‘Construction and use of regional input-output models: Progress and prospects’, International Regional Science Review 13, 1,2 p9-25. 42 Johns, P. M. and P. M. K. Leat (1987). The application of modified GRIT input-output procedures to rural development analysis in Grampian Region. Journal of Agricultural Economics, 38, pp. 245-256.

Dual economic analysis
19
(and expensive where telephone interviews are used to supplement low or unrepresentative returns).

Dual economic analysis
20
5 Data sources and estimates of forestry-related employment and incom e
5.1 FES/FCS data sources For the NFE analysis, FCS requires information for seven groups of activities which together comprise all FE operations on the NFE. These are:
� Timber production
� Planting and forest management
� Deer management
� Agriculture
� Communities, recreation and tourism
� Renewable energy
� Property, development, sale and acquisitions.
FES/FCS have accounting systems which give detailed information on payments and receipts. A separate system covers employment, salaries and pensions. The accounting output would require some adjustment to provide income and expenditure data for each of the categories in the list above – but that is feasible. Some elements of FES activity (e.g. environment) are not included above whereas others (e.g. agriculture) are not separately identified in the accounts.
The system would allow allocation of income and expenditure to FES regional offices, if a regional analysis is required. But such an allocation would have limited value since purchases and sales will not be confined to specific regions but cross regional boundaries. It would require a major effort to track the post codes associated with all sales and purchases in order to correctly locate sources and destinations of transfers. Indeed, even postcodes might relate to the head office of a business rather than the relevant establishment.
It should be possible to derive the 2012/13 direct GVA and employment for FES in total and allocated across the seven activities at national level. This will inevitably be more complex than might appear since the existing systems are not set up to identify output as required for this project. There will be issues over the appropriate allocations of FCS and FC overheads and capital expenditure. Employment on an FTE basis would need to be derived. There would also be important issues to be resolved over how value added is calculated for the ‘non-commercial’ elements in FES (mainly communities, recreation, tourism, environment) since, if treated as part of the FES business, these produce negative value added. A regional breakdown of GVA and employment would be even more problematic to achieve as indicated above.
While the accounts together with other data could be used to derive ‘direct’ employment and GVA they do not indicate the upstream and downstream employment and GVA related to FES activity. This aspect is considered further in Chapter 6.
5.2 Forestry sector employment The last specific survey of employment in the sector was the 1988/89 Forest Employment Survey undertaken by the Forestry Commission. This recorded

Dual economic analysis
21
employment in Scotland but did not separate the NFE (FES) from the sector as a whole. FES direct employment can be obtained from FCS sources as discussed above, but there have been no estimates of the wider knock-on employment impact generated specifically by the NFE. The focus in data that has been collated has been the forest sector as a whole and its economic linkages in Scotland.
Forestry Commission Forestry 1988/89 Employment Sur vey 43
This was a detailed survey of employers in forestry and primary wood processing, and covered primarily employment in nurseries, planting, maintenance, forest management, harvesting and primary processing. It estimated 10,694 FTE jobs in forestry, of which 49% were forest jobs and 51% non-forest (Table 5). The data44 allows disaggregation by category of employer (FC, private woodland owners, forestry companies and contractors, wood processing industries and other). Whilst all Forestry Commission employment in Scotland was included, employment generated from forest visitor spending, deer management, stalking and venison processing was excluded.
Table 5 Forest and forest-related employment in Sco tland in 1988/89
FTEs
Forest nurseries 201
Establishment 1,189
Maintenance 1,304
Harvesting 1,947
Road construction 179
Other forest 372
Total Forest 5,192
Haulage 593
Processing 3,083
Other non-forest 1,826
Total non-forest 5,502
TOTAL 10,694
Employment in primary wood processing
Despite discontinuing the main employment survey, FC has continued to carry out an annual survey of primary processors and publish results for the UK45.
The employment at Scottish plants can only be extracted for sawmills (1,838 FTEs in 2011) and fencing mills (34 FTEs in 2011) since UK trade associations are the source of data for pulp, paper and panel manufacture. The survey does not ask about the source of the wood, which means that there are no precise data on employment associated with processing home-grown timber. The survey would need to be modified in order to obtain the employment that could be allocated to processing Scottish timber in plants located in Scotland.
43 http://www.forestry.gov.uk/pdf/employmentsurvey99.pdf/$file/employmentsurvey99.pdf 44 See Forestry Statistics 2012. 7.3. Forestry Commission. 45 Forestry Statistics 2012, Forestry Commission.

Dual economic analysis
22
No distinction is made in the survey between FES supplies and private supplies; hence, the survey would need to be extended to obtain this.
Forest Research F4P estimate of FTE employment
Forest Research (2008)46 estimated employment in Scottish forestry as shown in Table 6 below. The estimate of 10,253 FTEs was compiled from a range of sources but mainly the Forest Employment Survey of 1998/99 and Forestry Commission employment data.
Table 6: Numbers of FTEs directly employed in Scott ish forestry
Sector FTEs Source of data
Forest planting and harvesting
Forestry Commission (FC) direct employees
1,205 FC 2008
FC contractors (except haulage) 340 FC 2008
FC contractors (haulage included in IOC 2) 2 FC 2008
Private (non-farm) woodland owners 2,388 Forest Employment Survey
1988/89
Forestry companies and contractors 1,806 Forest Employment Survey
1988/89
Sub-total 5,741
Other sectors
Farm woodland 646 Based on 1993/94 England data
Haulage 542 unclear
Wood processing 2,577 Forest Employment Survey
1988/89
Pulp and paper 350 Caledonian Paper website
Local authorities 207 F4P survey 2008
Membership organisations 85 Forest Employment Survey
1988/89
Research and education 105 Forest Employment Survey
1988/89
Sub-total 4,512
TOTAL 10,253
In addition to the estimate in Table 6, F4P used published reports and additional surveys to estimate three other sources of employment associated with forestry (see Table 7 below). Recreation and tourism impacts were most important. F4P based their employment estimates on the study by CJC Consulting (2006)47 which pieced together data from the Scottish Recreation Survey 2004/05 and the FC All Forest Survey to provide expenditure data for tourists and visitors to forests. This was
46 Forest Research (2008). A valuation of the economic and social contribution of forestry for people in Scotland. http://www.forestry.gov.uk/fr/INFD-6S8CSP 47 CJC Consulting (2006). Market and Non-market Benefits of ‘Forestry for People’ in Scotland Report to Forest Research. This report, on which the F4P estimates are based, discusses in detail the problems of estimating recreational and tourist expenditures for forestry.

Dual economic analysis
23
converted to FTE employment (and GVA) using multipliers from the literature. F4P estimated 17,900 FTEs in Scotland from forest-related expenditure. Much depends in this kind of analysis on the assumptions that are made on the visitor expenditure that is regarded as forest-related or induced. Using a very broad definition of tourism, (trips ≥6 miles from home) CJC Consulting (2006)48 estimated forest-related tourism expenditure of £437m and employment of 14,827 FTEs in Scotland, although only 2,484 FTEs were clearly additional to the Scottish economy (derived from expenditures by non-domestic visitors).
Table 7: Numbers of FTEs associated with the non-ti mber outputs from the forestry sector in Scotland
Sector FTEs Source and date
Recreation and tourism (forest-related) 17,900 TNS (2006a,b,c)49, CJC
Consulting (2006)50
Game (direct, indirect and induced) 5,216 PACEC (2006) survey
Non-timber forest products 3,395 Omnibus Survey 2006
TOTAL 26,511
It should be noted that such estimates of employment from visitor expenditures include indirect and induced impacts as well as direct impacts, and the FTEs are not therefore on the same basis as those from the F4P report given in Table 6 above which only relate to direct FTEs.
Employment from sport shooting and deer stalking was based on a PACEC survey. On the assumptions made in F4P these were significant sources of employment, as were non-timber forest products. However, these estimates are all based on somewhat questionable evidence and assumptions.
In total, the F4P employment estimate was 36,764 FTEs. Around 70% of this is not from the ‘core’ forestry sector as usually defined.
The 2011 Census
The 2001 Census recorded at national and regional level the number of people directly employed in forestry and related activities (growers, suppliers).
Detailed data on forestry from the 2011 Census will not be available until early 2014, and a charge would be made for specially commissioned tables. The detail would be of interest and could be compared with 2001, but it would already be 3 years out-of-date and not replicable in subsequent years.
48 CJC Consulting (2006). Market and non-market benefits of Forestry for People in Scotland. Report to Forest Research. 49 TNS (2006a). Scottish Recreation Survey: Annual Summary Report 2004/05. Scottish Natural Heritage Commissioned Report No. 183. TNS (2006b). All Forest Visitor Monitoring: Survey of Visitors to FCS Forests. Year 1: June, 2004 to May, 2005. Report to Forestry Commission Scotland, January 2006. TNS (2006c).. All Forest Visitor Monitoring: Survey of Visitors to FCS Forests. Year 2: June 2005 to May 2006. Report to Forestry Commission Scotland, December 2006. 50 CJC Consulting (2006). Market and non-market benefits for Forestry for People in Scotland. Report to Forest Research www.cjcconsulting.co.uk.

Dual economic analysis
24
The Annual Business Survey (ABS) The Annual Business Survey (ABS) uses the Standard Industrial Classification (SIC), which was most recently revised in 2007 to reflect changes in the structure of the UK economy. The preliminary 2011 UK results are available51 for the Agriculture, Forestry and Fishing sector, which has a subsector on Forestry and Logging (02). Some agricultural activities, including mixed farming, are excluded from the survey.
Relevant data from ABS are split between three elements52:
� Silviculture and other forestry activities (02.1)
� Logging (02.2)
� Support services to forestry (02.4)
Information on employment in 2011 has been suppressed to avoid disclosure – although detail can usually be obtained by public bodies for research and analysis purposes.
The ABS also includes employment in the manufacturing of wood products. Primary processing is usually taken to comprise:
� Saw-milling (16.1):
� Panels (16.21):
� Manufacture of pulp, paper and paper board (17.1):
These data are highly rounded and incomplete due to disclosure issues, and are therefore not a very precise guide to changes in employment over time. They are also not available in FTEs, which is a more precise measure than total employment.
Statistics on secondary wood processing within the manufacturing sector are also available from the ABS, but these are not generally regarded as a component of the forestry sector. However, the distinction between what constitutes primary processing and what does not can be arbitrary, especially as “secondary” processing can be carried out by a plant that is primarily involved in primary processing.
Scottish Annual Business Statistics (SABS) 53
The SABS data are largely abstracted from the UK ABS but organised in different categories. Employment is not given in FTEs but as the number of full and part time employees and working proprietors on a set day in September. The employee/employment data published in SABS is based on the Business Register and Employment Survey (BRES).54
The SABS data for 2010 indicate that Forestry and logging supported employment of 3,800. The manufacture of paper and paper products involved employment of 5,200, and Manufacture of wood and of products of wood and cor k except furniture, 6,700. These latter categories involve secondary processing and are therefore not useful as measures of forestry sector employment and not comparable with the FC Employment survey.
Other information on employment by sector in Scotland, available regionally, can be obtained directly from BRES, which requires a licence, and the Annual Population
51 http://www.ons.gov.uk/ons/rel/abs/annual-business-survey/2011-provisional-results/abs-2011---provisional-results-statis 52 02.3 is gathering of non-wood products for which there is no recorded data. 53 http://www.scotland.gov.uk/Resource/0042/00420893.pdf 54 )54. More information on BRES is available on the ONS website
at:http://www.ons.gov.uk/ons/publications/all-releases.html?definition=tcm:77-230512

Dual economic analysis
25
Survey, which is not very accurate at regional level. BRES includes public sector employment that is excluded from the ABS, but the recommended (i.e. most robust) source of public sector employment is the quarterly Public Sector Employment returns made by all public sector bodies.
5.3 Forestry sector Gross Value Added ABS and SABS
Estimates of GVA are made by subsector using the same classifications as for employment. The 2011 UK estimates are given below (Table 8), with the derived Scotland 2010 estimate for forestry and logging (£103.7m). Applying the 2009 GVA Type 1 multiplier from the Input-output table of around 2 (Table 2) would give a total GVA impact of c. £210m. GVA below excludes public sector FCS and FES output.
Table 8: Gross value added at Basic Prices of fores try-related subsectors (ABS, 2011 and SABS, 2010)
UK 2011 (£m) Scotland 2010 (£m)
Forestry and logging 385 103.7
Saw milling 433 Not available
Panels Not disclosed Not available
Pulp, paper and paperboard 797
Paper and paper products 251.2
Forest Research F4P estimate of GVA
In the absence of data on the proportion of Scottish home-grown timber used in downstream wood processing or on the proportion of GVA generated in other sectors, the F4P study based the GVA estimates for upstream and downstream sectors on the share of employment in each sub-sector (Table 9 below). This gives a total of £303.6m.
The F4P study notes that this estimate excludes other second and further round impacts of spending on the Scottish economy. It applies multipliers (although it is not clear which multipliers were used) to generate indirect and induced effects which increase the total GVA associated with the sector to £460m.
The GVA from first round visitor expenditure was estimated at £209m, but F4P were unable to estimate GVA for game or non-timber forest products. The estimated measurable total GVA was £513m (£669m if indirect and induced effects are included).

Dual economic analysis
26
Table 9: Direct GVA of Scottish forestry in 2004 as sociated with Scottish timber, and share of sub-sector employment, by sub-sector (IOC)
Sub-sector (IOC) Share of sub-sector employment (%)
Direct GVA (£m at 2007/08 prices)
Forest planting (2.1) 100 59.6
Forest harvesting (2.2) 100 46.1
Farm woodland (1) 2.8 27.5
Other road transport (including haulage) (94)
1.3 22.4
Wood processing (31) 34.1 111.4
Pulp and paper (32) 10.5 20.5
Public administration (including Local authorities) (115)
0.15 9.4
Membership organisations (120) 0.67 3.0
Research and education (116) 0.07 3.7
Total 303.6
Source: Forest Research, and 2004 Scottish Input-output Tables55
Tourism employment and GVA estimates
CJC Consulting (2005)56 estimated forest-related GVA of £197m, of which £35m was additional to the Scottish economy. F4P used the same approach but a different classification of tourism and recreation trips based on frequency and importance of the visit rather than distance travelled. They estimated a GVA range of £88 - £210m from forest-related visitor expenditure.
Conclusion
Estimates of the impact on the Scottish economy of forest-related recreation and tourism suggest a major employment effect and less significant impact on GVA. However, the studies demonstrate the great difficulty in developing a methodology that is anything more than arbitrary in how expenditures are attributed.
Even so, it should be possible to update the estimates using more recent SRS data and (when completed) the results of the FC All-forest survey. The links between visitor expenditure and employment and GVA was derived in these studies from SRG (1993) and more recent data (or estimates) would be desirable.
The expenditures of visitors and tourists associated with forest visits do not encapsulate the benefits from using forests or their landscape and non-use value. Although not forming part of this study and not included in government accounts, these benefits are substantial. CJC Consulting (2006)57 estimated a value to the public of £47-89m per year. F4P reduced this slightly to £44-76m. These estimates
55 Total direct GVA for forestry across all these sub-sectors including use of imported timber was estimated to be about £700 million at 2007/8 prices. 56 CJC Consulting (2006). Market and non-market benefits of Forestry for People in Scotland. Report to Forest Research. 57 CJC Consulting (2006). Market and non-market benefits for Forestry for People in Scotland. Report to Forest Research www.cjcconsulting.co.uk.

Dual economic analysis
27
included visits to both the NFE and the private estate, although there is very little precise information about the number of visits to the private estate and their value.
5.4 Trends in Employment and GVA To produce trend data requires a consistent methodology and one with sufficiently small estimation errors to indicate real changes. It is extremely difficult to know how accurate available employment and GVA estimates are. There are some key issues here. First, the sample or census frame will be incomplete because not all firms in the sector are known. Second, dealing with non-response to questionnaires is highly problematic, especially when non-respondents include significant (large) processors or contractors. For these reasons it is difficult to assess the degree of reliability that can be placed on non-statutory surveys.
As a preliminary step it would be useful, drawing on expert opinion, to ‘model’ the expected changes in employment in recent years due to changes in planting area, harvested area and productivity change. This would give an indication of the magnitude of change in employment any analytical method is attempting to measure, although processing productivity is increasing significantly where new investment has been made in plant and machinery. Our impression, in contrast, is that productivity in both planting and harvesting is not changing significantly overall. We have no information about processing, except from impact analysis carried out by Steve Westbrook and others for Highlands and Islands Enterprise on specific investment projects by major processors such as BSW and other timber users such as Balcas. Employment in the forestry sector will be largely determined by activity levels (areas planted, restocked and harvested) and changes in the use of wood. Recreation and shooting-related expenditures will depend critically on visitor numbers and their expenditures.
Employment and GVA
Trends in employment can be derived from SABS, but only for forestry and logging, which excludes primary processing (unless the manufacture of Wood Products category can be split to identify saw-milling and panels – see 5.3 above). The SABS data (Table 10) show no clear recent trend in employment, and the ratios between employment and GVA in the three years appear mutually inconsistent. This is typical of SABS data at sectoral level, which are often clearly very inaccurate for particular years when comparisons are made across years or between years.
Table 10: Employment, turnover and GVA in forestry and logging (SABS 58 2011)
Year Employment ‘000
Turnover (£m)
GVA at basic prices (£m)
GVA per FTE (£m per ‘000)
2008 3.6 183.5 89.1 24.8
2009 3.3 205.1 112.3 34.0
2010 3.8 244.4 103.7 27.2
The 1998/99 FC Forest Employment Survey was carried out on a different basis to preceding surveys and is therefore unsuitable for trend analysis. It is also dated. Hence, the currently available data is rather limited for the analysis of sectoral trends in employment.
58 http://www.scotland.gov.uk/Resource/0042/00420893.pdf. SABS data and revised 2010 data are scheduled for release on 28 August 2013.

Dual economic analysis
28
Forest Research in F4P (Figure 1) produced trends in GVA for planting and harvesting, timber and wood, and pulp and paper. These show a generally declining GVA from forestry over the 1998-2004 period although it is not clear if this is a statistically significant trend. However, these data appear to include a wider set of activities than primary processing of home-grown timber. Certainly the estimate of total GVA is much greater than that made in F4P for the forestry sector (see above).
0.0
100.0
200.0
300.0
400.0
500.0
600.0
700.0
800.0
1998 1999 2000 2001 2002 2003 2004
Year
£ m
illion
Planting & Harvesting
Timber & Wood
Pulp & Paper
Total
Figure 1. Trends in total GVA in timber production and processing in Scotland at constant 2007/08 prices
The SABS data for forestry and logging (Table 8) show an increase in turnover in recent years and a possible trend increase in GVA. The longer time trend (Figure 1) suggests that GVA was fairly flat between 1998 and 2004 – although, with timber prices having risen significantly in recent years, GVA should have also increased significantly since 2008.
5.5 Employment and GVA: conclusions The SABS ‘forestry and logging’ statistics do not incorporate much of the employment and GVA that can reasonably be associated with forestry. Even if multipliers are used to capture the indirect and induced effects, important elements such as recreation are not covered. It is also not possible to differentiate home-grown from imported timber or to differentiate primary from secondary processing. Since the data are based on sample surveys there could be substantial errors in grossing up the sample, especially in primary processing where there are relatively few businesses59. We do not therefore consider that the official statistics provide a good basis for estimating the economic contribution of the forestry sector in Scotland. There is thus a case for more direct estimation.
Employment
The most recent estimates of forestry employment rely heavily on the FC’s Forest Employment Survey 1998/99. There are no estimates of the NFE direct and indirect
59 However, the ABS is statutory and response rates will be higher than in a discretionary survey.

Dual economic analysis
29
employment, and the FC data is now 15 years old and would not be a satisfactory basis on which to estimate current employment.
However, FC continues to collect annual UK statistics on employment in primary wood processing (sawmills, pulp and paper, panels and fencing), and it is understood that the Scotland element could be partially extracted from this. Hence were a new employment survey to be held, some of the processor element may not need to be included, as data are already collected annually, although a new survey might need to be extended to parts of the energy sector.
GVA
GVA is difficult to obtain from non-statutory surveys because firms are often unwilling to divulge financial information. It would be particularly difficult for the FC to try and obtain this, although consultants might have more success. F4P derived the GVA associated with Scottish timber from SG input-output sectoral GVA data assuming that the forestry share of GVA in each sector corresponded to the share of forestry employment in each sector. There is no way of assessing the reliability of this approach and the alternative of deriving GVA from employment earnings is preferable and should be feasible.
5.6 More recent data sources Table 11 below indicates what the datasets have been or will be published since the F4P study. It shows that the number of new datasets post-F4P is quite limited. This indicates that either greater reliance has to be placed on what is available or new surveys need to be commissioned.
We conclude that the official statistics on employment and GVA, and on available multipliers, are not very useful for measuring the economic contribution of the forestry sector or the NFE. It is not possible to differentiate home-grown from imported timber or to differentiate primary from secondary processing. Since the data are based on sample surveys, there could be substantial errors in grossing up from samples, especially in primary processing where there are relatively few businesses.

Dual economic analysis
30
Table 11: More recent data sources
Source Data Date available when?
Useful for Limitations NFE data?
Population Census 2011
Data on employment in forestry and related sectors
Not known but probably 2014
Employment data
No
SABS 2011 Forestry planting and harvesting employment and GVA
August 2013 Employment and GVA
Only forest planting and harvesting
No
SG Input-output tables 2009
May 2013 Multipliers Some doubts about reliability and FC/FES included (but not distinguishable) under Public administration
No
SNH Scottish recreation survey 2012
2012 available now Forest visitor numbers and spend
Needs additional cross tabs but these could probably be arranged with SNH
Yes – split data on visit numbers
SNH Scotland’s People and Nature Survey (SPANS)
2014 Forest visitor numbers
No expenditure or main destination data so much more limited for economic analysis than SRS
Yes
TNS All forest survey
Numbers of visits to selected NFE forests and visitor spend
The survey period is mid November 2012 to mid November 2013 with results available mid to late February 2014.
Recreational employment estimates
Only covering selected NFE forests. Difficulty in grossing up to all NFE and all forests
Yes
FC Employment survey of primary wood processors 2012
2013 Scotland employment data for some wood processing
Paper and panel data collected at UK level without any country split.
No but could be split on the basis of wood deliveries although standing sales are problematic
Woodfuel demand and usage in Scotland 2012
Data on woodfuel usage
Annually Background info on the woodfuel and biomass sector
No employment or income data
No but could be split on the basis of NFE deliveries
Putman (2012) for SNH60
Employment and expenditure in the Scottish deer sector
2012 Employment and expenditure (sport and as an attraction to visitors)
Largely based on the PACEC (2006) report
No
60 Putman, R. (2012). Scoping the economic benefits and costs of wild deer and their management in Scotland. Scottish Natural Heritage Commissioned Report No. 526. http://www.snh.org.uk/pdfs/publications/commissioned_reports/526.pdf

Dual economic analysis
31
6 Options for analysis of the forestry sector and the NFE
6.1 Introduction The pressure for new estimates of the economic contribution of the forestry sector to Scotland’s economy stems from a commitment to produce forestry sector employment and GVA indicators every 4 years. For the NFE the interest is in producing measures that indicate the estate’s contribution to the economy and the justification for continuing government investment in the estate.
There are a number of points we would wish to make. The first is that an emphasis on employment and GVA fails to capture the major way in which forestry and woodlands contribute to quality of life, outdoor activity, health and the environment. The current repositioning and development of the NFE reflects the benefits of trees near where people live. Forestry, together with its upstream and downstream links, also has a major role in contributing to many remoter and rural economies, although this has not been quantified.
Second, measurement of forestry sector employment and GVA is subject to imprecision and arbitrariness which makes the available figures (and changes over time) difficult to interpret. Surveys can also give erroneous results due to non-response and limited information about the target business population.
Finally, forestry has a long investment cycle, but value added analysis links current receipts to current expenditure. A more informative analysis would take into account the cost of capital and assess the return from current private and public investment. The investment model recently constructed for the FC could achieve this.
However, the scoping study specification indicated that the main interest for the analysis of the forestry sector is to update estimates of FTE employment and GVA (plus income from employment). We give two options for the analysis of the whole sector below. For the NFE analysis we concentrate on producing measures of employment and income, and suggest three alternative options. We propose in both cases that 2012/13 is used as the year to which the estimates will apply61.
6.2 Options for assessing impacts for the forestry sec tor The definition of what constitutes the forestry sector and its associated contribution to the economy is essentially arbitrary. We have made a number of assumptions about where the boundary might be set and these inform Table 12 below. However, the main study will need to reconsider what activities should form part of the sector and where the boundary is to be drawn. Issues that need to be further addressed resolved are whether all primary wood processing (including imported timber) is included and where the boundaries for biomass processing and utilisation, and renewable energy sources are drawn.
We suggest that the measurement every four years of GVA and employment in the sector should not be treated as a trend analysis. Not only does the F4P study not provide a clear time baseline because it uses data from widely differing years but any subsequent study will need to confront datasets derived from different years.
We identify two options for estimating the employment and GVA of the sector. The first relies largely on using government/ agency statistics and multipliers
61 In all cases we rule out (on cost and time grounds) detailed research into the forestry sector such as that undertaken in 1999 to generate more specific multipliers by Roberts.

Dual economic analysis
32
supplemented with other data on recreation, tourism and deer stalking. The second is based broadly on the F4P approach.
1 Relying primarily on government/agency statistic s
This approach would involve discussions with government statisticians to obtain a clearer understand of the methodology used – in particular which business are allocated to which sectors, and how the location of businesses that have plants in Scotland is defined. This would provide employment and GVA information for planting, maintenance and timber production, and more limited information on primary processing. Applying the 2009 multipliers from the Input-output tables with care would give indirect and induced employment. Disclosure issues might limit the availability of information on processing, in which case a separate processor survey (or a modification of the annual FC survey) would be needed.
Employment and GVA contributions from forest-related recreation and tourism and deer stalking would need to be estimated separately as indicated below.
The merit of this option is that it would be relatively low cost. However, the reliability of the statistics based on sample surveys is open to question and the changes between years in SABS figures (see Table 9) are difficult to explain. This option would also underestimate the economic contribution of the sector despite including the estimated indirect and induced effects. We conclude that government/agency economic statistics will not provide a sound basis for the estimates required in the study. We therefore do not recommend this option.
Cost: £10,000-£15,000.
2 Updating the F4P analysis
The F4P might appear to be a statement of forestry employment and GVA in 2008, but this is not the case. Most of the estimates were based on survey data from 1998/99 (see Table 6), although some were based on data gathered in 1993, 2006 and other years. No attempt was made to adjust the survey data to a common time point. So the study does not provide a clear year-defined baseline that would facilitate future comparison and trend analysis . In addition, some economic activities such as renewables were not included in F4P and now need to be taken into account.
Given this background, we consider that it makes most sense to use the best methods and estimates possible rather than sticking slavishly to the F4P methodology. We propose below what seems to us the best value for money approach to obtaining reasonable estimates. In general terms we suggest that a mix of phone contact with key contractors and processors coupled with a postal survey will be more productive than total reliance on postal surveys. GVA would be estimated for each subsector using the earnings and employment approach (see Chapter 1) and relating employment cost to GVA using SABS information for relevant sectors.
Table 12 below indicates how this could be achieved and what new data are required.

Dual economic analysis
33
Table 12: Updating of F4P estimates
Component Subsector Source and method: employment 62 Source and method: GVA
Forest and farm woodland planting, maintenance, timber/wood transport and processing, administration
Forestry Commission
FCS Human Resources Derive GVA from SABS data applying the employment-based method used in F4P.
Forestry and haulage contractors
Mix of phone calls to key businesses and postal survey. Use employment and earnings as the basis for estimation.
Primary wood processing including pulp and paper
Mix of phone calls to key businesses and postal survey. This survey should also include second round firms where these are clearly within the forest sector (e.g. transport and processors, but excluding renewable energy). It may be possible to modify the FC primary processing survey to obtain the Scottish data but separate follow-up contact would be needed to obtain earnings data for GVA analysis.
Use employment and earnings as the basis for estimation.
Woodland owners including farmers
Use grant-aided planting area in 2012/13 coupled with a survey and direct contact with a sample of owners with woodland to estimate the use of own and contracted labour (avoiding double counting) in planting and management.
We propose using grant aid statistics to obtain information on areas planted, and develop standard coefficients from a small industry survey for planting, maintenance and harvesting. It will be important to avoid double counting with other subsectors above.
This approach would only estimate the direct contribution of the sector to employment.
Directly obtain expenditure estimates from survey. If unsuccessful use earnings basis for GVA
Local authorities, membership organisations and research and education
Postal survey of organisations supplemented with phone contact. Use employment and earnings as the basis for estimation.
62 The 2011 Population Census will provide very useful information but it is not clear when the relevant data will be published.

Dual economic analysis
34
Biomass and renewable energy
A new survey or a modification of the current woodfuel survey will be needed. We propose restricting the first round employment to that associated with service and works, leasing, transport, and wood chip production (if not covered above).
We propose to include employment associated with wind turbine erection on forest land. Similarly employment in the construction, installation and operation of biomass plants is forest-related. These capital-related activities will be captured through a modified woodfuel survey or direct contact with key businesses.
Use employment and earnings as the basis for estimation. Earnings data will be collected at the same time as employment data.
Recreation and tourism Rely principally on the Scottish Recreation Survey 2012. Will need to run additional queries with SNH to expand the published output.
Apply literature estimates63 to obtain employment coefficients Review the tourism multiplier estimates to determine the indirect and induced effects of visitor expenditure.
Use employment and earnings as the basis for estimation
Deer stalking Review and update the 2012 Putman64 study for SNH, the 2006 survey for the Association of Deer Management65 and the PACEC (2006) study. Contact relevant organisations for more recent data.
GVA can be derived from expenditure estimates
63 Scottish Natural Heritage (2010). Assessing the economic impacts of nature based tourism in Scotland. Report 338. http://www.snh.gov.uk/docs/B726802.pdf 64 Putman, R. (2012). Scoping the economic benefits and costs of wild deer and their management in Scotland. Scottish Natural Heritage Commissioned Report No. 526 65 http://www.snh.gov.uk/docs/A415809.pdf

Dual economic analysis
35
Cost: £30,000-40,000. The cost would depend on the intensity of the various surveys of businesses and organisations.
We recommend Option 2 since this is the most comprehensive and the one that will provide an appraisal method on which future estimations can be based.
6.3 Options for the NFE/FES The NFE requirement differs from that for the whole forest sector is several ways:
� As indicated in Chapter 1 the focus is not a sector as identified in government statistics or the F4P study. It is the contribution of the public estate and its management by FES that is of interest.
� Given the differences in characteristics between the NFE and private forestry estates, the extraction of relevant data from SABS is more problematic.
� An analysis of the contribution of elements of FES activity is required.
� Regional analysis is of interest.
� There is no prior analysis that provides a baseline methodology. The CJC Consulting (2004) study of the public estate differs from the present study in that it was primarily a cost-benefit analysis.
We reiterate the point made earlier that the public estate contributes to the economy and to the public in a range of ways. Some of the public benefits are highly valued - for example, from access for recreation, sport and amenity, and the more recent emphasis on the creation of greenspace near where people live. Omitting reference to these benefits will undervalue the contribution made by the NFE.
In fact the NFE/FES, despite producing a net income from timber and forest management of £4m, delivered a net loss of around £30m66 in 2011/12. This reflected net spending of £22m on communities, recreation, tourism, environment and heritage. The value added, if calculated for FES as a business, would be negative or zero depending on how the government subsidy was treated. Hence an explanation of the ‘contribution’ of the NFE requires an account of its contribution to other policy objectives beyond employment and GVA impacts. In particular, we suggest that its increasing role in renewable energy production is highlighted given the prominence of this policy objective in Scotland.
Returning to the narrower objectives (measurement of employment and income) as given in the specification we give three possible options for estimating the economic contribution of the NFE. In each case we propose 2012/13 as the year for analysis
66 http://www.forestry.gov.uk/pdf/fcs-annual-accounts-2011-12.pdf/$FILE/fcs-annual-accounts-2011-12.pdf

Dual economic analysis
36
1 Relying primarily on FES/FCS accounts and gove rnment/agency statistics The accounting system will provide data on FES employment and earnings and income (or value-added) for the seven categories of FES activity. Multipliers from the 2009 Input-output tables for Scotland could be used with care to help estimate indirect and induced impacts. Also, additional work would be needed to estimate the employment associated with deer management, communities, recreation and tourism and renewable energy (see 2 below).
This option is unlikely to provide reliable data for the full effects of timber production and forest management due to uncertainty in the appropriate multipliers for the public element of the forest estate. There would be no possibility of establishing regional accounts. We do not recommend this option.
Cost £13,000-£18,000.
2 Estimation using FES data and surveys/contacts
This is essentially Option 2 for the whole forestry sector (see above) but modified to extract the NFE contribution and to allow estimation of the seven elements of FES activity. This option would require extensive collaboration from FES /FCS accounts staff. It would be simplest of the components of the study were aligned with those used in the presentation of FES/NFE accounts.
The method described for the estimation of employment effects (Table 13) gives direct and first round employment and employment in primary processing. There will be other indirect and induced employment effects that cannot be included and applying employment multipliers to estimate these could result in double counting.

Dual economic analysis
37
Table 13: Methodology for estimating NFE-related e mployment mainly using surveys/contacts
Component Employment Timber production
Planting (re-stocking) and forest management
FES direct employment from FCS HR system. Staff FTEs can be derived.
A survey of relevant FES suppliers and purchasers would be needed to identify the employment associated with work for FES. This could be linked to the Option 2 above but it would be important to determine whether FES notes significant purchases not covered by the last survey design. This survey should also include second round firms where these are clearly within the forest sector (e.g. transport and processors, but excluding renewable energy). It may be possible to modify the FC primary processing survey to obtain these data.
Deer management FES direct employment from FCS HR system. Staff FTEs can be derived.
A sample survey of relevant FES suppliers and purchasers would be needed to identify the employment associated with work for FES. This could be linked to the planting and management survey.
Agriculture This is not currently identified in the accounting system and relevant codes will need to be allocated. As with deer management the activity boundary will need to be defined and suppliers/purchasers surveyed, and HR data extracted.
Communities, recreation and tourism
There are two distinct elements: first FES expenditures and impacts, and, second, visitor expenditure and impacts.
FES expenditures and impacts would be dealt with as above using in-house employment data and surveys of FES suppliers.
Apply literature estimates67 to obtain employment coefficients Review the tourism multiplier estimates to determine the indirect and induced effects of visitor expenditure. For visitor numbers and expenditure, one would rely on the 2012 Scottish Recreation Survey supplemented with information from previous All-Forest surveys. There may be some information available from the 2013 All-Forest Survey. It will be necessary to run additional queries with SNH to expand the published output.
Renewable energy A new survey or a modification of the current woodfuel survey will be needed. We propose restricting the first round employment to that associated with service and works, leasing, transport, and wood chip production (if not covered above).
We propose to include employment associated with wind turbine erection on forest land. Similarly employment in the construction, installation and operation of biomass plants is forest-related. These capital-related activities will be captured through a modified woodfuel survey or direct contact with key players.
Property development sale and acquisition
FES staff time from the HR and accounts system as above.
If purchases of land agent and legal services area are associated with significant employment, an estimate would need to be made of this though contact with key suppliers.
67 Scottish Natural Heritage (2010). Assessing the economic impacts of nature based tourism in Scotland. Report 338. http://www.snh.gov.uk/docs/B726802.pdf

Dual economic analysis
38
Estimating the GVA of the NFE is uninformative abou t its economic contribution because the direct value added from FE S activity (and treated as a business) is substantially negative. It is not poss ible to split FES activity into ‘commercial’ and ‘non-commercial’ since the timber producing element is constrained to deliver other public benefits . We therefore propose that the valuation of its economic contribution be based on the impacts of sales and expenditures (including own employment) on direct a nd indirect (up and downstream) employment and income. The best approach is to obtain earnings information alongside employment in the surveys described in Table 13. The value added by all suppliers and purchasers can be estimated using GVA/employment coefficients from the SABS (with care, as SABS figures can be unreliable).
Cost £30,000-£40,000. The cost would depend on the intensity of the various surveys of businesses and organisations.
3 Estimation using FES data and model developmen t
In this option the aim is to build a set of FES activities with employment and value added coefficients derived from FES operational knowledge and links to suppliers and purchasers. The advantage is that the method is more explicit and can be updated at intervals once the structure is established. It will require survey/contact information from suppliers and purchasers but this could be less through formal survey and more through interaction with key contacts to flesh out the details.
We propose a top-down approach using the FES accounts as the point of departure. This will ensure that the aggregation of the activities is reconciled to the published accounts. The activities will thus need to be inclusive. The first step is to re-structure the accounts into the seven categories (e.g. timber production) for which the analysis is required. This will involve detailed liaison with the accounts department. Then a series of activities would be set up within each category in conjunction with FES staff. There could be just one activity per category but it would be much more informative and useful if the range in employment and cost /revenue was described. There might be 100 or more activities in total.
We have not investigated which elements and sub-elements in Table 13 would lend themselves to more detailed modelling. It is likely that much of the timber production, planting and forest management could be split into activities and modelled. However, some components may be too varied to be usefully split into defined activities. Property development is one such component where the operations may be too diverse and site specific to be usefully modelled. It would be necessary as an early step in Option 3 to decide which components to include in the modelling and which to treat as composite elements (and treat as in Option 2). In practice Option 3 would become something of a hybri d with Option 2 where more detailed activity modelling was not considered useful and informative.
Table 14 gives two examples of how employment and value added information would be derived. We envisage information from FES itself and a small number of informative suppliers and purchasers. Collaboration with a major forest company would be one way to obtain typical cost and employment data. For a planting activity this would track the FES employment and cost per ha, the contractor labour use and margin, and seek to identify any related upstream Scottish employment and value added (e.g. nurseries and fencing). Harvesting would be treated similarly (FES and contractor information), but estimates of the employment and value added in processing would be made by linking Scottish timber output to processing capacity derived from a modified survey of primary processors (as above).

Dual economic analysis
39
Table 14: Methodology for NFE contribution mainly using modelling
Category Physical activity (units
per ha)
FES employmen
t per unit
Other direct employment
per unit
First round employment
per unit
Costs and revenue per unit
First round cost/revenue
per unit Planting (re-stocking) and forest management
Re-stocking 1 From FES accounts
Labour and other inputs used (from contract info)
Use industry contacts to get employment coefficients for each unit
Cost to FES (direct and suppliers)
Use industry contacts to get value added per unit
Timber production Harvesting 1 From FES
accounts Labour and other inputs used (from contract info)
Use industry contacts to get employment coefficients for each unit
Revenue to FES
Use industry contacts to get value added per unit
Most but not all employment and income effects of the NFE could be estimated in this way. The visitor expenditure impacts associated with forest-related recreation and tourism would be assessed as in Table 13, as would some aspects of renewable energy (e.g. employment in establishing turbines and renewable energy plants).
Cost £50,000-£55,000.
Regional analysis
We consider that Options 2 and 3 will be quite demanding without the additional problem of undertaking a regional analysis. Splitting the analysis into FCS or local authority regions would hugely complicate the data gathering and we question whether this would be worthwhile. Much depends on where the policy interest lies. A Highlands and Islands/Lowlands split is feasible but would complicate the analysis because of the cross border transfer of staff and products. Another possibility is a rural/urban split. The Scottish government has an Urban/Rural classification68 which classifies the country into 2, 3, 6 or 8 classes. The 2 class classification allocates areas by settlement size (> or < 3,000 people). To use this would require allocating all transactions by postcode according to the SG shape file using GIS techniques. This would add a substantial degree of complexity to the project. It would be important to decide (i) whether a rural/urban distinction was relevant for the economic impact of the NFE and (ii) to carry out a preliminary study to determine how much of the NFE-related economic activity fell into each of the two areas (rural and urban).
6.4 Potential for linking the research for the two stu dies Even though the NFE study differs in many respects from the forestry sector study there is still a considerable degree of common ground which would point towards a joint study to minimise costs and ensure consistency and confidence in the outcomes.
Option 1 in each case (Forestry sector and NFE/FES) could easily be combined but we do not recommend these options.
Option 2 in each case could share a modified employment/key contact survey and parallel investigations into recreation, tourism, and renewables.
Option 3 (NFE) could benefit from the employment survey used in Option 2 (Forestry sector), with parallel investigations into recreation, tourism, and renewables.
68 http://www.scotland.gov.uk/Topics/Statistics/About/Methodology/UrbanRuralClassification

Dual economic analysis
40
The combined costs of the options are estimated as in Table 15:
Table 15: Combined costs
Forestr y sector option NFE option Combined cos t (£)
1 1 15,000-20,000
2 2 40,000-50,000
2 3 60,000-70,000
6.5 Potential for collaboration with Scottish Enterpri se and HIE These organisations hold data for a large number of firms across a range of sectors, particularly account-managed businesses. Such records are invaluable as a way of determining earnings and value added impacts of different types of business in Scotland. Whilst individual business data would not be made available it should be possible to obtain data for types of business or for SE/HIE to do some employment/value added analysis. Depending on the coverage of sectors, this could significantly reduce the need for extensive surveys that may prove disappointing due to low response rates.
Collaboration would also widen experience on the steering group, and study costs could be shared. We have not investigated the number and diversity of forestry sector business accounts held by HIE and SE. It would be important to approach the agencies at an early stage to obtain informatio n about their forestry-related portfolios since this will be a key determinant of the benefit from collaborative activity.