scinopharm management presentation
TRANSCRIPT

ScinoPharm Management Presentation
TWSE 1789
May 8, 2015
First Quarter 2015 On-Line Investor Meeting
Disclaimer
This material has been prepared by ScinoPharm Taiwan, Ltd. (“ScinoPharm”).
Any opinions expressed in this material are subject to change without notice as a result of using
different assumptions. ScinoPharm is under no obligation to update or keep current the
information contained herein. The information contained in this presentation is ScinoPharm’s
confidential information.
Any disclosure, copying, distribution or any action taken or omitted to be taken in reliance on it is
prohibited and may be unlawful.
No representation or warranty, express or implied, is or will be made in or in relation to, and no
responsibility or liability is or will be accepted by the Company as to, the accuracy orcompleteness of this material and any liability therefore is hereby expressly disclaimed.
Statements made in this material include forward-looking statements, which include, without
limitation, statements about the issues, plans and expectations of ScinoPharm. Without limiting
the foregoing, statements including the words “believes”, “anticipates”, “plans”, “expects” and
similar expressions are also forward-looking statements. Forward-looking statements reflect,
among other things, management’s plans and objectives for future operations, current views
with respect to future events and future economic performances and projections of various
financial items. These forward-looking statements involve known and unknown risks,
uncertainties and other factors which may cause actual results to differ materially from thoseimplied by such forward-looking statements.
1

Table of Content
� Overview of ScinoPharm
� Financial & Operating Results in Q1, 2015
� Market Trend Update
2
4
Overview of ScinoPharm
- An API + ANDA Company
Active Pharmaceutical Ingredients
Abbreviated New Drug Application
3
Confidential
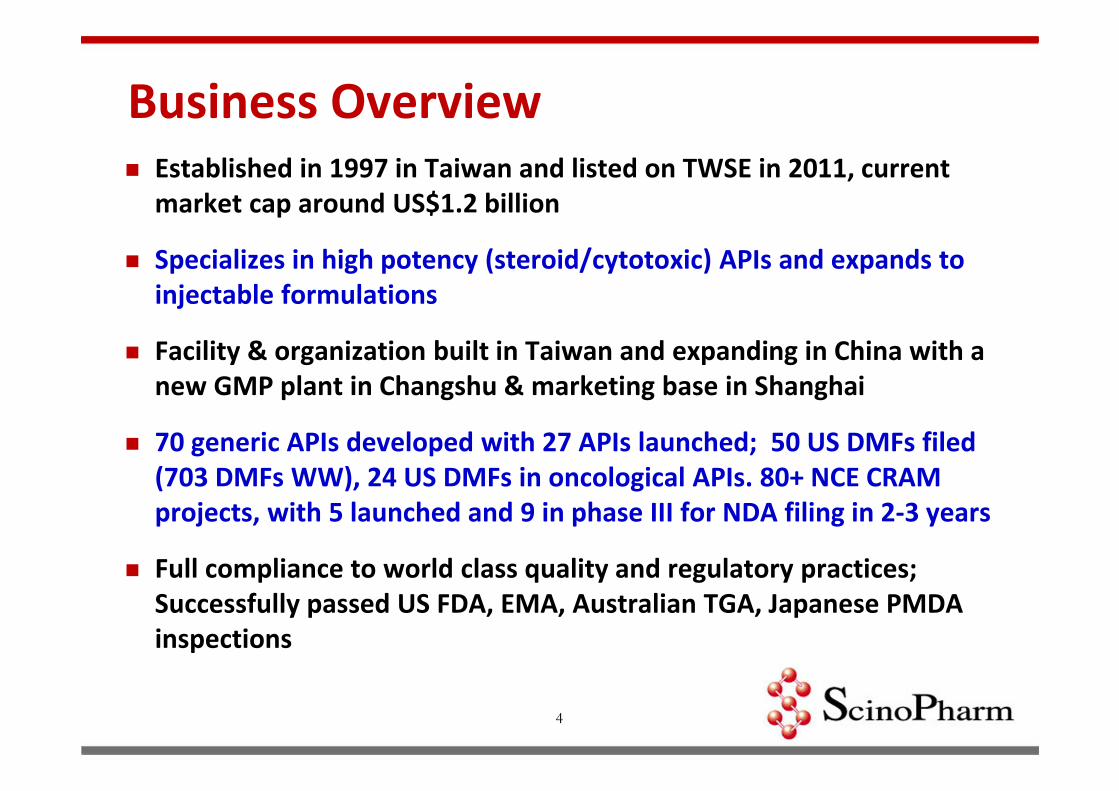
Business Overview � Established in 1997 in Taiwan and listed on TWSE in 2011, current
market cap around US$1.2 billion
� Specializes in high potency (steroid/cytotoxic) APIs and expands to
injectable formulations
� Facility & organization built in Taiwan and expanding in China with a
new GMP plant in Changshu & marketing base in Shanghai
� 70 generic APIs developed with 27 APIs launched; 50 US DMFs filed
(703 DMFs WW), 24 US DMFs in oncological APIs. 80+ NCE CRAM
projects, with 5 launched and 9 in phase III for NDA filing in 2-3 years
� Full compliance to world class quality and regulatory practices;
Successfully passed US FDA, EMA, Australian TGA, Japanese PMDA
inspections
4

Long Term Strategies
Transforming to a full-scope pharma company per our
core competency of R&D and cGMP manufacturing in
high-technical barrier APIs
� Vertical Integration to Generic Formulations: Developing dossiers per our difficult-to-make APIs to increase value proposition in the supply chain
� Innovative Delivery Formulations: Targeted delivery & extended release of proven APIs via 505(b)2 fast track
� Brand New Chemical Entities (New Drugs): Collaborating with academic research institutes, focusing on un-met oncological medical needs of high prevalence in Asia
5
Keys to Generic Formulation Business
� Expanding formulation portfolio
� Building on-site oncological injectable facility and establishing a complete supply chain of oral products
� Promoting our formulations via strategic alliance, especially in China and US
� Acquiring critical resources via M&A
6

Passed the 5th US FDA GMP Inspection
� Zero 483 observation on 18 products sold to the US
� US FDA newly adopted “Quality Metrics Initiative”, for each production site to provide "quality level“ data; FDA can check how well the quality system maintained and how successfully the system affects the quality of the medicinal products
� Focus on the Rates of Lot Acceptance, Right First Time, Product Quality Complaint, Management Engagement, etc.
� More emphasis on initial selection criteria and evaluation of suppliers and ways to deal with quality and compliance issues in a timely manner
* An FDA Form 483 is issued to the management of a production site at the conclusion of an inspection
when an investigator has observed any conditions that in his/their judgment may constitute violations of
the Food Drug and Cosmetic Act and related Acts.
7

Top Warning Letter Citations
� Inadequate design & construction features
� Inadequate control of microbiological contamination
� Data integrity
� Inadequate raw material testing
� Inadequate special training requirement
� Inadequate stability testing
ScinoPharm successfully passed FDA audits on these key quality matters
8

More Tightened cGMP Requirement
9
Company Warning Letter Issue Date
Hospira S.p.A. 03/31/2015
Hospira Australia 09/26/2014
GSK Biologicals 06/12/2014
Sun Pharmaceutical 05/07/2014
Johnson & Johnson International 06/06/2013
Teva Neuroscience 04/08/2013
Hospira Healthcare India 05/28/2013
Boehringer Ingelheim Pharma 05/06/2013
Genentech 10/03/2012
Eli Lilly 08/10/2012
Pfizer 06/19/2012
Watson 06/07/2012
Source : US FDA Website
GMP Compliance as Competitive Advantage
� To handle the stringent cGMP requirements, many pharmas face severe challenges, leading to either outsource production or shut down product lines
� Due to CAPEX concern, many old pharmas hesitate to upgrade facility and staff training, which creates huge demands for high quality contract research & manufacturing services
� With FDA inspected facilities in all scales and effective quality management systems, ScinoPharm offers world class quality services to brand name and generic customers in a flexible, reliable, and competitive approach
10

Financial & Operating Results
11

In NT$ million, except for EPS1Q 2015
(Reviewed)
1Q 2014(Reviewed)
YoY
Net Sales 979 1,097 -11%
Gross Profit 344 433 -21%
Gross margin 35% 39%
Operating Expenses (203) (250) -19%
Operating Income 141 183 -23%
Operating margin 14% 17%
Other Rev.(Exp.) (7) 2 -450%
Net Income before Tax 134 185 -28%
Net Income after Tax 113 165 -32%
Net margin after tax 12% 15%
EPS (after tax) 0.16 0.24 -33%
Quarterly P&L - Consolidated
12

In NT$ million2015/3/31
(Reviewed)
2014/3/31
(Reviewed)
Cash and Cash Equivalents 2,008 17% 2,793 23%
Accounts Receivable 653 6% 630 5%
Inventories 2,402 21% 2,637 22%
Long-Term Investments 244 2% 260 2%
Property, plant & equipment 5,109 44% 4,434 37%
Other assets 1,155 10% 1,275 11%
Total Assets 11,571 100% 12,029 100%
Current Liabilities 2,004 17% 2,156 18%
L-T Liabilities and Others 91 1% 66 -
Stockholders’ Equities 9,476 82% 9,807 82%
Balance Sheet- Consolidated
13

In NT$ million1Q 2015
(Reviewed)
1Q 2014
(Reviewed)
Cash and cash equivalents at
beginning of period1,928 2,289
Cash flows from operating activities 241 492
CAPEX (269) (372)
Short-term borrowings 86 380
Others 22 4
Cash and cash equivalents at
end of period2,008 2,793
Cash Flows- Consolidated
14

2014 Q1
2015 Q1
Generics
75%
CRO
5%CMO
20%
Sales by Business
15
Generics
87%
CRO
9%
CMO
2%
BD
2%

2014 Q1
2015 Q1
CNS
24%
Others
16%
CNS
12%
Others
8%
Oncology
80%
Sales by Indications
Oncology
60%
16

2015 Q1
2014 Q1
US+CAN
56%EU
27%
India
8%
Rest of
Asia
8%
AU+NZ
1%ROW
<1%
17
Sales by Region
US+CAN
40%
EU
22%
India
22%
Rest of
Asia
12%
AU+NZ
4%ROW
<1%

Market Trend Update
18

0% 5% 10% 15%
WW Market Share (%)
2020
0% 5% 10% 15%
WW Market Share (%)
2013
Oncology as Global Top 1 TherapyWW Sales
CAGR% Growth (2013-2020)
+11.2%
+8.7%
+3.5%
+7.3%
+7.1%
+1.4%
+7.1%
-3.6%
+4.3%
+5.1%
+10.4%
+2.8%
+5.7%
+9.4%
-5.5%
$72.8bn
$44.9bn
$33.7bn
$32.6bn
$27.8bn
$25.6bn
$38.4bn
$17.5bn
$16.2bn
$14.6bn
$19.3bn
$14.1bn
$13.5bn
$13.1bn
$11.1bn
$153.1bn
$68.9bn
$45.6bn
$41.3bn
$35.9bn
$28.2bn
$57.1bn
$21.8bn
$19.2bn
$17.8bn
$26.1bn
$17.7bn
$16.4bn
$14.8bn
$13.0bn
Source: Evaluate Pharma 19

Global Oncology Value Soaring
� Oncology has become the top 1 therapy area since 2013
� Global cancer drug spending reached $100 Billion in 2014 per IMS Health
� Oncology will keep growing to $153.1 Billion in 2020 per Evaluate Pharma
� CAGR in global cancer drug spending jumped to 6.5% during the past 5 years and projected to be 8% in 2018, per IMS Health
� ScinoPharm’s oncology emphasis echoes the global therapy trend
20

Oncology as US FDA Approval Focus
8% 19%
10%
23%
31%
27%
22%
36%
� Approved in oncology more than in other therapies
22 21 1923
27
19
32
7
2 5
2
7
12
7
9
4
0
5
10
15
20
25
30
35
40
45
2008 2009 2010 2011 2012 2013 2014 2015*
Nu
mb
er
of
ap
pro
ve
d d
rug
s
Oncology non-Oncology
Note: *: as of 2015/4/20 ** The number of oncology products is not including radioactive drugs Source: US FDA Website
21

Small Molecules Still Oncology Mainstream
� Oncology biologics increasing
13 3
24
12
4
2
4
9
5
5
3
0
2
4
6
8
10
12
14
2008 2009 2010 2011 2012 2013 2014 2015*
Nu
mb
er
of
ap
pro
ve
d o
nco
log
y d
rug
s
Oncology_Small Molecule
Oncology_Biologics
Note: * as of 2015/4/20 Source: US FDA Website22

Targeted & Immuno-therapies Flying
1 1 11 1
1
1
1
34
4
9
6
5
41
1
2
1
0
2
4
6
8
10
12
14
2008 2009 2010 2011 2012 2013 2014 2015*Nu
mb
er
of
ap
pro
ve
d o
nco
log
y d
rug
s
Chemotherapy
Targeted therapy
Immunotherapy
Supportive care
Hormonal therapy
� Chemo- and hormonal therapies declined
23Note: * as of 2015/4/20 Source: US FDA Website

Targeted Therapy Dominates Oncology
ADC 11%
mAb
20%
Protein
Kinase
Inhibitor
60%
Others 9%
Targeted
therapy
60%
Chemotherapy
2%
Hormonal
therapy
14%
Immunotherapy
23%
Supportive care
1%
24
Source: 2020 Sales Forecast, Global Data
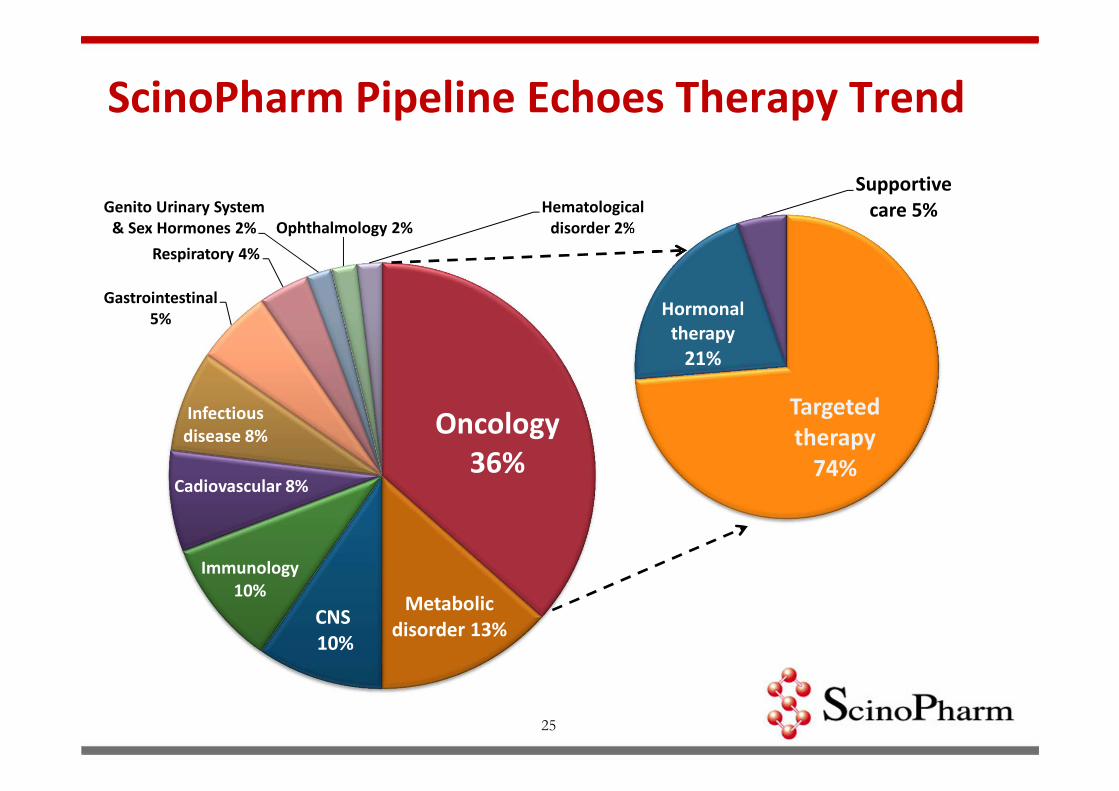
ScinoPharm Pipeline Echoes Therapy Trend
Oncology
36%
Metabolic
disorder 13%CNS
10%
Immunology
10%
Cadiovascular 8%
Infectious
disease 8%
Gastrointestinal
5%
Respiratory 4%
Genito Urinary System
& Sex Hormones 2% Ophthalmology 2%
Hematological
disorder 2%
Targeted
therapy
74%
Hormonal
therapy
21%
Supportive
care 5%
25

2015 Product Launch Plan
API Region IndicationsBrand
MarketerRegional Sales WW Sales
Azacitidine US MDS Oncology Celgene US$323MM* US$815MM*
Benazepril CNHypertension,
CVNovartis US$65MM** US$480MM*
Desmopressin US Polyuria Ferring US$131MM* US$395MM*
Letrozole JP Breast Cancer Novartis US$51MM** US$581MM*
Tamsulosin US
Benign prostatic
hyperplasia
(BPH)
Boehringer
Ingelheim US$335MM* US$1,829MM*
Launched
26
Source: * IMS Data (2013Q3-2014Q2) ** In-house research

Questions
&
Answers
27

Brand Quality with Asian Advantageswww.scinopharm.com
28