scientific opinion on dietary reference values for iron · 29 and allergies (nda) was asked to...
TRANSCRIPT

EFSA Journal 20YY;volume(issue):NNNN
Suggested citation: EFSA NDA Panel (EFSA Panel on Dietetic Products, Nutrition and Allergies), 20YY. Draft Scientific
opinion on Dietary Reference Values for iron. EFSA Journal 20YY;volume(issue):NNNN, 117 pp.
doi:10.2903/j.efsa.20YY.NNNN
Available online: www.efsa.europa.eu/efsajournal
© European Food Safety Authority, 20YY
DRAFT SCIENTIFIC OPINION 1
Scientific Opinion on Dietary Reference Values for iron1 2
EFSA Panel on Dietetic Products, Nutrition and Allergies (NDA)2,3
3
European Food Safety Authority (EFSA), Parma, Italy 4
ABSTRACT 5
Following a request from the European Commission, the Panel on Dietetic Products, Nutrition and Allergies 6 derived Dietary Reference Values (DRVs) for iron. These include Average Requirement (AR) and Population 7 Reference Intake (PRI). For adults, whole body iron losses were modelled using data from US adults. Predicted 8 absorption values, at a serum ferritin concentration of 30 µg/L, of 16 % for men and 18 % for women were used 9 to convert physiological requirements to dietary iron intakes. In men, median whole body iron losses are 10 0.95 mg/day, and the AR is 6 mg/day. The PRI, calculated as the requirement at the 97.5
th percentile, is 11
11 mg/day. For postmenopausal women, the same DRVs as for men are proposed. In premenopausal women, 12 additional iron is lost through menstruation, but because the losses are highly skewed, the Panel decided to cover 13 the requirements of 95 % of the population and set a PRI of 16 mg/day. In infants aged 7–11 months and 14 children, requirements were calculated using the factorial approach, considering needs for growth and 15 replacement of losses, and assuming 16 % dietary iron absorption. ARs range from 5 mg/day in infants aged 7–16 11 months to 8 mg/day in boys aged 12–17 years. PRIs were estimated using a coefficient of variation of 10 % 17 and range from 6 mg/day in infants to 10 mg/day in adolescent boys. For girls aged 12–17 years, the PRI of 18 13 mg/day was derived from the midpoint of that for premenopausal women and the calculated requirement of 19 97.5 % of adolescent girls; this approach makes allowances for the large uncertainties in the rate and timing of 20 pubertal growth and menarche. For pregnant and lactating women, it was assumed that iron stores and enhanced 21 absorption provided sufficient additional iron, and the DRVs are the same as for premenopausal women. 22
© European Food Safety Authority, 20YY 23
KEY WORDS 24
iron, Average Requirement, Dietary Reference Value, probabilistic modelling, factorial approach 25
26
1 On request from the European Commission, Question No EFSA-Q-2011-1214, endorsed for public consultation on
23 April 2015. 2 Panel members: Carlo Agostoni, Roberto Berni Canani, Susan Fairweather-Tait, Marina Heinonen, Hannu Korhonen,
Sébastien La Vieille, Rosangela Marchelli, Ambroise Martin, Androniki Naska, Monika Neuhäuser-Berthold, Grażyna
Nowicka, Yolanda Sanz, Alfonso Siani, Anders Sjödin, Martin Stern, Sean (J.J.) Strain, Inge Tetens, Daniel Tomé,
Dominique Turck and Hans Verhagen. Correspondence: [email protected] 3 Acknowledgement: The Panel wishes to thank the members of the Working Group on Dietary Referenve Values for
Minerals: Peter Aggett, Carlo Agostoni, Susan Fairweather-Tait, Marianne Geleijnse, Ambroise Martin, Harry McArdle,
Androniki Naska, Hildegard Przyrembel and Alfonso Siani for the preparatory work on this scientific opinion.

Draft Dietary Reference Values for iron
EFSA Journal 20YY;volume(issue):NNNN 2
SUMMARY 27
Following a request from the European Commission, the EFSA Panel on Dietetic Products, Nutrition 28
and Allergies (NDA) was asked to deliver a scientific opinion on Dietary Reference Values (DRVs) 29
for the European population, including iron. These include Average Requirement (AR) and 30
Population Reference Intake (PRI). 31
Iron is required for oxygen transport, electron transfer, oxidase activities, and energy metabolism. The 32
main components of the body that contain iron are erythrocyte haemoglobin and muscle myoglobin, 33
liver ferritin, and haem and non-haem enzymes. 34
Dietary iron consists of haem (from animal tissues) and non-haem (including ferritin) iron. Foods that 35
contain relatively high concentrations of iron include meat, fish, cereals, beans, nuts, egg yolks, dark 36
green vegetables, potatoes and fortified foods. 37
Iron is inefficiently and variably absorbed, depending on dietary and host-related factors. Iron 38
absorption occurs primarily in the duodenum. A proportion of non-haem iron in foods is solubilised in 39
the gastro-intestinal lumen, reduced by duodenal cytochrome B reductase to Fe2+
and transported into 40
the enterocyte by the transmembrane divalent metal transporter 1. There, iron is either stored as 41
ferritin, some of which is subsequently lost when the cells are sloughed, taken up by mitochondria for 42
synthesis of haem, or transported across the basolateral membrane by ferroportin, where it is carried 43
in the circulation as diferric-transferrin after oxidation to Fe3+
by hephaestin. The mechanisms of 44
absorption of haem iron and ferritin iron are uncertain, but once taken up iron is released from haem 45
iron by haem oxygenase and then follows the same pathways as non-haem iron. 46
Homeostasis is mediated via the regulation of iron absorption, as there are no active pathways for 47
excreting iron. In healthy individuals, the mucosal uptake and transfer of iron is inversely related to 48
systemic serum ferritin concentrations, and control is exerted via the expression of the hepatic 49
hormone, hepcidin. 50
If the supply of iron is insufficient to meet physiological requirements, iron stores will be mobilised 51
and iron deficiency will develop once the stores are exhausted. Iron deficiency anaemia (a microcytic 52
anaemia with haemoglobin concentrations below normal) is the most common nutritional deficiency 53
disorder, being found in all countries of the world. Population groups at greatest risk are those with 54
high iron requirements due to growth (infants, children, pregnant women), high losses (women with 55
high menstrual losses), or those with impaired absorption e.g. in the presence of 56
infection/inflammation. 57
The risk of systemic iron overload from dietary sources is negligible with normal intestinal function. 58
Chronic iron overload may occur as a result of specific clinical conditions and genetic mutations, but 59
there is no evidence that heterozygotes for haemochromatosis are at increased risk of iron overload. 60
The Panel considers that health outcomes cannot be used to derive DRVs for iron because of the 61
uncertainties in intake measurements, the poor correlation between intake and iron status, and the 62
presence of confounders that prevent the determination of dose–response relationships and the 63
assessment of risks associated with deficiency or excess. 64
A factorial approach was used to derive dietary iron requirements. Data on iron turnover and total 65
obligatory iron losses from the body (including skin, sweat, urine and faeces) obtained from 66
radioisotope dilution measurements were used to determine iron requirements in men and 67
premenopausal women. Although these data were collected from a North American population group, 68
the Panel agreed to use them as a basis for the estimation and probability modelling of the mean and 69
approximate variability of distribution percentiles for the iron losses of adult men and premenopausal 70

Draft Dietary Reference Values for iron
EFSA Journal 20YY;volume(issue):NNNN 3
women in the EU population. Summary statistics were estimated for the main variables related to iron 71
losses for men and premenopausal women and for associations among the variables which were 72
considered to be explanatory for iron losses. From these a regression model equation for iron losses 73
(as mg/day) was fitted to the data using a set of potentially relevant variables. This stage included an 74
assessment of outliers and goodness of fit. The regression model was then used to derive a 75
distribution for iron losses combining the model equation with parametric distributions fitted to the 76
sampling observations of each of the explanatory variables. 77
Dietary (haem and non-haem) iron absorption was estimated from a probability model, based on 78
measures of iron intake and status in a representative group of men and women from the UK National 79
Diet and Nutrition Survey. This provides estimates of total iron absorption from a mixed Western-80
style diet at any level of iron status. The Panel selected a target value of 30 µg/L for serum ferritin 81
concentration. At this level, the predicted iron absorption is 16 % in men and 18 % in premenopausal 82
women. The Panel decided to use 16 % for all age groups (except premenopausal women) when 83
converting physiological requirements into dietary intakes on the assumption that the relationship 84
between serum ferritin concentration and efficiency of absorption holds for all age groups, as there 85
are no indications that age will affect the relationship. 86
In men, the 50th percentile of the model-based distribution of obligatory iron losses is 0.95 mg/day. 87
The 90th, 95
th and 97.5
th percentiles are, respectively, equal to iron losses of 1.48, 1.61 and 88
1.72 mg/day. Using 16 % iron absorption to convert the physiological requirement into the dietary 89
requirement results in a calculated dietary requirement at the 50th percentile of 5.9 mg/day and of 90
10.8 mg/day at the 97.5th percentile. After rounding, an AR of 6 mg/day and a PRI of 11 mg/day is set. 91
In the absence of information on the iron requirement for postmenopausal women and despite their 92
lower body weight, the Panel decided to set the same DRVs for postmenopausal women as those set 93
for adult men. 94
In premenopausal women, the 50th percentile of the model-based distribution of obligatory iron losses 95
is 1.34 mg/day. The 90th, 95
th and 97.5
th percentiles are, respectively, equal to iron losses of 2.44, 2.80 96
and 3.13 mg/day. Using 18 % absorption to convert the physiological iron requirement into the dietary 97
requirement results in a calculated dietary requirement at the 50th percentile of 7.4 mg/day. Intakes 98
meeting the dietary iron requirement of approximately 90, 95 and 97.5 % of the premenopausal 99
women are calculated as 13.6, 15.6, and 17.4 mg/day, respectively. After rounding, the Panel derives 100
an AR of 7 mg/day and a PRI of 16 mg/day for premenopausal women. The Panel considers that the 101
PRI meets the dietary requirement of 95 % of women in their reproductive years and is derived from a 102
group of premenopausal women some of whom used oral contraceptives, as is the case in the EU. The 103
Panel decided that women with very high iron losses should not be included in the premenopausal 104
group as this would result in unrealistically high DRVs for the majority of this population group. 105
In infants aged 7–11 months and children, requirements were calculated factorially, considering needs 106
for growth, replacement of losses and assuming 16 % dietary iron absorption. ARs range from 107
5 mg/day in infants aged 7–11 months to 8 mg/day in boys aged 12–17 years. In the absence of 108
knowledge about the variation in requirement, PRIs for all children except girls aged 12–17 years 109
were estimated using a coefficient of variation of 10 %, and range from 6 mg/day in infants aged 7–11 110
months to 10 mg/day in boys aged 12–17 years. For girls aged 12–17 years the PRI was set at 111
13 mg/day. This value was derived from the midpoint of the calculated requirement, using a CV of 112
15 %, of 97.5 % of girls aged 12–17 years and the PRI for premenopausal women. This approach was 113
used to make allowances for the large uncertainties related to the variability in the rate and timing of 114
pubertal growth and menarche. 115
In pregnancy, iron intake should cover basal losses during the first trimester, taking into account the 116
cessation of menstruation. The requirements then increase exponentially, and this is associated with a 117
dramatic increase in the efficiency of iron absorption. The total quantity of iron required for a 118
singleton pregnancy is 835 mg. If the serum ferritin concentration is 30 µg/L at conception, around 119

Draft Dietary Reference Values for iron
EFSA Journal 20YY;volume(issue):NNNN 4
120 mg of stored iron can be mobilised to support the pregnancy which means that the total dietary 120
requirement of iron is 715 mg. If the relevant % absorption figures determined from a study in 121
pregnant women are applied to the entire pregnancy (7.2 % during weeks 0–23, 36.3 % during weeks 122
24–35, and 66.1 % during weeks 36–40 for non-haem iron, plus 25 % absorption for haem iron 123
throughout the whole pregnancy), the quantity of iron absorbed totals 866 mg. The Panel notes that 124
using the absorption figures from single meal studies in fasting mothers may be an overestimate, but, 125
nevertheless, the quantity of iron absorbed is well in excess of the estimated 715 mg calculated by a 126
factorial approach, and the progressive fall in serum ferritin concentration will be accompanied by an 127
increased efficiency of absorption, irrespective of other homeostatic mechanisms. The Panel therefore 128
considers that no additional iron is required in pregnancy. 129
During lactation, the quantity of iron secreted in breast milk is approximately 0.24 mg/day. When this 130
is added to basal losses of 1.08 mg/day (obtained from data in postmenopausal women), the 131
requirements for absorbed iron during the first months of lactation are calculated to be 1.3 mg/day, 132
assuming that menstruation has not yet resumed. This requirement is less than in non-pregnant, non-133
lactating women but in order for depleted iron stores to be replenished and to cover losses of iron 134
when menstruation is re-established, the Panel considers that ARs and PRIs for lactating women are 135
the same as for non-pregnant women of childbearing age. 136

Draft Dietary Reference Values for iron
EFSA Journal 20YY;volume(issue):NNNN 5
TABLE OF CONTENTS 137
Abstract .................................................................................................................................................... 1 138
Summary .................................................................................................................................................. 2 139
Background as provided by the European Commission .......................................................................... 7 140
Terms of reference as provided by the European Commission ............................................................... 7 141
Assessment ............................................................................................................................................... 9 142
1. Introduction .................................................................................................................................... 9 143
2. Definition/category ........................................................................................................................ 9 144
2.1. Chemistry ................................................................................................................................ 9 145
2.2. Functions of iron ..................................................................................................................... 9 146
2.2.1. Biochemical functions ........................................................................................................ 9 147
2.2.2. Health consequences of deficiency and excess .................................................................. 9 148
2.2.2.1. Deficiency .................................................................................................................. 9 149
2.2.2.2. Excess ...................................................................................................................... 10 150
2.3. Physiology and metabolism .................................................................................................. 11 151
2.3.1. Intestinal absorption ......................................................................................................... 11 152
2.3.1.1. Mechanisms of intestinal uptake and transfer of iron ............................................. 11 153
2.3.1.2. Regulation of absorption.......................................................................................... 12 154
2.3.2. Dietary iron forms and bioavailability ............................................................................. 13 155
2.3.3. Metabolism ....................................................................................................................... 17 156
2.3.3.1. Systemic distribution and turnover .......................................................................... 18 157
2.3.3.2. Homeostasis of cellular iron .................................................................................... 18 158
2.3.4. Transport in blood ............................................................................................................ 18 159
2.3.5. Distribution to tissues ....................................................................................................... 19 160
2.3.6. Storage .............................................................................................................................. 19 161
2.3.7. Losses ............................................................................................................................... 20 162
2.3.7.1. Losses via skin, hair, sweat, urine and faeces ......................................................... 20 163
2.3.7.2. Menstrual iron losses ............................................................................................... 20 164
2.3.7.3. Whole body iron losses ............................................................................................ 21 165
2.3.7.4. Breast milk ............................................................................................................... 21 166
2.3.8. Interactions with other nutrients ....................................................................................... 22 167
2.4. Biomarkers of intake and status ............................................................................................ 23 168
2.5. Effects of genotype ............................................................................................................... 25 169
3. Dietary sources and intake data ................................................................................................... 25 170
3.1. Dietary sources ..................................................................................................................... 25 171
3.2. Dietary intake ........................................................................................................................ 26 172
4. Overview of Dietary Reference Values and recommendations ................................................... 27 173
4.1. Adults .................................................................................................................................... 27 174
4.2. Infants and children .............................................................................................................. 31 175
4.3. Pregnancy .............................................................................................................................. 35 176
4.4. Lactation ............................................................................................................................... 37 177
5. Criteria (endpoints) on which to base Dietary Reference Values ............................................... 38 178
5.1. Indicators of iron requirement .............................................................................................. 38 179
5.1.1. Factorial approach for estimating physiological iron requirement .................................. 39 180
5.1.1.1. Infants ...................................................................................................................... 39 181
5.1.1.2. Children ................................................................................................................... 40 182
5.1.1.3. Adults ....................................................................................................................... 41 183
5.1.1.4. Pregnancy ................................................................................................................. 42 184
5.1.1.5. Lactation .................................................................................................................. 44 185
5.1.2. Algorithms and models used to estimate iron absorption ................................................ 45 186
5.2. Iron intake and health consequences .................................................................................... 47 187
6. Data on which to base Dietary Reference Values........................................................................ 48 188

Draft Dietary Reference Values for iron
EFSA Journal 20YY;volume(issue):NNNN 6
6.1. Adults .................................................................................................................................... 48 189
6.1.1. Men ................................................................................................................................... 48 190
6.1.2. Premenopausal women ..................................................................................................... 49 191
6.1.3. Postmenopausal women ................................................................................................... 49 192
6.2. Infants aged 7–11 months and children ................................................................................ 49 193
6.3. Pregnancy .............................................................................................................................. 51 194
6.4. Lactation ............................................................................................................................... 52 195
Conclusions ............................................................................................................................................ 52 196
Recommendations for research .............................................................................................................. 53 197
References .............................................................................................................................................. 54 198
Appendices ............................................................................................................................................. 68 199
Appendix A. Cut-off values for biochemical indicators of iron deficiency proposed 200
in the literature ........................................................................................................... 68 201
Appendix B. Percentiles of daily iron losses with menstruation based on individual 202
data from Harvey et al. (2005) ................................................................................... 69 203
Appendix C. Dietary surveys in the EFSA Comprehensive European Food Consumption 204
Database included in the nutrient intake calculation and number of subjects 205
in the different age classes ......................................................................................... 70 206
Appendix D. Iron intake in males in different surveys according to age classes and 207
country ........................................................................................................................ 71 208
Appendix E. Iron intake in females in different surveys according to age classes and 209
country ........................................................................................................................ 73 210
Appendix F. Minimum and maximum % contribution of different food groups to iron 211
intake in males ............................................................................................................ 75 212
Appendix G. Minimum and maximum % contribution of different food groups to iron 213
intake in females ......................................................................................................... 76 214
Appendix H. Data derived from intervention studies in Europe on iron intake and ......................... 215
markers of iron deficiency and/or iron deficiency anaemia in children..................... 77 216
Appendix I. Data derived from observational studies in Europe on iron intake and markers 217
of iron deficiency and/or iron deficiency anaemia in children .................................. 81 218
Appendix J. Re-analysis of data on endogenous iron losses from Hunt et al. (2009) ................... 82 219
Abbreviations ....................................................................................................................................... 115 220
221

Draft Dietary Reference Values for iron
EFSA Journal 20YY;volume(issue):NNNN 7
BACKGROUND AS PROVIDED BY THE EUROPEAN COMMISSION 222
The scientific advice on nutrient intakes is important as the basis of Community action in the field of 223
nutrition, for example such advice has in the past been used as the basis of nutrition labelling. The 224
Scientific Committee for Food (SCF) report on nutrient and energy intakes for the European 225
Community dates from 1993. There is a need to review and, if necessary, to update these earlier 226
recommendations to ensure that the Community action in the area of nutrition is underpinned by the 227
latest scientific advice. 228
In 1993, the SCF adopted an opinion on nutrient and energy intakes for the European Community4. 229
The report provided Reference Intakes for energy, certain macronutrients and micronutrients, but it 230
did not include certain substances of physiological importance, for example dietary fibre. 231
Since then new scientific data have become available for some of the nutrients, and scientific advisory 232
bodies in many European Union Member States and in the United States have reported on 233
recommended dietary intakes. For a number of nutrients these newly established (national) 234
recommendations differ from the reference intakes in the SCF (1993) report. Although there is 235
considerable consensus between these newly derived (national) recommendations, differing opinions 236
remain on some of the recommendations. Therefore, there is a need to review the existing EU 237
Reference Intakes in the light of new scientific evidence, and taking into account the more recently 238
reported national recommendations. There is also a need to include dietary components that were not 239
covered in the SCF opinion of 1993, such as dietary fibre, and to consider whether it might be 240
appropriate to establish reference intakes for other (essential) substances with a physiological effect. 241
In this context, EFSA is requested to consider the existing Population Reference Intakes for energy, 242
micro- and macronutrients and certain other dietary components, to review and complete the SCF 243
recommendations, in the light of new evidence, and in addition advise on a Population Reference 244
Intake for dietary fibre. 245
For communication of nutrition and healthy eating messages to the public it is generally more 246
appropriate to express recommendations for the intake of individual nutrients or substances in food-247
based terms. In this context, EFSA is asked to provide assistance on the translation of nutrient based 248
recommendations for a healthy diet into food based recommendations intended for the population as a 249
whole. 250
TERMS OF REFERENCE AS PROVIDED BY THE EUROPEAN COMMISSION 251
In accordance with Article 29 (1)(a) and Article 31 of Regulation (EC) No. 178/2002,5 the 252
Commission requests EFSA to review the existing advice of the Scientific Committee for Food on 253
population reference intakes for energy, nutrients and other substances with a nutritional or 254
physiological effect in the context of a balanced diet which, when part of an overall healthy lifestyle, 255
contribute to good health through optimal nutrition. 256
In the first instance EFSA is asked to provide advice on energy, macronutrients and dietary fibre. 257
Specifically advice is requested on the following dietary components: 258
Carbohydrates, including sugars; 259
4 Scientific Committee for Food, Nutrient and energy intakes for the European Community, Reports of the Scientific
Committee for Food 31st series, Office for Official Publication of the European Communities, Luxembourg, 1993. 5 Regulation (EC) No 178/2002 of the European Parliament and of the Council of 28 January 2002 laying down the general
principles and requirements of food law, establishing the European Food Safety Authority and laying down procedures in
matters of food safety. OJ L 31, 1.2.2002, p. 1-24.

Draft Dietary Reference Values for iron
EFSA Journal 20YY;volume(issue):NNNN 8
Fats, including saturated fatty acids, polyunsaturated fatty acids and monounsaturated fatty 260
acids, trans fatty acids; 261
Protein; 262
Dietary fibre. 263
Following on from the first part of the task, EFSA is asked to advise on population reference intakes 264
of micronutrients in the diet and, if considered appropriate, other essential substances with a 265
nutritional or physiological effect in the context of a balanced diet which, when part of an overall 266
healthy lifestyle, contribute to good health through optimal nutrition. 267
Finally, EFSA is asked to provide guidance on the translation of nutrient based dietary advice into 268
guidance, intended for the European population as a whole, on the contribution of different foods or 269
categories of foods to an overall diet that would help to maintain good health through optimal 270
nutrition (food-based dietary guidelines). 271
272

Draft Dietary Reference Values for iron
EFSA Journal 20YY;volume(issue):NNNN 9
ASSESSMENT 273
1. Introduction 274
In 1993, the Scientific Committee for Food (SCF) adopted an opinion on nutrient and energy intakes 275
for the European Community (SCF, 1993). For iron, the SCF set Population Reference Intakes (PRIs) 276
for infants, boys and non-menstruating girls, adult men, and lactating and postmenopausal women. 277
For menstruating girls and women, intakes at the proposed values were considered to cover the needs 278
of 90 or 95 % of the population. No PRI specific for pregnant women was proposed. For non-pregnant 279
non-lactating adults, an Average Requirement (AR) and a Lowest Threshold Intake were proposed as 280
well. 281
2. Definition/category 282
2.1. Chemistry 283
Iron (atomic weight 55.85 Da, atomic number 26) is the 4th most common element in the Earth’s crust. 284
It has oxidation states from –2 to +6, of which the most biologically relevant are the ferrous (Fe2+
) and 285
ferric (Fe3+
) states. Biologically, iron complexes with nitrogen as in the porphyrin ring of haem, and 286
with sulphur forming iron sulphur clusters which are thought to have underpinned the evolution of life 287
forms and the release of oxygen into the atmosphere. In higher life forms iron sulphur clusters are 288
involved in mitochondrial energy metabolism, the synthesis of the oxygen binding molecule, haem, 289
and in the regulation of the cellular acquisition, homeostasis and use of iron. 290
2.2. Functions of iron 291
2.2.1. Biochemical functions 292
Iron plays a major role (1) in oxygen transport (haemoglobin), short-term oxygen storage 293
(myoglobin), (2) haem enzymes involved in electron transfer (e.g. cytochromes a, b, and c, and 294
cytochrome c oxidase) and oxidase activities (e.g. cytochrome P-450 mixed function oxidases, 295
oxidases and peroxidases, (3) iron sulphur clusters in energy transduction and oxido-reductase 296
activities (e.g. succinate, isocitrate and NADPH dehydrogenase; xanthine oxidases). It is also a 297
cofactor in various non-haem containing enzymes (e.g. phenylalanine, tryptophan and tyrosine 298
hydroxylases, and proline and lysine hydroxylases). 299
Iron is necessary for most, if not all, pathways for energy and substrate metabolism. Globin-haems are 300
transporters of oxygen, carbon dioxide, carbon monoxide and nitric oxide (e.g. haemoglobin and 301
neuroglobin), as stores of oxygen (e.g. myoglobin and neuroglobin), and scavengers of free radicals 302
(Brunori and Vallone, 2006). The cytochrome P-450 oxidase system embraces over 11 000 diverse 303
activities including the metabolism of endogenous substrates such as organic acids, fatty acids, 304
prostaglandins, steroids and sterols including cholesterol and vitamins A, D, and K. The citric acid 305
cycle and respiratory chain involves six different haem proteins and six iron sulphur clusters. 306
2.2.2. Health consequences of deficiency and excess 307
2.2.2.1. Deficiency 308
The features of iron deficiency are continuously changing, many of which have been classically 309
attributed to iron deficiency such as koilonychia (spoon-shaped nails), soft nails, glossitis, cheilitis 310
(dermatitis at the corner of the mouth), mood changes, muscle weakness, and impaired immunity that 311
can also be secondary to other nutritional deficiencies. Many studies examining relationships 312

Draft Dietary Reference Values for iron
EFSA Journal 20YY;volume(issue):NNNN 10
between iron deficiency and adverse sequelae use anaemia as a surrogate indicator of iron deficiency. 313
Iron deficiency anaemia can be distinguished from that caused by other nutritional deficiencies such 314
as folate or cobalamin deficiency, by characteristic changes in the shape, density of haem content, and 315
size of red blood cells. However, the pathogenesis of iron deficiency may not be dietary. Non-dietary 316
causes of iron deficiency and anaemia include conditions that cause gastrointestinal blood loss or 317
malabsorption, e.g. cancer and inflammatory bowel disease, intestinal infections and parasitism; blood 318
loss from the genito-urinary, and respiratory tracts may also contribute to iron deficiency (Steketee, 319
2003). 320
There is evidence that adolescent girls who were anaemic as toddlers have altered memory spatial 321
awareness. Iron-deficient and anaemic infants and children have delayed attention, poor recognition 322
memory, reduced reward-seeking behaviours, and impoverished social interactions. Some studies 323
have shown an association between iron deficiency anaemia in early childhood and long-lasting poor 324
cognitive and behavioural performance. However, much of this research is confounded by socio-325
economic factors and by the difficulties in standardising the outcome measurements (McCann and 326
Ames, 2007). Existing studies imply that iron-responsive defects occur at haemoglobin concentrations 327
below 80, 95 and 110 g/L. However, in these studies the degree of anaemia has not been considered as 328
a continuous variable and it is difficult to characterise a specific threshold of anaemia (or even the 329
degree of iron deficiency) for these phenomena. Thus, although the effects of early life deficiencies 330
may persist and be irredeemable by subsequent iron supplementation, the vulnerable periods have not 331
been well characterised. 332
In women in whom anaemia had been induced by phlebotomy, impaired muscle endurance capacity 333
and energetic efficiency are apparent as haemoglobin concentrations drop below 130 g/L, and the 334
effect becomes greater with every 10 g/L fall in haemoglobin (Gardner et al., 1977). In related studies, 335
iron-responsive impaired muscle endurance capacity has been demonstrated in groups without 336
anaemia but with serum ferritin concentrations < 16 µg/L (Brownlie et al., 2004). 337
In animal models, iron deficiency, with or without anaemia, is associated with inefficient energy 338
metabolism, with altered glucose and lactate utilisation. It is also associated with reduced muscle 339
myoglobin content, reducing muscle strength and endurance. Cytochrome c oxidase activity in muscle 340
and the intestinal mucosa may be reduced. Impaired collagen synthesis and osteoporosis may occur 341
and the latter may be due, in part, to impaired hydroxylation of vitamin D (DeLuca, 1976; Tuderman 342
et al., 1977). Similarly, altered vitamin A and prostaglandin metabolism has been noted (Oliveira et 343
al., 2008). In the brain, dopaminergic and serotonin neurotransmission may be reduced in areas such 344
as the substantia nigra, cerebellar nuclei, globus pallidus, and hippocampus and neuromyelination and 345
synapse and dendrite development may be defective. Membrane fatty acid profiles (e.g. reduced 346
docosahexaenoic acid content) can be altered, thereby affecting neuronal function. Functional 347
impairments include delayed responses to auditory and visual stimuli and impaired memory and 348
spatial navigation. These manifestations provide plausible mechanistic bases for inferring that iron 349
deficiency, with or without anaemia, has similar effects in humans. The risk would be greater during 350
periods of rapid growth, i.e. in infancy, childhood and adolescence and during gestation, and the 351
tissues involved would be those with a rapid turnover, specialised function and high energy 352
dependence, such as immunocytes, enterocytes, brain, and muscle. It is important to note that these 353
defects have been associated with severe iron deprivation or deficiency that are not representative of 354
deficiencies customarily encountered in human nutrition, and that there are few data to enable the 355
construction of dose–response curves, relating these outcomes to lesser degrees of iron deficiency. 356
2.2.2.2. Excess 357
The risk of systemic iron overload from dietary sources is negligible with normal intestinal function. 358
Acute large intakes of iron (e.g. 20 mg or more elemental iron/kg body weight), particularly without 359
food, cause corrosive haemorrhagic necrosis of the intestinal mucosa leading to loose stools and blood 360

Draft Dietary Reference Values for iron
EFSA Journal 20YY;volume(issue):NNNN 11
loss, hypovolaemic shock, damaging failure of systemic organs, and death. Early clinical phenomena 361
of this damage, gastritis, nausea, abdominal pain, and vomiting, have been used to set exposure levels 362
for health guidance. 363
Chronic iron overload may occur in individuals affected by haemolytic anaemias, 364
haemoglobinopathies or one of the haemochromatoses and results in increasing sequestration of iron 365
in ferritin and haemosiderin in all tissues throughout the body. Eventually, the haemosiderin degrades 366
releasing iron, which in turn causes oxidative architectural and functional tissue damage resulting in 367
cardiomyopathy, arthropathies, diabetes mellitus and neurological disease. There is no evidence that 368
heterozygotes for haemochromatoses are at an increased risk of iron overload compared with the rest 369
of the population. 370
African iron overload, previously called Bantu cirrhosis, is an ecogenetic disorder arising from an, as 371
yet, uncharacterised genetic defect combined with increased exposure to iron from food and beer that 372
had been prepared in iron utensils. The increased iron deposition affects the Kupffer 373
reticuloendothelial cells of the liver rather than the hepatocytes, which is the case in the other iron 374
overload syndromes. 375
No Tolerable Upper Intake Level (UL) has been set for iron by the SCF or EFSA. Adverse 376
gastrointestinal effects have been reported after short-term ingestion of non-haem iron preparations at 377
doses of 50–60 mg/day, particularly if taken without food. EFSA (2004) considered that these adverse 378
gastrointestinal effects are not a suitable basis to establish a UL for iron from all sources. EFSA 379
(2004) also considered that a UL cannot be established for iron based on iron overload due to 380
inadequate data to enable the construction of reliable response curves between intake, body burden, 381
homeostatic adaptations, and adverse health effects including increased risk of chronic diseases such 382
as cardiovascular disease, diabetes and cancer. This is primarily due to the absence of convincing 383
evidence of a causal relationship between iron intake or stores and chronic diseases (EFSA, 2004). 384
The Institute of Medicine (IOM, 2001) set a UL based on a Lowest Observed Adverse Effect Level 385
(LOAEL) for gastrointestinal side effects observed in Swedish adults following supplementation with 386
ferrous fumarate (60 mg/day) in addition to an estimated dietary iron intake of 11 mg/day. Using an 387
uncertainty factor of 1.5, the UL was set at 45 mg/day for males and females aged 14 years and 388
beyond, including pregnant and lactating women. For infants and children the UL was set at 389
40 mg/day based on a No Observed Adverse Effect Level (NOAEL) for adverse gastrointestinal 390
effects of 30 mg/day observed in toddlers, taking into account a dietary intake of about 10 mg/day, 391
and using an uncertainty factor of 1. 392
2.3. Physiology and metabolism 393
The systemic burden and homeostasis of iron is mediated via regulation of iron absorption and the 394
deposition or sequestration of the element into intracellular pools, mainly in the reticuloendothelial 395
system (RES) and liver. A major driver of systemic iron homeostasis is the cellular and mitochondrial 396
need for iron and oxygen (hypoxia). 397
2.3.1. Intestinal absorption 398
2.3.1.1. Mechanisms of intestinal uptake and transfer of iron 399
Iron absorption occurs mainly in the duodenum and proximal small intestine. The contribution by the 400
distal small intestine and the colon is uncertain and is probably very small. Absorption involves the 401
uptake of iron from the intestinal lumen into enterocytes, its transfer within enterocytes, and 402
subsequent translocation across the basolateral membrane to carriers in the plasma of the portal 403
circulation. 404

Draft Dietary Reference Values for iron
EFSA Journal 20YY;volume(issue):NNNN 12
The enterocytic carrier mechanisms involved in iron uptake and transfer are responsive to the 405
systemic need for the element. The body has no specific mechanism of excreting iron, and the 406
rigorous control of the uptake and transfer of iron into the body is essential for preventing iron 407
overload. 408
Iron released by the digestion of food includes non-haem iron, haem iron, and ferritin. Solubilisation 409
of non-haem iron occurs in the acidic environment of the stomach and proximal duodenum and uptake 410
of inorganic iron occurs mainly in the duodenum and proximal jejunum, whereas the alkaline 411
environment of the jejunum reduces the solubility of free, unbound iron. Uptake into enterocytes is 412
initiated by the conversion of ferric (Fe3+
) to ferrous (Fe2+
) iron by duodenal cytochrome B reductase 413
(DcytB/ferric reductase) which is located on the luminal surface of the enterocytes. The iron is then 414
co-transported with protons (possibly provided by gastric hydrochloric acid, or by a co-located Na+/H
+ 415
exchanger) by the transmembrane divalent metal transporter 1 (DMT1) across the apical membrane 416
into the cytoplasm (Montalbetti et al., 2013). 417
The mechanism for haem iron uptake remains unclear. Two main pathways have been proposed, 418
receptor-mediated endocytosis of haem and direct transport into the intestinal enterocyte by haem 419
(and possibly non-haem iron) transporters (West and Oates, 2008). A putative mucosal haem carrier 420
protein 1 (Shayeghi et al., 2005) is now recognised to be principally a folate transporter. A specific 421
haem transporter has been found in macrophages but not as yet in enterocyte apical membranes. 422
There is controversy over the mechanism of absorption of ferritin. It has been reported to involve a 423
carrier-mediated endocytic pathway into the enterocyte followed by lysosomal dissolution of the 424
ferritin core to release the iron (Kalgaonkar and Lonnerdal, 2008a, 2008b; San Martin et al., 2008), 425
but some (or all) of the iron may be released from the core of the ferritin molecule during gastric 426
digestion and subsequently taken up by DMT1 (Hoppler et al., 2008). 427
In the enterocyte, iron is released from haem by haem oxygenase, and forms a common exchangeable 428
pool with non-haem iron and, presumably, with any iron that has been released by lysosomal 429
degradation of ferritin. Iron from the enterocyte pool can enter three different pathways: (1) it can be 430
transferred (in the ferrous state) to a transmembrane basal transporter (ferroportin 1) for translocation 431
out of the enterocyte to carrier molecules in the portal plasma; (2) some may be sequestered in ferritin 432
iron depots (and shed into the gut lumen at the end of the enterocyte’s lifespan); (3) a small quantity 433
may be taken into the mitochondria for haem synthesis. 434
The export of iron across the basolateral membrane by ferroportin requires its oxidation to the ferric 435
state. This is done by hephaestin which is a copper-dependent ferroxidase bound to the basolateral 436
membrane. The ferric iron is then transferred to apotransferrin for transport to the liver and systemic 437
circulation. 438
2.3.1.2. Regulation of absorption 439
The regulation of the intestinal absorption of iron is integrated with that of systemic iron kinetics and 440
distribution. Other tissues, particularly the central nervous system, and macrophages have uptake 441
(DMTs) and export (ferroportins) systems for iron that are analogous to those in the enterocyte, and 442
which respond similarly to iron deficiency, and also to stressors, inflammation and hypoxia (see 443
below). In healthy subjects, the intestinal mucosal uptake and transfer of dietary iron is inversely 444
related to serum ferritin concentrations, particularly at concentrations below 60 µg/L (Ganz, 2013). 445
These reductions in the absorption of iron are mediated by a hepatic hormone, hepcidin, and by 446
control of expression of the iron transport systems in the enterocytes. 447
Hepcidin is also produced to a lesser extent by monocytes, macrophages, and adipocytes (Ganz, 448
2013). Hepcidin induces the degradation of ferroportin, thereby reducing the enterocytic export of 449

Draft Dietary Reference Values for iron
EFSA Journal 20YY;volume(issue):NNNN 13
iron that has been taken up from the gut lumen. The iron trapped in the enterocytes is sequestered in 450
ferritin and is subsequently lost into the gut lumen when the cells are shed. It has also been shown in a 451
mouse model that hepcidin reduces DMT1 activity (Chung et al., 2009). 452
Hepcidin production is decreased when iron depots are low, when iron utilisation, such as 453
erythropoiesis, is increased and when plasma transferrin concentration is reduced. It is increased when 454
tissue, particularly hepatic iron depots and circulating transferrin concentrations are high. Correlations 455
have been noted between hepcidin mRNA levels and iron content in human liver tissue, and between 456
serum concentrations of ferritin and hepcidin (Ganz, 2013). 457
The expression of enterocytic carriers involved in the uptake (DMTs) and transfer of iron 458
(ferroportins) is effected by an interaction between transferrin and transferrin receptor 1 on the 459
basolateral surfaces of the enteroblasts in the mucosal crypts. This crypt programming becomes 460
effective when the enterocytes have matured and migrated to the villi (Montalbetti et al., 2013). Thus, 461
this mechanism takes 1–2 days to modify iron uptake and transfer, whereas responses to increased 462
hepcidin takes about 8 hours (Ganz, 2013). Hepcidin production is also stimulated by cytokines 463
associated with inflammation, such as interleukins 1 and 6. As well as reducing intestinal absorption 464
of iron, it also induces a “shut down” of systemic iron turnover mediated through both the degradation 465
of cellular ferroportins, hence blocking the export of iron, and by reducing the cellular uptake of iron. 466
This response to inflammation overrides adaptation to an inadequate iron supply, and sustained 467
inflammation or stress e.g. frequent infections and chronic inflammatory diseases can induce a 468
functional iron deficiency including anaemia in people with an adequate iron body burden; this 469
situation is known as the anaemia of chronic disease (Section 2.4). 470
Hepcidin production is also down-regulated by hypoxia. Hypoxic conditions, including iron 471
deficiency and anaemia, induce the production of hypoxaemia inducible factor and, possibly, a bone 472
marrow factor, which depress hepcidin expression and stimulate erythropoiesis, thereby ensuring an 473
iron supply for red blood cell production (Ganz, 2013). 474
2.3.2. Dietary iron forms and bioavailability 475
Dietary iron consists of haem iron and non-haem iron; the latter category includes ferritin which is 476
present in some animal and plant foods, particularly liver and legume seeds, but this form of iron 477
makes only a small contribution to total iron intake in European diets. Small amounts of haem iron are 478
present in some plants and fungi. Mixed diets provide about 90 % of the dietary iron as non-haem iron 479
(Milman, 2011; Jakszyn et al., 2013), the remainder being haem iron from animal foods (in non-480
vegetarian diets). The haem iron content of meat (from haemoglobin and myoglobin) varies 481
considerably (Cross et al., 2012). Balder et al. (2006) undertook a literature search to obtain data for 482
deriving the mean proportion of haem iron relative to total iron for beef, pork, chicken and fish. They 483
selected only those studies that measured total iron directly and, after lipid extraction, haem iron in 484
the same meat sample. The proportion of haem iron from total iron was 69 % for beef; 39 % for pork, 485
ham, bacon, pork-based luncheon meats, and veal; 26 % for chicken and fish; and 21 % for liver. 486
Haem iron may be denatured during cooking (Martinez-Torres et al., 1986), and some iron is lost, 487
according to the type of cooking. For example, losses of haem and non-haem iron are greater when 488
lamb meat is boiled than when it is grilled (Pourkhalili et al., 2013). 489
Fortification iron, commonly added to cereals and infant foods, is usually an iron salt or elemental 490
iron, and percentage absorption varies greatly depending on chemical form and solubility in the 491
gastrointestinal tract and the composition of foods consumed at the same time. 492
Bioavailability is a measure of the absorption and utilisation (haemoglobin incorporation) of dietary 493
iron, and is expressed either as a percentage or a fraction of the total iron intake. The availability of 494
iron for absorption is dependent on the chemical form of iron in the duodenum and small intestine, 495

Draft Dietary Reference Values for iron
EFSA Journal 20YY;volume(issue):NNNN 14
and the physiological requirement that determines the quantity of available iron that is taken up into 496
the enterocytes and transported into the blood. It can generally be predicted from measures of body 497
iron stores (serum ferritin concentration). Dietary factors that facilitate or hinder intestinal uptake of 498
iron become increasingly important when systemic needs are increased. 499
Early studies with radioisotope labelled foods found that iron from animal foods was better absorbed 500
than that from plant foods (Layrisse et al., 1969). Mean haem iron absorption in eight non-anaemic 501
men given three radio-isotopically labelled meals over one day (non-haem iron intake 16.4 mg, haem 502
iron intake 1.0 mg) was 37.3 (SE 2.8) % compared to 5.3 (SE 1.8) % for non-haem iron (Bjorn-503
Rasmussen et al., 1974). When radiolabelled haem iron absorption was measured from six meals 504
given over two days (20–21 mg iron/day) in iron-replete men (geometric mean serum ferritin 505
concentrations ranged from 86–110 μg/L) who had been consuming a diet of low or high iron 506
bioavailability for a period of 10 weeks (Hunt and Roughead, 2000), absorption was 22 % from high 507
bioavailability meals and 21 % from low bioavailability meals. Absorption values at baseline were not 508
significantly different, and this contrasts with non-haem iron absorption where adaptation to diets of 509
differing bioavailability results in alterations in the efficiency of iron absorption. Although there is a 510
less marked effect of body iron status on haem compared to non-haem iron absorption, the 511
relationship needs to be taken into account when interpreting absorption values. In a study using 512
radio-isotopically labelled rabbit haemoglobin to label four meals per day (total iron intake 513
13 mg/day) for five days the mean % absorption of haem iron was 35 % in 12 male blood donors 514
(serum ferritin concentration 37 ± 16 μg/L), and 23 % in 19 non-blood donors (serum ferritin 515
concentration 91 ± 37 μg/L). From the regression equation describing the relationship between % iron 516
absorption and serum ferritin, haem iron absorption was estimated to be 42.3 % when iron stores are 517
close to zero (serum ferritin 15 μg/L) (Hallberg et al., 1997). The Panel considers that absorption of 518
haem iron is approximately 25 %. 519
In addition to systemic factors that control and/or modulate the efficiency of iron absorption, there are 520
a number of components in food that affect non-haem iron absorption. A number of studies have been 521
undertaken giving single meals labelled with radio- or stable isotopes to subjects after an overnight 522
fast, and have consistently shown an enhancing effect of ascorbic acid and muscle tissue 523
(meat/poultry/fish), and an inhibitory effect of phytate, polyphenols and calcium (Hurrell and Egli, 524
2010). 525
Food components classed as inhibitors of non-haem iron absorption generally bind iron in the 526
gastrointestinal tract and prevent its absorption, whereas enhancers of non-haem iron absorption either 527
form complexes that can be taken up by the intestinal iron transport proteins and thereby prevent the 528
iron from binding to inhibitors, or reduce the more reactive Fe3+
iron to its less reactive and more 529
soluble Fe2+
state. 530
Phytate (myo-inositol hexaphosphate) is present at relatively high levels in whole grain cereals and 531
legume seeds and is the main inhibitor of non-haem iron absorption in vegetarian diets. This effect of 532
phytate is dose dependent and starts at very low concentrations (Hallberg et al., 1987). At phytate: 533
iron molar ratios > 6, iron absorption is greatly inhibited from meals containing small amounts of 534
enhancing components, whereas in cereal or soy meals with no enhancers, non-haem iron absorption 535
is greatly inhibited by a molar ratio > 1 (Hurrell and Egli, 2010). Food processing methods such as 536
milling, germination, fermentation and the addition of phytase enzymes can be used to degrade 537
phytate and improve iron absorption from traditional or processed foods (Hurrell, 2004). 538
Ethylenediaminetetraacetic acid (EDTA) will also overcome phytate inhibition in fortified foods such 539
as wheat flour (Hurrell and Egli, 2010). 540
Polyphenol compounds from beverages (tea, coffee, cocoa, red wine), vegetables (spinach, 541
aubergine), legumes (coloured beans), and cereals such as sorghum inhibit non-haem iron absorption 542
in a dose dependent way, depending on the structure of the phenolic compound and extent of 543

Draft Dietary Reference Values for iron
EFSA Journal 20YY;volume(issue):NNNN 15
polymerisation; the gallate-containing tea polyphenols appear to be most inhibitory (Hurrell et al., 544
1999). 545
Calcium reduces both haem and non-haem iron absorption from single meals, and although the 546
mechanism is not fully understood, the reduction in iron uptake and transport into the blood may be 547
effected through temporary internalisation of the apical iron transporter DMT1 (Thompson et al., 548
2010) and/or changes in expression of the iron transporters (Lonnerdal, 2010). In a small bread meal, 549
the effect was dose dependent up to 300 mg calcium with 165 mg calcium causing about 50 % 550
inhibition whether added as calcium chloride or 150 mL milk (Hallberg et al., 1991). However, the 551
same quantity of milk added to a meal of steak, carrots, French fries, Camembert cheese, apple, bread 552
and water had no effect (Galan et al., 1991). 553
Muscle tissue from beef, lamb, chicken, pork and fish, as well as liver tissue, enhance iron absorption 554
from inhibitory meals (Lynch et al., 1989). The nature of the meat factor is uncertain but partially 555
digested cysteine-containing peptides could potentially reduce Fe3+
to Fe2+
iron and chelate iron in the 556
same way as ascorbic acid (Taylor et al., 1986). Storksdieck et al (2007) reported that, unlike other 557
food proteins, muscle proteins are rapidly digested by pepsin and the arrival of many small peptides in 558
the jejunum could be responsible for solubilising iron and improving absorption. Conversely, peptides 559
from legume proteins and some milk proteins inhibit iron absorption (Hurrell and Egli, 2010). The 560
inhibitory nature of soy protein is reported to be due to the peptides formed on digestion of the 561
conglycinin fraction (Lynch et al., 1994), whereas the inhibitory nature of casein is thought to be due 562
to non-absorbable complexes formed between iron and casein phosphopeptides (Hurrell et al., 1989). 563
Ascorbic acid enhances non-haem iron absorption through its ability to reduce Fe3+
to Fe2+
iron at low 564
pH and also its chelating properties (Conrad and Schade, 1968). The effect is dose dependent over a 565
wide range (Cook and Monsen, 1977) and is most pronounced with meals containing high levels of 566
inhibitors such as phytate (Hallberg et al., 1989). Ascorbic acid can ameliorate most or all of the 567
inhibitory effects of other food components as well as enhance the absorption of all iron fortification 568
compounds (Hurrell, 1992) except NaFeEDTA (Troesch et al., 2009). 569
The relevance of results from single meal absorption studies to whole diets has been questioned. They 570
appear to exaggerate the effect of dietary enhancers and inhibitors, probably because of the test 571
conditions used for single meal absorption studies. Absorption efficiency is maximised after an 572
overnight fast, also the effects of enhancers and inhibitors are more pronounced when consumed in a 573
single meal when there is no opportunity for adaptive responses to modulate absorption. The intestinal 574
setting for uptake and transfer of iron, the primary homeostatic mechanism to maintain body iron 575
balance, needs time to respond to changes in diet over longer time periods. Longer-term interventions 576
with single enhancers and inhibitors do not support results from single meal studies, leading to the 577
conclusion that dietary modulators of iron absorption are less important in the context of a Western 578
diet than single meal studies would suggest (Cook et al., 1991). There is either a blunted effect, e.g. 579
with ascorbic acid (Cook and Reddy, 2001) and meat (Reddy et al., 2006), or the effect is no longer 580
observed, e.g. with calcium (Reddy and Cook, 1997), and it has been suggested that the association 581
between meat consumption and higher iron status is mainly due to the intake of haem iron rather than 582
an enhancing effect on non-haem iron absorption (Reddy et al., 2006). 583
In order to compare and contrast results from different absorption studies, the individual data are 584
usually “normalised” with regard to body iron status, as this is the key determinant of efficiency of 585
absorption. One method involves the expression of the results as relative bioavailability by comparing 586
the test substance/food/meal with a reference dose of iron, often 3 mg of well absorbed iron such as 587
ferrous sulphate or ascorbate (Layrisse et al., 1969). The observed absorption from the test food/meal 588
is corrected to a mean reference value of 40 %, which corresponds to absorption by individuals with 589
borderline low iron stores. This is achieved by multiplying test meal absorption values by 40/R, where 590
R is the reference dose absorption (Magnusson et al., 1981). Another widely used method is to correct 591

Draft Dietary Reference Values for iron
EFSA Journal 20YY;volume(issue):NNNN 16
the measured absorption to a serum ferritin concentration corresponding to low levels of iron stores 592
(Cook et al., 1991) by using the following equation: 593
Log Ac = Log Ao + Log Fo - Log Fr 594
where Ac is corrected dietary absorption, Ao is observed absorption, Fo is the observed serum ferritin 595
concentration, and Fr is the reference serum ferritin value selected. Values of 30 and 40 µg/L have 596
been used for Fr (Cook et al., 1991; Reddy et al., 2000). This method does not require administration 597
of a reference dose of iron, and is therefore simpler to use. 598
WHO/FAO proposed dietary iron bioavailability values for setting DRVs of 15 %, 10 % or 5 % 599
depending on the composition of the diet, but the evidence base from which these values were 600
obtained was not provided. The highest bioavailability value is for diversified diets with generous 601
amounts of meat and/or foods rich in ascorbic acid. The lowest bioavailability is for diets based on 602
cereals, tubers and legumes with little or no meat or ascorbic acid-containing fruits and vegetables 603
(Allen et al., 2006). 604
Collings et al. (2013) undertook a systematic review of studies measuring non-haem iron absorption 605
from whole diets, the aim of which was to derive absorption factors that could be used for setting 606
DRVs. There was a wide range in mean percentage absorption values reported (0.7–22.9 %), with 607
different conversions applied to allow for differences in iron status, so a meta-analysis was not 608
possible. It was, however, clear that diet had a greater effect on absorption when iron status (serum 609
ferritin) was low, and absorption was higher in the presence of one or more enhancers, although single 610
inhibitors did not appear to reduce absorption significantly. 611
In pregnant women, there are studies demonstrating a higher efficiency of non-haem iron absorption. 612
A longitudinal study reported geometric mean % absorption from a breakfast meal being 7 % (95 % 613
confidence interval (CI) 5–11) at 12 weeks gestation, 36 % (95 % CI 28–47) at 24 weeks gestation 614
and 66 % (95 % CI 57–76) at 36 weeks gestation (Barrett et al., 1994). There does not appear to be an 615
increase in haem iron absorption; in pregnant women (32–35 week gestation) % utilisation (red blood 616
cell incorporation) of haem iron (in pork meat labelled with 58
Fe stable isotope) was significantly 617
higher than that of ferrous sulphate (labelled with 57
Fe stable isotope), 47.7 (SD 14.4) % and 40.4 (SD 618
13.2) %, respectively, whereas in non-pregnant women the corresponding values were 50.1 (SD 619
14.8) % and 15.3 (SD 9.7) % (Young et al., 2010). There are limited data on iron absorption from 620
whole diets in pregnant women. Svanberg et al. (1975) undertook a longitudinal study measuring non-621
haem iron absorption from a radio-labelled meal given on two consecutive days at 12, 24 and 36 622
weeks gestation. Mean absorption was 1.5 (SE 0.4) %, 5.8 (SE 0.8) % and 14.6 (SE 1.3) %, 623
respectively, although there is no means of normalising the data to account for the effect of 624
differences in iron status, as serum ferritin concentration was not measured and a reference dose of 625
iron was not given. However, it is clear that physiological requirements for the products of 626
conception, as with other physiological states associated with increased requirements, such as low 627
body iron status, result in a marked increase in the efficiency of non-haem iron absorption. The Panel 628
notes that percentage absorption values derived from studies in (non-pregnant) adults and algorithms 629
may not be appropriate for pregnant women, particularly in the second and third trimester. 630
In young children (1–4 years) non-haem iron absorption from the combination of breakfast and lunch, 631
labelled with 58
Fe stable isotope, was reported to be higher in iron-deficient children (serum ferritin 632
concentration < 15 μg/L); geometric mean absorption was 13.7 % compared with 7.2 % in the iron-633
sufficient children. Iron absorption was negatively correlated with serum ferritin concentration (r2
= -634
0.319, P < 0.0001) but there was no relationship with iron intake (Lynch et al., 2007). 635
The Panel notes the limited information on the effects of systemic and dietary factors on iron 636
absorption from whole diets in adults and the very limited data in infants and children. One study 637
(Lynch et al., 2007) measured absorption from two consecutive meals in 1–4 year-old children and the 638

Draft Dietary Reference Values for iron
EFSA Journal 20YY;volume(issue):NNNN 17
results appeared to support observations in adults that iron status is a key determinant of efficiency of 639
non-haem iron absorption. 640
Vegetarians have been reported to have lower iron stores than omnivores, which is attributed to the 641
absence of meat (and fish) in their diet, but they are usually above the cut-off for serum ferritin 642
concentration of 15 µg/L (SACN, 2010). Kristensen et al. (2005) measured the effect of consuming 643
pork meat on radio-labelled non-haem iron absorption over a five-day period and reported a 644
significantly higher absorption from Danish (7.9, SE 1.1 %) and Polish (6.8, SE 1.0 %) pork meat 645
diets compared to a vegetarian diet (5.3, SE 0.6 %). The volunteers had a geometric mean serum 646
ferritin concentration of 19 (range 12–28) μg/L at screening, and when the absorption values were 647
adjusted to a serum ferritin concentration of 30 μg/L (Cook et al., 1991), the corrected absorption fell 648
to 4.2 (SE 0.62) %, 3.6 (SE 0.72) % and 2.5 (SE 0.39) % for the Danish meat, Polish meat and 649
vegetarian diets, respectively. Hunt and Roughead (1999) undertook an intervention study 650
(randomised cross-over design) comparing the effect of a lacto-ovovegetarian and omnivorous diet for 651
eight weeks on serum ferritin concentrations of 21 women aged 20–42 years, and reported that the 652
type of diet had no effect on serum ferritin concentrations. The Panel considers that DRVs do not 653
need to be derived for vegetarians as a separate population group because the bioavailability of iron 654
from European vegetarian diets is not substantially different from diets containing meat and other 655
flesh foods. 656
2.3.3. Metabolism 657
The body has no mechanism for the excretion of iron, and it is argued that the acquisition and 658
distribution of the element is tightly regulated, in order to avoid excessive accumulation of the 659
element. This control of body iron depends on an effective co-ordination of intestinal uptake and 660
transfer of iron, with the recycling of iron from the red blood cell mass and other tissues, the storage 661
and release of iron from the liver, and integumental (i.e. loss from the epidermis and epithelia), and, in 662
women, menstrual losses. At the functional level, the cells involved are the enterocytes, hepatocytes, 663
and the macrophages of the RES (i.e. the monocyte-macrophage system). In macrophages, the uptake 664
and export of iron is mediated by DMT1 and ferroportin, respectively, and as with enterocytes these 665
processes are regulated by hepcidin (Ganz, 2013). A schematic diagram of whole body iron 666
metabolism is shown in Figure 1. 667
668
Figure 1: Whole body iron metabolism. RE system, reticuloendothelial system 669

Draft Dietary Reference Values for iron
EFSA Journal 20YY;volume(issue):NNNN 18
2.3.3.1. Systemic distribution and turnover 670
The systemic turnover of iron has the liver at its hub as the sensor of systemic requirements for iron, 671
the regulator of the intestinal absorption of the metal, and of its distribution (as di-ferric transferrin) to 672
peripheral organs and tissues, all of which are equipped with cell membrane transferrin receptors 673
which enable the endocytosis of transferrin and the intracellular release of iron. There are two types 674
of transferrin receptor (TfR); TfR1 is ubiquitous and is most abundant in erythroblasts, lymphoid 675
tissues and the neuroepithelium, whereas TfR2 is principally sited on the basolateral membranes of 676
hepatocytes where it contributes to the sensory system controlling iron metabolism. 677
The residual apotransferrin is released into the extracellular fluid, whereas the iron is either 678
distributed to cytoplasmic functional sites and depots (ferritin) or transferred into the mitochondria 679
where it is incorporated into the synthesis of iron-sulphur clusters and haem. Degradation of tissues 680
results in the release of iron which may be redistributed to other organs or recycled to the liver. The 681
largest component to the pool of recycling iron is that produced by the breakdown of senescent red 682
blood cells in the RES including the spleen. The size of the recycling pool is reduced by adventitious 683
losses of iron through blood loss, and epithelial, integumental and urinary losses, and by its use for 684
new tissue synthesis (e.g. growth, pregnancy). The recycling and salvage of endogenous iron is at 685
least 90 % efficient. Any depletion is detected by hepatocytic TfR2 which, in turn via hepcidin, 686
regulates the intestinal uptake and transfer of iron to replenish the recycling pool. 687
2.3.3.2. Homeostasis of cellular iron 688
Cellular iron homeostasis is mediated by two iron-responsive proteins (IRP1 and IRP2) which bind to 689
iron-responsive elements (IREs) of mRNAs for proteins involved in iron kinetics. When iron supply is 690
limited, the IRPs repress the production of the apoferritin chains, ferroportin, hypoxaemia-inducible 691
factor 2α, and δ-aminolevulinate synthase which is the initial and rate-limiting enzyme in haem 692
synthesis. This conserves cellular iron by reducing the ferroportin export of iron, and inhibiting 693
synthesis of erythropoietin and haem: simultaneously, the IRPs increase induction of TfR1, DMT1 694
and an organising molecule for the actin cytoskeleton necessary for endocytosis, thereby sustaining 695
production of the cellular apparatus for the uptake of iron (Richardson et al., 2010; Ye and Rouault, 696
2010). 697
If cells have an adequate supply of iron, the synthesis of the IRPs is reduced, as is their stability, and 698
the proteins are subjected to proteolysis. This iron-responsive intracellular regulatory complex 699
involves some highly conserved iron-sulphur clusters and proteins and is disrupted by, amongst other 700
things, hypoxia and inflammation, oxygen and nitrogen radicals, and nitric oxide (Richardson et al., 701
2010). 702
2.3.4. Transport in blood 703
The main carrier of iron in the extracellular space and systemic circulation is transferrin, which is 704
synthesised, mainly in the liver, as a sialylated glycoprotein, apotransferrin. This protein binds one or 705
two ferric iron molecules and delivers them to cell surface TfR1. Approximately 80 % of transferrin-706
bound iron is used for haemoglobin synthesis, and the half-life of recently absorbed iron in plasma is 707
about 75 minutes. 708
The degree of sialylation of transferrin affects its function. For example, transferrin is more highly 709
sialylated in pregnancy, which favours binding to placental transferrin receptors and the uptake of 710
iron by the placenta, whereas with infections and eclampsia transferrin is less sialylated, which limits 711
its binding to transferrin receptors. 712

Draft Dietary Reference Values for iron
EFSA Journal 20YY;volume(issue):NNNN 19
2.3.5. Distribution to tissues 713
About 25 mg of systemic iron is recycled daily (Figure 1). Much of this turnover represents the 714
salvage and recycling of iron from the 1011
senescent erythrocytes daily by the monocyte-macrophage 715
system. Iron is released from the red blood cell haem by haemoxygenase, and it is either exported as 716
ferric iron by the macrophages’ ferroportin to apotransferrin which moves the iron elsewhere, or it is 717
deposited in the macrophages’ intracellular ferritin pool. Iron from the turnover of other tissues is 718
recycled similarly by the monocyte-macrophage system. 719
Transferrin-TfR complexes on cell membranes are endocytosed. The pH of the endosome is reduced 720
through the activity of a proton pump which decreases the affinity of transferrin for iron, and iron is 721
released, reduced to the ferrous form by a ferrireductase in the endosomal membrane, and transferred 722
out of the endosome into the cytoplasm by DMT1. In the cytoplasm it forms a chelatable iron pool 723
which supplies iron for metabolic needs, including iron uptake by the mitochondria for haem and iron 724
sulphur cluster synthesis (Richardson et al., 2010). The apotransferrin and TfR proteins return to the 725
cell surface and the apotransferrin is recycled into plasma. 726
The circulation contains a small amount of non-transferrin bound iron. Some of this is circulating 727
ferritin which has a high L-chain content, suggesting it is from the RES rather than from the liver. 728
Other circulating ligands include acetate, citrate, and albumin. Furthermore, a siderophore-bound 729
form of iron has been found in mammals. The significance of these forms is unknown. However, 730
whereas the transferrin cycle of iron is essential for red blood cell production, other tissues are able to 731
acquire iron from non-transferrin bound iron (cited in Chen and Paw (2012)). 732
In pregnant women, similar transport mechanisms exist for the placental transfer of iron. In the 733
developing fetus, iron is accumulated against a concentration gradient and, even with maternal iron 734
deficiency, the placenta can protect the fetus through the increased expression of placental TfR 735
together with a rise in DMT1. Iron released from endosomes is carried across the basolateral 736
membrane by ferroportin and is oxidised from ferrous to ferric iron by zyklopen, prior to 737
incorporation into fetal transferrin. An additional haem transport system has been hypothesised, 738
which may explain why certain gene knockouts are not lethal for the developing fetus (McArdle et al., 739
2014). 740
During lactation, the uptake of iron into the mammary gland follows the same process as in other 741
cells, but there is no evidence that DMT1 facilitates iron export from endosomes. Iron in the 742
intracellular chelatable iron pool can be secreted across the luminal membrane into milk. Export of 743
iron from the mammary gland is most likely achieved by ferroportin which is localised to the 744
endoplasmic reticulum in reticuloendothelial cells, where it is believed to transport iron into 745
intracellular vesicles prior to secretion (Lonnerdal, 2007). 746
2.3.6. Storage 747
Total body iron approximates 3.8 g in men and 2.3 g in women, which is equivalent to 50 mg/kg body 748
weight for a 75-kg man (Bothwell et al., 1979; Bothwell, 1995) and 42 mg/kg body weight for a 55-kg 749
woman (Bothwell and Charlton, 1981), respectively. More recently, Hunt et al. (2009) assessed 750
obligatory loss of endogenous iron twice yearly for up to three years in 53 free-living subjects using 751
values based on haemoglobin concentrations (3.39 mg iron/g haemoglobin), estimated total blood 752
volumes calculated with formulae based on body weight and height, systemic iron stores calculated 753
from serum concentrations of TfR and ferritin, and the loss of a previously administered radio-iron 754
tracer. Total body iron was calculated to be 4.4 g in men and 2.8 g in women, and to be 48 mg/kg 755
body weight in males and 38 mg/kg body weight in females (Hunt et al., 2009) (see Section 2.3.7.3). 756
The main systemic depot for iron is the liver where it is stored as the soluble protein complex ferritin 757
and, to a lesser extent, ferritin-derived insoluble haemosiderin. Estimates of body iron distribution are 758

Draft Dietary Reference Values for iron
EFSA Journal 20YY;volume(issue):NNNN 20
as follows: haemoglobin 2.5–3.5 g; myoglobin 0.3–0.4 g, and the haem and non-haem enzymes 759
100 mg. Ferritin and haemosiderin together comprise 1.0 g of iron (although this is very variable) and 760
the transit pools of extracellular transferrin and intracellular carriers are considered to contain around 761
3 mg and 7 mg of iron, respectively. 762
Iron that is not functionally used and which cannot be excreted by cells is deposited in ferritin in the 763
cytosol and mitochondria. Ferritin is a hollow sphere comprising 24 apoferritin subunits. It has 764
channels through which iron can enter and leave the sphere. There are two subunits, heavy and light 765
subunits and the ratio of these varies between organs (heavy chains predominate in the heart and 766
brain, and light chains in the liver and spleen). Ferritin contains iron in the ferric state; this is enabled 767
by the heavy chain which has a ferroxidase activity, and the ratio of heavy and light chains influences 768
the mobility of their associated iron. Expression and synthesis of the heavy and light apoferritin 769
chains and that of other proteins mediating iron turnover are controlled by a common intracellular 770
iron-sensing system and their synthesis is promoted by an adequate iron supply and by inflammation, 771
ionic iron and oxidative stressors. The principal pools of ferritin are the liver and the RES. The former 772
mobilises iron to maintain the systemic pool and is the main repository for excess iron, whereas the 773
latter represents an endogenous recycling pool of iron supporting the erythron. 774
2.3.7. Losses 775
Since the body has no specific pathway for the excretion of iron, it is only lost from the body 776
adventitiously via turnover and shedding of skin and hair, the mucosa of the gastrointestinal, 777
respiratory, and genito-urinary tracts, as well as being present in sweat, intestinal secretions 778
(including bile), urine, and semen and menstrual blood. 779
2.3.7.1. Losses via skin, hair, sweat, urine and faeces 780
Estimations of dermal and sweat losses of iron are methodologically and analytically challenging. 781
Although some differentiation between the amount of iron in sweat and that in exfoliated skin cells 782
can be achieved when great care is taken (Jacob et al., 1981), these studies demonstrate that dermal 783
iron losses are not directly related to estimated endogenous iron load or to dietary intake, but are 784
closely related to body weight and size. This relates to the greater epithelial surface area of larger 785
people; a similar but non-significant correlation can be detected in women if their data are corrected 786
for menstrual losses (Hunt et al., 2009). The vast majority of iron excreted in the faeces is dietary in 787
origin (unabsorbed iron), but a small quantity of systemic iron is excreted in the intestinal tract, 788
primarily via biliary secretions. 789
2.3.7.2. Menstrual iron losses 790
There is a very wide inter-individual variation in menstrual blood loss, but for individuals it is fairly 791
constant between cycles (Hallberg and Nilsson, 1964). Excessive menstrual blood loss 792
(hypermenorrhea) is a well-established risk factor for iron deficiency anaemia. The classic definition 793
of hypermenorrhea is a blood loss of 80 mL or more per cycle (Warner et al., 2004), and it is 794
influenced by contraceptive use; losses are reduced with oral contraceptives (Larsson et al., 1992) and 795
increased with intrauterine devices (Milsom et al., 1995). In the 1960s, before widespread use of oral 796
contraceptives, Hallberg et al. (1966b) measured menstrual losses in groups of Swedish females aged 797
15, 23, 30, 40 and 50 years, and reported a mean value for the total 476 females of 43.4 mL; the 15 798
year-old group had the smallest (90th percentile 65.1 mL) and the 50 year-old group the highest (90
th 799
percentile 133.1 mL) mean value of menstrual blood loss; the 90th percentile for all ages combined 800
was 83.9 mL. No information on contraceptive use was given. The authors concluded that the upper 801
normal limit of menstrual blood loss is between 60–80 mL and that a loss above 80 mL should be 802

Draft Dietary Reference Values for iron
EFSA Journal 20YY;volume(issue):NNNN 21
considered as pathological. Menstrual iron losses have been estimated to account for 90 % of the 803
variance in the loss of endogenous iron for women (Hunt et al., 2009). 804
In a small study of 13 premenopausal women, iron losses in menstrual periods ranged from 0.5–56 mg 805
per period or, adjusted for the reported number of menstrual periods per year, 0.015–1.86 mg/day 806
(Hunt et al., 2009). The geometric mean iron loss was 0.28 (0.08 -SD, 1.05 +SD) mg/day of iron from 807
menstruation when calculated on a daily basis. These values were similar to those derived earlier by 808
Harvey et al. (2005) who undertook measurements in 90 women aged 18–45 years, 35.5 % of whom 809
used oral contraceptives and 5.5 % used an intrauterine device, and reported a mean (SD) iron loss of 810
0.43 (± 0.45) mg/day with a median menstrual iron loss of 0.26 mg/day. The data were highly skewed 811
with 70 % of women losing less than 0.5 mg/day through menses. Hypermenorrhea was observed in 812
7 % of the women. There was a significantly lower median blood loss (mL/cycle) in oral 813
contraceptive users than in those using other forms of contraception (excluding intrauterine devices). 814
Percentiles of iron losses in this group of 90 women are shown in Appendix B. 815
In a cohort of more than 12 000 randomly selected women aged 15–49 years from five European 816
countries (Skouby, 2010), oral contraceptives were reported to be used by 45 %, 34 %, 27 %, 19 % 817
and 19 % of women in France, Germany, UK, Italy and Spain, respectively; the overall mean was 818
30 %. Information on the use of intrauterine devices (which increase menstrual blood loss) is not 819
provided, but this method of contraception is much less common than oral contraceptives because 820
reversible long-term methods, which include intrauterine devices/systems, implants and injection, 821
were used by only 11 % of the European study population. 822
According to data collected from Finland in 2007, the median age at natural menopause was 51 years 823
(Pakarinen et al., 2010) and from data collected in 1979–86 from 11 different countries for WHO, the 824
median age at natural menopause ranged between 49 and 52 years (Morabia and Costanza, 1998). 825
2.3.7.3. Whole body iron losses 826
In the context of setting DRVs, the most pragmatic approach is to avoid estimating total adventitious 827
iron loss based on data for the individual routes of loss as this increases variability; it is preferable to 828
use composite data acquired from long-term studies of body iron loss. Iron radioisotopes have been 829
used to label the systemic pool and enable measurement of losses of endogenous iron. Total 830
obligatory losses from the body were measured in white men in the US (0.95 ± 0.30 mg/day), Mestizo 831
men in Venezuela (0.90 ± 0.31 mg/day) and Indian men in South Africa (1.02 ± 0.22 mg/day) (Green 832
et al., 1968). The average loss was 0.9–1.0 mg/day, which equates to 14 µg/kg body weight per day 833
for a 70-kg man. More recently, Hunt et al. (2009) measured basal losses of iron using a similar 834
method to Green et al. (1968) in 29 men, 19 menstruating women, and five postmenopausal women. 835
Mean iron loss by men was 1.07 ± 0.47 (range 0.11–2.07, median 1.18) mg/day, which equates to 836
12 ± 5 μg/kg body weight per day; losses were normally distributed. Losses in the postmenopausal 837
women were similar to the men, 1.08 ± 0.28 (range 0.86–1.57, median 0.99) mg/day, which equates to 838
16 ± 4 μg/kg body weight per day. In contrast, iron losses in the premenopausal women were highly 839
skewed with a geometric mean of 1.69 (0.98 -SD, 2.92 +SD; range 0.65–4.88) mg/day, which equates 840
to a geometric mean of 23 (13 -SD, 40 +SD) μg/kg body weight per day. When the women using oral 841
contraceptives (n = 4) were excluded from the analysis the iron loss was higher, with a geometric 842
mean of 1.89 mg/day. The Panel notes the relatively small number of individuals in this study, and the 843
wide variability, particularly in the premenopausal women, but considers the data to be the most 844
accurate estimate of whole body losses for deriving dietary requirements for iron. 845
2.3.7.4. Breast milk 846
Regulated transport of iron through the mammary gland epithelium is suggested by the lack of 847
correlation between plasma mineral concentration and milk mineral concentration, and studies in 848

Draft Dietary Reference Values for iron
EFSA Journal 20YY;volume(issue):NNNN 22
animals have shown that iron is transported by DMT1 through the basolateral membrane into the 849
alveolar cells and is then exported by ferroportin1 in the apical membrane. DMT1 and ferroportin1 850
concentrations are higher during early lactation and are possibly involved in iron transfer into milk 851
(Leong and Lonnerdal, 2005). Transferrin receptors are also likely to be involved in iron uptake 852
(Sigman and Lonnerdal, 1990). The mammary gland has a capacity to control milk iron concentration 853
by adapting to both maternal deficiency and excess of iron (Lonnerdal, 2007). Thus, iron 854
concentration of human milk does not correlate with maternal iron intake (Picciano and McDonald, 855
2005) or status (Celada et al., 1982). No differences in iron concentration of milk from women 856
receiving iron supplements were observed even in women with intakes of at least 30 mg iron/day 857
(Picciano and Guthrie, 1976). This finding is in agreement with other investigators who have been 858
unsuccessful in attempts to raise the iron concentration in milk with dietary supplementation 859
(Karmarkar and Ramakrishnan, 1960). 860
A wide range of values has been reported in the literature for iron in human milk at all stages of 861
lactation, partly due to differences in sampling procedures and timing (e.g. milk iron concentration is 862
lower in the morning compared to the afternoon) as well as stage of lactation. Changes in iron 863
concentration throughout the day were explained by both intra-individual (53 %) and inter-individual 864
variation (39 %) (Picciano and Guthrie, 1976). Milk iron concentration decreases with longer 865
durations of lactation (Feeley et al., 1983); for example, Picciano (2001) reported that the iron 866
concentration of milk in the early stages of lactation was 0.5–1.0 mg/L and that mature milk contained 867
0.3–0.9 mg/L. IOM evaluated nine studies with small groups of lactating women at various stages of 868
lactation and concluded that the mean iron concentration of human milk is about 0.35 mg/L (IOM, 869
2001). SCF (2003) considered the iron concentration of mature breast milk to be about 0.3 mg/L on 870
the basis of reported values in European women (Siimes et al., 1979), later confirmed by Domellof et 871
al. (2004). In 30 women of Mexican-American heritage, Hannan et al. (2009) found a mean iron 872
concentration in milk of 0.5 ± 1.0 mg/L through days 30–45 of lactation and 0.4 ± 0.3 mg/L through 873
days 75–90. The Panel considers that the iron concentration of mature human milk in European 874
women is around 0.3 mg/L. 875
2.3.8. Interactions with other nutrients 876
The availability of iron for absorption in the duodenum and small intestine is affected by a number of 877
dietary constituents, which either act as inhibitors, e.g. phytate and polyphenols, or enhancers, e.g. 878
ascorbic acid and animal tissue (see Section 2.3.2). The mechanism of action is the formation of iron 879
complexes in the digestive chyme in the gut lumen, and the strength of binding dictates whether or not 880
the iron can be removed from the complex by DMT1. In addition, ascorbic acid reduces ferric (Fe3+
) 881
iron to ferrous (Fe2+
) which is the chemical form that is taken up by DMT1 (see Section 2.3.1). 882
Calcium and zinc have been reported to reduce iron absorption, but the mechanisms are unclear and 883
the effect appears to be short-term. The proposed mechanism for the inhibitory effect of calcium on 884
iron absorption is internalisation of DMT1 (Thompson et al., 2010) and because this is an acute 885
effect, adaptation will occur with time, which could explain why long-term calcium supplementation 886
studies fail to show an effect on iron status (Lonnerdal, 2010). A recent review of published studies 887
on the effects of zinc on iron absorption concluded that the inhibitory effect of zinc occurs at a Zn:Fe 888
(weight/weight) ratio of 1:1 in aqueous solutions but, importantly, there is no inhibitory effect in food 889
matrices (Olivares et al., 2012). When iron absorption from a hamburger meal, labelled with 890
radioiron, was measured in the presence of additional zinc (15 mg) and manganese (3 mg), there was 891
no effect with added zinc but manganese had a strong inhibitory effect (Rossander-Hulten et al., 892
1991). The mechanism is probably via competition for DMT1. Effects of copper and zinc on the 893
regulation of iron transporters have recently been proposed (Scheers, 2013). Although there is no 894
direct competition for DMT1, copper is required for the efflux of ferrous iron through ferroportin. 895
Zinc up-regulates DMT1 expression in Caco-2 cells, thereby increasing iron uptake (Yamaji et al., 896

Draft Dietary Reference Values for iron
EFSA Journal 20YY;volume(issue):NNNN 23
2001), and promotes ferroportin transcription by stimulating the binding of metal transcription factor 897
1 to the ferroportin promotor (Troadec et al., 2010). 898
Copper-iron interactions are influenced by age and stage of development (Collins et al., 2010). They 899
can affect prenatal development (Gambling et al., 2008). In addition to the well-understood effects of 900
copper deficiency on iron metabolism (leading to anaemia), there is some evidence suggesting that 901
copper deficiency results in lower liver iron concentration, and delivery of iron (as well as copper) to 902
the fetus may be compromised (Andersen et al., 2007). 903
Vitamin A can affect several stages of iron metabolism, including erythropoiesis and the release of 904
iron from ferritin stores. A number of trials have been undertaken to examine the effect of vitamin A 905
supplementation/fortification on indices of iron status (Michelazzo et al., 2013), and many report an 906
impact of vitamin A on haemoglobin and other parameters. Studies examining the effect of vitamin A 907
on iron absorption have produced conflicting findings and it is not clear whether vitamin A and/or 908
iron status are key determinants of an effect (Hurrell and Egli, 2010). 909
Riboflavin is involved in erythropoiesis, and deficiency results in disturbances in the production of 910
red blood cells. The mechanism is thought to be impaired mobilisation of iron from ferritin (via 911
reduced flavins). The very limited evidence available suggests that iron absorption is not affected 912
(Fairweather-Tait et al., 1992), and that the effects on iron are through changes in iron economy 913
(Powers, 2003). 914
The Panel considers that interactions between iron and other minerals, vitamins and certain dietary 915
constituents (see Section 2.3.2), in the context of a mixed European diet, are not relevant for setting 916
DRVs for iron. 917
2.4. Biomarkers of intake and status 918
There are no known biomarkers of iron intake, so the information has to be obtained by measuring 919
dietary intake. Accurate measurement of dietary iron intake is hampered by several factors including 920
the quality of food composition data (especially information on haem iron and foods fortified with 921
iron), and use of iron supplements. The approaches that can be used included duplicate diet collection, 922
weighed or estimated (from household measures/portion sizes) dietary records, 24-hour recalls, diet 923
history and (validated) food frequency questionnaires (FFQ) (EFSA NDA Panel, 2010). 924
A review of methods to assess iron status was published by Zimmermann (2008). They can be 925
categorised according to whether they represent the main functional use of iron (synthesis of 926
haemoglobin), transport and supply of iron to tissues, or iron storage (SACN, 2010) and include: 927
Haemoglobin and haematocrit. These markers are widely used but have low specificity and 928
sensitivity, and reference ranges and cut-off criteria differ with ethnicity, age and sex and the 929
laboratory where it is measured. Intra-individual variability of haemoglobin is low (< 3 %). The 930
measurements can be made in fasted or non-fasted blood samples and only small samples are 931
required, so capillary blood can be used. However, this can lead to inaccurate or variable results 932
if the capillary sample is not collected properly. 933
Reticulocyte haemoglobin content. Measurement of reticulocyte haemoglobin content in 934
peripheral blood samples is useful for diagnosis of iron deficiency in adults (Mast et al., 2002) 935
and children (Brugnara et al., 1999; Ullrich et al., 2005; Bakr and Sarette, 2006). Reticulocyte 936
haemoglobin content can be used to differentiate iron deficiency from other causes of anaemia. 937
Mean cell volume (MCV), mean cell haemoglobin (MCH) and the red cell distribution width are 938
part of the profile obtained from automated cell counter analysers, but are not commonly used in 939

Draft Dietary Reference Values for iron
EFSA Journal 20YY;volume(issue):NNNN 24
the diagnosis of iron deficiency. MCV is a relatively late indicator of iron deficiency and is 940
affected by thalassaemia. 941
Erythrocyte zinc protoporphyrin (ZPP). A lack of iron in the bone marrow during the final stages 942
of haemoglobin synthesis leads to the incorporation of zinc into protoporphyrin instead. This is a 943
common screening tool for field work but is affected by lead poisoning, malaria, chronic 944
infections, inflammation, and haemoglobinopathies. 945
Serum iron, total iron binding capacity (TIBC) and transferrin saturation. The serum iron pool 946
comprises Fe3+
, bound to transferrin. The percentage transferrin saturation is the ratio of serum 947
iron to TIBC. Although this biomarker can be used to screen for iron deficiency, it is limited by 948
circadian variation and confounding effects of infectious diseases and many other clinical 949
disorders. For these measurements fasting blood samples must be taken, as serum iron is affected 950
by dietary iron intake. Serum iron is sometimes used to diagnose iron overload 951
(haemochromatosis). 952
Bone marrow biopsy. The bone marrow is a major storage site for iron and absence of stainable 953
iron in the bone marrow is the gold standard for the diagnosis of iron deficiency anaemia, 954
especially in the diagnosis of complicated anaemias in hospital patients. It is, however, an 955
invasive procedure and there may be methodological problems with the aspiration of bone 956
marrow. Therefore, it is not commonly used to measure iron status. 957
Serum ferritin. This is probably the most useful laboratory measure of iron status, because the 958
concentration is directly proportional to stainable iron in the bone marrow and thus is indicative 959
of the capacity of hepatic stores to sustain iron levels in the erythron. Estimates from phlebotomy 960
studies indicate that 1 g/L of serum ferritin corresponds to 8 mg mobilisable iron from systemic 961
stores (Walters et al., 1973). However, because serum ferritin is an acute phase protein, it may 962
not provide an accurate estimate of iron stores in acute or chronic inflammation or infection. 963
Soluble serum transferrin receptor (sTfR). This is a useful diagnostic tool for iron deficiency, 964
being less confounded by inflammation than serum ferritin, although its diagnostic value for 965
children in regions where malaria and infection are endemic is less certain. 966
Ratio of serum sTfR (R) to ferritin (F). The ratio has been shown to be more reliable than either 967
parameter alone for the identification of iron deficiency. It is the best predictor of absent bone 968
marrow iron and is the most sensitive indicator of a change in iron status following iron 969
supplementation. It was validated for men using quantitative phlebotomy plus correction for 970
absorbed iron. Body iron can be calculated from the serum transferrin receptor/ferritin ratio 971
(body iron (mg/kg) = −[log(R/F ratio) − 2.8229]/0.1207) and is particularly useful for assessing 972
longitudinal changes in iron status, e.g. resulting from an intervention. 973
The greatest challenge when assessing iron status is to distinguish between iron deficiency anaemia 974
and anaemia of chronic disease which results from the enhanced expression of hepcidin (Section 975
2.3.1.2). Inflammatory biomarkers, such as C-reactive protein or α-1-acid glycoprotein, can be 976
measured to identify the presence of infection or inflammation. Assessing iron status in populations 977
where infectious diseases are common, as in some developing countries, and where inflammation is 978
present, as in older adults (Fairweather-Tait et al., 2014), is most problematic. There is also limited 979
information on reference values for infants and young children, and allowances have to be made for 980
blood volume expansion in pregnancy. As most biomarkers of iron status have low sensitivity and 981
specificity, they are sometimes combined in models to define iron deficiency, for example the ferritin 982
model based on low serum ferritin and transferrin saturation and high ZPP. Although this increases 983
specificity, these models tend to underestimate iron deficiency. 984

Draft Dietary Reference Values for iron
EFSA Journal 20YY;volume(issue):NNNN 25
A pragmatic approach to identifying iron deficiency or a significant risk thereof is to use, as a 985
threshold, a serum ferritin concentration of 15 μg/L. Iron deficiency anaemia is defined as the 986
combination of iron deficiency and anaemia (low haemoglobin). Where several indices can be 987
measured the best combination is haemoglobin, serum ferritin, sTfR and/or ZPP (see also Appendix 988
A). 989
2.5. Effects of genotype 990
Hereditary haemochromatosis is one of the most common single gene disorders found in Northern 991
European populations. This disease is due to mutations in the HFE gene, and two common variants of 992
the gene, C282Y and H63D, have been identified. The clinical penetrance of homozygosity for 993
C282Y is very variable (ranging from 1–25 % depending on the study design and endpoints used) and 994
the majority of individuals with this genotype do not present with iron overload (Beutler et al., 2002), 995
but in those affected up to 10–33 % eventually develop haemochromatosis-associated morbidity 996
(Whitlock et al., 2006). The mechanism for the effect is increased iron absorption (Pietrangelo, 2010). 997
Homozygosity for the C282Y mutation has been reported to occur in approximately 0.5 % of the 998
Caucasian population (Allen et al., 2008). The frequency of heterozygotes in Caucasians is estimated 999
to be 13 % (9.5–18 %) (Nelson et al., 2001). Iron absorption does not appear to be significantly 1000
increased in heterozygotes (Hunt and Zeng, 2004), although the distribution of serum ferritin 1001
concentration is shifted to the right indicating higher body iron levels (Roe et al., 2005). The HFE 1002
H63D variant is more widespread worldwide but has a less well-defined role in predisposing 1003
individuals to iron overload. Other types of genetic haemochromatosis are caused by defects in 1004
haemojuvelin, hepcidin, TfR2, and ferroportin, but these are very rare in European populations. 1005
1006
The Panel concludes that carriers of HFE mutations have the same dietary requirements for iron as 1007
wild type individuals and that rare polymorphisms should not be taken into consideration when 1008
deriving DRVs. 1009
3. Dietary sources and intake data 1010
3.1. Dietary sources 1011
Foods that contain relatively high concentrations of iron include meat, fish, cereals, beans, nuts, egg 1012
yolks, dark green vegetables, potatoes, and fortified food products; the iron content of dairy products 1013
and many fruits and vegetables is much lower. 1014
Currently, ferrous bisglycinate, ferrous carbonate, ferrous citrate, ferric ammonium citrate, ferrous 1015
gluconate, ferrous fumarate, ferric sodium diphosphate, ferrous lactate, ferrous sulphate, ferrous 1016
ammonium phosphate, ferric sodium EDTA, ferric diphosphate (ferric pyrophosphate), ferric 1017
saccharate, elemental iron (carbonyl + electrolytic + hydrogen reduced) may be added to both foods6 1018
and food supplements,7 whereas ferrous L-pidolate, ferrous phosphate and iron (II) taurate may only 1019
be used in food supplements.6 The iron content of infant and follow-on formulae
8 and processed 1020
cereal-based foods and baby foods for infants and young children9 is regulated. 1021
6 Regulation (EC) No 1925/2006 of the European Parliament and of the Council of 20 December 2006 on the addition of
vitamins and minerals and of certain other substances to foods, OJ L 404, 30.12.2006, p. 26 7 Directive 2002/46/EC of the European Parliament and of the Council of 10 June 2002 on the approximation of the laws of
the Member States relating to food supplements, OJ L 183, 12.7.2002, p. 51 8 Commission Directive 2006/141/EC of 22 December 2006 on infant formulae and follow-on formulae and amending
Directive 1999/21/EC, OJ L 401, 30.12.2006, p.1. 9 Commission Directive 2006/125/EC of 5 December 2006 on processed cereal-based foods and baby foods for infants and
young children, OJ L 339, 06.12.2006, p. 16.

Draft Dietary Reference Values for iron
EFSA Journal 20YY;volume(issue):NNNN 26
3.2. Dietary intake 1022
EFSA estimated dietary intakes of iron from food consumption data from the EFSA Comprehensive 1023
European Food Consumption Database (EFSA, 2011b), classified according to the food classification 1024
and description system FoodEx2 (EFSA, 2011a). Data from 13 dietary surveys from nine EU 1025
countries were used. The countries included were Finland, France, Germany, Ireland, Italy, Latvia, the 1026
Netherlands, Sweden and the UK. The data covered all age groups from infants to adults aged 1027
75 years and older (Appendix C). 1028
Nutrient composition data for iron were derived from the EFSA Nutrient Composition Database (Roe 1029
et al., 2013). Food composition information of Finland, France, Germany, Italy, the Netherlands, 1030
Sweden and the UK were used to calculate iron intakes in these countries, assuming that the best 1031
intake estimate would be obtained when both the consumption data and the composition data are from 1032
the same country. For nutrient intake estimates of Ireland and Latvia, food composition data from the 1033
UK and Germany, respectively, were used, because no specific composition data from these countries 1034
were available. The amount of borrowed iron values in the seven composition databases used varied 1035
between 15 and 85 %. Estimates were based on food consumption only (i.e. without dietary 1036
supplements). Nutrient intake calculations were performed only on subjects with at least two 1037
reporting days. Data on infants were available from Finland, Germany, the UK, and Italy. The 1038
contribution of human milk was taken into account if the amounts of human milk consumed (Italian 1039
INRAN SCAI survey and the UK DNSIYC survey) or the number of breast milk consumption events 1040
(German VELS study) were reported. In case of the Italian INRAN SCAI survey, human milk 1041
consumption had been estimated based on the number of eating occasions using standard portions per 1042
eating occasion. In the Finnish DIPP study only the information “breast fed infants” was available, but 1043
without any indication about the number of breast milk consumption events during one day or the 1044
amount of breast milk consumed per event. For the German VELS study, the total amount of breast 1045
milk was calculated based on the observations by Paul et al. (1988) on breast milk consumption 1046
during one eating occasion at different ages, i.e. the amount of breast milk consumed on one eating 1047
occasion was set to 135 g/eating occasion for infants aged 6–7 months and to 100 g/eating occasion 1048
for infants aged 8–12 months. The Panel notes the limitations in the methods used for assessing breast 1049
milk consumption in infants (Appendices D and E) and related uncertainties in the intake estimates 1050
for infants. 1051
Average iron intake ranged between 2.6 and 6.0 mg/day (0.9–1.9 mg/MJ) in infants (aged between 1 1052
and 11 months, four surveys), between 5.0 and 7.0 mg/day (1.2–1.6 mg/MJ) in children aged 1 to < 3 1053
years (five surveys), between 7.5 and 11.5 mg/day (1.1–1.7 mg/MJ) in children aged 3 to < 10 years 1054
(seven surveys), between 9.2 and 14.7 mg/day (1.1–1.7 mg/MJ) in children aged 10 to < 18 years (six 1055
surveys), and between 9.4 and 17.9 mg/day (1.2–2.1 mg/MJ) in adults ( 18 years) (eight surveys). 1056
Average daily intakes were in most cases slightly higher in males (Appendix D) compared to females 1057
(Appendix E) mainly due to larger quantities of food consumed per day. 1058
The main food group contributing to iron intakes was grains and grain products representing more 1059
than 20 % and up to 49 % of the iron intake in all population groups except infants. Other main 1060
contributing food groups were meat and meat products (5 % up to 27 %), vegetable and vegetable 1061
products (4 % up to 17 %) and composite dishes (1 % up to 15 %). Differences in main contributors 1062
to iron intakes between sexes were minor (Appendix D and E). 1063
EFSA’s iron intake estimates in mg/day were compared with published intake values from the same 1064
survey and dataset and the same age class using the German EsKiMo and VELS surveys in children 1065
(Kersting and Clausen, 2003; Mensink et al., 2007), the DIPP study in Finnish children (Kyttälä et al., 1066
2008; Kyttälä et al., 2010), the study in Finnish adolescents (Hoppu et al., 2010), the French national 1067
INCA2 survey (Afssa, 2009), the Irish NANS (IUNA, 2011), the FINDIET 2012 Survey (Helldán et 1068
al., 2013), the Italian INRAN-SCAI Survey (Sette et al., 2011), the Dutch National Dietary Survey 1069
(van Rossum et al., 2011), the Swedish national survey Riksmaten (Amcoff et al., 2012), the 1070

Draft Dietary Reference Values for iron
EFSA Journal 20YY;volume(issue):NNNN 27
DNSIYC-2011 Study in UK infants and young children (Lennox et al., 2013) and the UK NDNS 1071
(Bates et al., 2012) (Table 1). 1072
Table 1: EFSA’s average daily iron intake estimates, expressed as percentages of intakes reported 1073
in the literature 1074
Country % of published intake (% range over different age classes in a specific survey)
Finland 83 (DIPP young children, 1 to < 3 years), 104 (DIPP children, 3 to < 10 years), 111–116 (Finnish
adolescents), 100–105 (FINDIET 2012)
France 96–115 (INCA2)
Germany 90–99 (VELS infants), 111–122 (VELS children), 101–108 (EsKiMo)
Ireland 104–109 (NANS)
Italy 94–102 (INRAN-SCAI infants and young children, 1 to < 3 years ), 98–102 (INRAN-SCAI other age
groups)
NL 108–113 (Dutch National Dietary Survey)
Sweden 116–121 (Riksmaten)
UK 107–109 (DNSIYC infants and children aged up to 1.5 years), 95–112 (NDNS–Rolling Programme,
Years 1–3)
When the EFSA intake estimates were compared with published intake estimates from the same 1075
survey and age range, the EFSA estimates differed up to around 15 % from the published values in 1076
Finland, France, Ireland, the Netherlands, the UK and in Germany, except for German children in the 1077
VELS study for which they were higher by up to 22 % compared to published values. In Sweden the 1078
EFSA intake estimates were higher by 16–21 % compared to published values. Overall, several 1079
sources of uncertainties may contribute to these differences, including inaccuracies in mapping food 1080
consumption data according to food classifications and in nutrient content estimates available from 1081
the food composition tables, the use of borrowed iron values from other countries in the food 1082
composition database, and replacing missing iron values by values of similar foods or food groups in 1083
the iron intake estimation process. It is not possible to conclude which of these intake estimates (i.e. 1084
EFSA’s intake estimates or the published ones) would be closer to the actual iron intakes of the 1085
respective population groups. 1086
Iron intakes in 521 457 individuals aged 35–70 years from 10 European countries were recently 1087
calculated as part of the European Prospective Investigation into Cancer and Nutrition study (Jakszyn 1088
et al., 2013). Total iron intake was around 12 mg/2 000 kcal with mean (± SD) intakes of haem and 1089
non-haem iron, expressed as mg/2 000 kcal, of 0.49 (± 0.26) and 11.51 (± 2.67), respectively, in tertile 1090
1 of haem iron intake and 1.91 (± 0.59) and 11.96 (± 2.29), respectively, in tertile 3 of haem iron 1091
intake. Although haem iron only represented 4 % of the total iron intake in omnivores, it is more 1092
bioavailable than non-haem iron, therefore its potential contribution to total absorbed iron is greater 1093
than the intake values indicate. 1094
4. Overview of Dietary Reference Values and recommendations 1095
4.1. Adults 1096
The German-speaking countries (D-A-CH, 2015) considered that iron requirements depend on iron 1097
losses through the intestine, the kidneys, the skin (about 1 mg/day), and menses (for menstruating 1098
women, about 15 mg/month), although about 20 % of women have substantially higher monthly iron 1099
losses (Hallberg et al., 1966a). Dietary iron absorption in the majority of industrial countries was 1100
considered to be between 10 and 15 % (FAO/WHO, 1988), or higher by two- or three-fold in the case 1101
of iron deficiency. With an absorption of 10–15 %, an iron intake of 15 mg/day was estimated to 1102
provide the body with 1.5–2.2 mg of absorbed iron/day and to cover the needs of all women with 1103

Draft Dietary Reference Values for iron
EFSA Journal 20YY;volume(issue):NNNN 28
normal menstrual blood losses. Based on German data (Arab-Kohlmeier et al., 1989), the German-1104
speaking countries considered that postmenopausal women would not have a higher iron requirement 1105
than men, for whom the recommended intake was set at 10 mg/day. 1106
The Nordic countries (Nordic Council of Ministers, 2014) considered (1) median basal iron losses of 1107
0.014 mg/kg body weight per day (Green et al., 1968), multiplied by mean body weight for the Nordic 1108
population, and (2) for women of childbearing age, menstrual iron losses (median, 90th and 95
th 1109
percentile) evaluated from the amount of menstrual blood losses (median: 30 mL/28 days) (Hallberg 1110
et al., 1966a; Hallberg and Rossander-Hulten, 1991), a haemoglobin concentration of 135 g/L and an 1111
assumed iron content of 3.34 mg/g of haemoglobin. For women of childbearing age, an absorption of 1112
15 % was assumed, although subjects in the top 5th percentile of iron requirement probably have a 1113
higher absorption rate. Blood loss during menstruation was considered to be variable among adult 1114
women but fairly constant for a given woman (Hallberg and Rossander-Hulten, 1991). Finally, for 1115
women of childbearing age, an Average Requirement (AR) was set at 10 mg/day and a Recommended 1116
Intake (RI) at 15 mg/day, which corresponds to the amount of iron to meet the needs of about 90 % of 1117
women. In addition, a lower level of intake of 5 mg/day was set for postmenopausal women, while a 1118
value of 7 mg/day was set for men, considering their higher body size. To cover basal iron losses, 1119
ARs of 6 mg/day for postmenopausal women and of 7 mg/day for men were derived and RIs were set 1120
at 9 mg/day for both population groups. 1121
The World Health Organization/Food and Agriculture Organization (WHO/FAO, 2004) adapted the 1122
conclusions from their earlier report (FAO/WHO, 1988), considering more recent calculations on the 1123
distribution of iron requirements in menstruating women (Hallberg and Rossander-Hulten, 1991). 1124
They considered mean body weights, median basal iron losses and, for women of childbearing age, 1125
the median and 95th percentile of menstrual iron losses (without taking into account the normal 1126
variation in haemoglobin concentration), in order to calculate the median and the 95th percentile of 1127
total requirements for absorbed iron. Total basal iron loss from the skin, the intestine, the urinary tract 1128
and airways was considered to be 0.014 mg/kg body weight per day (Green et al., 1968), and the 1129
range of individual variation was estimated to be ± 15 % (FAO/WHO, 1988). A median basal iron 1130
loss of 1.05 mg/day for adult men and 0.87 mg/day for adult women was estimated. Menstrual blood 1131
losses were considered to be constant for a given woman, but variable among women (Hallberg et al., 1132
1966a) and greatly influenced by the choice of contraceptive method, and their distribution was 1133
considered to be highly skewed. The median and 95th percentile of menstrual iron losses were 1134
estimated to be 0.48 and 1.90 mg/day for women of childbearing age. The median and the 95th 1135
percentile of total absorbed iron requirements were estimated to be 1.46 and 2.94 mg/day for women 1136
of childbearing age (not lactating), 1.05 and 1.37 mg/day for men, and 0.87 and 1.13 mg/day for 1137
postmenopausal women. WHO/FAO also considered that iron requirements per unit of body weight 1138
for postmenopausal women and physically active older adults are the same as for men, but that when 1139
physical activity decreases with advanced age, blood volume and haemoglobin mass decrease, leading 1140
to a shift of iron usage from haemoglobin and muscle to iron stores, and therefore a reduction in iron 1141
requirements. The main source of variation in iron status in different populations was considered to be 1142
the variation in iron absorption and the amount of dietary iron absorbed was considered to be mainly 1143
determined by iron body stores and by the properties of the diet, i.e. iron content and bioavailability. 1144
WHO/FAO finally based their Recommended Nutrient Intakes (RNIs) on the 95th percentile of the 1145
total requirements for absorbed iron, and considered four different bioavailability figures: 15 and 1146
12 % (for Western-type diets, depending mainly on meat intake), and 10 and 5 % (for developing 1147
countries). The RNIs for an iron bioavailability of 15 % were set at 9.1 mg/day for adult men, 1148
19.6 mg/day for women of childbearing age, and 7.5 mg/day for postmenopausal women. 1149
The SCF (1993) followed a similar approach as WHO/FAO (2004), i.e. adapted the data from the 1150
earlier report (FAO/WHO, 1988) using more recent data on the distribution of iron requirements in 1151
menstruating women (Hallberg and Rossander-Hulten, 1991) and considered the same data for basal 1152
iron losses (Green et al., 1968) (2 SD being added to the median basal iron loss to estimate P95) and 1153
menstrual blood losses (Hallberg et al., 1966a). Assuming a bioavailability of 15 %, the SCF based 1154

Draft Dietary Reference Values for iron
EFSA Journal 20YY;volume(issue):NNNN 29
their Population Reference Intake (PRI) on the 95th percentile of total iron requirements and set the 1155
same values as WHO/FAO (2004), but also proposed rounded figures and, for menstruating women, 1156
two PRI values based on the 90th and the 95
th percentiles of total iron requirements, as the SCF 1157
considered that a PRI based on the 95th percentile would be unrealistically high for the great majority 1158
of women. The probability of adequacy among menstruating adult women for various amounts of 1159
absorbed iron was also provided, as well as the dietary intake necessary to provide these amounts, 1160
assuming a bioavailability of 15 %. 1161
Afssa (2001) considered that daily basal iron losses in adults due to desquamation of cells from the 1162
surfaces of the body are 0.9–1 mg, i.e. about 14 µg/kg body weight, comprising 0.6 mg for faecal, 1163
0.2–0.3 mg for dermal and 0.1 mg for urinary losses. Iron bioavailability of the usual French diet was 1164
considered to be 10 % (Galan et al., 1985; Lynch and Baynes, 1996; Lynch, 1997). The recommended 1165
iron intake was set at 9 mg/day for adult men and postmenopausal women. For women of childbearing 1166
age, menstrual iron losses were considered in addition to basal iron losses (FAO/WHO, 1988; 1167
INACG, 1989). Afssa reported median menstrual blood losses between 25 and 30 mL/month, i.e. 1168
menstrual iron losses of 12.5–15 mg/month or 0.4–0.5 mg/day, and indicated that 50 % of women 1169
would have total iron losses higher than 1.3 mg/day and 10 % higher than 2.1 mg/day. Factors such as 1170
heredity, weight, height, age, parity and particularly choice of contraception method were mentioned 1171
to have an impact on the volume of menstrual blood losses. The recommended intake for iron was set 1172
at 16 mg/day for women of childbearing age. 1173
IOM (2001) considered the maximal bioavailability of iron to be 18 % in non-pregnant adults, based 1174
on a conservative estimate of 10 % for the proportion of haem iron in the diet of adults (Raper et al., 1175
1984) and children (based on data of the Continuing Survey of Food Intakes by Individuals, CSFII 1176
1994–1996), a conservative estimate of 25 % for overall haem absorption (Hallberg and Rossander-1177
Hulten, 1991), and an estimated bioavailability of non-haem iron in self-selected diets of 16.8 % for 1178
individuals with a serum ferritin concentration of 15 µg/L (Cook et al., 1991). IOM only took into 1179
account basal losses in estimating the needs for absorbed iron in adult men and postmenopausal 1180
women, and did not consider the higher iron stores in men compared to women. Basal iron losses in 1181
men were assumed to be 0.014 mg/kg body weight per day, based on a study by Green et al. (1968) 1182
which reported an average calculated daily iron loss of 0.96 mg/day (i.e. about 0.014 mg/kg body 1183
weight per day for a mean body weight of 68.6 kg) in three groups of men with normal iron storage 1184
from South Africa, the United States and Venezuela (n = 41 in total, excluding 19 Bantu South 1185
Africans selected on the basis of phenotype iron overload). Due to the lack of data to estimate the 1186
variability of basal losses in adult men, the median and variability for basal losses were calculated 1187
using the median body weight recorded in NHANES III and its variability calculated using the square 1188
root of the median weight for men. For men, the calculated median and 97.5th percentile for daily iron 1189
loss were therefore 1.08 and 1.53 mg/day. The Estimated Average Requirement (EAR) was calculated 1190
by dividing the median daily iron loss by the estimated iron bioavailability and set at 6 mg/day, and 1191
the Recommended Dietary Allowance (RDA) was calculated by dividing P97.5 of daily iron loss by 1192
the bioavailability and rounded to 8 mg/day. For menstruating women, menstrual iron losses were 1193
added to basal iron losses using data from Hallberg et al. (1966a, 1966b); Hallberg and Rossander-1194
Hulten (1991). Percentiles of blood loss were predicted from a log-normal distribution, and the 1195
predicted median was 30.9 mL/cycle. Blood losses per menstrual cycle were converted into estimated 1196
daily iron losses averaged over the whole menstrual cycle, haemoglobin concentration was taken as a 1197
constant (135 g/L) in adult women (Beaton et al., 1989), iron content of haemoglobin was considered 1198
as 3.39 mg/g (Smith and Rios, 1974), and the duration of the average menstrual cycle was considered 1199
to be 28 days (Beaton et al., 1970). Median menstrual iron loss was calculated as 0.51 mg/day and the 1200
97.5th percentile as 2.32 mg/day. As there were no direct measurements of basal iron losses (separated 1201
from menstrual iron losses) in women, values for women were derived from those used for men 1202
(Green et al., 1968) by linear body weight adjustment. The median and variability for basal losses 1203
were calculated as done for men. The median and the 97.5th percentile of basal iron losses were 1204
therefore 0.896 and 1.42 mg/day. Distributions of requirement for absorbed iron and dietary iron were 1205

Draft Dietary Reference Values for iron
EFSA Journal 20YY;volume(issue):NNNN 30
calculated by Monte-Carlo simulation from the estimated distributions of menstrual and basal iron 1206
losses, considering a bioavailability of 18 %. For menstruating women not using oral contraceptives, 1207
the median total absorbed iron requirement was calculated as 1.41 mg/day and used to set the EAR at 1208
8 mg/day (rounded value), and the calculated 97.5th percentile of total absorbed iron need of 1209
3.15 mg/day was used to set the RDA at 18 mg/day (rounded value). For postmenopausal women, 1210
basal iron losses were also taken as 0.014 mg/kg body weight per day (Green et al., 1968) and the 1211
median and variability for basal losses were calculated as for adult men. The calculated median and 1212
97.5th percentile for daily iron loss were estimated at 0.896 and 1.42 mg/day, the EAR was calculated 1213
by dividing the median iron loss by the estimated iron bioavailability of 18 % and set at 5 mg/day, and 1214
the RDA was calculated by dividing the 97.5th percentile of daily iron loss by the bioavailability and 1215
rounded to 8 mg/day. Special considerations regarded the use of oral contraceptives and hormone 1216
replacement therapy (HRT), vegetarianism, intestinal parasitic infection, blood donation and 1217
increased iron losses in exercise and intense endurance training. Based on a re-analysis of data on 1218
decreased menstrual blood losses in women using oral contraceptives (Nilsson and Solvell, 1967), a 1219
reduction of about 60 % was estimated, and the requirement at the 50th (EAR) and 97.5
th (RDA) 1220
percentiles for premenopausal women using oral contraceptives was set at 6.4 and 10.9 mg/day. 1221
Women on HRT and still menstruating were considered to possibly have higher iron requirements 1222
than postmenopausal women not on HRT. The iron bioavailability of a vegetarian diet was estimated 1223
to be about 10 % (instead of 18 % for a mixed Western diet), and the iron requirement was thus 1224
considered to be 1.8 times higher for vegetarians. The EAR for iron was assumed to be 30 % greater 1225
in subjects engaged in regular intense exercise (Ehn et al., 1980) and 70 % greater in athletes (Weaver 1226
and Rajaram, 1992). 1227
The Netherlands Food and Nutrition Council (1992) estimated average basal iron losses (through 1228
faeces, urine and sweat) to be 0.9 mg/day in men and 0.8 mg/day in women, and the average 1229
menstrual iron loss to be 0.8 mg/day. The average quantities of absorbed iron to compensate for total 1230
losses were thus 1.1 mg/day for men and 1.7 mg/day for women aged 19–21 years (adding an iron 1231
amount for growth to basal iron losses and, for women, menstrual losses), 0.9 mg/day for men and 1232
1.6 mg/day for women aged 22 years and over, and 0.8 mg/day for postmenopausal women. Iron 1233
absorption from the Dutch diet was estimated to be 12 %, considering the estimated absorption of 1234
haem and non-haem iron (Hallberg, 1981), their average ratio, the vitamin C content and the quantity 1235
of meat in the Dutch diet, as well as studies on complete meals and breakfasts. The minimum 1236
requirements were estimated as 9 mg/day (19–21 years) and 8 mg/day (22 years and over) for men, 1237
and 14 mg/day (19–21 years), 13 mg/day (22 years and over) and 7 mg/day (post-menopause) for 1238
women. A CV of 20 % was applied to cover variation in individual requirements (and a CV of 15 % 1239
for growth). Adequate levels of daily intake were derived by adding 2 SD to the average minimum 1240
requirements for the different age and sex groups. 1241
The UK COMA (DH, 1991) considered daily iron losses of 0.14 mg through desquamated 1242
gastrointestinal cells, 0.38 mg for haemoglobin, 0.24 mg for bile, and 0.1 mg through urine (Green et 1243
al., 1968), i.e. a total of 0.86 mg/day with a CV of 15 %, and the amount lost through skin and sweat 1244
were considered negligible (Brune et al., 1986). A bioavailability of 15 % was considered typical in 1245
industrialised countries (FAO/WHO, 1988). For adults over 50 years of age, the Lower Reference 1246
Nutrient Intake (LRNI) was set at 4.7 mg/day, the EAR was set at 6.7 mg/day and the RNI was set at 1247
8.7 mg/day. In women of childbearing age, menstrual iron losses were estimated from Swedish data 1248
on menstrual blood loss, showing a highly skewed distribution (Hallberg et al., 1966a). For a 75th 1249
percentile of blood loss of 52.4 mL, a haemoglobin concentration of 13 g/100 mL, and an iron content 1250
of haemoglobin of 0.347 %, the calculated menstrual iron losses were added to basal iron losses, 1251
leading to an EAR of 11.4 mg/day, a LRNI of 8.0 mg/day, and an RNI of 14.8 mg/day, but this intake 1252
was considered to be insufficient for the 10 % of women with the highest menstrual losses. Specific 1253
considerations regarding frequent blood donors were also provided. The UK Scientific Advisory 1254
Committee on Nutrition (SACN) (2010) considered that these DRVs were derived from limited data 1255
but that new data were insufficient to reassess them. 1256

Draft Dietary Reference Values for iron
EFSA Journal 20YY;volume(issue):NNNN 31
An overview of DRVs for iron for adults is presented in Table 2. 1257
Table 2: Overview of Dietary Reference Values for iron for adults 1258
D-A-CH
(2015)
NCM
(2014)
WHO/FAO
(2004) Afssa
(2001)
IOM
(2001) SCF (a)
(1993) NL
(1992)
DH
(1991)
Age
(years)
19–50 18–60 ≥ 18 ≥ 20 19–50 ≥ 18 19–21 19–50
PRI men
(mg/day)
10 9
9.1 for a bioavailability
of 15 % (up to 27.4, for
a bioavailability of 5 %)
9 8
9.3 (9)
11 8.7
PRI
women
(mg/day)
15 15
Post-
meno-
pause: 9
19.6 for a bioavailability
of 15 % (up to 58.8 for
a bioavailability of 5 %)
16 18
(10.9 for
women using
OCAs
15.8 (b)
(16)
19.6 (20)
16 14.8
Age
(years)
≥ 51 ≥ 61 ≥ 50 ≥ 22 ≥ 50
PRI men
(mg/day)
10 9 As for younger men 8 As for
younger
men
9 8.7
PRI
women
(mg/day)
10 9 Post-menopause: 7.5 for
a bioavailability of 15 %
(up to 22.6 for a
bioavailability of 5 %)
8 Post-meno
pause: 7.5
(8)
15 (22–
50 y)/
8 (≥ 50)
8.7
NCM, Nordic Council of Ministers; NL, Netherlands Food and Nutrition Council; OCA, oral contraceptives; PRI, 1259 Population Reference Intake; y, years 1260
(a): For a bioavailability of 15 %, calculations based on the 95th percentile of iron requirements, rounded values in 1261 parenthesis provided by SCF; 1262
(b): Based on the 90th percentile of iron requirements instead of the 95th percentile. 1263
4.2. Infants and children 1264
The German-speaking countries (D-A-CH, 2015) estimated daily iron losses of infants and children to 1265
be 0.2–0.4 mg. Requirements for growth were considered to amount to 0.7 mg/day between 6 and 12 1266
months, and 0.3–0.5 mg/day after the age of one year (Dallman, 1988; Fairbanks and Bleutler, 1988). 1267
The requirement for absorbed iron was estimated to be about 1 mg/day for infants aged 4 to <12 1268
months, hence an iron intake of 1 mg/kg body weight per day or 8 mg/day was recommended. For 1269
older children, D-A-CH took into account iron losses and iron requirements for growth and concluded 1270
that about 0.8 mg/day of absorbed iron was needed, also taking into account the increased iron 1271
requirement during puberty due to an increased growth rate and, for girls, the start of menstruation. 1272
For children aged 6 months to 5 years, the Nordic countries (Nordic Council of Ministers, 2014) 1273
retained their previous recommendation of 8 mg/day, as no iron deficiency was observed in older 1274
infants consuming on average 9 mg/day of iron provided mostly by iron-fortified phytate-rich cereals 1275
(Lind et al., 2003), and as a higher recommendation would require a diet much denser in iron for that 1276
age group than for older children and adults. For children aged 6–9 years, an intake of 9 mg/day was 1277
recommended. For children aged 10–17 years, an absorption of 15 % was assumed, although subjects 1278
in the top 5th percentile of iron requirement probably have a higher absorption efficiency. The Nordic 1279
countries considered (1) iron needs for growth, (2) median basal iron losses estimated to be 1280
0.014 mg/kg body weight per day (Green et al., 1968) multiplied by mean body weight (Andersen et 1281
al., 1982), as well as (3) for menstruating girls, menstrual iron losses evaluated from the amount of 1282
menstrual blood losses (median: 28.4 mL/28 days) (Hallberg et al., 1966a; Hallberg et al., 1991; 1283
Hallberg and Rossander-Hulten, 1991; Borch-Iohnsen, 1993), a haemoglobin concentration of 1284
135 g/L, an assumed iron content of 3.34 mg/g of haemoglobin and an equation (derived from a fitted 1285
log normal distribution with a Monte Carlo simulation (IOM, 2001)) to calculate the 95th percentile of 1286
blood loss. Blood loss during menstruation was mentioned to be less variable among adolescent girls 1287
than adult women. The RIs correspond to the amount of iron to meet the needs of about 95 % of 1288

Draft Dietary Reference Values for iron
EFSA Journal 20YY;volume(issue):NNNN 32
children of the respective age groups, except for girls after menarche, where the RIs are assumed to 1289
cover the needs of 90 % of the group. 1290
For infants and children, WHO/FAO (2004) adapted the conclusions from their earlier report 1291
(FAO/WHO, 1988). They considered mean body weights, the iron requirement for growth, median 1292
basal iron losses and, for menstruating girls, the median and 95th percentile of menstrual iron losses 1293
(0.48 and 1.90 mg/day), in order to calculate the median and the 95th percentile of total requirements 1294
for absorbed iron for children between 0.5 and 17 years. As for adults, the total basal iron loss was 1295
considered to be 0.014 mg/kg body weight per day (Green et al., 1968), and the range of individual 1296
variation was estimated to be ± 15 % (FAO/WHO, 1988). Iron requirements in term infants were 1297
considered to rise markedly in the second half of infancy, as body iron stores about double between 1298
the age of six months and one year, and then double again between one and six years. WHO/FAO 1299
stressed the high iron requirements of adolescents due to rapid growth (Rossander-Hulthén and 1300
Hallberg, 1996), and the marked individual variation in growth rate and consequently in iron 1301
requirements (Hallberg et al., 1966a; Tanner et al., 1966b, 1966a; Karlberg and Taranger, 1976; 1302
Dallman and Siimes, 1979; FAO/WHO, 1988). The same considerations as for women of childbearing 1303
age (see Section 4.1.) applied for menstruating girls regarding the intra-individual and inter-individual 1304
variability of menstrual blood losses (Hallberg et al., 1966a), their statistical distribution and the 1305
impact of contraceptive methods, as well as the impact of iron bioavailability. Finally the RNIs were 1306
based on the 95th percentile of the requirements for absorbed iron and the four levels of iron 1307
bioavailability already considered for adults (15, 12, 10 and 5 %). Separate values for pre- and post-1308
menarchal girls aged 11–14 years were also provided. 1309
SCF (1993) followed an approach similar to WHO/FAO (2004), i.e. adapted the data from the earlier 1310
report (FAO/WHO, 1988) using more recent data on the distribution of iron requirements in 1311
menstruating women (Hallberg and Rossander-Hulten, 1991) and considering the same data for basal 1312
iron losses (Green et al., 1968) and iron requirements for growth (Karlberg and Taranger, 1976). For 1313
infants aged 0.5–1 year, the absorption efficiency of iron from weaning foods was considered to be 1314
usually lower than that of iron from the adult diet because of an often high content of inhibitors of 1315
iron absorption such as milk and phytate in infant cereals and a low content of enhancers of iron 1316
absorption such as meat and ascorbic acid, and the absorption efficiency of iron used to fortify infant 1317
foods was considered to be unknown. Therefore, the absorption efficiency was assumed to be highly 1318
variable and on average lower than for other age-groups, i.e. 10 %, and a PRI of 9.3 mg/day was set 1319
for older infants. For an absorption efficiency of 15 %, the SCF based their PRI on the 95th percentile 1320
of total iron requirements and set the same values as WHO/FAO (2004), but also proposed rounded 1321
figures and two PRI values based on the 90th and 95
th percentiles of total iron requirements for 1322
menstruating adolescent girls. 1323
As for adults, Afssa (2001) considered daily basal iron losses of about 14 µg/kg body weight and an 1324
absorption efficiency of 10 % (Galan et al., 1985; Lynch and Baynes, 1996; Lynch, 1997). Afssa 1325
reported that iron requirements of infants were very high to cover basal losses, erythrocyte mass 1326
expansion and growth of body tissues, and that iron body stores doubled during the first year of life. 1327
Total iron requirements at the age of one year were mentioned to be 8–10 times higher than those of 1328
an adult male if expressed per kg of body weight. Iron requirements for growth during adolescence 1329
and for menstrual losses in adolescent girls were also taken into account. 1330
For infants aged 7–12 months, IOM (2001) modelled the major factorial components of absorbed iron 1331
requirements, which were basal (i.e. faecal, urinary and dermal) losses, the increase in haemoglobin 1332
mass, the increase in tissue iron, and the increase in storage iron. Considering median body weights at 1333
6 and 12 months ((Dibley et al., 1987) and reference body weights from NHANES III 1988–1994), a 1334
CV for weight of 10 %, an estimated basal iron loss of 0.03 mg/kg body weight per day (Garby et al., 1335
1964) and its variability assumed to be proportional to the variability of weight, the mid-range 1336
estimate of basal losses for infants aged 6–12 months was calculated to be 0.26 ± 0.03 mg/day. The 1337
median weight increment was assessed to be 0.39 kg/month or 13 g/day (Dibley et al., 1987), 1338

Draft Dietary Reference Values for iron
EFSA Journal 20YY;volume(issue):NNNN 33
considering a CV of 50 %. The increase in haemoglobin mass was calculated to be 1339
0.37 ± 0.195 mg/day, by multiplying the median monthly weight increment by a blood volume of 1340
70 mL/kg (Hawkins, 1964), a median haemoglobin concentration of 0.12 mg/mL, an iron content of 1341
haemoglobin of 3.39 mg/g (Smith and Rios, 1974), dividing by 30 days, and applying the CV 1342
accepted for weight gain (50 %). The increase in tissue iron content was calculated as 1343
0.009 ± 0.0045 mg/day, by multiplying the median daily weight increment by the estimated tissue iron 1344
content of 0.7 mg/kg body weight at one year (Smith and Rios, 1974), assumed to be identical at age 1345
seven months, and applying the CV accepted for weight gain (50 %). The increase in storage iron was 1346
calculated as 0.051 mg/day, by multiplying the sum of the increase in haemoglobin iron and the 1347
increase in non-storage iron by the percentage of total tissue iron stored (12 % (Dallman, 1986)), 1348
divided by the percentage of total iron not stored. The median total requirement for absorbed iron was 1349
therefore 0.69 ± 0.145 mg/day, and the 97.5th percentile was 1.07 mg/day. For a moderate absorption 1350
efficiency of 10 % (considering the low iron absorption efficiency in fortified infant cereals 1351
(Davidsson et al., 2000) and the proportion of infants consuming meat at one year (Skinner et al., 1352
1997)), the EAR was set at 6.9 mg/day using the median total requirement and the RDA at 11 mg/day, 1353
using the 97.5th percentile of the total requirement. For children aged one to eight years, a median rate 1354
of weight gain was estimated to be 2.29 kg/year or 6.3 g/day, from the slope of a linear regression of 1355
reported median body weights on age (Frisancho, 1990). The midpoints of 2.5 and 6.5 years were 1356
used to set EAR and RDA for the age groups 1–3 years and 4–8 years. As for infants, the major 1357
components of iron requirement modelled by IOM (2001) were basal iron losses and the increase in 1358
haemoglobin mass, in tissue iron and in storage iron. Basal iron losses were derived from total iron 1359
losses measured in adult men (Green et al., 1968) adjusted to the child’s estimated body surface area 1360
(Haycock et al., 1978) (which is directly related to dermal iron losses (Bothwell and Finch, 1962)). 1361
Haemoglobin mass was estimated by multiplying blood volume at specific ages (Hawkins, 1964) by 1362
the estimated age- and sex-specific haemoglobin concentration ((Beaton et al., 1989), using 119 ± 1.4 1363
g/L per year in males and 121 ± 1.1 g/L per year in females). The estimated yearly change in 1364
haemoglobin mass was multiplied by its assumed iron content (3.39 mg/g). The increase in the tissue 1365
iron content was 0.004 mg/day whatever the age, calculated by multiplying the median yearly rate of 1366
weight gain by the estimated tissue iron content (0.7 mg/kg body weight (Smith and Rios, 1974)). Up 1367
to the age of 3 years, the increase in storage iron was calculated as for older infants by multiplying the 1368
sum of the increase in haemoglobin mass and the increase in tissue iron by the portion of total tissue 1369
iron that is stored. The estimated values fell until age 9 years (for which the value was 0). The median 1370
total requirement for absorbed iron was based on the higher estimates for boys, and set at 0.54 mg/day 1371
between 1 and 3 years, and 0.74 mg/day between 4 and 8 years. The variability of requirements was 1372
estimated, considering the variability of weight velocity (CV of 40 % between 1 and 8 years), which 1373
was also assigned to the variability of haemoglobin iron deposition and tissue iron deposition, and an 1374
overall CV of basal iron losses of 38 %. Considering the same absorption efficiency as for adults, i.e. 1375
18 %, EARs and RDAs were calculated based on the median and 97.5th percentile for each year 1376
increment between 1.5 and 8.5 years. For children aged 9–18 years, the major components of iron 1377
requirement modelled by IOM were basal iron losses, the increase in haemoglobin mass and the 1378
increase in storage iron as for younger children (but not the increase in tissue non-storage iron), as 1379
well as menstrual iron losses for girls aged 14–18 years. Median requirements for absorbed iron were 1380
estimated for each year of age, and the variability of these requirements and the 97.5th percentile were 1381
assessed at the midpoint of the age ranges 9–13 years and 14–18 years. Median yearly weight gains in 1382
boys (aged 9–12, 13–14, 15–17 and 18 years) and girls (aged 9–11, 12–13, 14–17 and 18 years) were 1383
estimated from the slopes of linear regressions of median body weights on age (Tanner et al., 1966a), 1384
and decreased to 0 at age 18 years. Basal iron losses per each sex and each year increment between 9 1385
and 18 years were extrapolated from data on adult men (0.014 mg/kg body weight per day) (Green et 1386
al., 1968), multiplied by median body weights recorded in NHANES III. The amount of iron needed 1387
for the increase in haemoglobin mass was calculated by adding the estimated yearly rate of change in 1388
haemoglobin concentration multiplied by median body weights, and the estimated yearly weight gains 1389
multiplied by haemoglobin concentration, this sum being multiplied by blood volume and the iron 1390
content of haemoglobin, then divided by 365 days. Blood volume was considered to be about 75 1391

Draft Dietary Reference Values for iron
EFSA Journal 20YY;volume(issue):NNNN 34
mL/kg body weight in boys and 66 mL/kg body weight in girls (Hawkins, 1964), the iron content of 1392
haemoglobin was considered to be 3.39 mg/g (Smith and Rios, 1974), and the yearly rates of change 1393
in haemoglobin concentration were estimated as the coefficients of linear regressions of haemoglobin 1394
concentration on age for boys and girls aged 8–13 and 14–18 years (Beaton et al., 1989). Tissue iron 1395
was calculated by multiplying the median yearly weight gains by the iron content in muscle tissue 1396
(0.13 mg/kg of total weight gain (Smith and Rios, 1974)), and dividing by 365 days. For the 1397
estimation of menstrual losses in adolescent girls, the model assumed that all girls were menstruating 1398
at age 14 years and over, and that girls younger than 14 years did not menstruate. As done for 1399
menstruating women, a log-normal distribution was fitted to reported menstrual blood losses in 1400
Swedish women (Hallberg et al., 1966a, 1966b; Hallberg and Rossander-Hulten, 1991) and provided a 1401
median blood loss of 27.6 mL/cycle, for which the average duration was considered to be 28 days 1402
(Beaton et al., 1970). Median menstrual iron loss was calculated as 0.45 mg/day, by multiplying the 1403
calculated median blood loss by the haemoglobin concentration estimated according to age (for 14–1404
20 years: 131 g/L + 0.28 x age in years) and the iron content of haemoglobin of 3.39 mg/g (Smith and 1405
Rios, 1974). The distributions of the components of the total requirement for absorbed iron were said 1406
to be skewed and the variability of each component was assessed to estimate the variability of the 1407
total requirement. The modelled distribution of total iron requirement, combining the several 1408
estimated components in a Monte Carlo simulation, was used to set the EAR (based on the median) 1409
and the RDA (based on the 97.5th percentile), assuming the same absorption efficiency as for adults, 1410
i.e. 18 %. The physiological processes associated with puberty with a major impact on iron 1411
requirements were considered to be the growth spurt in both sexes, menarche in girls and the major 1412
increase in haemoglobin concentrations in boys. IOM also stated how to adjust estimates for 1413
requirements for individuals underlying the growth spurt or onset of menstruation. An increased 1414
requirement for dietary iron was set at 2.9 mg/day for boys and at 1.1 mg/day for girls identified as 1415
currently in the growth spurt, and at 2.5 mg/day for girls under the age of 14 years and starting to 1416
menstruate. The estimated percentiles of the distribution of iron requirements in children aged 0.5–1 1417
year, 1–3 years, 4–8 years, 9–13 years and 14–18 years were also provided. 1418
The Netherlands Food and Nutrition Council (1992) calculated basal iron losses in childhood by 1419
extrapolation using body weight to the power of 0.75. Menstrual iron losses were estimated to be 1420
0.6 mg/day in girls aged 13–16 years (Schlaphoff and Johnston, 1949). Requirements for growth were 1421
calculated from variation in body iron stores (average: 40–50 mg/kg body weight (Fomon and 1422
Anderson, 1974)) and their SD was considered to be 15 %. Total average amounts of absorbed iron to 1423
compensate for losses (basal, menstrual for adolescent girls) and growth were 0.8 mg/day at 0.5–1 1424
year, and between 0.7 and 1.5 mg/day in boys and 0.7 and 1.8 mg/day in girls aged 1–19 years. 1425
Considering an absorption efficiency of 14 % for infants aged 0.5–1 year and girls aged 13–19 years 1426
(Hallberg, 1981), and the same absorption efficiency as in adults, i.e. 12 %, for the other age groups 1427
of children the minimum requirements were estimated as 6.5 mg/day at 0.5–1 year, and between 6 and 1428
13 mg/day in boys and girls aged 1–19 years. Considering an SD of 15 % for growth and no variation 1429
for menstrual losses, adequate levels of daily intakes were set at 7 mg/day for infants aged 0.5–1 year, 1430
and between 7 mg/day and 15 mg/day (boys) or 14 mg/day (girls) between 1 and 19 years. 1431
For infants and children, the UK COMA (DH, 1991) added to basal losses the amount of iron required 1432
for expanding red cell mass and growing body tissues, as well as menstrual iron losses for adolescent 1433
girls aged 11–18 years, and considered an iron absorption of 15 %. The LRNI was set at 4.2 mg/day 1434
and the EAR at 6.0 mg/day for infants aged 7–12 months. The LRNIs ranged between 3.3 and 1435
8.0 mg/day and the EARs ranged between 4.7 and 11.4 mg/day according to age group and sex 1436
between 1 and 18 years. RNIs were 7.8 mg/day for infants aged 7–12 months, and ranged between 6.1 1437
and 14.8 mg/day according to age group and sex between 1 and 18 years. 1438
An overview of DRVs for iron for children is presented in Table 3. 1439

Draft Dietary Reference Values for iron
EFSA Journal 20YY;volume(issue):NNNN 35
Table 3: Overview of Dietary Reference Values for iron for children 1440
D-A-CH
(2015)
NCM
(2014)
WHO/ FAO (a)
(2004) Afssa (b)
(2001)
IOM
(2001) SCF (c)
(1993)
NL
(1992)
DH
(1991)
Age
(months)
4–<12 6–11 6–12 6–12 7–12 6–11 6–12 7–12
PRI
(mg/day)
8 8 6.2 (absorption
efficiency during
this period varies
greatly)
7 11 6.2 (6)
[9.3] (d)
7 7.8
Age (years) 1–<7 1–5 1–3 1–3 1–3 1–3 1–4 1–3
PRI
(mg/day)
8 8 3.9 7 7 3.9 (4) 7 6.9
Age (years) 7–<10 6–9 4–6 4–6 4–8 4–6 4–7 4–6
PRI
(mg/day)
10 9 4.2 7 10 4.2 (4) 7 6.1
Age (years) 10–<19 10–13 7–10 7–9 9–13 7–10 7–10 7–10
PRI
(mg/day)
12 (M)
15 (F)
11 5.9 8 8 5.9 (6) 8 8.7
Age (years) 14–17 11–14 10–12 14–18 11–14 10–13 11–18
PRI
(mg/day)
11 (M)
15 (F)
9.7 (M)
9.3(e)/21.8 (F)
10 11 (M)
15 (F)
9.7 (10) (M)
9.3 (9) (F) (e)
18 (18) (F) (f)
21.8 (22) (F)
10 (M)
11 (F)
11.3 (M)
14.8 (F)
Age (years) 15–17 13–19 15–17 13–19
PRI
(mg/day)
12.5 (M)
20.7 (F)
13 (M)
16 (F)
12.5 (13) (M)
16.9 (17) (F) (f)
20.7 (21) (F)
15 (M)
12 (F) (g)
14 (F) (g)
NCM, Nordic Council of Ministers; NL, Netherlands Food and Nutrition Council; PRI, Population Reference Intake; M, 1441 males; F, females. 1442
(a): PRIs for an absorption efficiency of dietary iron of 15 % 1443 (b): Values are from the table on page 507 of the report. 1444 (c): For an absorption efficiency of 15 %, calculations based on the 95th percentile of iron requirements, rounded values in 1445
parenthesis provided by SCF 1446 (d): Value in brackets for an absorption efficiency of 10 % 1447 (e): Pre-menarche 1448 (f): Based on the 90th percentile of iron requirements instead of the 95th percentile 1449 (g): At an absorption efficiency of 14 %. 1450
4.3. Pregnancy 1451
For pregnancy, the German-speaking countries (D-A-CH, 2015) took into account iron requirements 1452
of about 300 mg for the fetus, about 50 mg for the placenta, and about 450 mg for the increased blood 1453
volume of the mother (Hallberg, 1988). D-A-CH considered that the recommended intake of 1454
30 mg/day during pregnancy cannot usually be met with food alone. 1455
The Nordic countries (Nordic Council of Ministers, 2014) did not set RIs for dietary iron for pregnant 1456
women, in line with SCF (1993). Iron stores of about 500 mg were reported to be required at the 1457
beginning of pregnancy to achieve iron balance during pregnancy. Maternal iron requirements were 1458
shown to increase slowly during pregnancy, from the amount needed to cover basal losses in the first 1459
trimester to an amount of 10 mg/day in the last six weeks (Barrett et al., 1994), in relation to 1460
requirements for growth and maintenance of the fetus and uterus, the increase in red cell mass and the 1461
expected iron losses during birth. Total iron requirement during pregnancy was estimated to be 1462
1 040 mg, including 840 mg for the fetus, the rest being lost when giving birth (Hallberg, 1988). Iron 1463
absorption was assumed to increase during the last two trimesters. It was mentioned that for some 1464
pregnant women the amount of iron in foods is not enough to satisfy the greatly increased iron 1465
demand, and iron supplementation starting in the second trimester was therefore recommended. 1466

Draft Dietary Reference Values for iron
EFSA Journal 20YY;volume(issue):NNNN 36
WHO/FAO (2004) and SCF (1993) did not derive an RNI or a PRI for pregnant women because their 1467
iron balance depends on the properties of the diet and on iron stores. However, iron requirements 1468
were reported to be 300 mg for the fetus, 50 mg for the placenta, 450 mg for the expansion of 1469
maternal red cell mass, 240 mg for basal iron losses, thus 1 040 mg in total. Net iron requirement in 1470
pregnancy was considered to be 840 mg, assuming sufficient iron stores (i.e. stores of 500 mg 1471
available during the last two trimesters). Total daily iron requirements were mentioned to increase 1472
during pregnancy from 0.8 mg to about 10 mg during the last six weeks, and iron absorption was 1473
reported to increase during pregnancy. SCF (1993) considered that iron requirements during the 1474
second half of pregnancy are huge and cannot be met by diet alone or the body iron stores of the 1475
mother; thus, SCF recommended daily iron supplements during this period (DeMaeyer et al., 1989). 1476
Afssa (2001) considered an absorption efficiency of 10 % as for other age groups (Galan et al., 1985; 1477
Lynch and Baynes, 1996; Lynch, 1997) and reported on the increased iron requirement during 1478
pregnancy (FAO/WHO, 1988; Hercberg et al., 2000) in relation to the increase in red cell mass (about 1479
500 mg of iron), and the synthesis of fetal tissues (about 290 mg of iron) and of the placenta (25 mg 1480
of iron). Basal iron losses during pregnancy were considered to be 220 mg and total iron requirement 1481
was estimated to be over 1 000 mg, i.e. 2.5–5.2 mg/day depending on iron stores at the beginning of 1482
pregnancy. Afssa also mentioned an increased absorption efficiency of iron during pregnancy 1483
(Whittaker et al., 1991; Barrett et al., 1994) related to a gradual decrease in body iron stores. Afssa set 1484
a recommended intake of 30 mg/day during the last trimester of pregnancy and considered that it 1485
cannot be met by usual diets. 1486
For pregnant women, IOM (2001) considered basal losses, iron deposited in fetal and related tissues, 1487
and iron utilised in expansion of haemoglobin mass as components for factorial modelling. Basal iron 1488
losses of 0.896 mg/day, calculated for non-pregnant non-lactating women with a body weight of 64 kg 1489
and an average basal loss of 0.014 mg/kg body weight (Green et al., 1968) were taken into account, 1490
i.e. about 250 mg for the whole pregnancy. For iron deposition in the fetus, the umbilicus and the 1491
placenta IOM selected the value of 315 mg (FAO/WHO, 1988) rounded to 320 mg, and provided 1492
estimates per trimester (Bothwell and Charlton, 1981). For the expansion of haemoglobin mass, the 1493
value of 500 mg (FAO/WHO, 1988) was selected. However, IOM mentioned that the estimate 1494
depends on the haemoglobin concentration and the extent of iron supplementation provided, and 1495
referred to the reference curve of the evolution of median haemoglobin concentration by week of 1496
gestation in healthy, iron-supplemented pregnant women in industrialised countries (IOM, 1993). In 1497
line with FAO/WHO (1988), the expansion of haemoglobin mass was assumed to be zero during the 1498
first trimester and equally distributed between the last trimesters (due to a lack of data on the precise 1499
timing), i.e. 250 mg/trimester or 2.7 mg/day. The total iron requirement for pregnancy was calculated 1500
as 1 070 mg, by summing basal losses (250 mg), fetal and placental deposition (320 mg) and the 1501
increase in haemoglobin mass (500 mg). Blood iron loss at delivery was estimated to be 150–250 mg, 1502
hence an amount of 250–350 mg was estimated to remain in maternal body stores, and was then 1503
subtracted from the total iron requirement for pregnancy to calculate the net iron requirement of 1504
pregnancy, i.e. about 700–800 mg. Bioavailability in the first trimester was estimated to be the same 1505
as for non-pregnant women, i.e. 18 %, while the maximal value was estimated to be about 25 % in the 1506
last two trimesters (Barrett et al., 1994). The requirement for absorbed iron was finally set at 1.2, 4.7 1507
and 5.6 mg/day, and the dietary iron requirement was set at 6.4, 18.8 and 22.4 mg/day, for the first, 1508
second and third trimesters, respectively. For pregnant adolescents, a similar approach was followed, 1509
but estimated basal losses and iron deposition in tissue were those computed for non-pregnant 1510
adolescents. The variability of the components of iron requirements was assessed to estimate the 1511
variability of the total requirement for absorbed iron. The EARs were established based on estimates 1512
for the third trimester to build iron stores during the first trimester of pregnancy, and were 23 mg/day 1513
for adolescents aged 14–18 years and 22 mg/day for adult women. The RDA was set at 27 mg/day for 1514
pregnant women of all ages, based on the 97.5th percentile of the requirement for absorbed iron. 1515
The Netherlands Food and Nutrition Council (1992) considered iron absorption to be 12 % during the 1516
first trimester of pregnancy and about 16 % in the last two trimesters and during lactation. Basal iron 1517

Draft Dietary Reference Values for iron
EFSA Journal 20YY;volume(issue):NNNN 37
losses during pregnancy were considered the same as those of non-menstruating women (0.8 mg/day). 1518
No CV was applied for losses during birth, and a CV of 15 % was considered for the iron requirement 1519
for growth of the fetus and the placenta. The iron amount needed during pregnancy for the fetus and 1520
the placenta was considered to be about 300–350 mg (Widdowson and Spray, 1951; Bowering and 1521
Sanchez, 1976), the distribution being 10 %, 40 % and 60 % in the first, second and third trimesters. 1522
During the first, second and third trimester of pregnancy, respectively, the average total amounts of 1523
absorbed iron were thus estimated to be 1.1, 2.2 and 2.9 mg/day, the minimum requirements for 1524
dietary iron were estimated to be 9, 14 and 18 mg/day and the adequate levels of daily intake were set 1525
at 11, 15 and 19 mg/day. 1526
The UK COMA (DH, 1991) reported on an estimated iron requirement for the products of conception 1527
of 680 mg (Committee on Iron Deficiency, 1968), but did not set any recommended intake for iron for 1528
pregnant women because of cessation of menstrual losses, mobilisation of maternal iron stores and 1529
increased intestinal absorption (Svanberg et al., 1975). 1530
4.4. Lactation 1531
The German-speaking countries (D-A-CH, 2015) recommended an intake of 20 mg/day for both 1532
lactating and non-lactating women after birth to compensate for the losses during pregnancy. 1533
For lactating women, the Nordic countries (Nordic Council of Ministers, 2014) considered the 1534
frequent absence of menstruation during the first months of lactation (Habicht et al., 1985). However, 1535
it was also stated that women in Northern countries breastfeed their infants for prolonged times, so 1536
that menstrual losses would occur within the breastfeeding period. The RI set for lactating women 1537
was the same as that for non-pregnant non-lactating women of childbearing age, i.e. 15 mg/day. 1538
For lactating women, WHO/FAO considered a mean body weight of 62 kg, a total basal iron loss of 1539
0.014 mg/kg body weight per day (Green et al., 1968) with a SD of 15 %, a daily iron secretion into 1540
milk of about 0.3 mg, and therefore a median basal iron loss of 1.15 mg/day. Median and 1541
95th percentile of total requirements for absorbed iron were estimated as 1.15 and 1.50 mg/day. The 1542
RNI was based on the 95th percentile of total iron requirement and the various levels of iron 1543
absorption efficiency already considered for adults and children (15, 12, 10 and 5 %), and set at 1544
10 mg/day for a bioavailability of 15 % (up to 30 mg/day for a bioavailability of 5 %). 1545
For lactation, SCF (1993) considered an amount of iron secreted with human milk of 0.15–1546
0.3 mg/day, and set a PRI of 10 mg/day assuming an absorption efficiency of 15 %. 1547
For lactating women, Afssa (2001) recommended an iron intake of 10 mg/day. The iron concentration 1548
of human milk was considered to be 0.55 mg/L two weeks after birth, 0.4 mg/L after six to eight 1549
weeks, and about 0.3 mg/L three to five months after birth (Siimes et al., 1979). The iron loss through 1550
human milk was thus estimated to be 0.2–0.4 mg/day in case of exclusive breastfeeding, and the 1551
absorption of iron was reported to be increased during lactation. 1552
For lactation, IOM (2001) estimated median iron requirements as the sum of iron secretion in human 1553
milk and basal iron losses of non-pregnant non-lactating women (0.896 mg/day), until the initiation of 1554
menstruation after around six months of exclusive breastfeeding. The average iron concentration of 1555
human milk was considered to be 0.35 mg/L, and the CV was estimated to be 33 %. The average 1556
volume of milk secreted during the first six months was estimated to be 0.78 L/day. Iron losses with 1557
human milk were thus estimated as 0.27 ± 0.089 mg/day and the median total requirement for 1558
absorbed iron as 1.17 mg/day. The approach was similar for lactating adolescents (14–18 years), but 1559
provision was also made for the deposition of iron in tissues (0.001 mg/day) and haemoglobin mass 1560
(0.14 mg/day), and the median requirement for absorbed iron was estimated as 1.26 mg/day. As for 1561

Draft Dietary Reference Values for iron
EFSA Journal 20YY;volume(issue):NNNN 38
other age groups, a simulation model was used to derive the 97.5th percentile of this requirement used 1562
to set the RDA, and an absorption efficiency of 18 % was assumed. 1563
For lactating women, the Netherlands Food and Nutrition Council (1992) considered the amount of 1564
iron lost during birth (50–250 mg) to represent an increased requirement of about 1.6 mg/day over a 1565
lactation period of three months. The average amount of iron secreted with human milk was assumed 1566
to be about 0.5 mg/day, and the basal losses were considered to be the same as for non-menstruating 1567
women, i.e. 0.8 mg/day. The average total amount of absorbed iron was thus estimated to be 1568
3.0 mg/day. The minimum requirement was set at 19 mg/day and the adequate level of daily intake at 1569
20 mg/day. 1570
For lactating women, the UK COMA (DH, 1991) reported on an iron concentrations in human milk at 1571
6–8 weeks post partum of 0.4 mg/L and of 0.29 mg/L at 17–22 weeks postpartum (Vuori, 1979), 1572
considered a daily volume of milk production of 850 mL, and thus calculated the iron secretion in 1573
milk to be 0.25–0.34 mg/day. No recommended intake was derived for lactating women, as lactational 1574
amenorrhoea was considered to compensate for the amount of iron secreted in milk. 1575
An overview of DRVs for iron for pregnant and lactating women is presented in Table 4. 1576
Table 4: Overview of Dietary Reference Values (DRVs) for iron for pregnant and lactating women 1577
D-A-CH
(2015)
NCM
(2014)
WHO/FAO
(2004)
Afssa
(2001)
IOM
(2001)
SCF
(1993)
NL
(1992)
DH
(1991)
Pregnancy 3rd
trim
PRI
(mg/day)
30 no DRV given no DRV given 30 27 no
DRV
given
11 (1st trim)
15 (2nd
trim)
19 (3rd
trim)
no
DRV
given
Lactation 3 months
PRI
(mg/day)
20 (also
applicable to
non-breast-
feeding women
who gave
birth)
15 10, for a
bioavailability of
15 % (up to
30 for a
bioavailability of
5 %)
10 10 (14–
18 years)/
9 (adult)
10 20 no
DRV
given
NCM, Nordic Council of Ministers; NL, Netherlands Food and Nutrition Council; PRI, Population Reference Intake; trim, 1578 trimester. 1579 WHO/FAO (2004) and SCF (1993) consider that iron supplements be given to all pregnant women. NCM (2014) states that 1580 the physiological iron requirement of some women cannot be satisfied during the last two thirds of pregnancy with food only, 1581 and supplemental iron is needed. 1582
5. Criteria (endpoints) on which to base Dietary Reference Values 1583
5.1. Indicators of iron requirement 1584
Assessments of iron status (see Section 2.4) of individuals show a wide spectrum between the 1585
extremes of iron deficiency and excess, with no good dose–response data to determine thresholds at 1586
which adverse or significant adaptive events associated with these two conditions are observed. 1587
Adequate iron status implies the presence of normal erythropoiesis and iron-dependent functions, 1588
together with a contingency supply of storage iron for physiological requirements. Reference ranges 1589
have been developed to indicate iron sufficiency but values outside the range do not necessarily 1590
define deficiency or excess. The Panel notes that the most commonly used biomarkers of iron status 1591
are haemoglobin (functional iron) and serum ferritin concentration (storage iron), but these cannot be 1592
used to determine iron requirements. 1593

Draft Dietary Reference Values for iron
EFSA Journal 20YY;volume(issue):NNNN 39
5.1.1. Factorial approach for estimating physiological iron requirement 1594
Obligatory iron losses in all population groups include dermal losses (sweat and skin), epithelial loss 1595
from the intestinal, oropharyngeal and respiratory, and genito-urinary tracts, hepatic, pancreatic and 1596
intestinal secretions, urine, and menstrual blood losses in women of child-bearing age. To maintain 1597
iron balance, the sum of these losses plus the iron required for growth in infants, children, and 1598
adolescents, and during pregnancy must be provided by the diet. 1599
5.1.1.1. Infants 1600
Newborns have approximately 75 mg iron/kg body weight, corresponding to 260 mg of total iron 1601
(Widdowson and Spray, 1951; Oski, 1993) of which approximately 70 % is in haemoglobin, 24 % is 1602
in liver stores as ferritin and the remaining 6 % in myoglobin and iron-containing enzymes (Dallman 1603
et al., 1993). A newborn’s iron stores can be increased by about 30–35 mg through delayed clamping 1604
(i.e. two minutes or later after birth) of the umbilical cord (Hutton and Hassan, 2007), with a 1605
calculated difference in serum ferritin concentration of 4 µg/L, resulting from the high haemoglobin 1606
content of fetal blood and from placental sources. Due to redistribution of iron from haemoglobin to 1607
iron stores, in healthy, term, normal birth weight infants there is sufficient iron for the formation of 1608
haemoglobin and myoglobin concomitant with growth until about six months of age in fully breast-1609
fed infants (Chaparro, 2008). Extra iron requirements during this period can be provided by human 1610
milk alone (even if its iron concentration is low); therefore, an additional appreciable requirement for 1611
dietary iron does not exist before the sixth month of life (Domellof, 2011). With regard to the dietary 1612
iron requirement of infants aged 7–11 months, there is no need to differentiate between their feeding 1613
modes, i.e. whether they are breast-fed or formula-fed in addition to complementary feeding. 1614
The main requirements for iron in older infants (7–11 months) are for the replacement of obligatory 1615
faecal, urinary, and dermal losses (basal losses); increase in haemoglobin mass (both blood volume 1616
and haemoglobin concentration); increase in tissue (non-storage) iron; and increase in storage iron to 1617
build a reserve. Fomon et al. (2005) used 58
Fe as a tracer in 35 normal weight infants aged 4–1618
168 days, and performed a follow-up study until 26 months of age. They observed endogenous 1619
gastrointestinal iron losses of 22 µg/kg body weight per day, i.e. higher than those reported in adult 1620
men (12 µg/kg body weight per day). This value is close to that proposed by Oski (1993) (20 µg/kg 1621
body weight per day). Based on a loss of 20 µg/kg body weight per day, Oski (1993) estimated a daily 1622
requirement of 0.78 mg of absorbed iron for a 10 kg, 12 month-old infant, which is comprised of 1623
0.2 mg to replace losses (0.020 mg/kg body weight × 10 kg) and 0.58 mg of iron needed for blood 1624
volume increase and tissue growth). 1625
Domellof and Hernell (2002) assumed a requirement of absorbed iron of 0.6 mg/day by the end of the 1626
sixth month, made up of 0.5 mg/day for iron in haemoglobin and 0.1 mg/day for iron in muscle and 1627
other tissues. The relative proportions of these amounts are similar to the proportions indicated by 1628
Oski (1993) for iron in haemoglobin and tissue, respectively. Domellof and Hernell (2002) then 1629
calculated a need of 0.15 mg for daily obligatory losses according to estimations of 20 µg/kg body 1630
weight per day (Oski, 1993), resulting in a total requirement of absorbed iron of 0.75 mg for an infant 1631
weighing 7.5 kg. Assuming iron losses of 22 µg/kg body weight per day (Fomon et al. (2005), derived 1632
from direct isotopic observations) and an average body weight of 8.6 kg for boys and girls at nine 1633
months (WHO Multicentre Growth Reference Study Group, 2006), i.e. the midpoint of the age class 1634
7–11 months, daily losses are 0.19 mg/day. Using the figure derived by Domellof and Hernell (2002) 1635
of 0.6 mg/day for iron requirement for growth of infants at six months leads to a daily requirement of 1636
absorbed iron of 0.79 mg/day. 1637
Data from intervention (Appendix H) or observational (Appendix I) studies show that infants with an 1638
iron intake ranging from 3.1–4.8 mg/day have sufficient iron. Infants consuming an average of 1639
8 mg/day of iron during the second half of infancy (partly through iron-fortified phytate-rich cereals) 1640
do not develop iron deficiency (Niinikoski et al., 1997; Lind et al., 2003; Gunnarsson et al., 2004). 1641

Draft Dietary Reference Values for iron
EFSA Journal 20YY;volume(issue):NNNN 40
Diets at this age are rich in cereals and vegetables containing substances that possibly inhibit the 1642
absorption of iron (Fomon et al., 2005), but despite the composition of the diet it appears to supply 1643
sufficient bioavailable iron to infants still consuming breast milk (Domellof et al., 2002a). 1644
5.1.1.2. Children 1645
The iron requirements of children reflect the synthesis of new tissues involved in their growth rate 1646
and losses of body iron per kg body weight. Endogenous losses decrease after the third year of life 1647
from 22 to 12 µg/kg body weight per day, as is observed in adult men (Section 2.3.7). From 1–7 years 1648
of age, daily dietary iron needs increase only slightly due to the small rates of increase in weight. 1649
With puberty higher intakes are needed to compensate for increased requirements of growth and in 1650
girls for menstrual losses. The mean age of menarche in the EU (with 91.8 % coverage of the EU 1651
population) has been estimated at 12.7 years (van Buuren et al., 2012). However, the age at menarche 1652
varies widely and menarche is considered to be normal if occurring between 11 and 15 years of age, 1653
and early if occurring at ≤ 10 years (Glueck et al., 2013). 1654
The main compartments containing iron are blood haemoglobin, liver, the macrophage monocyte 1655
system (i.e. the RES) and myoglobin of muscles (Wang and Pantopoulos, 2011). Using isotopic 1656
studies Fomon et al. (2005) determined tissue iron contents in 15 boys and 16 girls to be 37.6 mg/kg 1657
at six months, 35.2 mg/kg at 13 months and 34.9 mg/kg at 26 months. Dewey and Chaparro (2007) 1658
estimated a body iron content of 420 mg, which is equivalent to a tissue iron content of 42 mg/kg 1659
body weight in a 10-kg infant. In adult men and women tissue iron contents, estimated from isotope 1660
dilution, were 48 mg/kg body weight and 38 mg/kg body weight, respectively (Hunt et al., 2009). The 1661
iron content per kg body weight is consistent with the value of 45 mg/kg body weight estimated by 1662
Oski (1993), i.e. a total amount of body iron of 450 mg in a 10-kg infant subdivided into haemoglobin, 1663
tissue iron and iron stores. Considering the possible age-related changes of the average iron content in 1664
body compartments and the changes in the distribution of fat mass taking place with puberty, the 1665
Panel considers a tissue iron content of 40 mg/kg body weight as a reasonable value for children of 1666
both sexes from one year of age through to 11 years of age, i.e. pre-puberty. With early puberty, there 1667
is an increase in accretion of fat mass in girls (Laurson et al., 2011) which continues throughout 1668
(young) adulthood (Vink et al., 2010). Therefore, from age 12 years onwards, the Panel considers it 1669
appropriate to use the tissue iron content estimated in adults (Hunt et al., 2009), i.e. 48 mg iron/kg 1670
body weight for boys and 38 mg/kg body weight for girls, for factorial calculations, taking into 1671
account the differences in accretion of fat mass taking place in puberty. 1672
Estimated average daily iron requirements for growth between 12 months and 18 years have been 1673
derived according to body weights at the 50th percentile for various age classes (1–3, 4–6, 7–11, and 1674
12–17 years), for both sexes combined until 11 years of age and for girls and boys separately from 1675
12 years onwards, as reported in Table 5. 1676

Draft Dietary Reference Values for iron
EFSA Journal 20YY;volume(issue):NNNN 41
Table 5: Requirements for absorbed iron for growth in boys and girls aged 1 to 17 years 1677
Age group 1–3 years 4–6 years 7–11 years 12–17 years
Boys Girls
Age boundary (year) 1 4 4 7 7 12 12 18 12 18
Average of median
weight (kg) of boys
and girls at age
boundary
9.3 (a)
16.2 (a)
16.7 (b)
24.1(b)
24.1 (b)
42.1 (b)
41.5 (c)
69.3 (c)
42.6 (c)
57.4 (c)
Weight gain (kg) 6.9 (d)
7.4 (e)
18.0 (f)
27.8 (g)
14.8 (g)
Body iron (mg/kg) 40 40 40 48 38
Iron in total weight
gained (mg)
276 296 720 1 334 562
Requirement for
absorbed iron for
growth per year (mg)
92 99 144 222 94
Requirement for
absorbed iron for
growth per day (mg)
0.25 0.27 0.39 0.61 0.26
To cover the whole age range, it was considered that a child is 3 years of age until its 4th birthday, 6 years of age until its 7th 1678 birthday, 11 years of age until its 12th birthday and 17 years of age until its 18th birthday. As weight data for the day before 1679 the 4th, 7th, 12th and 18th birthday were not available, median weights for boys and girls aged 4, 7, 12 and 18 years, 1680 respectively, were used instead. 1681 (a): Average of median weight-for-age of boys and girls aged 12 and 48 months, respectively, according to the WHO Growth 1682 Standards (WHO Multicentre Growth Reference Study Group, 2006). 1683 (b): Average of median body weight of boys and girls aged 4, 7 and 12 years, respectively (van Buuren et al., 2012). 1684 (c): Median body weight of boys or girls aged 12 and 18 years, respectively (van Buuren et al., 2012). 1685 (d): Net weight gain in kg between 1 year and 4 years. 1686 (e): Net weight gain in kg between 4 years and 7 years. 1687 (f): Net weight gain in kg between 7 years and 12 years. 1688 (g): Net weight gain in kg from 12 years. 1689
5.1.1.3. Adults 1690
From the available data on iron losses (Section 2.3.7), the Panel decided that instead of combining all 1691
of the losses from the different routes (and hence magnifying the uncertainty of the estimate), it would 1692
be more accurate to estimate physiological iron requirement using whole body iron loss data derived 1693
from the isotope studies undertaken by Hunt et al. (2009). These authors measured basal losses of iron 1694
in 29 men, 19 menstruating women, and five postmenopausal women. 1695
The Panel used individual data on iron turnover and daily losses of iron from the study of Hunt et al 1696
(2009)10
as a basis of assessing obligatory losses of iron. It was thought that these data provided an 1697
aggregate of overall losses which was relatively free of the uncertainties inherent in summating basal 1698
losses of endogenous iron using, for example, the data of Green et al. (1968). Although these data 1699
were collected from a North American population group that is not necessarily representative of the 1700
EU healthy adult population, the Panel agreed that it was possible to use them as a basis for the 1701
estimation and probability modelling of the mean and approximate variability of distribution 1702
percentiles for the iron losses of adult men and premenopausal women in the EU population. Data on 1703
iron losses of the few postmenopausal women included in this study were not further analysed, as the 1704
Panel considered this group too small for separate analyses and as the data were different from those 1705
of men or premenopausal women (see Appendix J). 1706
10 The kind provision of the individual data by Gerald Combs and LuAnn Johnson from the USDA Human Nutrition
Research Center, Grand Forks, North Dakota, USA, is acknowledged.

Draft Dietary Reference Values for iron
EFSA Journal 20YY;volume(issue):NNNN 42
Details of the statistical analysis of the data are given in Appendix J. Firstly, summary statistics were 1707
estimated for the main variables related to iron losses for adult men and premenopausal women and 1708
for associations among the variables which were considered to be potentially explicative for iron 1709
losses. From these a regression model equation for iron losses (as mg/day) was fitted to the data using 1710
a set of potentially relevant variables. This stage included an assessment of outliers and goodness of 1711
fit. The regression model was then used to derive a distribution for iron losses combining the model 1712
equation with parametric distributions fitted to the sampling observations of each of the explanatory 1713
variables. The Panel considers that the probabilistic approach is a useful method with which to fill in 1714
data gaps as far as major sources of variability are concerned and that it provides a distribution of iron 1715
losses from which percentiles can be estimated as a basis for determining AR and PRI values. 1716
For men, the 50th percentile of the model-based distribution of iron losses is equal to around 1717
0.95 mg/day. The 90th, 95
th and 97.5
th percentiles are, respectively, equal to iron losses of around 1.48, 1718
1.61 and 1.72 mg/day. For premenopausal women, the 50th percentile of the model-based distribution 1719
of iron losses is equal to around 1.34 mg/day. The 90th, 95
th and 97.5
th percentiles are, respectively, 1720
equal to iron losses of around 2.44, 2.80 and 3.13 mg/day. 1721
5.1.1.4. Pregnancy 1722
The total quantity of iron required to support a singleton pregnancy of an average adult woman is 1723
835 mg. This is calculated factorially as follows: total obligatory losses (faecal, urinary and dermal) 1724
of 300 mg11
, 270 mg for the neonate (Bothwell, 2000; Milman, 2006), 90 mg for the placenta and 1725
umbilical cord (Bothwell, 2000; Milman, 2006), and 175 mg for blood loss at delivery (mean of 1726
values given by Bothwell (2000) and Milman (2006)). Some of this iron can be supplied from 1727
maternal liver stores, and the remainder has to be provided by the diet. 1728
Although the need for iron changes throughout the course of pregnancy, in line with the exponential 1729
growth of the fetus, it is not possible when setting DRVs to provide values for each stage of gestation, 1730
therefore average daily values are calculated over the 280 days of gestation. Adaptive physiological 1731
changes take place to meet the demands of the growing fetus and the other products of conception. 1732
Such changes are anticipatory in that they happen before the period of exponential growth of the 1733
fetus. They include expansion of the plasma and blood volumes, and of red blood cell mass starting at 1734
6–8 weeks and peaking at 28–34 weeks of gestation. The dilutional effect of this expansion induces a 1735
fall in serum ferritin concentration, but its relationship with systemic iron stores is not lost and 1736
concentrations approximating 15 µg/L are indicative of depleted liver iron stores (Baldwin, 2012). 1737
The increased need for iron is also met by increases in the efficiency of iron absorption (Bothwell et 1738
al., 1979; Hallberg and Hultén, 1996). Barrett et al. (1994) determined absorption rates of dietary iron 1739
during pregnancy using isotope labels in a group of 12 women consuming a diet supplying daily 9 mg 1740
of non-haem iron (see Section 2.3.2.). A progressive increase in iron absorption was found in the three 1741
trimesters of pregnancy. In parallel, serum ferritin concentrations decreased, reflecting expansion of 1742
the plasma volume and the use of iron depots for fetal growth. Accordingly, these increases in iron 1743
absorption in healthy women eating a mixed diet may balance the increased requirements in later 1744
pregnancy, as indicated in other isotopic studies in pregnant women (Whittaker et al., 1991; Whittaker 1745
et al., 2001). 1746
There is a great deal of uncertainty in the estimation of total quantity of iron absorbed during 1747
pregnancy. However, the amount of iron absorbed may be predicted using data from an isotopic study 1748
(Barrett et al., 1994), and assuming, in a conservative way, that the same percentage iron absorption 1749
observed at week 12 of gestation is valid for the period 0–23 weeks of gestation, the percentage iron 1750
absorption observed at week 24 of gestation is valid for the period 24–35 weeks of gestation and the 1751
11 1.08 mg/day × 280 days. The value of 1.08 mg/day is reported in Hunt et al. (2009) as the mean basal losses in five
postmenopausal women. The Panel considers that basal iron losses during pregnancy are the same as those of non-
menstruating women.

Draft Dietary Reference Values for iron
EFSA Journal 20YY;volume(issue):NNNN 43
percentage iron absorption observed at week 36 of gestation is valid for the period 36–40 weeks of 1752
gestation. Percentage iron absorption figures reported in Table 6 are geometric means. The quantity of 1753
non-haem iron absorbed (mg/day) has been calculated assuming a dietary non-haem iron intake of 1754
9 mg/day and 4 mg haem iron/day from meat (as given to the women for three days before the 1755
absorption study) throughout the entire pregnancy. As there is no evidence for an increase in haem 1756
iron absorption during pregnancy (Young et al., 2010) it is assumed to be 25 % at all stages of 1757
pregnancy (Section 2.3.2), but the Panel considers that this may be an underestimate as insufficient 1758
data are available on the efficiency of haem iron absorption throughout pregnancy. 1759
Table 6: Iron absorption during pregnancy calculated based on data from Barrett et al. (1994) on 1760
iron absorption from a test meal 1761
Time of gestation
12 weeks
(weeks 0–23, days 1–161
= 161 days)
24 weeks
(weeks 24–35, gestational
days 162–245 = 84 days in
total)
36 weeks
(weeks 36–40, gestational
days 246–280 = 35 days in
total)
Geometric mean %
non-haem iron
absorption
7.2 36.3 66.1
Non-haem iron
absorbed (mg/day)
from a diet supplying
9 mg/day of non-haem
iron
0.7 3.3 5.9
Haem iron absorbed
(mg/day) from a diet
supplying 4 mg/day of
haem iron
1.0 1.0 1.0
Total amount of iron
absorbed (mg) in each
gestational period
265 358 243
Total iron absorbed
(mg) throughout
gestation
866
1762
According to the study by Barrett et al. (1994) in which the percentage absorption of non-haem iron 1763
was measured from a meal containing 3.2 mg of non-haem iron extrinsically labelled with a stable 1764
isotope of iron, the total estimated quantity of iron absorbed from a diet providing 13 mg iron/day 1765
(9 mg non-haem iron and 4 mg iron from meat daily) would be 866 mg over the entire pregnancy 1766
(Table 6). Since the quantity of iron required for pregnancy is around 835 mg (see above), if this 1767
theoretical calculation is correct, no additional dietary iron will be required. The Panel notes that the 1768
percentage absorption measured from the test meal of a white roll, bacon and orange juice may be an 1769
overestimate of overall dietary iron absorption. This is supported by the fact that the women in this 1770
study had a mean serum ferritin concentration of 43.8 µg/L at week 12 of gestation, which is 1771
equivalent to liver iron stores of 350 mg, and a mean serum ferritin concentration of 5.4 µg/L at week 1772
36, indicating that they had mobilised around 300 mg of iron from liver stores. The Panel notes that 1773
the quantity cannot be estimated accurately as the relationship between serum ferritin concentration 1774
and liver iron may be confounded by haemodilution (Faupel-Badger et al., 2007). 1775
The calculation above is conservative as it does not take into account the utilisation of iron stores. 1776
The Panel selected a target reference value of 30 µg/L for serum ferritin in women of childbearing age 1777

Draft Dietary Reference Values for iron
EFSA Journal 20YY;volume(issue):NNNN 44
as this reflects an adequate level of iron stores to support a pregnancy. This is also proposed in the 1778
UK guidelines of the British Committee for Standards in Haematology which state that pregnant 1779
women with a serum ferritin concentration < 30 µg/L should be offered oral iron supplements (Pavord 1780
et al., 2012). The Panel assumed that at this concentration, in the absence of any other adaptation, a 1781
15 µg/L drop in serum ferritin concentration signifies the release of 120 mg of iron (1 µg/L of serum 1782
ferritin equals 8 mg of storage iron in an adult, see Section 2.4) from the liver. Stores would fall to 1783
virtually zero by delivery (with a serum ferritin concentration of 15 µg/L, i.e. the level associated with 1784
depletion of iron stores). The net cost of pregnancy is therefore 715 (total cost, 835 minus mobilised 1785
stores, 120) mg iron. 1786
The calculations based on the data from the isotope studies can be compared with a different approach 1787
using the Dainty et al. (2014) model. Assuming a serum ferritin concentration of 30 µg/L (early 1788
pregnancy, up to week 23), which is associated with an efficiency of iron absorption of 18 %, and 15 1789
µg/L (late pregnancy, from week 24 until term), which is associated with an efficiency of iron 1790
absorption of 31 % (see Section 5.1.2), the quantity of absorbed iron from a mixed diet can be 1791
calculated. With a serum ferritin concentration of 30 µg/L, in order to supply 835 mg of absorbed iron 1792
(i.e. the total quantity of iron required for a pregnancy), the total dietary intake needs to be 4 639 mg 1793
(835/0.18), which equates to 16.6 mg/day over 280 days of gestation. With a serum ferritin 1794
concentration of 15 µg/L, absorption is 31 % and the total dietary intake needs to be 2 694 mg 1795
(835/0.31), which equates to 9.6 mg/day. In practice, serum ferritin concentration will fall gradually 1796
as the pregnancy progresses, and taking the mean value of these two estimates the average dietary 1797
intake to provide the required quantity of iron would be 13.1 mg/day. Assuming a CV of 15 %, to take 1798
into account the wide inter-individual variation in iron requirements in pregnant women, this would 1799
equate to a theoretical PRI of 17.0 mg/day. If the theoretical calculations are repeated using the net 1800
cost of pregnancy of 715 mg iron, the average iron intake required to support a pregnancy would be 1801
11.2 mg/day. Assuming a CV of 15 % this would equate to a theoretical PRI of 14.6 mg/day. This 1802
theoretical calculation is an alternative approach to using percentage iron absorption values derived 1803
from the isotope studies and is based solely on the relationship between serum ferritin concentration 1804
and efficiency of iron absorption. 1805
The Panel notes that the conclusion from these different approaches is similar in that there is no need 1806
for additional dietary iron during pregnancy provided there are adequate iron stores at conception. 1807
This is due to the increasing efficiency of iron absorption during pregnancy. However, the Panel notes 1808
that the Dainty et al. (2014) model has not been validated for pregnant women and does not make any 1809
allowance for adaptive changes in efficiency of absorption that occur in pregnancy, and is likely to be 1810
a conservative estimate. 1811
5.1.1.5. Lactation 1812
Based on an iron concentration of mature human milk in European women of around 0.3 mg/L 1813
(Section 2.3.7.5) and assuming an average milk volume of 0.8 L/day (Butte et al., 2002; 1814
FAO/WHO/UNU, 2004; EFSA NDA Panel, 2009), the Panel estimates that the amount of iron 1815
secreted in breast milk during the first six months of lactation is 0.24 mg/day. Together with basal 1816
iron losses of about 1 mg/day (Hunt et al., 2009) in a non-menstruating woman of normal body 1817
weight, the total requirement for absorbed iron during the lactation period amounts to about 1.2–1818
1.3 mg/day. Since breastfeeding and its duration may delay the return of menses (lactational 1819
amenorrhea) (Kramer and Kakuma, 2004), the requirement for absorbed iron in most lactating women 1820
may be less than in non-lactating premenopausal women. However, taking into account that lactating 1821
women might resume menstruation while they are still lactating, the Panel considers that the 1822
requirement for absorbed iron in lactating women is similar to that of non-lactating premenopausal 1823
women. 1824

Draft Dietary Reference Values for iron
EFSA Journal 20YY;volume(issue):NNNN 45
5.1.2. Algorithms and models used to estimate iron absorption 1825
Several algorithms have been derived to predict dietary iron absorption for the derivation of iron 1826
requirements by taking into account the quantity in the diet of dietary variables that affect iron 1827
availability. The first one (Hallberg and Hulthen, 2000) used iron absorption data from single meals 1828
labelled with radioiron, adjusted to a reference dose absorption of 40 %. The absorption value was 1829
then multiplied by the expected effect of different amounts of dietary factors known to influence iron 1830
absorption including phytate, polyphenols, ascorbic acid, meat, fish and seafood, and calcium. For 1831
each factor an equation describing the dose–effect relationship was developed and consideration was 1832
made for interactions between individual factors. Estimated absorption, calculated as the sum of iron 1833
absorbed from all meals using the algorithm, was not significantly different from measured absorption 1834
from radio-isotopically labelled meals (four per day for five days) in the haem and non-haem iron, 1835
extrinsically labelled with radioisotopes. Other algorithms have been developed using absorption data 1836
from single meals (Reddy et al., 2000; Rickard et al., 2009). 1837
More recently, there have been attempts to develop complete diet-based algorithms because the single 1838
meal studies overestimate the effect of enhancers and inhibitors. Armah et al. (2013) used data from 1839
complete diet studies undertaken in the USA which were either high or low in meat, tea, calcium or 1840
ascorbic acid. They combined 159 observations and used multiple linear regression to quantify the 1841
effect of different factors on non-haem iron absorption: 1842
Ln absorption (%) = 6.294 – 0.709 ln (SF) + 0.119 ln (C) + 0.006 ln (MFP + 0.1) – 0.055 ln (T + 1843
0.01) – 0.247 ln (P) – 0.137 ln (Ca) – 0.083 ln (NH) 1844
where SF is serum ferritin (μg/L), C is ascorbic acid (mg), MFP is meat fish and poultry (g), T is tea 1845
(number of cups), P is phytate (mg), Ca is calcium (mg), and NH is non-haem iron (mg). 1846
Predicted non-haem iron absorption values from the algorithm were compared with measured single 1847
meal and complete diet non-haem iron absorption data, and the respective R2 values were 0.57 (P < 1848
0.001) and 0.84 (P < 0.0001). The more accurate prediction for whole diets is not surprising since the 1849
algorithm was developed from complete diet datasets. Serum ferritin concentration was the most 1850
important explanatory factor with respect to non-haem iron absorption. Dietary factors were relatively 1851
unimportant, with phytate being the only significant factor in the model; total phytate was used 1852
because data for the hexa- and penta-inositol phosphates (which bind strongly with iron, unlike the 1853
lower inositol phosphates) are not generally available, but a better model might have been generated 1854
with the use of individual inositol phosphate data. 1855
The systematic review of iron absorption studies from whole diets by Collings et al. (2013) included a 1856
detailed analysis of data from studies where there were individual data on iron absorption, iron status 1857
and dietary enhancers and inhibitors. Such data were reported in five studies carried out in the USA. 1858
Pooled data from 40 individuals undertaking studies of identical design, gave a mean percentage 1859
absorption from a self-selected diet, a low bioavailability diet (high calcium, low vitamin C, no meat) 1860
and a high bioavailability diet (low calcium, high vitamin C, high meat) of 7.09 (SD 6.75) %, 7.17 1861
(SD 5.80) % and 9.92 (SD 8.78) % respectively. When the Cook et al. (1991) equation was applied to 1862
normalise the data to a serum ferritin concentration of 15 μg/L these values increased to 16.90 (SD 1863
17.3), 16.72 (13.37) and 22.60 (SD 21.76) %, respectively. 1864
Because dietary factors appear to have little effect on absorption in healthy iron-replete individuals 1865
consuming Western-style whole diets, a simplified scoring system was used to classify diets and 1866
derive a regression equation using data from 58 individuals in order to be able to predict iron 1867
absorption from individuals with differing iron status: 1868
Log non-haem iron absorption (%) = -0.73 log(ferritin μg/L) + 0.11 (modifier) + 1.82 1869

Draft Dietary Reference Values for iron
EFSA Journal 20YY;volume(issue):NNNN 46
where modifier = 0 (standard diet), -1 (diets that include at least one inhibitor) and 1 (diets that 1870
include at least one enhancer). 1871
Using this equation, non-haem iron absorption from diets with and without enhancers/inhibitors was 1872
calculated for different serum ferritin concentrations. With depleted iron stores (serum ferritin 1873
concentration ≤ 15 μg/L) non-haem iron absorption from a standard Western diet is 9.2 %, and this 1874
falls to 7.1 % with a diet containing inhibitors and increases to 11.8 % with a diet containing 1875
enhancers. 1876
Most studies on bioavailability have been undertaken in adults, and it is possible that the whole diet 1877
absorption figures derived from pooled data and/or algorithms, as described above, may not be 1878
appropriate for all population groups. Furthermore, the algorithms only predict non-haem iron 1879
absorption and in order to calculate total iron absorption from the whole diet, an estimate of the 1880
quantity of absorbed haem iron has to be added to the value for predicted non-haem iron absorption. 1881
An alternative method to calculate bioavailability factors to be used for deriving DRVs using factorial 1882
estimates was developed by Dainty et al. (2014). Data collected for the National Diet and Nutrition 1883
Survey (NDNS), a nationally representative sample of adults living in the UK and consuming a mixed 1884
Western style diet, were used to develop a predictive model. These include serum ferritin 1885
concentration and total (haem and non-haem) iron intake determined from a seven-day dietary diary. 1886
The acute phase reactant, α-1-antichymotrypsin was measured to ensure that the data used were 1887
derived from individuals who were free of inflammation. The NDNS sample comprised 495 men and 1888
378 premenopausal women and was an iron-sufficient population. Physiological requirements were 1889
calculated from body weight and, in women, menstrual blood loss, following the IOM (2001) 1890
procedure for deriving Dietary Reference Intakes. The data were entered into a model to generate 1891
values for dietary iron absorption. In the men (mean iron intake 13.5 ± 5.1 mg/day; mean serum 1892
ferritin concentration 121.6 ± 112.1 µg/L), the mean calculated (haem and non-haem) iron absorption 1893
(50th percentile requirement for 1.08 mg absorbed iron/day) was 8 %. In the women (mean iron intake 1894
9.8 ± 3.8 mg/day; mean serum ferritin concentration 45.5 ± 38.4 µg/L), the mean calculated (haem 1895
and non-haem) iron absorption (50th percentile requirement for 1.56 mg absorbed iron/day) was 17 %. 1896
The model can be used to predict iron absorption at any level of serum ferritin concentration. For 1897
example, at a serum ferritin concentration of 60 µg/L, iron absorption would be 11 % in both men and 1898
premenopausal women, whereas at a serum ferritin concentration of 30 µg/L, iron absorption would 1899
be 18 % in women and 16 % in men. Using the well-established ratio method (reference serum ferritin 1900
divided by measured serum ferritin concentration) to normalise iron absorption to account for the 1901
effect of iron stores (Cook et al., 1991), at serum ferritin concentrations of 60, 45, 30 and 15 µg/L iron 1902
absorption would be 10, 13, 20 and 30 %, respectively. 1903
Although serum ferritin concentrations vary widely in all population groups, the Panel considers that 1904
a serum ferritin concentration of 30 μg/L is an appropriate target concentration for premenopausal 1905
women, as this reflects iron stores of approximately 120 mg (see Section 2.4). A target serum ferritin 1906
concentration of 30 µg/L is supported by observed serum ferritin concentrations in premenopausal 1907
women in the EU. Median serum ferritin concentration of premenopausal women in the UK NDNS 1908
was 38 µg/L (Dainty et al., 2014), and it was 40 µg/L (2.5th and 97.5
th percentile 4 and 229 µg/L, 1909
respectively) in 1 144 women aged 18 to > 65 years in Germany (Kohlmeier, 1995). Geometric mean 1910
serum ferritin concentration was 37 µg/L (SD 2.5)12
in 2 079 women aged 18–65 years in the German 1911
Health Interview and Examination Survey (Baune et al., 2010). In Denmark, median serum ferritin 1912
concentration in 818 premenopausal women (aged 30–50 years) was 37 µg/L (5th and 95
th percentile 6 1913
and 134 µg/L, respectively) (Milman et al., 1998), and it ranged from 28 to 39 µg/L in 322 Danish 1914
females aged 14–23 years, depending on age (Milman et al., 1997). 1915
12 A geometric mean (SD) of 3.6 (0.9) is given in the paper; these figures were back-transformed assuming that they were
loge-transformed data.

Draft Dietary Reference Values for iron
EFSA Journal 20YY;volume(issue):NNNN 47
5.2. Iron intake and health consequences 1916
For the Nordic Nutrition Recommendations (NNR) 2012, a systematic literature review on health 1917
effects of different intakes of iron at different life stages was undertaken to estimate the requirement 1918
for adequate growth, development and maintenance of health (Domellof et al., 2013). Two specific 1919
research questions were addressed: (1) what is the minimal dose of dietary iron intake that will 1920
prevent poor functional or health outcomes in different age groups within the general population 1921
including the risk groups for iron deficiency? (2) What is the highest dose of dietary iron intake that is 1922
not associated with poor functional or health outcomes in different age groups within the general 1923
population including some risk groups for iron overload? A total of 55 articles were identified as 1924
relevant and the evidence was graded. Most studies were focussed on vulnerable groups, namely 1925
young children and women of child-bearing age. There was some evidence that prevention of iron 1926
deficiency or iron deficiency anaemia improves cognitive/motor/behavioural development in young 1927
children, and treatment of iron deficiency anaemia improves attention and concentration in school 1928
children and adult women. There was insufficient evidence to show negative health effects of iron 1929
intakes at levels suggested by NNR 2004 (Nordic Council of Ministers, 2004). 1930
A series of systematic reviews were conducted by EURRECA, an EU-funded Network of Excellence 1931
(Harvey et al., 2013). The EURRECA standardised systematic review methodology included 1932
randomised controlled trials with an adequate control group, as these provide the highest level of 1933
evidence. The selected health outcomes included tiredness, physical performance, immune function, 1934
impaired thermoregulation, restless leg syndrome and cognitive function. The studies suggested a 1935
modest positive effect of iron supplementation on cognition and psychomotor outcomes in anaemic 1936
infants and children after supplementation periods of at least two months’ duration (Hermoso et al., 1937
2011), but there was no effect on fetal growth (Vucic et al., 2013). A large degree of heterogeneity 1938
between study populations, iron doses and outcome measures prevented meta-analyses for most health 1939
outcomes, so it was not possible to draw conclusions about the relationships between iron intake and 1940
tiredness, physical performance, immune function, thermoregulation and restless leg syndrome. The 1941
EURRECA reviews highlight the dearth of health outcome data for setting DRVs for iron. 1942
SACN (2010) undertook a comprehensive literature review of the role of iron in human nutrition, 1943
including the potential adverse effects of both iron deficiency and iron excess, in order to inform 1944
public health policy makers responsible for developing dietary recommendations for iron. They 1945
concluded that although low haemoglobin concentrations have been associated with impaired physical 1946
work capacity, reproductive efficiency and cognitive and psychomotor development, many of the 1947
studies had poorly reported outcomes and inadequate characterisation of iron deficiency, making 1948
interpretation of the data difficult. Iron supplementation studies indicate that iron deficiency anaemia 1949
is a cause of poor motor development in children in the first three years of life and on cognitive 1950
development in older children, but there is insufficient evidence to specify thresholds of anaemia or 1951
iron deficiency at which these health outcomes might occur. There is some evidence from randomised 1952
controlled trials that suggests that iron supplementation may impair physical growth of iron-replete 1953
infants and children, but further studies are required to characterise this effect. Intervention studies of 1954
iron supplementation during pregnancy have not shown beneficial or adverse effects on pregnancy 1955
outcomes. There were insufficient data on the association between intakes of total dietary iron or 1956
body iron burden and colorectal cancer to reach any conclusions, although epidemiological evidence 1957
suggests that red and processed meat intake is probably associated with increased risk of colorectal 1958
cancer. However, no dose–response relationship could be discerned, nor a threshold level of intake of 1959
red or processed meat identified because of inconsistencies in categorisation and quantification of 1960
meat intake. Observational studies of iron intake and cardiovascular disease do not suggest an 1961
association, although high intake of haem iron is associated with increased risk, possibly due to other 1962
components of meat or lifestyle factors. There is no evidence that dietary iron is associated with 1963
arthritis, diabetes mellitus or neurodegenerative disease. 1964

Draft Dietary Reference Values for iron
EFSA Journal 20YY;volume(issue):NNNN 48
SACN points out that a risk assessment of iron and health is complicated by a number of 1965
uncertainties. The Panel considers the following are relevant when attempting to establish DRVs 1966
using data on health consequences: inaccurate estimates of iron intake and quantities of haem and 1967
non-haem iron in the diet; poor correlation between iron intake and status; difficulties in measuring 1968
adaptive and functional responses to variations in iron intake (bioavailability); lack of sensitive and 1969
specific markers to assess iron status and confounding by other dietary and lifestyle factors and by 1970
responses to infection and inflammation; inadequate characterisation of iron deficiency anaemia and 1971
the relative role of iron deficiency and other causes of anaemia in studies investigating the health 1972
consequences of iron deficiency. The Panel notes that these uncertainties make it difficult to 1973
determine dose–response relationships or to confidently predict the risks associated with iron 1974
deficiency or excess. 1975
The Panel concludes that health outcomes cannot be used for the setting of DRVs for iron. 1976
6. Data on which to base Dietary Reference Values 1977
The Panel considers to set DRVs for adult men and women using modelled obligatory losses (Section 1978
5.1.1.3 and Appendix J). The 50th and 97.5
th percentile losses have been used as a basis for calculating 1979
an AR and a PRI for men (Section 6.1.1), and these data were used also for postmenopausal women 1980
(Section 6.1.3). The skewed distribution of basal losses of iron likely arising from menstrual losses 1981
necessitated some careful evaluation of the upper cut-off level for losses and requirements and the 1982
derivation of a PRI for premenopausal women in general (Section 6.1.2) and during pregnancy 1983
(Section 6.3) and lactation (Section 6.4). A factorial approach combined with data on iron turnover, 1984
body iron content, and the rate of tissue synthesis were used to estimate requirements in infants aged 1985
7–11 months and children through to 17 completed years (Section 6.2). 1986
The Panel has, in the light of absorptive and homeostatic adaptation in the acquisition and systemic 1987
distribution of iron depots, tried to be pragmatic in its use of percentage absorption figures to 1988
calculate DRVs from the physiological requirements. It is assumed that the diets and iron status of the 1989
EU population are largely similar to those in the nationally representative survey in the UK, NDNS 1990
(Dainty et al., 2014), and that the distribution of serum ferritin concentrations and associated 1991
percentage absorption of iron would also be similar, and therefore, appropriate for converting 1992
physiological requirements to DRVs for iron for the EU population. The association between serum 1993
ferritin concentration and calculated percentage absorption has not been estimated in the adaptations 1994
supporting growth and development of early life, childhood, and adolescence. There are data 1995
indicative of increased absorptive efficiency during pregnancy (Section 5.1.1.4), but less so for the 1996
other life stages. The Panel considers that the following DRVs are conservative. 1997
6.1. Adults 1998
The Panel notes that iron requirements are very different before and after menopause due to the 1999
presence or absence of menstrual iron losses and considers that the occurrence of menopause, rather 2000
than age, should define DRVs for women. The Panel also considers that DRVs do not need to be 2001
derived for vegetarians as a separate population group because the bioavailability of iron from 2002
European vegetarian diets is not substantially different from diets containing meat (see Section 2.3.2). 2003
6.1.1. Men 2004
The 50th percentile of the model-based distribution of obligatory losses is 0.95 mg/day, and the 97.5
th 2005
percentile is 1.72 mg/day (Section 5.1.1.3 and Appendix J). A representative serum ferritin 2006
concentration at the lower end of observed distributions and reference ranges was taken as a serum 2007
ferritin concentration of 30 µg/L for men. This is associated with a percentage dietary iron absorption 2008

Draft Dietary Reference Values for iron
EFSA Journal 20YY;volume(issue):NNNN 49
of 16 % (Dainty et al., 2014). Using this figure to convert the physiological requirement into the 2009
dietary requirement, results in a calculated dietary requirement at the 50th percentile of 5.9 mg/day and 2010
of 10.8 mg/day at the 97.5th percentile. After rounding, the Panel derives an AR of 6 mg/day and a 2011
PRI of 11 mg/day for men. 2012
6.1.2. Premenopausal women 2013
The 50th percentile of the model-based distribution of iron losses for these women who are in their 2014
reproductive years (Section 5.1.1.3 and Appendix J) is approximately 1.34 mg/day. The 90th, 95
th and 2015
97.5th percentiles are, respectively 2.44, 2.80 and 3.13 mg/day and reflect the skew resulting from the 2016
large menstrual losses of some women (see Section 2.3.7.2). The Panel assumes that this group has a 2017
serum ferritin concentration of 30 µg/L, which corresponds to a percentage absorption of 18 % 2018
(Dainty et al., 2014). From these data a dietary requirement at the 50th percentile of 7.4 mg/day can be 2019
derived. Intakes meeting the dietary iron requirement of approximately 90, 95 and 97.5 % of the 2020
premenopausal women are calculated as 13.6, 15.6, and 17.4 mg/day. After rounding, the Panel 2021
derives an AR of 7 mg/day and a PRI of 16 mg/day for premenopausal women. The Panel considers 2022
that the PRI meets the dietary requirement of 95 % of women in their reproductive years and is 2023
derived from a group of premenopausal women some of whom use oral contraceptives, as is the case 2024
in the EU (see Section 2.3.7.2). For the remaining 5 % of the women with very high losses, iron 2025
absorption is likely up-regulated in accordance with lower serum ferritin concentrations in order to 2026
compensate for these losses. However, it is uncertain at which level of absorptive efficiency this up-2027
regulation occurs, and the Panel cannot presume that this does occur. Therefore, it is not possible to 2028
derive a dietary requirement for this sub-group of women with very high iron losses. The Panel 2029
assumes that these high iron losses are due to high menstrual blood losses. This is supported by the 2030
observation in Hunt et al. (2009) that menstrual iron losses accounted for 90 % of the variation in 2031
total iron losses for the subset of women who provided complete menstrual collections (n = 13) and 2032
accounted for the skewed distribution of iron losses in these women. 2033
6.1.3. Postmenopausal women 2034
In the absence of reliable data on endogenous losses of iron in postmenopausal women, the Panel 2035
decided to set the same DRVs for postmenopausal women as those set for adult men, i.e. an AR of 2036
6 mg/day and a PRI of 11 mg/day. The Panel notes that this may be a conservative estimate as their 2037
lower body weight is probably associated with lower endogenous losses of iron. 2038
6.2. Infants aged 7–11 months and children 2039
The Panel considers that percentage absorption values derived from studies in adults may be used to 2040
convert physiological requirements into dietary requirements for infants and children (see Sections 2041
5.1.1.1 and 5.1.1.2). The Panel acknowledges that an assumption has to be made that the relationship 2042
between serum ferritin concentration and efficiency of absorption holds for all age groups. There are 2043
no data to support this assumption but from a physiological perspective there are no indications that 2044
age will affect the relationship. 2045
The dietary needs of infants aged 7–11 months are calculated on the basis of a requirement for 2046
absorbed iron of 0.79 mg/day inclusive of needs for expanding haemoglobin, new tissues and 2047
replacement of losses. In the absence of knowledge on percentage absorption in infancy, the same 2048
percentage absorption as in adult men is used, i.e. 16 % (see Section 6.1.1), and a dietary requirement 2049
of about half of infants aged 7–11 months of 4.9 mg/day is derived (Table 7). 2050

Draft Dietary Reference Values for iron
EFSA Journal 20YY;volume(issue):NNNN 50
Table 7: Calculation of dietary iron requirement of infants aged 7–11 months 2051
Girls/Boys
Average of median weight of girls and boys (kg) (a)
8.6
Physiological requirement: total losses plus needs for growth (mg/day) (b)
0.79
Dietary iron requirement (mg/day) (16 % absorption) 4.9
(a): Median weight-for-age of male or female infants, respectively, aged 9 months according to the WHO Growth Standards 2052 (WHO Multicentre Growth Reference Study Group, 2006). 2053 (b): Algebraic sum of total losses of 0.022 mg/kg body weight per day × body weight [kg] plus growth needs of 0.6 mg/day 2054 (see Section 5.1.1.1). 2055 2056
After rounding, an AR of 5 mg/day is derived. In the absence of knowledge about the variation in 2057
requirement, the PRI for infants is estimated based on a CV of 10 % and is 6 mg/day. 2058
Up to the fourth year of life, daily losses of iron (resulting from intestinal, renal and dermal losses) 2059
have been estimated as 0.022 mg/kg body weight per day (Fomon et al., 2005). Iron requirements for 2060
growth are 0.25 mg/day (see Section 5.1.1.2) and the requirement for absorbed iron is 0.51 mg (Table 2061
8). Assuming 16 % absorption, the dietary requirement of about half of children aged 1–3 years is 2062
3.2 mg/day. After rounding, an AR of 3 mg/day is derived. In the absence of knowledge about the 2063
variation in requirement, CVs of 10 % are used for children of all ages. After rounding, the PRI for 2064
children aged 1–3 years is set at 4 mg/day. 2065
Table 8: Calculation of dietary iron requirement for children aged 1–17 years 2066
Age group 1–3 years (a)
4–6 years (a)
7–11 years (a)
12–17 years (a)
Boys Girls
Average of median weight (kg) of girls
and boys
11.8 (b)
19.0 (c)
30.3 (d)
52.7 (e) 51.6
(e)
Physiological requirement: total losses
plus needs for growth (mg/day)
0.51 (f)
0.5 (g)
0.76 (h)
1.27 (i)
1.13 (j)
Dietary iron requirement (mg/day)
(16 % absorption)
3.2 3.1 4.8 7.9 7.1
(a): To cover the whole age class, it was considered that a child is 3 years of age until its 4th birthday, 6 years of age until its 2067 7th birthday, 11 years until its 12th birthday and 17 years until its 18th birthday. As weight data for the day before the 4th, 7th, 2068 12th, and 18th birthday were not available, median weights for boys and girls aged 4, 7, 12, and 18 years, respectively, were 2069 used instead. 2070 (b): Median weight-for-age of male or female infants, respectively, aged 24 months according to the WHO Growth Standards 2071 (WHO Multicentre Growth Reference Study Group, 2006). 2072 (c): Median body weight of boys or girls, respectively, aged 5 years (van Buuren et al., 2012). 2073 (d): Median body weight of boys or girls, respectively, aged 9 years (van Buuren et al., 2012). 2074 (e): Median body weight of boys or girls, respectively, aged 14.5 years (van Buuren et al., 2012). 2075 (f): Algebraic sum of total losses of 0.022 mg/kg body weight per day × body weight [kg] plus growth needs of 0.25 mg/day 2076 (see Table 5). 2077 (g): Algebraic sum of total losses of 0.012 mg/kg body weight per day × body weight [kg] plus growth needs of 0.27 mg/day 2078 (see Table 5). 2079 (h): Algebraic sum of total losses of 0.012 mg/kg body weight per day × body weight [kg] plus growth needs of 0.39 mg/day 2080 (see Table 5). In case of early normal menarche (see Section 5.1.1.2) geometric mean menstrual iron losses of 0.25 mg/day 2081 need to be replaced and the dietary iron requirement would increase by 1.6 mg/day (assuming 16 % absorption). 2082 (i): Algebraic sum of total losses of 0.012 mg/kg body weight per day × body weight [kg] plus growth needs of 0.61 mg/day 2083 (see Table 5). 2084 (j): Algebraic sum of total losses of 0.012 mg/kg body weight per day × body weight [kg] plus growth needs of 0.26 mg/day 2085 (see Section 5.1.1.2) plus geometric mean menstrual losses of 0.25 mg/day. In case of late normal menarche (see Section 2086 5.1.1.2) geometric mean iron losses of 0.25 mg/day do not need to be replaced and the dietary iron requirement would 2087 decrease by 1.6 mg/day (assuming 16 % absorption). 2088 2089

Draft Dietary Reference Values for iron
EFSA Journal 20YY;volume(issue):NNNN 51
For children from four years of age, daily basal iron losses decrease to 0.012 mg/kg body weight, 2090
while requirements for growth are stable, in line with the constant yearly gain in body weight (see 2091
Section 5.1.1.2). For children aged 4–6 years, assuming 16 % absorption, the dietary requirement of 2092
about half of children is calculated as 3.1 mg/day (Table 8). After rounding, an AR of 3 mg/day is 2093
derived. In the absence of knowledge about the variation in requirement, the PRI for children aged 4–2094
6 years is estimated based on a CV of 10 % and, after rounding, is set at 4 mg/day. 2095
In children aged 7–11 years, losses per kg body weight do not change, but there is an increase in 2096
average daily requirement for absorbed iron for growth of 0.40 mg/day (see Table 5). The requirement 2097
for absorbed iron is 0.76 mg (Table 8). Assuming 16 % absorption, the dietary requirement of about 2098
half of children aged 7–11 years is 4.8 mg/day. After rounding, an AR of 5 mg/day is derived. In the 2099
absence of knowledge about the variation in requirement, the PRI for children aged 7–11 years is 2100
estimated based on a CV of 10 % and, after rounding, is set at 6 mg/day. 2101
In adolescence, the need for iron increases in both boys and girls, since it is a period of rapid growth 2102
in both sexes and in females periodic menstrual blood losses take place after menarche. Since the 2103
mean age of menarche in the EU is at 12.7 years (van Buuren et al., 2012) menstrual blood losses 2104
should be considered from 12 years with a geometric mean iron loss of 0.25 mg/day (Harvey et al., 2105
2005).13
Average iron requirements for growth peak in adolescence. Considering both the increased 2106
requirement for growth, obligatory losses and menstrual losses in girls after menarche, the 2107
requirement for absorbed iron is 1.27 mg/day in boys and 1.13 mg/day in girls (Table 8). Assuming 2108
16 % absorption, the dietary requirement based on median body weights at 14.5 years of age is 2109
calculated as 7.9 mg/day for boys and 7.1 mg/day for girls aged 12–17 years. After rounding, an AR 2110
of 8 mg/day for boys and 7 mg/day for girls aged 12–17 years is derived. 2111
In the absence of knowledge about the variation in requirement, the PRI for boys aged 12–17 years is 2112
estimated based on a CV of 10 % and, after rounding, is set at 10 mg/day. 2113
In setting a PRI for girls aged 12–17 years, the Panel considers that there are uncertainties related to 2114
the great variability in the rate and timing of physiological development and maturation, the onset of 2115
menarche, and the extent of and the skewed distribution of menstrual iron losses. The factorially 2116
calculated AR for girls aged 12–17 years is slightly lower than that derived for premenopausal women 2117
based on probabilistic modelling. It is probable that the 16 % absorption used to calculate the dietary 2118
requirement of approximately half of adolescent girls underestimates that of adolescents in general, 2119
and there is evidence to support this possibility, but it is not enough to inform the setting of a PRI. 2120
Using a CV of 15 % to set a PRI would result in a value of 9.2 mg/day for the dietary requirement of 2121
about 97–98 % of adolescent girls. However, once growth has ceased in adolescent girls their 2122
physiological and dietary requirements for iron can be expected to match those of premenopausal 2123
women. Thus, to take into account the uncertainties described above, in the transition to adulthood, 2124
the Panel has elected to set the PRI for adolescent girls as the mean of the calculated dietary 2125
requirement of 97–98 % of adolescent girls (9.2 mg/day) and the PRI for premenopausal women 2126
(16 mg/day). After rounding, a PRI of 13 mg/day is derived for girls aged 12–17 years. 2127
6.3. Pregnancy 2128
In the first trimester of pregnancy iron intake should cover basal losses of about 1.08 mg/day (Section 2129
5.1.1.4). The requirements for absorbed iron then increase exponentially, up to about 10 mg/day 2130
during the last six weeks of pregnancy, and at the same time there is a progressive increase in the 2131
efficiency of iron absorption. This can compensate for the higher needs provided adequate iron stores 2132
are present at conception. The Panel therefore considers that ARs and PRIs for pregnant women are 2133
13 Linda Harvey kindly provided individual data on menstrual blood losses. Based on these, the geometric mean iron loss and
percentiles as presented in Appendix B were calculated.

Draft Dietary Reference Values for iron
EFSA Journal 20YY;volume(issue):NNNN 52
the same as for non-pregnant women of childbearing age (Section 6.1.2), with the caveat that women 2134
enter pregnancy with an adequate iron status (serum ferritin concentration ≥ 30 μg/L). 2135
6.4. Lactation 2136
The Panel notes that the amount of iron secreted in breast milk during the first six months of lactation 2137
is 0.24 mg/day. Together with basal losses of 1.08 mg/day, the total requirement for absorbed iron 2138
during the first months of lactation is calculated to be 1.3 mg/day, assuming that menstruation has not 2139
yet resumed. The requirement for absorbed iron is less than or close to that of non-pregnant, non-2140
lactating women, but in order for depleted iron stores to be replenished, the Panel considers that ARs 2141
and PRIs for lactating women are the same as for non-pregnant women of childbearing age (Section 2142
6.1.2). 2143
CONCLUSIONS 2144
The Panel concludes that ARs and PRIs for iron can be derived factorially. ARs for men and 2145
premenopausal women were estimated based on modelled whole body iron losses using data from 2146
North American adults and a percentage dietary iron absorption which relates to a serum ferritin 2147
concentration of 30 µg/L. In men, obligatory losses at the 50th percentile are 0.95 mg/day and the AR 2148
was calculated taking into account 16 % absorption. The PRI was calculated as the requirement at the 2149
97.5th percentile of whole body iron losses and rounded. For postmenopausal women, the same DRVs 2150
as for men are set. In premenopausal women, the 50th percentile of the model-based distribution of 2151
iron losses is equal to 1.34 mg/day, and the AR was calculated taking into account 18 % absorption. 2152
The Panel decided to set a PRI covering the needs of 95 % of premenopausal women, and this is 2153
based on the 95th percentile of whole body iron losses in this population group. For the remaining 5 % 2154
of the women with very high losses, iron requirements are higher but there may be a compensatory 2155
up-regulation in the efficiency of absorption. However, it is uncertain to which level of absorptive 2156
efficiency this up-regulation occurs, so that it is not possible to derive a dietary requirement for this 2157
sub-group of women with very high losses. In infants aged 7–11 months and children, requirements 2158
were calculated factorially, considering needs for growth and replacement of iron losses, and 2159
assuming 16 % dietary iron absorption. In the absence of knowledge about the variation in 2160
requirement, PRIs for all age groups were estimated using a CV of 10 %, except for girls aged 12–17 2161
years. In this group a CV of 15 % was used because of the uncertainties related to the great variability 2162
in the rate and timing of physiological development and maturation, the onset of menarche, and the 2163
skewed distribution of menstrual iron losses. The PRI was set at the midpoint of that for 2164
premenopausal women and the mean of the calculated dietary requirement of 97–98 % of adolescent 2165
girls. For pregnant and lactating women it was assumed that iron stores and enhanced absorption 2166
provided sufficient additional iron, and the DRVs are the same as for premenopausal women. 2167

Draft Dietary Reference Values for iron
EFSA Journal 20YY;volume(issue):NNNN 53
Table 9: Summary of Average Requirements and Population Reference Intakes for iron 2168
Age Dietary Reference Value
Average Requirement
(mg/day)
Population Reference Intake
(mg/day)
7–11 months 5 6
1–6 years 3 4
7–11 years 5 6
12–17 years (M) 8 10
12–17 years (F) 7 13
≥ 18 years (M) 6 11
≥ 18 years (F)
Premenopausal
Postmenopausal
7
6
16 (a)
11
Pregnancy as for non-pregnant premenopausal women as for non-pregnant premenopausal women
Lactation as for non-lactating premenopausal women as for non-lactating premenopausal women
M, males; F, females 2169 (a): The PRI covers the requirement of approximately 95 % of premenopausal women. 2170
RECOMMENDATIONS FOR RESEARCH 2171
The Panel recommends to 2172
Better characterise the iron homeostasis to enable the development and validation of markers 2173
indicating adaptation to insufficient iron supply. 2174
Generate dose–response data for iron intake/status and functional outcomes/health endpoints e.g. 2175
growth and development in children, pregnancy outcome, dementia. 2176
Investigate iron metabolism in pregnancy, including causes of iron deficiency and its effect on 2177
fetal development and consequences for later life. The Panel also recommends that longitudinal 2178
data on serum ferritin concentration and other appropriate markers of iron status in pregnancy be 2179
generated in order to predict the risk of developing iron deficiency anaemia. 2180
Investigate effects of different physiological states on iron requirements, e.g. overweight, obesity, 2181
low-grade inflammation, pregnancy, and ageing. 2182
Investigate iron absorption from whole diets, effects of different dietary patterns on 2183
bioavailability, haem iron content of cooked and processed meat, meat products and other flesh 2184
foods. 2185
Generate data on total body iron losses in all population groups, especially in menstruating 2186
women. The Panel also recommends that the relationship between iron losses and absorption 2187
efficiency be investigated, especially in women with high menstrual losses. 2188
To investigate the bioavailability of iron fortificants, and their contribution to total dietary iron 2189
intake. 2190
2191

Draft Dietary Reference Values for iron
EFSA Journal 20YY;volume(issue):NNNN 54
REFERENCES 2192
Afssa (Agence française de sécurité sanitaire des aliments), 2001. Apports nutritionnels conseillés 2193
pour la population française. Editions Tec&Doc, Paris, France, 605 pp. 2194
Afssa (Agence française de sécurité sanitaire des aliments), 2009. Étude Individuelle Nationale des 2195
Consommations Alimentaires 2 (INCA 2) (2006-2007). Rapport. 228 pp. 2196
Allen KJ, Gurrin LC, Constantine CC, Osborne NJ, Delatycki MB, Nicoll AJ, McLaren CE, Bahlo M, 2197
Nisselle AE, Vulpe CD, Anderson GJ, Southey MC, Giles GG, English DR, Hopper JL, Olynyk 2198
JK, Powell LW and Gertig DM, 2008. Iron-overload-related disease in HFE hereditary 2199
hemochromatosis. New England Journal of Medicine, 358, 221-230. 2200
Allen L, de Benoist B, Dary O and Hurrell R (World Health Organization and Food and Agriculture 2201
Organization of the United Nations), 2006. WHO/FAO Guidelines on food fortification with 2202
micronutrients. 341 pp. 2203
Amcoff E, Edberg A, Enghardt Barbieri H, Lindroos A, Nälsén C, Pearson M and Warensjö Lemming 2204
E (Livsmedelsverket), 2012. Riksmaten – vuxna 2010–11. Livsmedels- och näringsintag bland 2205
vuxna i Sverige. Resultat från matvaneundersökning utförd 2010–11. 180 pp. 2206
Andersen E, Hutchings B, Jansen J and Nyholm M, 1982. Højde og vaegt hos danske born [Heights 2207
and weights of Danish children]. Ugeskrift for Laeger, 144, 1760-1765. 2208
Andersen HS, Gambling L, Holtrop G and McArdle HJ, 2007. Effect of dietary copper deficiency on 2209
iron metabolism in the pregnant rat. British Journal of Nutrition, 97, 239-246. 2210
Arab-Kohlmeier L, Sichert-Oevermann W and Schettler G, 1989. Eisenzufuhr und Eisenstatus der 2211
Bevölkerung in der Bundesrepublik Deutschland. Springer-Verlag, Berlin, Germany, 177 pp. 2212
Armah SM, Carriquiry A, Sullivan D, Cook JD and Reddy MB, 2013. A complete diet-based 2213
algorithm for predicting nonheme iron absorption in adults. Journal of Nutrition, 143, 1136-1140. 2214
Bakr AF and Sarette G, 2006. Measurement of reticulocyte hemoglobin content to diagnose iron 2215
deficiency in Saudi children. European Journal of Pediatrics, 165, 442-445. 2216
Balder HF, Vogel J, Jansen MC, Weijenberg MP, van den Brandt PA, Westenbrink S, van der Meer R 2217
and Goldbohm RA, 2006. Heme and chlorophyll intake and risk of colorectal cancer in the 2218
Netherlands cohort study. Cancer Epidemiology, Biomarkers and Prevention, 15, 717-725. 2219
Baldwin ST, 2012. Maternal, fetal and neonatal physiology: A clinical perspective. 4th edition, 2220
Elsevier Saunder, Philadelphia, USA, 768 pp. 2221
Barrett JF, Whittaker PG, Williams JG and Lind T, 1994. Absorption of non-haem iron from food 2222
during normal pregnancy. BMJ: British Medical Journal, 309, 79-82. 2223
Bates B, Lennox A, Prentice A, Bates C and Swan G, 2012. National Diet and Nutrition Survey. 2224
Headline results from Years 1, 2 and 3 (combined) of the Rolling Programme (2008/2009 – 2225
2010/11). A survey carried out on behalf of the Department of Health and the Food Standards 2226
Agency. 79 pp. 2227
Baune BT, Neuhauser H, Ellert U and Berger K, 2010. The role of the inflammatory markers ferritin, 2228
transferrin and fibrinogen in the relationship between major depression and cardiovascular 2229
disorders - The German Health Interview and Examination Survey. Acta Psychiatrica 2230
Scandinavica, 121, 135-142. 2231
Beaton GH, Thein M, Milne H and Veen MJ, 1970. Iron requirements of menstruating women. 2232
American Journal of Clinical Nutrition, 23, 275-283. 2233

Draft Dietary Reference Values for iron
EFSA Journal 20YY;volume(issue):NNNN 55
Beaton GH, Corey PN and Steele C, 1989. Conceptual and methodological issues regarding the 2234
epidemiology of iron deficiency and their implications for studies of the functional consequences 2235
of iron deficiency. American Journal of Clinical Nutrition, 50, 575-585; discussion 586-578. 2236
Beutler E, Felitti VJ, Koziol JA, Ho NJ and Gelbart T, 2002. Penetrance of 845G--> A (C282Y) HFE 2237
hereditary haemochromatosis mutation in the USA. Lancet, 359, 211-218. 2238
Bjorn-Rasmussen E, Hallberg L, Isaksson B and Arvidsson B, 1974. Food iron absorption in man. 2239
Applications of the two-pool extrinsic tag method to measure heme and nonheme iron absorption 2240
from the whole diet. Journal of Clinical Investigation, 53, 247-255. 2241
Borch-Iohnsen B, 1993. Järnmangel i tenårene [Iron deficiency in teenagers]. Tidsskrift for Den 2242
Norske Laegeforening, 113, 2940-2941. 2243
Bothwell TH and Finch CA, 1962. Iron metabolism. Little, Brown, Boston, USA, 440 pp. 2244
Bothwell TH, Charlton RW, Cook JD and Finch CA, 1979. Iron metabolism in man. In: Ed Scientific 2245
B. Blackwell Scientific Oxford, United Kingdom, 451-555. 2246
Bothwell TH and Charlton RW, 1981. Iron deficiency in women. In: Ed INACG (International 2247
Nutritional Anemia Consultative Group). The Nutrition Foundation, Washington, D. C., USA, 7-9. 2248
Bothwell TH, 1995. Overview and mechanisms of iron regulation. Nutrition Reviews, 53, 237-245. 2249
Bothwell TH, 2000. Iron requirements in pregnancy and strategies to meet them. American Journal of 2250
Clinical Nutrition, 72, 257S-264S. 2251
Bowering J and Sanchez AM, 1976. A conspectus of research on iron requirements of man. Journal of 2252
Nutrition, 106, 985-1074. 2253
Brownlie Tt, Utermohlen V, Hinton PS and Haas JD, 2004. Tissue iron deficiency without anemia 2254
impairs adaptation in endurance capacity after aerobic training in previously untrained women. 2255
American Journal of Clinical Nutrition, 79, 437-443. 2256
Brugnara C, Zurakowski D, DiCanzio J, Boyd T and Platt O, 1999. Reticulocyte hemoglobin content 2257
to diagnose iron deficiency in children. The Journal of the American Medical Association, 281, 2258
2225-2230. 2259
Brune M, Magnusson B, Persson H and Hallberg L, 1986. Iron losses in sweat. American Journal of 2260
Clinical Nutrition, 43, 438-443. 2261
Brunori M and Vallone B, 2006. A globin for the brain. Official Publication of the Federation of 2262
American Societies for Experimental Biology, 20, 2192-2197. 2263
Burmaster DE and Anderson PD, 1994. Principles of good practice for the use of Monte Carlo 2264
techniques in human health and ecological risk assessments. Risk Analysis, 14, 477-481. 2265
Butte NF, Lopez-Alarcon MG and Garza C, 2002. Nutrient adequacy of exclusive breastfeeding for 2266
the term infant during the first six months of life. World Health Organization, 57 pp. 2267
Celada A, Busset R, Gutierrez J and Herreros V, 1982. No correlation between iron concentration in 2268
breast milk and maternal iron stores. Helvetica Paediatrica Acta, 37, 11-16. 2269
Chaparro CM, 2008. Setting the stage for child health and development: prevention of iron deficiency 2270
in early infancy. Journal of Nutrition, 138, 2529-2533. 2271
Chen C and Paw BH, 2012. Cellular and mitochondrial iron homeostasis in vertebrates. Biochimica et 2272
Biophysica Acta, 1823, 1459-1467. 2273
Chung B, Chaston T, Marks J, Srai SK and Sharp PA, 2009. Hepcidin decreases iron transporter 2274
expression in vivo in mouse duodenum and spleen and in vitro in THP-1 macrophages and 2275
intestinal Caco-2 cells. Journal of Nutrition, 139, 1457-1462. 2276
Codex (FAO/WHO Codex Alimentarius Commission), 2015. Procedural Manual. 23rd edition. 2277

Draft Dietary Reference Values for iron
EFSA Journal 20YY;volume(issue):NNNN 56
Collings R, Harvey LJ, Hooper L, Hurst R, Brown TJ, Ansett J, King M and Fairweather-Tait SJ, 2278
2013. The absorption of iron from whole diets: a systematic review. American Journal of Clinical 2279
Nutrition, 98, 65-81. 2280
Collins JF, Prohaska JR and Knutson MD, 2010. Metabolic crossroads of iron and copper. Nutrition 2281
Reviews, 68, 133-147. 2282
Committee on Iron Deficiency, 1968. Iron deficiency in the United States. The Journal of the 2283
American Medical Association, 203, 407-412. 2284
Conrad ME and Schade SG, 1968. Ascorbic acid chelates in iron absorption: a role for hydrochloric 2285
acid and bile. Gastroenterology, 55, 35-45. 2286
Cook JD and Monsen ER, 1977. Vitamin C, the common cold, and iron absorption. American Journal 2287
of Clinical Nutrition, 30, 235-241. 2288
Cook JD, Dassenko SA and Lynch SR, 1991. Assessment of the role of nonheme-iron availability in 2289
iron balance. American Journal of Clinical Nutrition, 54, 717-722. 2290
Cook JD and Reddy MB, 2001. Effect of ascorbic acid intake on nonheme-iron absorption from a 2291
complete diet. American Journal of Clinical Nutrition, 73, 93-98. 2292
Cross AJ, Harnly JM, Ferrucci LM, Risch A, Mayne ST and Sinha R, 2012. Developing a heme iron 2293
database for meats according to meat type, cooking method and doneness level. Food and Nutrition 2294
Sciences, 3, 905-913. 2295
D-A-CH (Deutsche Gesellschaft für Ernährung - Österreichische Gesellschaft für Ernährung - 2296
Schweizerische Gesellschaft für Ernährungsforschung - Schweizerische Vereinigung für 2297
Ernährung), 2015. Referenzwerte für die Nährstoffzufuhr. 2. Auflage, 1. Ausgabe. 215 pp. 2298
Dainty J, Berry R, Lynch S, Harvey L and Fairweather-Tait S, 2014. Estimation of dietary iron 2299
bioavailability from food intake and iron status. PLoS ONE, 9(10): e111824, 7 pp. 2300
Dallman PR and Siimes MA, 1979. Percentile curves for hemoglobin and red cell volume in infancy 2301
and childhood. Journal of Pediatrics, 94, 26-31. 2302
Dallman PR, 1986. Iron deficiency in the weanling: a nutritional problem on the way to resolution. 2303
Acta Paediatrica Scandinavica. Supplement, 323, 59-67. 2304
Dallman PR, 1988. Nutritional anemia of infancy. iron, folic acid and vitamin B12 In: Nutrition 2305
during infancy. Eds Tsang RC and Nichols BL. Hanley & Belfus, Mosby, St Louis, USA, 216-235. 2306
Dallman PR, Yip R and Oski FA, 1993. Iron deficiency and related nutritional anemias. In: 2307
Hematology of Infancy and Childhood. Eds Nathan DG and Oski FA. Saunders Elsevier, 2308
Philadelphia, USA, 413-449. 2309
Davidsson L, Kastenmayer P, Szajewska H, Hurrell RF and Barclay D, 2000. Iron bioavailability in 2310
infants from an infant cereal fortified with ferric pyrophosphate or ferrous fumarate. American 2311
Journal of Clinical Nutrition, 71, 1597-1602. 2312
DeLuca HF, 1976. Metabolism of vitamin D: current status. American Journal of Clinical Nutrition, 2313
29, 1258-1270. 2314
DeMaeyer EM, Dallman P, Gurney JM, Hallberg L, Sood SK and Srikantia SG, 1989. Preventing and 2315
controlling iron deficiency anaemia through primary health care: a guide for health administrators 2316
and programme managers. World Health Organization, 61 pp. 2317
Dewey KG and Chaparro CM, 2007. Session 4: Mineral metabolism and body composition iron status 2318
of breast-fed infants. Proceedings of the Nutrition Society, 66, 412-422. 2319
DH (Department of Health), 1991. Dietary reference values for food energy and nutrients for the 2320
United Kingdom. Report of the Panel on Dietary Reference Values of the Committee on Medical 2321
Aspects of Food Policy. HM Stationary Office, London, 212 pp. 2322

Draft Dietary Reference Values for iron
EFSA Journal 20YY;volume(issue):NNNN 57
Dibley MJ, Goldsby JB, Staehling NW and Trowbridge FL, 1987. Development of normalized curves 2323
for the international growth reference: historical and technical considerations. American Journal of 2324
Clinical Nutrition, 46, 736-748. 2325
Domellof M, Lonnerdal B, Abrams SA and Hernell O, 2002a. Iron absorption in breast-fed infants: 2326
effects of age, iron status, iron supplements, and complementary foods. American Journal of 2327
Clinical Nutrition, 76, 198-204. 2328
Domellof M and Hernell O, 2002. Iron-deficiency anaemia during the first two years of life. 2329
Scandinavian Journal of Nutrition, 46, 20-30. 2330
Domellof M, Dewey KG, Lonnerdal B, Cohen RJ and Hernell O, 2002b. The diagnostic criteria for 2331
iron deficiency in infants should be reevaluated. Journal of Nutrition, 132, 3680-3686. 2332
Domellof M, Lonnerdal B, Dewey KG, Cohen RJ and Hernell O, 2004. Iron, zinc, and copper 2333
concentrations in breast milk are independent of maternal mineral status. American Journal of 2334
Clinical Nutrition, 79, 111-115. 2335
Domellof M, 2011. Iron requirements in infancy. Annals of Nutrition and Metabolism, 59, 59-63. 2336
Domellof M, Thorsdottir I and Thorstensen K, 2013. Health effects of different dietary iron intakes: a 2337
systematic literature review for the 5th Nordic Nutrition Recommendations. Food & Nutrition 2338
Research, 57. 2339
Dube K, Schwartz J, Mueller MJ, Kalhoff H and Kersting M, 2010a. Iron intake and iron status in 2340
breastfed infants during the first year of life. Clinical Nutrition, 29, 773-778. 2341
Dube K, Schwartz J, Mueller MJ, Kalhoff H and Kersting M, 2010b. Complementary food with low 2342
(8%) or high (12%) meat content as source of dietary iron: a double-blinded randomized controlled 2343
trial. European Journal of Nutrition, 49, 11-18. 2344
EFSA (European Food Safety Authority), 2004. Scientific opinion of the Panel on Dietetic Products, 2345
Nutrition and Allergies (NDA) on a request from the Commission related to the Tolerable Upper 2346
Intake Level of iron. The EFSA Journal 2004, 125, 1-34. 2347
EFSA (European Food Safety Authority), 2009. Guidance of the Scientific Committee on 2348
transparency in the scientific aspects of risk assessment carried out by EFSA. Part 2: general 2349
principles. The EFSA Journal 2009, 1051, 1-22. 2350
EFSA (European Food Safety Authority), 2011a. Report on the development of a food classification 2351
and description system for exposure assessment and guidance on its implementation and use. 2352
EFSA Journal 2011;9(12):2489, 84 pp., doi:10.2903/j.efsa.2011.2489 2353
EFSA (European Food Safety Authority), 2011b. Use of the EFSA Comprehensive European Food 2354
Consumption Database in Exposure Assessment. EFSA Journal 2011;9(3):2097, 34 pp. 2355
doi:10.2903/j.efsa.2011.2097 2356
EFSA NDA Panel (EFSA Panel on Dietetic Products, Nutrition and Allergies), 2009. Scientific 2357
Opinion on the appropriate age for introduction of complementary feeding of infants. EFSA 2358
Journal 2009;7(12):1423, 38 pp., doi:10.2903/j.efsa.2009.1423 2359
EFSA NDA Panel (EFSA Panel on Dietetic Products, Nutrition and Allergies), 2010. Scientific 2360
Opinion on principles for deriving and applying Dietary Reference Values. EFSA Journal 2010; 2361
8(3):1458, 30 pp., doi:10.2903/j.efsa.2010.1458 2362
EFSA NDA Panel (EFSA Panel on Dietetic Products, Nutrition and Allergies), 2013. Scientific 2363
Opinion on Dietary Reference Values for energy. EFSA Journal 2013;11(1):3005, 112 pp., 2364
doi:10.2903/j.efsa.2013.3005 2365
Ehn L, Carlmark B and Hoglund S, 1980. Iron status in athletes involved in intense physical activity. 2366
Medicine and Science in Sports and Exercise, 12, 61-64. 2367

Draft Dietary Reference Values for iron
EFSA Journal 20YY;volume(issue):NNNN 58
Engelmann MD, Sandstrom B and Michaelsen KF, 1998. Meat intake and iron status in late infancy: 2368
an intervention study. Journal of Pediatric Gastroenterology and Nutrition, 26, 26-33. 2369
Fairbanks VF and Bleutler E, 1988. Iron. In: Modern nutrition in health and disease. Eds Shils ME 2370
and Young VR. Lea&Febiger, Philadelphia, USA, 193-226. 2371
Fairweather-Tait SJ, Powers HJ, Minski MJ, Whitehead J and Downes R, 1992. Riboflavin deficiency 2372
and iron absorption in adult Gambian men. Annals of Nutrition and Metabolism, 36, 34-40. 2373
Fairweather-Tait SJ, Wawer AA, Gillings R, Jennings A and Myint PK, 2014. Iron status in the 2374
elderly. Mechanisms of Ageing and Development, 136-137(100), 22-28. 2375
FAO/WHO (Food and Agriculture Organisation/World Health Organisation), 1988. Requirements of 2376
vitamin A, iron, folate and vitamin B12. Report of a Joint FAO/WHO Expert Consultation. 107 pp. 2377
FAO/WHO/UNU (Food and Agriculture Organization of the United Nations/World Health 2378
Organization/United Nations University), 2004. Human energy requirements. Report of a Joint 2379
FAO/WHO/UNU Expert Consultation: Rome 17-24 October 2001. FAO Food and Nutrition 2380
Technical Report Series, 103 pp. 2381
Faupel-Badger JM, Hsieh CC, Troisi R, Lagiou P and Potischman N, 2007. Plasma volume expansion 2382
in pregnancy: implications for biomarkers in population studies. Cancer Epidemiology, 2383
Biomarkers and Prevention, 16, 1720-1723. 2384
Feeley RM, Eitenmiller RR, Jones JB, Jr. and Barnhart H, 1983. Copper, iron, and zinc contents of 2385
human milk at early stages of lactation. American Journal of Clinical Nutrition, 37, 443-448. 2386
Fomon SJ and Anderson TA, 1974. Infant nutrition. Saunders, Philadelphia, USA, 575 pp. 2387
Fomon SJ, Nelson SE, Serfass RE and Ziegler EE, 2005. Absorption and loss of iron in toddlers are 2388
highly correlated. Journal of Nutrition, 135, 771-777. 2389
Frey H and Rhodes D, 1999. Quantitative Analysis of Variability and Uncertainty in Environmental 2390
Data and Models. Volume 1. Theory and Methodology Based Upon Bootstrap Simulation. Work 2391
Performed Under Grant No: DE-FG05-95ER30250. Report No : DOE/ER/30250-Vol. 1 for U.S. 2392
Department of Energy Office of Energy Research. Water Resources and Environmental 2393
Engineering Program. Department of Civil Engineering. North Carolina State University. 2394
Frisancho AR, 1990. Anthropometric standards for the assessment of growth and nutritional status. 2395
University of Michigan Press, Ann Arbor, USA, 200 pp. 2396
Galan P, Hercberg S, Soustre Y, Dop MC and Dupin H, 1985. Factors affecting iron stores in French 2397
female students. Human Nutrition. Clinical Nutrition, 39, 279-287. 2398
Galan P, Cherouvrier F, Preziosi P and Hercberg S, 1991. Effects of the increasing consumption of 2399
dairy products upon iron absorption. European Journal of Clinical Nutrition, 45, 553-559. 2400
Gambling L, Andersen HS and McArdle HJ, 2008. Iron and copper, and their interactions during 2401
development. Biochemical Society Transactions, 36, 1258-1261. 2402
Ganz T, 2013. Systemic iron homeostasis. Physiological Reviews, 93, 1721-1741. 2403
Garby L, Sjoelin S and Vuille JC, 1964. Studies on Erythro-Kinetics in Infancy. Iv. The Long-Term 2404
Behaviour of Radioiron in Circulating Foetal and Adult Haemoglobin, and Its Faecal Excretion. 2405
Acta Paediatrica, 53, 33-41. 2406
Gardner GW, Edgerton VR, Senewiratne B, Barnard RJ and Ohira Y, 1977. Physical work capacity 2407
and metabolic stress in subjects with iron deficiency anemia. American Journal of Clinical 2408
Nutrition, 30, 910-917. 2409
Gibson SA, 1999. Iron intake and iron status of preschool children: associations with breakfast 2410
cereals, vitamin C and meat. Public Health Nutrition, 2, 521-528. 2411

Draft Dietary Reference Values for iron
EFSA Journal 20YY;volume(issue):NNNN 59
Glueck CJ, Morrison JA, Wang P and Woo JG, 2013. Early and late menarche are associated with 2412
oligomenorrhea and predict metabolic syndrome 26 years later. Metabolism: Clinical and 2413
Experimental, 62, 1597-1606. 2414
Green R, Charlton R, Seftel H, Bothwell T, Mayet F, Adams B, Finch C and Layrisse M, 1968. Body 2415
iron excretion in man: a collaborative study. American Journal of Medicine, 45, 336-353. 2416
Gunnarsson BS, Thorsdottir I and Palsson G, 2004. Iron status in 2-year-old Icelandic children and 2417
associations with dietary intake and growth. European Journal of Clinical Nutrition, 58, 901-906. 2418
Habicht JP, Davanzo J, Butz WP and Meyers L, 1985. The Contraceptive Role of Breastfeeding. 2419
Population Studies: A Journal of Demography 39, 213-232. 2420
Hallberg L and Nilsson L, 1964. Constancy of Individual Menstrual Blood Loss. Acta Obstetricia et 2421
Gynecologica Scandinavica, 43, 352-359. 2422
Hallberg L, Hogdahl AM, Nilsson L and Rybo G, 1966a. Menstrual blood loss--a population study. 2423
Variation at different ages and attempts to define normality. Acta Obstetricia et Gynecologica 2424
Scandinavica, 45, 320-351. 2425
Hallberg L, Hogdahl AM, Nilsson L and Rybo G, 1966b. Menstrual blood loss and iron deficiency. 2426
Acta Medica Scandinavica, 180, 639-650. 2427
Hallberg L, 1981. Bioavailability of dietary iron in man. Annual Review of Nutrition, 1, 123-147. 2428
Hallberg L, Rossander L and Skanberg AB, 1987. Phytates and the inhibitory effect of bran on iron 2429
absorption in man. American Journal of Clinical Nutrition, 45, 988-996. 2430
Hallberg L, 1988. Iron balance in pregnancy. In: Vitamins and minerals in pregnancy and lactation. 2431
Nestlé Nutrition Workshop Series, n°16. Ed Berger H. Raven Press, New York, USA, 115-127. 2432
Hallberg L, Brune M and Rossander L, 1989. Iron absorption in man: ascorbic acid and dose-2433
dependent inhibition by phytate. American Journal of Clinical Nutrition, 49, 140-144. 2434
Hallberg L and Rossander-Hulten L, 1991. Iron requirements in menstruating women. American 2435
Journal of Clinical Nutrition, 54, 1047-1058. 2436
Hallberg L, Brune M, Erlandsson M, Sandberg AS and Rossander-Hulten L, 1991. Calcium: effect of 2437
different amounts on nonheme- and heme-iron absorption in humans. American Journal of Clinical 2438
Nutrition, 53, 112-119. 2439
Hallberg L and Hultén L, 1996. Iron requirements, iron balance and iron deficiency in menstruating 2440
and pregnant women. In: Iron nutrition in health and disease. Ed Asp NG. George Libbey, London, 2441
UK, 165–182. 2442
Hallberg L, Hulten L and Gramatkovski E, 1997. Iron absorption from the whole diet in men: how 2443
effective is the regulation of iron absorption? American Journal of Clinical Nutrition, 66, 347-356. 2444
Hallberg L and Hulthen L, 2000. Prediction of dietary iron absorption: an algorithm for calculating 2445
absorption and bioavailability of dietary iron. American Journal of Clinical Nutrition, 71, 1147-2446
1160. 2447
Hannan MA, Faraji B, Tanguma J, Longoria N and Rodriguez RC, 2009. Maternal milk concentration 2448
of zinc, iron, selenium, and iodine and its relationship to dietary intakes. Biological Trace Element 2449
Research, 127, 6-15. 2450
Harvey LJ, Armah CN, Dainty JR, Foxall RJ, John Lewis D, Langford NJ and Fairweather-Tait SJ, 2451
2005. Impact of menstrual blood loss and diet on iron deficiency among women in the UK. British 2452
Journal of Nutrition, 94, 557-564. 2453
Harvey LJ, Berti C, Casgrain A, Cetin I, Collings R, Gurinovic M, Hermoso M, Hooper L, Hurst R, 2454
Koletzko B, Ngo J, Vinas BR, Vollhardt C, Vucic V and Fairweather-Tait SJ, 2013. EURRECA-2455

Draft Dietary Reference Values for iron
EFSA Journal 20YY;volume(issue):NNNN 60
Estimating iron requirements for deriving dietary reference values. Critical Reviews in Food 2456
Science and Nutrition, 53, 1064-1076. 2457
Haschke F, Vanura H, Male C, Owen G, Pietschnig B, Schuster E, Krobath E and Huemer C, 1993. 2458
Iron nutrition and growth of breast- and formula-fed infants during the first 9 months of life. 2459
Journal of Pediatric Gastroenterology and Nutrition, 16, 151-156. 2460
Hawkins WW, 1964. Iron, copper and cobalt. In: Nutrition: A comprehensive treatise. Eds Beaton GH 2461
and McHenry EW. Academic Press, New York, USA, 309-372. 2462
Haycock GB, Schwartz GJ and Wisotsky DH, 1978. Geometric method for measuring body surface 2463
area: a height-weight formula validated in infants, children, and adults. Journal of Pediatrics, 93, 2464
62-66. 2465
Helldán A, Raulio S, Kosola M, Tapanainen H, Ovaskainen ML and Virtanen S, 2013. Finravinto 2466
2012 -tutkimus - The National FINDIET 2012 Survey. THL. Raportti 16/2013, 217 pp. 2467
Hercberg S, Galan P and Preziosi P, 2000. La déficience en fer au cours de la grossesse en France. 2468
Cahiers de Nutrition et de Diététique, 35, 13-24. 2469
Hermoso M, Vucic V, Vollhardt C, Arsic A, Roman-Vinas B, Iglesia-Altaba I, Gurinovic M and 2470
Koletzko B, 2011. The effect of iron on cognitive development and function in infants, children 2471
and adolescents: a systematic review. Annals of Nutrition and Metabolism, 59, 154-165. 2472
Hoppler M, Schonbachler A, Meile L, Hurrell RF and Walczyk T, 2008. Ferritin-iron is released 2473
during boiling and in vitro gastric digestion. Journal of Nutrition, 138, 878-884. 2474
Hoppu U, Lehtisalo J, Tapanainen H and Pietinen P, 2010. Dietary habits and nutrient intake of 2475
Finnish adolescents. Public Health Nutrition, 13, 965-972. 2476
Hunt JR and Roughead ZK, 1999. Nonheme-iron absorption, fecal ferritin excretion, and blood 2477
indexes of iron status in women consuming controlled lactoovovegetarian diets for 8 wk. American 2478
Journal of Clinical Nutrition, 69, 944-952. 2479
Hunt JR and Roughead ZK, 2000. Adaptation of iron absorption in men consuming diets with high or 2480
low iron bioavailability. American Journal of Clinical Nutrition, 71, 94-102. 2481
Hunt JR and Zeng H, 2004. Iron absorption by heterozygous carriers of the HFE C282Y mutation 2482
associated with hemochromatosis. American Journal of Clinical Nutrition, 80, 924-931. 2483
Hunt JR, Zito CA and Johnson LK, 2009. Body iron excretion by healthy men and women. American 2484
Journal of Clinical Nutrition, 89, 1792-1798. 2485
Hurrell R and Egli I, 2010. Iron bioavailability and dietary reference values. American Journal of 2486
Clinical Nutrition, 91, 1461S-1467S. 2487
Hurrell RF, Lynch SR, Trinidad TP, Dassenko SA and Cook JD, 1989. Iron absorption in humans as 2488
influenced by bovine milk proteins. American Journal of Clinical Nutrition, 49, 546-552. 2489
Hurrell RF, 1992. Prospects for Improving the Iron Fortification of Foods. Nutritional Anemias, 30, 2490
193-208. 2491
Hurrell RF, Reddy M and Cook JD, 1999. Inhibition of non-haem iron absorption in man by 2492
polyphenolic-containing beverages. British Journal of Nutrition, 81, 289-295. 2493
Hurrell RF, 2004. Phytic acid degradation as a means of improving iron absorption. International 2494
Journal for Vitamin and Nutrition Research, 74, 445-452. 2495
Hutton EK and Hassan ES, 2007. Late vs early clamping of the umbilical cord in full-term neonates: 2496
systematic review and meta-analysis of controlled trials. The Journal of the American Medical 2497
Association, 297, 1241-1252. 2498

Draft Dietary Reference Values for iron
EFSA Journal 20YY;volume(issue):NNNN 61
Ilich-Ernst JZ, McKenna AA, Badenhop NE, Clairmont AC, Andon MB, Nahhas RW, Goel P and 2499
Matkovic V, 1998. Iron status, menarche, and calcium supplementation in adolescent girls. 2500
American Journal of Clinical Nutrition, 68, 880-887. 2501
INACG (International Nutritional Anemia Consultative Group), 1989. Iron deficiency in women. The 2502
Nutrition Foundation, 68 pp. 2503
IOM (Institute of Medecine), 1993. Iron deficiency anemia: recommended guidelines for the 2504
prevention, detection and management among U.S. children and women of childbearing age. 2505
Washington D. C., USA, National Academy Press, 126 pp. 2506
IOM (Institute of Medicine), 2001. Dietary Reference Intakes for vitamin A, vitamin K, arsenic, 2507
boron, chromium, copper, iodine, iron, manganese, molybdenum, nickel, silicon, vanadium and 2508
zinc. Food and Nutrition Board. National Academy Press, Washington D. C., USA, 797 pp. 2509
IUNA (Irish Universities Nutrition Alliance), 2011. National Adult Nutrition Survey. 40 pp. 2510
Jacob RA, Sandstead HH, Munoz JM, Klevay LM and Milne DB, 1981. Whole body surface loss of 2511
trace metals in normal males. American Journal of Clinical Nutrition, 34, 1379-1383. 2512
Jakszyn P, Lujan-Barroso L, Agudo A, Bueno-de-Mesquita HB, Molina E, Sanchez MJ, Fonseca-2513
Nunes A, Siersema PD, Matiello A, Tumino R, Saieva C, Pala V, Vineis P, Boutron-Ruault MC, 2514
Racine A, Bastide N, Travis RC, Khaw KT, Riboli E, Murphy N, Vergnaud AC, Trichopoulou A, 2515
Valanou E, Oikonomidou E, Weiderpass E, Skeie G, Johansen D, Lindkvist B, Johansson M, 2516
Duarte-Salles T, Freisling H, Barricarte A, Huerta JM, Amiano P, Tjonneland A, Overvad K, 2517
Kuehn T, Grote V, Boeing H, Peeters PH and Gonzalez CA, 2013. Meat and heme iron intake and 2518
esophageal adenocarcinoma in the European Prospective Investigation into Cancer and Nutrition 2519
study. International Journal of Cancer, 133, 2744-2750. 2520
Kalgaonkar S and Lonnerdal B, 2008a. Receptor-mediated uptake of ferritin-bound iron by human 2521
intestinal Caco-2 cells. J Nutr Biochem, In Press. 2522
Kalgaonkar S and Lonnerdal B, 2008b. Effects of dietary factors on iron uptake from ferritin by Caco-2523
2 cells. Journal of Nutritional Biochemistry, 19, 33-39. 2524
Karlberg P and Taranger J, 1976. The somatic development of children in a swedish urban 2525
community. Acta Paediatrica Scandinavica. Supplement, 1-148. 2526
Karmarkar MG and Ramakrishnan CV, 1960. Studies on human lactation. Relation between the 2527
dietary intake of lactating women and the chemical composition of milk with regard to principal 2528
and certain inorganic constituents. Acta Paediatrica, 49, 599-604. 2529
Kersting M and Clausen K, 2003. Ernährungsphysiologische Auswertung einer repräsentativen 2530
Verzehrsstudie bei Säuglingen und Kleinkindern VELS mit dem Instrumentarium der DONALD 2531
Studie. Forschungsinstitut für Kinderernährung, Dortmund, Germany, 103 pp. 2532
Kohlmeier M, 1995. Versorgung Erwachsener mit Mineralstoffen in der Bundesrepublik Deutschland. 2533
VERA-Schriftenreihe Band V. Wissenschaftlicher Fachverlag Dr. Fleck, Niederkleen, Germany, 2534
316 pp. 2535
Kramer MS and Kakuma R, 2004. The optimal duration of exclusive breastfeeding: a systematic 2536
review. Advances in Experimental Medicine and Biology, 554, 63-77. 2537
Kristensen MB, Hels O, Morberg C, Marving J, Bugel S and Tetens I, 2005. Pork meat increases iron 2538
absorption from a 5-day fully controlled diet when compared to a vegetarian diet with similar 2539
vitamin C and phytic acid content. British Journal of Nutrition, 94, 78-83. 2540
Kyttälä P, Ovaskainen M, Kronberg-Kippilä C, Erkkola M, Tapanainen H, Tuokkola J, Veijola R, 2541
Simell O, Knip M and Virtanen S, 2008. The Diet of Finnish Preschoolers (in Finnish, abstract in 2542
English). Publications of the National Public Health Institute B32/2008, 154 pp. 2543

Draft Dietary Reference Values for iron
EFSA Journal 20YY;volume(issue):NNNN 62
Kyttälä P, Erkkola M, Kronberg-Kippila C, Tapanainen H, Veijola R, Simell O, Knip M and Virtanen 2544
SM, 2010. Food consumption and nutrient intake in Finnish 1-6-year-old children. Public Health 2545
Nutrition, 13, 947-956. 2546
Larsson G, Milsom I, Lindstedt G and Rybo G, 1992. The influence of a low-dose combined oral 2547
contraceptive on menstrual blood loss and iron status. Contraception, 46, 327-334. 2548
Laurson KR, Eisenmann JC and Welk GJ, 2011. Development of youth percent body fat standards 2549
using receiver operating characteristic curves. American Journal of Preventive Medicine, 41, S93-2550
99. 2551
Layrisse M, Cook JD, Martinez C, Roche M, Kuhn IN, Walker RB and Finch CA, 1969. Food iron 2552
absorption: a comparison of vegetable and animal foods. Blood, 33, 430-443. 2553
Lennox A, Sommerville J, Ong K, Henderson H and R A (Department of Health/Food Standards 2554
Agency), 2013. Diet and nutrition survey of infants and young children, 2011. 108 pp. 2555
Leong WI and Lonnerdal B, 2005. Iron transporters in rat mammary gland: effects of different stages 2556
of lactation and maternal iron status. American Journal of Clinical Nutrition, 81, 445-453. 2557
Lind T, Lonnerdal B, Persson LA, Stenlund H, Tennefors C and Hernell O, 2003. Effects of weaning 2558
cereals with different phytate contents on hemoglobin, iron stores, and serum zinc: a randomized 2559
intervention in infants from 6 to 12 mo of age. American Journal of Clinical Nutrition, 78, 168-2560
175. 2561
Lonnerdal B, 2007. Trace element transport in the mammary gland. Annual Review of Nutrition, 27, 2562
165-177. 2563
Lonnerdal B, 2010. Calcium and iron absorption--mechanisms and public health relevance. 2564
International Journal for Vitamin and Nutrition Research, 80, 293-299. 2565
Lynch MF, Griffin IJ, Hawthorne KM, Chen Z, Hamzo MG and Abrams SA, 2007. Iron absorption is 2566
more closely related to iron status than to daily iron intake in 12- to 48-mo-old children. Journal of 2567
Nutrition, 137, 88-92. 2568
Lynch SR, Hurrell RF, Dassenko SA and Cook JD, 1989. The effect of dietary proteins on iron 2569
bioavailability in man. Advances in Experimental Medicine and Biology, 249, 117-132. 2570
Lynch SR, Dassenko SA, Cook JD, Juillerat MA and Hurrell RF, 1994. Inhibitory Effect of a 2571
Soybean-Protein Related Moiety on Iron-Absorption in Humans. American Journal of Clinical 2572
Nutrition, 60, 567-572. 2573
Lynch SR and Baynes RD, 1996. Deliberations and evaluations of the approaches, endpoints and 2574
paradigms for iron dietary recommendations. Journal of Nutrition, 126, 2404S-2409S. 2575
Lynch SR, 1997. Interaction of iron with other nutrients. Nutrition Reviews, 55, 102-110. 2576
Magnusson B, Bjorn-Rassmussen E, Hallberg L and Rossander L, 1981. Iron absorption in relation to 2577
iron status. Model proposed to express results to food iron absorption measurements. Scandinavian 2578
Journal of Haematology, 27, 201-208. 2579
Makrides M, Leeson R, Gibson R and Simmer K, 1998. A randomized controlled clinical trial of 2580
increased dietary iron in breast-fed infants. Journal of Pediatrics, 133, 559-562. 2581
Martinez-Torres C, Leets I, Taylor P, Ramirez J, del Valle Camacho M and Layrisse M, 1986. Heme, 2582
ferritin and vegetable iron absorption in humans from meals denatured of heme iron during the 2583
cooking of beef. Journal of Nutrition, 116, 1720-1725. 2584
Mast AE, Blinder MA, Lu Q, Flax S and Dietzen DJ, 2002. Clinical utility of the reticulocyte 2585
hemoglobin content in the diagnosis of iron deficiency. Blood, 99, 1489-1491. 2586
McArdle HJ, Gambling L and Kennedy C, 2014. Iron deficiency during pregnancy: the consequences 2587
for placental function and fetal outcome. Proceedings of the Nutrition Society, 73, 9-15. 2588

Draft Dietary Reference Values for iron
EFSA Journal 20YY;volume(issue):NNNN 63
McCann JC and Ames BN, 2007. An overview of evidence for a causal relation between iron 2589
deficiency during development and deficits in cognitive or behavioral function. American Journal 2590
of Clinical Nutrition, 85, 931-945. 2591
Mensink GB, Heseker H, Richter A, Stahl A and Vohmann C (Robert Koch-Institut & Universität 2592
Paderborn), 2007. Ernährungsstudie als KIGGS-Modul (EsKiMo). 143 pp. 2593
Michelazzo FB, Oliveira JM, Stefanello J, Luzia LA and Rondo PH, 2013. The influence of vitamin A 2594
supplementation on iron status. Nutrients, 5, 4399-4413. 2595
Milman N, Ulrik CS, Graudal N and Jordal R, 1997. Iron status in young Danes. Evaluation by serum 2596
ferritin and haemoglobin in a population survey of 634 individuals aged 14-23 yr. European 2597
Journal of Haematology, 58, 160-166. 2598
Milman N, Rosenstock S, Andersen L, Jorgensen T and Bonnevie O, 1998. Serum ferritin, 2599
hemoglobin, and Helicobacter pylori infection: a seroepidemiologic survey comprising 2794 2600
Danish adults. Gastroenterology, 115, 268-274. 2601
Milman N, 2006. Iron and pregnancy--a delicate balance. Annals of Hematology, 85, 559-565. 2602
Milman N, 2011. Iron in pregnancy: How do we secure an appropriate iron status in the mother and 2603
child? Annals of Nutrition and Metabolism, 59, 50-54. 2604
Milsom I, Andersson K, Jonasson K, Lindstedt G and Rybo G, 1995. The influence of the Gyne-T 2605
380S IUD on menstrual blood loss and iron status. Contraception, 52, 175-179. 2606
Montalbetti N, Simonin A, Kovacs G and Hediger MA, 2013. Mammalian iron transporters: families 2607
SLC11 and SLC40. Molecular Aspects of Medicine, 34, 270-287. 2608
Morabia A and Costanza MC, 1998. International variability in ages at menarche, first livebirth, and 2609
menopause. World Health Organization Collaborative Study of Neoplasia and Steroid 2610
Contraceptives. American Journal of Epidemiology, 148, 1195-1205. 2611
Nelson RL, Persky V, Davis F and Becker E, 2001. Is hereditary hemochromatosis a balanced 2612
polymorphism: an analysis of family size among hemochromatosis heterozygotes. Hepato-2613
Gastroenterology, 48, 523-526. 2614
Netherlands Food and Nutrition Council, 1992. Recommended dietary allowances 1989 in the 2615
Netherlands. 115 pp. 2616
Niinikoski H, Koskinen P, Punnonen K, Seppanen R, Viikari J, Ronnemaa T, Irjala K and Simell O, 2617
1997. Intake and indicators of iron and zinc status in children consuming diets low in saturated fat 2618
and cholesterol: the STRIP baby study. Special Turku Coronary Risk Factor Intervention Project 2619
for Babies. American Journal of Clinical Nutrition, 66, 569-574. 2620
Nilsson L and Solvell L, 1967. Clinical studies on oral contraceptives--a randomized, doubleblind, 2621
crossover study of 4 different preparations (Anovlar mite, Lyndiol mite, Ovulen, and Volidan). 2622
Acta Obstetricia et Gynecologica Scandinavica, 46, Suppl 8:1-31. 2623
Nordic Council of Ministers, 2004. Nordic Nutrition Recommendations 2004. Integrating nutrition 2624
and physical activity. 435 pp. 2625
Nordic Council of Ministers, 2014. Nordic Nutrition Recommendations 2012. Integrating nutrition 2626
and physical activity. 627 pp. 2627
Olivares M, Pizarro F, Ruz M and de Romana DL, 2012. Acute inhibition of iron bioavailability by 2628
zinc: studies in humans. Biometals, 25, 657-664. 2629
Oliveira JM, Michelazzo FB, Stefanello J and Rondo PH, 2008. Influence of iron on vitamin A 2630
nutritional status. Nutrition Reviews, 66, 141-147. 2631
Oski FA, 1993. Iron deficiency in infancy and childhood. New England Journal of Medicine, 329, 2632
190-193. 2633

Draft Dietary Reference Values for iron
EFSA Journal 20YY;volume(issue):NNNN 64
Pakarinen M, Raitanen J, Kaaja R and Luoto R, 2010. Secular trend in the menopausal age in Finland 2634
1997-2007 and correlation with socioeconomic, reproductive and lifestyle factors. Maturitas, 66, 2635
417-422. 2636
Paul AA, Black AE, Evans J, Cole TJ and Whitehead RG, 1988. Breastmilk intake and growth in 2637
infants from two to ten months. Journal of Human Nutrition and Dietetics, 1, 437-450. 2638
Pavord S, Myers B, Robinson S, Allard S, Strong J, Oppenheimer C and British Committee for 2639
Standards in H, 2012. UK guidelines on the management of iron deficiency in pregnancy. British 2640
Journal of Haematology, 156, 588-600. 2641
Picciano MF and Guthrie HA, 1976. Copper, iron, and zinc contents of mature human milk. American 2642
Journal of Clinical Nutrition, 29, 242-254. 2643
Picciano MF, 2001. Representative values for constituents of human milk. Pediatric Clinics of North 2644
America, 48, 263-264. 2645
Picciano MF and McDonald SS, 2005. Lactation. In: Modern Nutrition in Health and Disease. Eds 2646
Shils ME, Shike M, Olson J and Ross AC. Lippincott Williams and Wilkins, Philadelphia, USA, 2647
784-796. 2648
Pietrangelo A, 2010. Hereditary hemochromatosis: pathogenesis, diagnosis, and treatment. 2649
Gastroenterology, 139, 393-408, 408 e391-392. 2650
Pourkhalili A, Mirlohi M and Rahimi E, 2013. Heme iron content in lamb meat is differentially 2651
altered upon boiling, grilling, or frying as assessed by four distinct analytical methods. Scientific 2652
World Journal. 2653
Powers HJ, 2003. Riboflavin (vitamin B-2) and health. American Journal of Clinical Nutrition, 77, 2654
1352-1360. 2655
Ramsey P, 1980. Exact Type I Error Rates for Robustness of Student’s Test with Unequal Variances. 2656
Journal of Educational Statistics, 5, 337-349. 2657
Raper NR, Rosenthal JC and Woteki CE, 1984. Estimates of available iron in diets of individuals 1 2658
year old and older in the Nationwide Food Consumption Survey. Journal of the American Dietetic 2659
Association, 84, 783-787. 2660
Reddy MB and Cook JD, 1997. Effect of calcium intake on nonheme-iron absorption from a complete 2661
diet. American Journal of Clinical Nutrition, 65, 1820-1825. 2662
Reddy MB, Hurrell RF and Cook JD, 2000. Estimation of nonheme-iron bioavailability from meal 2663
composition. American Journal of Clinical Nutrition, 71, 937-943. 2664
Reddy MB, Hurrell RF and Cook JD, 2006. Meat consumption in a varied diet marginally influences 2665
nonheme iron absorption in normal individuals. Journal of Nutrition, 136, 576-581. 2666
Richardson DR, Lane DJ, Becker EM, Huang ML, Whitnall M, Suryo Rahmanto Y, Sheftel AD and 2667
Ponka P, 2010. Mitochondrial iron trafficking and the integration of iron metabolism between the 2668
mitochondrion and cytosol. Proceedings of the National Academy of Sciences of the United States 2669
of America, 107, 10775-10782. 2670
Rickard AP, Chatfield MD, Conway RE, Stephen AM and Powell JJ, 2009. An algorithm to assess 2671
intestinal iron availability for use in dietary surveys. British Journal of Nutrition, 102, 1678-1685. 2672
Roe MA, Heath AL, Oyston SL, Macrow C, Hoogewerff JA, Foxall R, Dainty JR, Majsak-Newman 2673
G, Willis G and Fairweather-Tait SJ, 2005. Iron absorption in male C282Y heterozygotes. 2674
American Journal of Clinical Nutrition, 81, 814-821. 2675
Roe MA, Bell S, Oseredczuk M, Christensen T, Westenbrink S, Pakkala H, Presser K and Finglas 2676
PM, 2013. Updated food composition database for nutrient intake. Supporting Publications 2677
2013:EN-355, 21 pp. 2678

Draft Dietary Reference Values for iron
EFSA Journal 20YY;volume(issue):NNNN 65
Rossander-Hulten L, Brune M, Sandstrom B, Lonnerdal B and Hallberg L, 1991. Competitive 2679
inhibition of iron absorption by manganese and zinc in humans. American Journal of Clinical 2680
Nutrition, 54, 152-156. 2681
Rossander-Hulthén L and Hallberg L, 1996. Prevalence of iron deficiency in adolescents. In: Iron 2682
nutrition in health and disease. Eds Hallberg L and Asp NG. John Libbey, London, UK, 149-156. 2683
SACN (Scientific Advisory Committee on Nutrition), 2010. Iron and health. The Stationery Office, 2684
London, 373 pp. 2685
San Martin CD, Garri C, Pizarro F, Walter T, Theil EC and Nunez MT, 2008. Caco-2 intestinal 2686
epithelial cells absorb soybean ferritin by mu(2) (AP2)-dependent endocytosis. Journal of 2687
Nutrition, 138, 659-666. 2688
SCF (Scientific Committe on Food), 1993. Report on nutrient and energy intakes for the European 2689
Community, 31st Series. Food - Science and Technique, European Commission, 255 pp. 2690
SCF (Scientific Committee on Food), 2003. Report of the Scientific Committee on Food on the 2691
Revision of Essential Requirements of Infant Formulae and Follow-on Formulae. 211 pp. 2692
Scheers N, 2013. Regulatory effects of Cu, Zn, and Ca on Fe absorption: the intricate play between 2693
nutrient transporters. Nutrients, 5, 957-970. 2694
Schlaphoff D and Johnston FA, 1949. The iron requirement of six adolescent girls. Journal of 2695
Nutrition, 39, 67-82. 2696
Sette S, Le Donne C, Piccinelli R, Arcella D, Turrini A and Leclercq C, 2011. The third Italian 2697
National Food Consumption Survey, INRAN-SCAI 2005-06 - Part 1: Nutrient intakes in Italy. 2698
Nutrition, Metabolism and Cardiovascular Diseases, 21, 922-932. 2699
Shayeghi M, Latunde-Dada GO, Oakhill JS, Laftah AH, Takeuchi K, Halliday N, Khan Y, Warley A, 2700
McCann FE, Hider RC, Frazer DM, Anderson GJ, Vulpe CD, Simpson RJ and McKie AT, 2005. 2701
Identification of an intestinal heme transporter. Cell, 122, 789-801. 2702
Sigman M and Lonnerdal B, 1990. Relationship of milk iron and the changing concentration of 2703
mammary tissue transferrin receptors during the course of lactation. The Journal of Nutritional 2704
Biochemistry, 1, 572-576. 2705
Siimes MA, Vuori E and Kuitunen P, 1979. Breast milk iron--a declining concentration during the 2706
course of lactation. Acta Paediatrica Scandinavica, 68, 29-31. 2707
Skinner JD, Carruth BR, Houck KS, Coletta F, Cotter R, Ott D and McLeod M, 1997. Longitudinal 2708
study of nutrient and food intakes of infants aged 2 to 24 months. Journal of the American Dietetic 2709
Association, 97, 496-504. 2710
Skouby SO, 2010. Contraceptive use and behavior in the 21st century: a comprehensive study across 2711
five European countries. European Journal of Contraception and Reproductive Health Care, 15 2712
Suppl 2, S42-53. 2713
Smith NJ and Rios E, 1974. Iron metabolism and iron deficiency in infancy and childhood. Advances 2714
in Pediatrics, 21, 239-280. 2715
Steketee RW, 2003. Pregnancy, nutrition and parasitic diseases. Journal of Nutrition, 133, 1661S-2716
1667S. 2717
Storcksdieck genannt Bonsmann S and Hurrell RF, 2007. Iron-binding properties, amino acid 2718
composition, and structure of muscle tissue peptides from in vitro digestion of different meat 2719
sources. Journal of Food Science, 72, S019-029. 2720
Svanberg B, Arvidsson B, Bjorn-Rasmussen E, Hallberg L, Rossander L and Swolin B, 1975. Dietary 2721
iron absorption in pregnancy - a longitudinal study with repeated measurements of non-haeme iron 2722

Draft Dietary Reference Values for iron
EFSA Journal 20YY;volume(issue):NNNN 66
absorption from whole diet. Acta Obstetricia et Gynecologica Scandinavica. Supplement, 48, 43-2723
68. 2724
Tanner JM, Whitehouse RH and Takaishi M, 1966a. Standards from birth to maturity for height, 2725
weight, height velocity, and weight velocity: British children, 1965. II. Archives of Disease in 2726
Childhood, 41, 613-635. 2727
Tanner JM, Whitehouse RH and Takaishi M, 1966b. Standards from birth to maturity for height, 2728
weight, height velocity, and weight velocity: British children, 1965. I. Archives of Disease in 2729
Childhood, 41, 454-471. 2730
Taylor PG, Martinez-Torres C, Romano EL and Layrisse M, 1986. The effect of cysteine-containing 2731
peptides released during meat digestion on iron absorption in humans. American Journal of 2732
Clinical Nutrition, 43, 68-71. 2733
Thane CW, Bates CJ and Prentice A, 2003. Risk factors for low iron intake and poor iron status in a 2734
national sample of British young people aged 4-18 years. Public Health Nutrition, 6, 485-496. 2735
Thompson BA, Sharp PA, Elliott R and Fairweather-Tait SJ, 2010. Inhibitory effect of calcium on 2736
non-heme iron absorption may be related to translocation of DMT-1 at the apical membrane of 2737
enterocytes. Journal of Agricultural and Food Chemistry, 58, 8414-8417. 2738
Thorisdottir AV, Thorsdottir I and Palsson GI, 2011. Nutrition and Iron Status of 1-Year Olds 2739
following a Revision in Infant Dietary Recommendations. Anemia, 2011, 986303. 2740
Troadec MB, Ward DM, Lo E, Kaplan J and De Domenico I, 2010. Induction of FPN1 transcription 2741
by MTF-1 reveals a role for ferroportin in transition metal efflux. Blood, 116, 4657-4664. 2742
Troesch B, Egli I, Zeder C, Hurrell RF, de Pee S and Zimmermann MB, 2009. Optimization of a 2743
phytase-containing micronutrient powder with low amounts of highly bioavailable iron for in-2744
home fortification of complementary foods. American Journal of Clinical Nutrition, 89, 539-544. 2745
Tuderman L, Myllyla R and Kivirikko KI, 1977. Mechanism of the prolyl hydroxylase reaction. 1. 2746
Role of co-substrates. European Journal of Biochemistry, 80, 341-348. 2747
Ullrich C, Wu A, Armsby C, Rieber S, Wingerter S, Brugnara C, Shapiro D and Bernstein H, 2005. 2748
Screening healthy infants for iron deficiency using reticulocyte hemoglobin content. The Journal 2749
of the American Medical Association, 294, 924-930. 2750
UNICEF/UNU/WHO (United Nations Children’s Fund, United Nations University, World Health 2751
Organization), 2001. Iron deficiency anaemia: assessment, prevention and control. A guide for 2752
programme managers. WHO/NHD/013, 114 pp. 2753
van Buuren S, Schönbeck Y and van Dommelen P, 2012. Collection, collation and analysis of data in 2754
relation to reference heights and reference weights for female and male children and adolescents 2755
(0-18 years) in the EU, as well as in relation to the age of onset of puberty and the age at which 2756
different stages of puberty are reached in adolescents in the EU. Project developed on the 2757
procurement project CT/EFSA/NDA/2010/01. 59 pp. 2758
van Rossum CTM, Fransen HP, Verkaik-Kloosterman J, Buurma-Rethans EJM and Ocké MC, 2011. 2759
Dutch National Food Consumption Survey 2007-2010: Diet of children and adults aged 7 to 69 2760
years. RIVM Report number: 350050006/2011, National Institute for Public Health and the 2761
Environment, 143 pp. 2762
Vink EE, van Coeverden SC, van Mil EG, Felius BA, van Leerdam FJ and Delemarre-van de Waal 2763
HA, 2010. Changes and tracking of fat mass in pubertal girls. Obesity (Silver Spring), 18, 1247-2764
1251. 2765
Vucic V, Berti C, Vollhardt C, Fekete K, Cetin I, Koletzko B, Gurinovic M and van't Veer P, 2013. 2766
Effect of iron intervention on growth during gestation, infancy, childhood, and adolescence: a 2767
systematic review with meta-analysis. Nutrition Reviews, 71, 386-401. 2768

Draft Dietary Reference Values for iron
EFSA Journal 20YY;volume(issue):NNNN 67
Vuori E, 1979. Intake of copper, iron, manganese and zinc by healthy, exclusively-breast-fed infants 2769
during the first 3 months of life. British Journal of Nutrition, 42, 407-411. 2770
Walters GO, Miller FM and Worwood M, 1973. Serum ferritin concentration and iron stores in 2771
normal subjects. Journal of Clinical Pathology, 26, 770-772. 2772
Wang J and Pantopoulos K, 2011. Regulation of cellular iron metabolism. Biochemical Journal, 434, 2773
365-381. 2774
Warner PE, Critchley HO, Lumsden MA, Campbell-Brown M, Douglas A and Murray GD, 2004. 2775
Menorrhagia II: is the 80-mL blood loss criterion useful in management of complaint of 2776
menorrhagia? American Journal of Obstetrics and Gynecology, 190, 1224-1229. 2777
Weaver CM and Rajaram S, 1992. Exercise and iron status. Journal of Nutrition, 122, 782-787. 2778
West AR and Oates PS, 2008. Mechanisms of heme iron absorption: current questions and 2779
controversies. World Journal of Gastroenterology, 14, 4101-4110. 2780
Whitlock EP, Garlitz BA, Harris EL, Beil TL and Smith PR, 2006. Screening for hereditary 2781
hemochromatosis: a systematic review for the U.S. Preventive Services Task Force. Annals of 2782
Internal Medicine, 145, 209-223. 2783
Whittaker PG, Lind T and Williams JG, 1991. Iron absorption during normal human pregnancy: a 2784
study using stable isotopes. British Journal of Nutrition, 65, 457-463. 2785
Whittaker PG, Barrett JF and Lind T, 2001. The erythrocyte incorporation of absorbed non-haem iron 2786
in pregnant women. British Journal of Nutrition, 86, 323-329. 2787
WHO Multicentre Growth Reference Study Group (World Health Organization), 2006. WHO Child 2788
Growth Standards: Length/height-for-age, weight-for-age, weight-for-length, weight-for-height and 2789
body mass index-for-age: Methods and development. 336 pp. 2790
WHO/FAO (World Health Organization/Food and Agriculture Organization), 2004. Vitamin and 2791
mineral requirements in human nutrition. Report of a Joint FAO/WHO Expert Consultation, 2792
Bangkok, Thailand, 21–30 September 1998. Geneva, 341 pp. 2793
Widdowson EM and Spray CM, 1951. Chemical development in utero. Archives of Disease in 2794
Childhood, 26, 205-214. 2795
Yamaji S, Tennant J, Tandy S, Williams M, Singh SK and Sharp P, 2001. Zinc regulates the function 2796
and expression of the iron transporters DMT1 and IREG1 in humna intestinal Caco-2 cells. FEBS 2797
Letters, 507, 137-141. 2798
Ye H and Rouault TA, 2010. Human iron-sulfur cluster assembly, cellular iron homeostasis, and 2799
disease. Biochemistry, 49, 4945-4956. 2800
Young MF, Griffin I, Pressman E, McIntyre AW, Cooper E, McNanley T, Harris ZL, Westerman M 2801
and O'Brien KO, 2010. Utilization of iron from an animal-based iron source is greater than that of 2802
ferrous sulfate in pregnant and nonpregnant women. Journal of Nutrition, 140, 2162-2166. 2803
Zimmermann MB, 2008. Methods to assess iron and iodine status. British Journal of Nutrition, 99 2804
(Suppl 3), S2-9. 2805
2806
2807
2808

Draft Dietary Reference Values for iron
EFSA Journal 20YY;volume(issue):NNNN 68
APPENDICES 2809
Appendix A. Cut-off values for biochemical indicators of iron deficiency proposed in the 2810
literature 2811
Table 10: Cut-off values for haemoglobin concentration (UNICEF/UNU/WHO, 2001) and other 2812
biomarkers of iron status that indicate the presence of anaemia (a)
(Zimmermann, 2008) 2813
Population group Hb
(g/L)
Haematocrit
(%)
ZPP
(µmol/mol
haem)
MCV
(fl)
Serum iron
(µg/L)
TSAT
(%)
6–59 months < 110 0.33 < 40–50
5–11 years < 115 0.34 > 40
< 40–50
12–14 years < 120 0.36 > 40 < 82 < 40–50 < 15 %
Women < 120 0.36 > 40 < 82 < 40–50 < 15 %
Pregnant women < 110 0.33
Men > 15 years < 130 0.39 > 40 < 82 < 40–50 < 15 %
(a): At altitudes < 1 000 m; Hb, haemoglobin; MCV, mean corpuscular volume; TSAT, transferrin saturation; ZPP, 2814 erythrocyte zinc protoporphyrin 2815
Table 11: Definition of anaemia according to the UK guidelines on the management of iron 2816
deficiency in pregnancy (Pavord et al., 2012) 2817
Timepoint Haemoglobin (g/L)
1st trimester < 110
2nd
trimester < 105
3rd
trimester < 105
Post partum < 100
The guidelines also state that non-anaemic women identified to be at increased risk of iron deficiency should have their 2818 serum ferritin concentration checked early in pregnancy and be offered oral supplements if serum ferritin is <30 µg/L. 2819
Table 12: Cut-off values for serum ferritin concentration (UNICEF/UNU/WHO, 2001) 2820
Population group
< 5 years of age (a)
≥ 5 years of age
Serum ferritin (µg/L)
Severe risk of iron overload No cut-off > 200 (adult male)
> 150 (adult female)
Depleted iron stores in the presence of infection < 30 No cut-off
Depleted iron stores
< 12
< 15
(a): < 9 µg/L at 6 months and < 5 µg/L at 9 months (Domellof et al., 2002b) 2821
2822

Draft Dietary Reference Values for iron
EFSA Journal 20YY;volume(issue):NNNN 69
Appendix B. Percentiles of daily iron losses with menstruation based on individual data from 2823
Harvey et al. (2005) 2824
Percentile Menstrual iron losses (in mg/day)
5 0.03
10 0.07
15 0.09
20 0.11
25 0.13
30 0.17
35 0.19
40 0.21
45 0.23
50 0.26
55 0.29
60 0.36
65 0.41
70 0.48
75 0.59
80 0.69
85 0.82
90 0.91
95 1.32
97 1.51
98 1.92
Menstrual iron losses were quantified by the direct measurement of menstrual blood loss per menstrual cycle. Menstrual iron 2825 loss was subsequently calculated by Harvey et al. (2005) from the total menstrual blood loss of each participant based on the 2826 following equation: 2827 MIL (mg/day) = MBL (mL) × Hb (mg/mL) × 0.00334 2828 Cycle length 2829 Where MIL is menstrual iron loss, MBL is menstrual blood loss, and 0.00334 is equivalent to the fraction of iron in 2830 haemoglobin (Hb) at a concentration of 1 mg/mL. 2831

Draft Dietary Reference Values for iron
EFSA Journal 20YY;volume(issue):NNNN 70
Appendix C. Dietary surveys in the EFSA Comprehensive European Food Consumption Database included in the nutrient intake calculation and 2832
number of subjects in the different age classes 2833
Country Dietary survey (year) Year Method Days Age
(years)
Number of subjects (b)
Infants
1-11 mo
Children
1–< 3 y
Children
3–< 10 y
Children
10–< 18 y
Adults
18–< 65 y
Adults
65–< 75 y
Adults
≥ 75 y
Finland/1 DIPP 2000–2010 Dietary record 3 0.5–6 499 500 750
Finland/2 NWSSP 2007–2008 48-hour dietary recall (a) 2 × 2 (a) 13–15 306
Finland/3 FINDIET2012 2012 48-hour dietary recall (a) 2 (a) 25–74 1 295 413
France INCA2 2006–2007 Dietary record 7 3–79 482 973 2 276 264 84
Germany/1 EsKiMo 2006 Dietary record 3 6–11 835 393
Germany/2 VELS 2001–2002 Dietary record 6 < 1–4 158 347 299
Ireland NANS 2008–2010 Dietary record 4 18–90 1 274 149 77
Italy INRAN-SCAI 2005-06 2005–2006 Dietary record 3 < 1–98 16 (b) 36 (b) 193 247 2 313 290 228
Latvia FC_PREGNANTWOMEN
2011
2011 24-hour dietary recall 2 15–45 12 (b) 991 (c)
Netherlands DNFCS 2007–2010 24-hour dietary recall 2 7–69 447 1 142 2 057 173
Sweden RISKMATEN 2010–2011 Dietary records (Web) 4 18–80 1 430 295 72
UK/1 DNSIYC 2011 Dietary record 4 0.3–1.5 1 369 1 314
UK/2 NDNS-Rolling Programme
(1–3 y)
2008–2011 Dietary record 4 1-94 185 651 666 1 266 166 139
mo, months; y, years; DIPP, type 1 Diabetes Prediction and Prevention survey; DNFCS, Dutch National Food Consumption Survey; DNSIYC, Diet and Nutrition Survey of Infants and Young 2834 Children; EsKiMo, Ernährungsstudie als KIGGS-Modul; FINDIET, the national dietary survey of Finland; INCA, étude Individuelle Nationale de Consommations Alimentaires; INRAN-2835 SCAI, Istituto Nazionale di Ricerca per gli Alimenti e la Nutrizione – Studio sui Consumi Alimentari in Italia; FC_PREGNANTWOMEN, food consumption of pregnant women in Latvia; 2836 NANS, National Adult Nutrition Survey; NDNS, National Diet and Nutrition Survey; NWSSP, Nutrition and Wellbeing of Secondary School Pupils; VELS, Verzehrsstudie zur Ermittlung 2837 der Lebensmittelaufnahme von Säuglingen und Kleinkindern für die Abschätzung eines akuten Toxizitätsrisikos durch Rückstände von Pflanzenschutzmitteln. 2838
(a): A 48-hour dietary recall comprises two consecutive days. 2839 (b): 5th or 95th percentile intakes calculated from fewer than 60 subjects require cautious interpretations as the results may not be statistically robust (EFSA, 2011b) and, therefore, for these 2840
dietary surveys/age classes, the 5th and 95th percentile estimates will not be presented in the intake results. 2841 (c): One subject with only one 24-hour dietary recall day was excluded from the dataset, i.e. the final n = 990. 2842
2843

Draft Dietary Reference Values for iron
EFSA Journal 20YY;volume(issue):NNNN 71
Appendix D. Iron intake in males in different surveys according to age classes and country 2844
Age class Country Survey Intake expressed in mg/day Intake expressed in mg/MJ
n (a)
Average Median P5 P95 n Average Median P5 P95
Infants (b) Finland DIPP_2001_2009 84 6.0 5.9 3.2 9.4 84 1.9 1.9 1.0 3.0
Germany VELS 247 3.0 3.2 0.4 5.7 245 1.5 1.5 0.8 2.2
Italy INRAN_SCAI_2005_06 699 5.9 5.8 2.7 9.5 699 1.7 1.7 0.9 2.5
United Kingdom DNSIYC_2011 9 2.6 1.9 (c)
(c)
9 0.9 0.5 (c)
(c)
1 to < 3 Finland DIPP_2001_2009 174 7.0 6.5 3.6 11.4 174 1.5 1.4 1.0 2.2
Germany VELS 245 5.4 5.2 2.8 7.9 245 1.5 1.5 1.0 2.1
Italy INRAN_SCAI_2005_06 107 6.3 6.0 4.2 10.0 107 1.3 1.3 0.9 1.9
United Kingdom DNSIYC_2011 663 5.9 5.7 3.1 9.2 663 1.4 1.4 0.8 2.2
United Kingdom NDNS-RollingProgrammeYears1-3 20 6.0 6.2 (c)
(c)
20 1.2 1.1 (c)
(c)
3 to < 10 Finland DIPP_2001_2009 426 11.5 11.2 7.2 17.0 426 1.5 1.5 1.1 2.1
France INCA2 146 8.7 7.7 5.3 14.0 146 1.5 1.4 1.1 2.4
Germany EsKiMo 381 8.3 8.0 5.5 12.3 381 1.4 1.4 1.0 1.9
Germany VELS 239 10.7 10.2 5.7 17.3 239 1.7 1.6 1.1 2.4
Italy INRAN_SCAI_2005_06 326 8.6 8.3 5.1 12.6 326 1.4 1.3 1.0 1.9
Netherlands DNFCS 2007-2010 94 9.9 9.6 5.6 16.3 94 1.3 1.3 1.0 2.1
United Kingdom NDNS-RollingProgrammeYears1-3 231 9.2 9.0 5.6 13.3 231 1.1 1.0 0.8 1.5
10 to < 18 Finland NWSSP07_08 197 11.8 11.3 7.2 18.7 197 1.5 1.4 1.0 2.1
France INCA2 136 11.6 11.2 6.9 18.1 136 1.4 1.4 1.0 2.1
Germany EsKiMo 449 13.6 12.8 7.5 22.2 449 1.7 1.7 1.2 2.6
Italy INRAN_SCAI_2005_06 340 11.2 10.8 6.7 17.8 340 1.4 1.3 1.0 2.0
Netherlands DNFCS 2007-2010 108 12.3 11.8 7.4 18.2 108 1.3 1.2 1.0 1.9
United Kingdom NDNS-RollingProgrammeYears1-3 566 11.2 10.9 6.7 17.6 566 1.1 1.0 0.7 1.5
18 to < 65 Finland FINDIET2012 585 13.2 12.5 7.4 21.2 585 1.4 1.4 1.0 2.1
France INCA2 936 14.4 13.7 7.5 23.1 936 1.7 1.6 1.1 2.6
Ireland NANS_2012 560 12.8 12.3 6.6 20.1 560 1.5 1.4 0.9 2.1
Italy INRAN_SCAI_2005_06 634 14.7 14.3 8.3 22.2 634 1.5 1.5 1.0 2.1
Netherlands DNFCS 2007-2010 1068 12.6 12.2 7.1 19.8 1068 1.4 1.4 1.0 1.9
Sweden Riksmaten 2010 1023 13.1 12.7 7.7 19.4 1023 1.2 1.1 0.8 1.7
United Kingdom NDNS-RollingProgrammeYears1-3 623 14.1 13.4 7.8 22.3 623 1.4 1.4 1.0 2.0

Draft Dietary Reference Values for iron
EFSA Journal 20YY;volume(issue):NNNN 72
Age class Country Survey Intake expressed in mg/day Intake expressed in mg/MJ
n (a)
Average Median P5 P95 n Average Median P5 P95
65 to < 75 Finland FINDIET2012 210 11.9 11.4 6.6 18.8 210 1.5 1.4 0.9 2.1
France INCA2 111 15.0 14.3 7.6 24.5 111 1.8 1.6 1.2 2.7
Ireland NANS_2012 75 12.9 12.2 6.2 19.8 75 1.5 1.5 0.9 2.2
Italy INRAN_SCAI_2005_06 72 13.3 13.4 6.9 19.0 72 1.5 1.5 1.1 2.1
Netherlands DNFCS 2007-2010 133 13.3 12.8 7.0 19.4 133 1.5 1.5 1.1 2.1
Sweden Riksmaten 2010 91 12.1 11.8 6.2 18.3 91 1.3 1.3 1.0 1.7
United Kingdom NDNS-RollingProgrammeYears1-3 127 13.0 12.9 7.5 19.8 127 1.5 1.5 1.1 2.0
≥ 75 France INCA2 40 12.6 11.4 (c)
(c)
40 1.6 1.5 (c)
(c)
Ireland NANS_2012 56 10.8 9.7 (c)
(c)
56 1.5 1.5 (c)
(c)
Italy INRAN_SCAI_2005_06 34 11.4 10.1 (c)
(c)
34 1.5 1.5 (c)
(c)
Sweden Riksmaten 2010 69 12.6 12.0 7.8 18.6 69 1.4 1.4 1.0 2.0
United Kingdom NDNS-RollingProgrammeYears1-3 42 12.1 12.1 (c)
(c)
42 1.4 1.4 (c)
(c)
P5, 5th percentile; P95, 95th percentile; DIPP, type 1 Diabetes Prediction and Prevention survey; DNFCS, Dutch National Food Consumption Survey; DNSIYC, Diet and Nutrition Survey of 2845 Infants and Young Children; EsKiMo, Ernährungsstudie als KIGGS-Modul; FINDIET, the national dietary survey of Finland; INCA, étude Individuelle Nationale de Consommations 2846 Alimentaires; INRAN-SCAI, Istituto Nazionale di Ricerca per gli Alimenti e la Nutrizione - Studio sui Consumi Alimentari in Italia; FC_PREGNANTWOMEN, food consumption of 2847 pregnant women in Latvia; NANS, National Adult Nutrition Survey; NDNS, National Diet and Nutrition Survey; NWSSP, Nutrition and Wellbeing of Secondary School Pupils; VELS, 2848 Verzehrsstudie zur Ermittlung der Lebensmittelaufnahme von Säuglingen und Kleinkindern für die Abschätzung eines akuten Toxizitätsrisikos durch Rückstände von Pflanzenschutzmitteln. 2849
(a): Number of individuals in the population group. 2850 (b): The proportions of breast-fed infants were 58 % in the Finnish survey, 40 % in the German survey, 44 % in the Italian survey, and 21 % in the UK survey. Most infants were partly 2851
breastfed. For the Italian and German surveys, breast milk intake estimates were derived from the number of breastfeeding events recorded per day multiplied by standard breast milk 2852 amounts consumed on an eating occasion at different age. For the UK survey, the amount of breast milk consumed was either directly quantified by the mother (expressed breast milk) or 2853 extrapolated from the duration of each breastfeeding event. As no information on the breastfeeding events were reported in the Finnish survey, breast milk intake was not taken into 2854 consideration in the intake estimates of Finnish infants. 2855
(c): 5th or 95th percentile intakes calculated from fewer than 60 subjects require cautious interpretation as the results may not be statistically robust (EFSA, 2011b) and, therefore, for these dietary 2856 surveys/age classes, the 5th and 95th percentile estimates will not be presented in the intake results. 2857
2858

Draft Dietary Reference Values for iron
EFSA Journal 20YY;volume(issue):NNNN 73
Appendix E. Iron intake in females in different surveys according to age classes and country 2859
Age class Country Survey Intake expressed in mg/day Intake expressed in mg/MJ
n (a)
Average Median P5 P95 n Average Median P5 P95
Infants (b)
Finland DIPP_2001_2009 75 5.5 5.7 2.0 9.0 75 1.9 1.9 0.9 3.1
Germany VELS 252 2.8 2.5 0.4 5.7 251 1.6 1.5 0.9 2.6
Italy INRAN_SCAI_2005_06 670 5.2 5.0 2.0 8.3 670 1.7 1.7 0.8 2.5
United Kingdom DNSIYC_2011 7 3.5 4.1 (c)
(c)
7 1.2 1.1 (c)
(c)
1 to < 3 Finland DIPP_2001_2009 174 6.6 6.4 3.8 10.6 174 1.6 1.5 1.1 2.4
Germany VELS 255 5.0 5.0 2.8 7.6 255 1.5 1.4 0.9 2.0
Italy INRAN_SCAI_2005_06 78 6.1 5.8 2.9 10.0 78 1.3 1.3 0.7 1.8
United Kingdom DNSIYC_2011 651 5.7 5.4 2.8 9.6 651 1.4 1.4 0.9 2.2
United Kingdom NDNS-RollingProgrammeYears1-3 16 6.0 5.4 (c)
(c)
16 1.3 1.2 (c)
(c)
3 to < 10 Finland DIPP_2001_2009 409 10.6 10.3 6.5 16.3 409 1.6 1.5 1.1 2.1
France INCA2 147 7.8 7.4 4.7 12.9 147 1.5 1.4 1.0 2.5
Germany EsKiMo 369 7.5 7.3 4.7 11.0 369 1.4 1.4 1.0 2.0
Germany VELS 243 9.5 8.9 5.7 15.1 243 1.7 1.6 1.2 2.4
Italy INRAN_SCAI_2005_06 325 8.5 7.9 4.7 13.7 325 1.4 1.3 0.9 2.1
Netherlands DNFCS 2007-2010 99 9.1 9.2 5.1 13.4 99 1.2 1.2 0.9 1.7
United Kingdom NDNS-RollingProgrammeYears1-3 216 8.8 8.4 5.5 13.1 216 1.1 1.1 0.8 1.4
10 to < 18 Finland NWSSP07_08 196 11.6 11.2 7.5 17.3 196 1.6 1.5 1.1 2.1
France INCA2 170 9.9 9.4 5.7 16.1 170 1.5 1.5 1.1 2.1
Germany EsKiMo 524 10.9 10.3 5.8 17.2 524 1.7 1.7 1.2 2.6
Italy INRAN_SCAI_2005_06 326 9.2 8.9 5.0 13.6 326 1.4 1.3 0.9 2.0
Latvia (d) FC_PREGNANTWOMEN_2011 139 10.5 10.2 6.2 16.9 139 1.3 1.2 0.9 2.1
Netherlands DNFCS 2007-2010 12 14.7 15.3 (c)
(c)
12 1.5 1.5 (c)
(c)
United Kingdom NDNS-RollingProgrammeYears1-3 576 9.6 9.2 6.0 14.6 576 1.1 1.1 0.7 1.6
18 to < 65 Finland FINDIET2012 710 10.5 10.3 6.0 16.0 710 1.5 1.4 1.0 2.1
France INCA2 1340 11.1 10.5 5.7 18.3 1340 1.7 1.6 1.1 2.6
Ireland NANS_2012 706 10.5 10.2 5.4 16.1 706 1.6 1.5 1.0 2.4
Italy INRAN_SCAI_2005_06 640 11.0 10.7 6.1 17.6 640 1.5 1.5 1.0 2.1
Latvia (d) FC_PREGNANTWOMEN_2011 1245 10.2 9.9 5.7 15.8 1245 1.4 1.3 1.0 2.0
Netherlands DNFCS 2007-2010 990 17.9 15.2 8.8 34.9 990 2.1 1.8 1.1 4.1
Sweden Riksmaten 2010 1034 11.0 10.4 6.6 16.7 1034 1.3 1.3 0.9 2.0
United Kingdom NDNS-RollingProgrammeYears1-3 807 11.6 11.1 6.2 18.6 807 1.5 1.5 1.0 2.2

Draft Dietary Reference Values for iron
EFSA Journal 20YY;volume(issue):NNNN 74
Age class Country Survey Intake expressed in mg/day Intake expressed in mg/MJ
n (a)
Average Median P5 P95 n Average Median P5 P95
65 to < 75 Finland FINDIET2012 203 9.4 9.0 5.4 14.7 203 1.5 1.5 1.1 2.3
France INCA2 153 10.6 10.1 6.2 16.9 153 1.7 1.6 1.2 2.5
Ireland NANS_2012 91 10.7 10.7 6.3 17.5 91 1.8 1.6 1.2 2.8
Italy INRAN_SCAI_2005_06 77 11.0 11.2 6.7 16.7 77 1.6 1.6 1.1 2.5
Netherlands DNFCS 2007-2010 157 10.1 10.0 5.7 16.7 157 1.5 1.4 1.0 2.1
Sweden Riksmaten 2010 82 10.7 10.6 6.2 16.2 82 1.5 1.4 1.1 2.0
United Kingdom NDNS-RollingProgrammeYears1-3 168 11.1 10.7 6.4 17.6 168 1.6 1.6 1.1 2.3
≥ 75 France INCA2 44 9.9 9.7 (c)
(c)
44 1.6 1.6 (c)
(c)
Ireland NANS_2012 83 10.5 9.8 6.3 16.0 83 1.7 1.6 1.2 2.4
Italy INRAN_SCAI_2005_06 43 10.5 10.5 (c)
(c)
43 1.7 1.6 (c)
(c)
Sweden Riksmaten 2010 159 9.6 9.3 5.8 14.1 159 1.4 1.4 1.0 2.0
United Kingdom NDNS-RollingProgrammeYears1-3 30 10.3 9.7 (c)
(c)
30 1.5 1.4 (c)
(c)
P5, 5th percentile; P95, 95th percentile; DIPP, type 1 Diabetes Prediction and Prevention survey; DNFCS, Dutch National Food Consumption Survey; DNSIYC, Diet and Nutrition Survey of 2860 Infants and Young Children; EsKiMo, Ernährungsstudie als KIGGS-Modul; FINDIET, the national dietary survey of Finland; INCA, étude Individuelle Nationale de Consommations 2861 Alimentaires; INRAN-SCAI, Istituto Nazionale di Ricerca per gli Alimenti e la Nutrizione - Studio sui Consumi Alimentari in Italia; FC_PREGNANTWOMEN, food consumption of 2862 pregnant women in Latvia; NANS, National Adult Nutrition Survey; NDNS, National Diet and Nutrition Survey; NWSSP, Nutrition and Wellbeing of Secondary School Pupils; VELS, 2863 Verzehrsstudie zur Ermittlung der Lebensmittelaufnahme von Säuglingen und Kleinkindern für die Abschätzung eines akuten Toxizitätsrisikos durch Rückstände von Pflanzenschutzmitteln. 2864
(a): Number of individuals in the population group. 2865 (b): The proportions of breast-fed infants were 58 % in the Finnish survey, 40 % in the German survey, 44 % in the Italian survey, and 21 % in the UK survey. Most infants were partially 2866
breastfed. For the Italian and German surveys, breast milk intake estimates were derived from the number of breastfeeding events recorded per day multiplied by standard breast milk 2867 amounts consumed on an eating occasion at different age. For the UK survey, the amount of breast milk consumed was either directly quantified by the mother (expressed breast milk) or 2868 extrapolated from the duration of each breastfeeding event. As no information on the breastfeeding events were reported in the Finnish survey, breast milk intake was not taken into 2869 consideration in the intake estimates of Finnish infants. 2870
(c): 5th or 95th percentile intakes calculated from fewer than 60 subjects require cautious interpretation as the results may not be statistically robust (EFSA, 2011b) and, therefore, for these dietary 2871 surveys/age classes, the 5th and 95th percentile estimates will not be presented in the intake results. 2872
(d): Pregnant women only. 2873 2874

Draft Dietary Reference Values for iron
EFSA Journal 20YY;volume(issue):NNNN 75
Appendix F. Minimum and maximum % contribution of different food groups to iron intake in males 2875
Food groups Age (years)
< 1 1 to < 3 3 to < 10 10 to < 18 18 to < 65 65 to < 75 ≥ 75
Additives, flavours, baking and processing aids <1 <1 0 <1–1 <1 <1 0
Alcoholic beverages <1 <1 <1 <1 2–9 2–13 3–13
Animal and vegetable fats and oils <1 <1–1 <1–1 <1–1 <1–1 <1–1 <1–1
Coffee, cocoa, tea and infusions <1–1 <1–8 2–14 3–8 1–9 1–11 1–7
Composite dishes <1–3 <1–11 <1–11 1–14 1–14 1–12 <1–14
Eggs and egg products <1–1 1–2 1–4 1–4 1–3 1–3 1–3
Fish, seafood, amphibians, reptiles and invertebrates <1 <1–6 <1–6 1–5 1–6 2–6 2–5
Food products for young population 44–67 4–22 <1–1 <1 <1 – –
Fruit and fruit products 3–9 5–9 2–5 1–4 1–5 3–6 2–6
Fruit and vegetable juices and nectars <1–2 1–5 1–8 1–6 1–4 <1–4 <1–3
Grains and grain-based products 10–18 32–38 31–42 31–40 25–42 21–43 20–49
Human milk <1–15 <1–1 – – – – –
Legumes, nuts, oilseeds and spices 1–3 1–7 1–7 1–6 2–7 2–7 2–5
Meat and meat products <1–7 5–14 6–19 9–24 11–27 11–27 11–21
Milk and dairy products 1–4 4–8 3–7 2–6 1–4 1–4 1–3
Products for non-standard diets, food imitates and food supplements or fortifying agents 0 0 0–1 <1–1 <1–1 <1 0
Seasoning, sauces and condiments <1–1 <1–4 <1–2 <1–2 <1–2 <1–2 <1–1
Starchy roots or tubers and products thereof, sugar plants <1–10 2–10 3–8 4–10 3–8 3–10 4–9
Sugar, confectionery and water-based sweet desserts <1 1–6 2–8 2–9 1–4 1–3 <1–3
Vegetables and vegetable products 1–7 4–7 4–9 4–12 3–14 3–15 4–13
Water and water-based beverages <1–1 <1–9 <1–10 <1–9 <1–4 <1–2 <1–2
“–” means that there was no consumption event of the food group for the age and sex group considered, whereas “0” means that there were some consumption events, but that the food group 2876 does not contribute to the intake of the nutrient considered, for the age and sex group considered. 2877
2878

Draft Dietary Reference Values for iron
EFSA Journal 20YY;volume(issue):NNNN 76
Appendix G. Minimum and maximum % contribution of different food groups to iron intake in females 2879
Food groups Age (years)
< 1 1 to < 3 3 to < 10 10 to < 18 18 to < 65 65 to < 75 ≥ 75
Additives, flavours, baking and processing aids <1 0 0 <1–1 <1 0 0
Alcoholic beverages <1 <1 <1 <1 <1–6 1–6 2–5
Animal and vegetable fats and oils <1 <1–1 <1–1 <1–1 <1–1 <1–1 <1–1
Coffee, cocoa, tea and infusions <1–1 <1–10 1–13 2–11 2–10 1–11 2–11
Composite dishes <1–2 <1–11 <1–11 <1–15 1–14 1–12 1–13
Eggs and egg products <1–1 1–2 1–4 1–3 1–3 1–3 1–3
Fish, seafood, amphibians, reptiles and invertebrates <1–1 <1–5 <1–4 <1–8 1–6 2–5 1–4
Food products for young population 45–72 4–22 <1–1 <1 <1 – <1
Fruit and fruit products 3–8 5–6 2–5 2–6 2–6 4–8 3–8
Fruit and vegetable juices and nectars <1–2 1–4 2–7 2–6 1–4 1–3 1–3
Grains and grain-based products 9–19 31–42 31–39 31–42 26–48 20–43 19–47
Human milk <1–5 <1 – – – – –
Legumes, nuts, oilseeds and spices <1–7 1–7 1–6 1–5 3–7 3–6 2–4
Meat and meat products 1–7 5–14 6–19 8–20 9–24 10–26 8–23
Milk and dairy products 1–5 4–8 2–8 1–6 1–5 2–4 2–4
Products for non-standard diets, food imitates and food supplements or fortifying agents 0 0 0–1 0–1 <1–2 <1–1 0–2
Seasoning, sauces and condiments <1–1 <1–1 1 <1–2 <1–2 <1–1 1
Starchy roots or tubers and products thereof, sugar plants 2–9 4–9 3–8 3–10 3–7 3–7 3–8
Sugar, confectionery and water-based sweet desserts <1–2 <1–5 2–8 2–12 1–13 <1–3 1–2
Vegetables and vegetable products 4–8 4–6 4–9 4–11 4–16 4–17 5–16
Water and water-based beverages <1–1 <1–7 <1–11 <1–8 <1–5 <1–4 <1–3
“–” means that there was no consumption event of the food group for the age and sex group considered, whereas “0” means that there were some consumption events, but that the food group 2880 does not contribute to the intake of the nutrient considered, for the age and sex group considered. 2881
2882

Draft Dietary Reference Values for iron
EFSA Journal 20YY;volume(issue):NNNN 77
Appendix H. Data derived from intervention studies in Europe on iron intake and markers of iron deficiency and/or iron deficiency anaemia in 2883
children 2884
Reference Design Number of individuals
(number of
males/number of females)
Age
group
Iron intake (mg/day)
Indices of iron status: Hb (g/L), serum
ferritin (μg/L), serum transferrin (g/L),
serum iron (μmol/L), ZPP (μmol/mol
haem), TSAT (%)
Discussion
Dube et al.
(2010a)
Healthy term
infants at the age of
4–10 months were
studied. Dietary
intake was recorded
with a daily diet
record. The high
meat group received
commercial baby
jars with a meat
content of 12 % by
weight, and the low
meat group received
8 % by weight.
Intervention was
from 4 to 10
months
High meat: 48 (24 M/24
F)
Infants
5–7 months:
3.86
8–10 months:
5.84
7 months
(baseline):
Hb: 118
Ferritin: 33.3
Serum Fe: 56.5
ZPP: 39.9
10 months (after
intervention):
Hb: 121
Ferritin: 28.8
Serum Fe: 54.1
ZPP: 48.7
Low meat: 49 (25 M/24 F) 3.72 5.74 Hb: 116
Ferritin: 33.5
Serum Fe: 58.2
ZPP: 39.2
Hb: 119
Ferritin: 25.5
Serum Fe: 70.2
ZPP: 45.0
Dube et al.
(2010b)
Retrospective
analysis of data
from a randomised
controlled trial.
Dietary iron and
indicators of iron
status were
analysed at the age
of 4 (exclusively
milk-fed period), 7
and 10 months
(complementary
feeding period).
Breast-fed: 53 (27 M/26 F) Infants
3–4 months:
0.46
5–7 months:
1.55
8–10
months:
4.81
4 months:
Hb: 118
Ferritin: 75.2
Serum Fe: 57.4
ZPP: 37.1
7 months:
Hb: 114
Ferritin:
32.5
Serum Fe:
53.5
ZPP:38.8
10
months:
Hb: 119
Ferritin:
23.5
Serum Fe:
54.7
ZPP: 48.4
Iron-fortified formula: 23
(8 M/15 F)
6.14 6.99 6.96 Hb: 120
Ferritin: 63.4
Serum Fe: 69.7
ZPP: 48.6
Hb: 121
Ferritin:
36.4
Serum Fe:
66.1
ZPP: 40.8
Hb: 123
Ferritin:
35.6
Serum Fe:
76.5
ZPP: 47.2

Draft Dietary Reference Values for iron
EFSA Journal 20YY;volume(issue):NNNN 78
Reference Design Number of individuals
(number of
males/number of females)
Age
group
Iron intake (mg/day)
Indices of iron status: Hb (g/L), serum
ferritin (μg/L), serum transferrin (g/L),
serum iron (μmol/L), ZPP (μmol/mol
haem), TSAT (%)
Discussion
Engelmann
et al.
(1998)
Parallel
intervention study
(blinded). The low
meat group received
a diet with a meat
content aimed at the
average found in an
observational study
of infants from the
same area and the
high meat group
received a diet
aimed at a meat
content about 3
times higher than in
the low meat group
High meat: 21 (14 M/7 F) 8 months 3.1 Hb: 119.1
Ferritin: 15.5
Transferrin receptor: 8
The results suggest that
an increase in meat
intake can prevent a
decrease in Hb in late
infancy. However, there
was no effect on iron
stores or on cellular iron
deficiency, evaluated by
serum ferritin and TfR
levels, respectively.
Low meat: 20 (15 M/5 F) 8 months 3.4 Hb: 113.7
Ferritin: 17.3
Transferrin receptor: 7.4
Haschke et
al. (1993)
The Fe-fortified
whey predominant
formula contained 3
mg Fe/L, whereas
infants in the higher
Fe level group
received formula
containing 6 mg
Fe/L. Dietary intake
was assessed at 183
and 274 days
Breast-fed infants until
274 days: 30
Infants 183 days:
Not reported
274 days:
Not reported
90 days:
Hb: 118
Ferritin: 136
183 days:
Hb: 123
Ferritin:49
274
days:
Hb: 121
Ferritin:
16
Fe-fortified whey
predominant formula: 27
2.7 2.4 Hb: 121
Ferritin: 86
Hb: 124
Ferritin: 41
Hb: 125
Ferritin:
21
Higher Fe level: 24 4.9 4.3 Hb: 118
Ferritin: 102
Hb: 124
Ferritin: 42
Hb: 126
Ferritin:
29

Draft Dietary Reference Values for iron
EFSA Journal 20YY;volume(issue):NNNN 79
Reference Design Number of individuals
(number of
males/number of females)
Age
group
Iron intake (mg/day)
Indices of iron status: Hb (g/L), serum
ferritin (μg/L), serum transferrin (g/L),
serum iron (μmol/L), ZPP (μmol/mol
haem), TSAT (%)
Discussion
Ilich-Ernst
et al.
(1998)
Girls in pubertal
stage 2 who were
premenarcheal at
baseline. 7-year,
randomised,
double-blind,
placebo-controlled
trial to assess the
effects of calcium
supplementation on
bone mass
acquisition.
Intervention group
treated with 1 000
mg Ca/day as
calcium citrate
malate. The follow-
up period was 4
years and the girls
were seen every 6
months
354 girls (Baseline) 10.8
years
13.2 Ferritin: 29.2 Serum ferritin
concentrations at 0, 1, 2,
3, and 4 years were not
significantly different
between groups. In
addition, there was no
significant difference
between groups in any
of the red blood cell
indices.
In summary, growth
spurt and menstrual
status had adverse
effects on iron stores in
adolescent girls with
low iron intake (< 9
mg/day), whereas long-
term supplementation
with calcium (total
intake: < 1 500 mg/day)
did not affect iron
status.
354 girls (1 year) 11.8
years
12.1 Ferritin: 33.4
354 girls (2 years) 12.9
years
12.7 Ferritin: 31
354 girls (3 years) 13.9
years
14.3 Ferritin: 30.8
354 girls (4 years) 14.9
years
14.0 Ferritin: 29.6
Hb (placebo): 134
Hb (supplemented):
132
Lind et al.
(2003)
Double-blind
parallel intervention
trial in infants
lasting for 2 months
Commercial milk-based
cereal drink and porridge:
94 (50 M/44 F)
6–12
months
6–8 months:
7.5
9–10
months:
9.9
6 months:
Hb: 116
Ferritin: 48.5
12 months:
Hb: 119
Ferritin: 25.3
Extensive production in
the phytate content of
weaning cereals had
little long-term effect on
the iron and zinc status
of Swedish infants
Phytate-reduced
commercial milk based
cereal drink and phytate-
reduced porridge: 90 (44
M/46 F)
7.6 10.3 Hb: 115
Ferritin: 40.9
Hb: 120
Ferritin: 21.3
Milk-based infant formula
and porridge with the
usual phytate content: 83
(39 M/44 F)
4.7 6.2 Hb: 115
Ferritin: 44.1
Hb: 117
Ferritin: 25.2

Draft Dietary Reference Values for iron
EFSA Journal 20YY;volume(issue):NNNN 80
Reference Design Number of individuals
(number of
males/number of females)
Age
group
Iron intake (mg/day)
Indices of iron status: Hb (g/L), serum
ferritin (μg/L), serum transferrin (g/L),
serum iron (μmol/L), ZPP (μmol/mol
haem), TSAT (%)
Discussion
Makrides
et al.
(1998)
Dietary intake was
assessed with a
food-frequency
questionnaire
Control: 26 (12 M/14 F) 6 months
breast-
fed
infants
6 months:
1.5 ± 1.7
12 months:
5.2 ± 3.4
6 months:
Hb: 120 ± 8
Ferritin: 53 ± 61
Serum Fe: 7 ± 3
Serum transferrin:
2.6 ± 0.4
TSAT: 12 ± 4
12 months:
Hb: 115 ± 9
Ferritin: 35 ± 37
Serum Fe: 8 ± 3
Serum transferrin: 2.8
± 0.4
TSAT: 11 ± 5
High iron weaning diet: 36
(19 M/17 F)
1.9 ± 1.9
8.2 ± 2.9 Hb: 122 ± 10
Ferritin: 53 ± 49
Serum Fe: 8 ± 3
Serum transferrin:
2.7 ± 0.3
TSAT: 13 ± 6
Hb: 120 ± 7
Ferritin: 26 ± 18
Serum Fe: 9 ± 5
Serum transferrin: 2.7
± 0.3
TSAT: 13 ± 7
Niinikoski
et al.
(1997)
Dietary intake
assessed with a 4-
day food record
Control group: 39 3–4
years
8.6 ± 2.8 Hb: 122
Serum transferrin: 2.85
Ferritin: 19.2
Iron: 14.8
The children in the
intervention group
consumed less saturated
fat than those in the
control group and had
continuously higher
ratios of dietary
polyunsaturated to
saturated fatty acids.
Long-term supervised
use of a diet low in
saturated fat and
cholesterol did not
influence intake or
serum indicators of iron
in children
Intervention group: 40 8.8 ± 4.2 Hb: 123
Serum transferrin: 2.90
Ferritin: 21.8
Iron: 15.2
F, females; Fe, iron; M, males; Hb, haemoglobin; TSAT, plasma transferrin saturation (%); ZPP, zinc protoporphyrin 2885
2886

Draft Dietary Reference Values for iron
EFSA Journal 20YY;volume(issue):NNNN 81
Appendix I. Data derived from observational studies in Europe on iron intake and markers of iron deficiency and/or iron deficiency anaemia in 2887
children 2888
Reference Design Number of individuals Age (years) Iron intake (mg/day), mean or geometric
mean
Indices of iron status: Hb
(g/L), serum ferritin (μg/L),
transferrin saturation (%),
ZPP (μmol/mol haem)
Discussion
Gibson (1999) Data of the UK National
Diet and Nutrition Survey
(NDNS). Dietary intakes
assessed with 4-day
weighed records.
904 1.5–4.5 5.45
Hb: 122
Ferritin: 23.4
ZPP: 54
Despite the difference
in total iron intake
between the cereal
consumption groups,
there was no
significant difference
in iron status as
measured by ferritin,
Hb or ZPP
Gunnarsson et
al. (2004)
3-day weighed food
records
71 2 7.5 ± 4.2
Hb: 121.8
Ferritin: 17.6
Thane et al.
(2003)
7-day weighed dietary
records
Boys
167
4–6
% RNI 131 (RNI: 6.1 mg/day) 8 mg/day
Hb (a):
125
Ferritin (b):
30
TSAT:
20
Adequacy of dietary
iron intake (as %
RNI) was
significantly higher
in boys than in girls
for each age group.
Poor iron status was
generally more
prevalent in
adolescent girls of
non-Caucasian ethnic
origin or in those
who were
vegetarians.
228 7–10 % RNI 109 (RNI: 8.7 mg/day) 9.5 mg/day 130 31 23
212 11–14 % RNI 94 (RNI: 11.3 mg/day) 10.6 mg/day 134 30 22
163 15–18 % RNI 105 (RNI: 11.3 mg/day) 12 mg/day 146 45 26
Girls 151 4–6 % RNI 118 (RNI: 6.1 mg/day) 7.2 mg/day 125 24 21
207 7–10 % RNI 96 (RNI: 8.7 mg/day) 8.4 mg/day 128 33 22
209 11–14 % RNI 59 (RNI: 14.8 mg/day) 8.7 mg/day 133 29 22
183 15–18 % RNI 56 (RNI: 14.8 mg/day) 8.3 mg/day
Values after the arrow were calculated based on
intakes given as % RNI and RNIs in the paper.
131 25 22
Thorisdottir et
al. (2011)
Iron status, dietary intake
and anthropometry were
prospectively assessed in
a randomly selected infant
population
141 (73 boys) Infants At 9 months: 6.28 At 12 months: 6.82 At 12 months:
Hb: 120.96
141 (61 girls) 6.27 5.77 Hb: 120.28
Hb: haemoglobin; RNI, reference nutrient intake; TSAT, plasma transferrin saturation (%); ZPP, zinc protoporphyrin; (a): arithmetic mean; (b): geometric mean 2889 2890

Draft Dietary Reference Values for iron
EFSA Journal 20YY;volume(issue):NNNN 82
Appendix J. Re-analysis of data on endogenous iron losses from Hunt et al. (2009) 2891
SOURCE OF INFORMATION 2892
7. Data sources 2893
The current analysis is based on individual data provided by the US Department of Agriculture, 2894
Agricultural Research Service, Grand Forks Human Nutrition Research Center and the University of 2895
North Dakota, Grand Forks, USA. The individual data are property of these institutions and, 2896
therefore, they cannot be disclosed by EFSA. The study and the corresponding set of data were 2897
identified in the literature and selected by the NDA Panel. 2898
The original research was aimed at measuring total endogenous iron losses in men and women. The 2899
study recruited men and women who had participated for at least one year earlier in studies of healthy 2900
subjects who were administered iron radioisotope (55
Fe). All subjects meeting this criterion were 2901
enrolled in a three-year study that involved semi-annual blood sampling. Subjects completed a 2902
questionnaire on general health and factors that might affect body iron excretion at the beginning and 2903
at the end of the study. The list of questions and the outcomes of the questionnaire were not made 2904
available to EFSA. Throughout the study the subjects had to update information about health, iron 2905
supplement use or blood losses due to medical conditions or care, pregnancy, use of chemical forms 2906
of birth control or hormone replacements, and dates of menstruation. 2907
Subjects were considered eligible for the final analysis according to the following criteria: 2908
Provision of semi-annual blood samples for at least one year; 2909
no use of iron supplements; 2910
no surgery; 2911
no blood donation; 2912
if women, no occurrence of pregnancy or menopause during the study. 2913
Based on the weak X-rays emitted by the radioisotope, the biological half-life of iron was determined 2914
for each subject from blood samples collected semi-annually. Body iron was determined as the sum of 2915
circulating haemoglobin iron plus body iron stores, based on measurements from samples collected on 2916
two separate days at the beginning and again at the end of each subject’s participation. 2917
The metabolic body weight (body weight to the power of 0.75) (EFSA NDA Panel, 2010), not 2918
available from the original dataset, was computed for the current analysis in order to better investigate 2919
the potential effect of body weight on iron losses. Since fat mass does not contribute significantly to 2920
iron losses, the transformation of body weight into metabolic body weight was assumed to be able to 2921
better highlight the association between iron losses and lean body mass. 2922
The variable named “turnover rate” in the dataset, expressing the percentage of iron losses per year, 2923
was transformed into a rate, dividing it by 100, in order to get values between 0 and 1. However, the 2924
same name was maintained for the variable. The transformation was done because for variables 2925
bounded by values 0 and 1 it may be easier to find a parametric distribution to represent variability 2926
(typically a Beta distribution). 2927

Draft Dietary Reference Values for iron
EFSA Journal 20YY;volume(issue):NNNN 83
While 53 subjects entered the analysis performed by Hunt et al. (2009), 55 were included in the 2928
dataset provided to EFSA, the difference being due to the inclusion of two women for whom the 2929
menstruating status was not specified. 2930
It is not clear from the paper by Hunt et al. (2009) how repeated measurements on blood samples 2931
collected twice per year for 1–3 years have been summarised in the dataset provided to EFSA. The 2932
latter includes only one value per subject. Therefore, it was not possible to estimate intra-subject 2933
variability and increase precision of the estimate. 2934
The composition of the sample in terms of sex/menstruating status subgroup is reported in Table 13. 2935
Table 13: Frequency of the four subgroups 2936
Group Number % Frequency
Men 29 52.7
Women – Menstruating 19 34.6
Women – Postmenopausal 5 9.1
Women – Unknown menstruating status 2 3.6
All subgroups 55 100 %
8. Eligibility criteria for subject selection and data pre-processing 2937
The same eligibility criteria established by Hunt et al. (2009) were maintained in the analysis, except 2938
for exclusion of postmenopausal women. The summary statistics of age at the beginning of the study, 2939
body weight, BMI, metabolic body weight, serum ferritin concentration, iron losses, biological half-2940
life, and turnover rate are reported in Table 14 (by sex) and Table 15 (by subgroups). 2941
Table 14: Summary statistics by sex 2942
Mean SD Median Minimum Maximum
Age at start (years)
Female 42.07 7.09 41.79 30.19 57.62
Male 42.96 8.03 42.54 30.42 58.30
Body weight (kg)
Female 71.87 11.58 72.95 52.00 89.20
Male 91.65 14.89 90.40 61.80 130.90
BMI (kg/m2)
Female 27.11 4.49 27.39 18.65 36.14
Male 28.78 3.69 28.27 21.77 35.32

Draft Dietary Reference Values for iron
EFSA Journal 20YY;volume(issue):NNNN 84
Mean SD Median Minimum Maximum
Metabolic body weight (actual body weight to the power of 0.75, kg)
Female 24.62 3.00 24.96 19.36 29.03
Male 29.55 3.59 29.32 22.04 38.70
Iron losses (mg/day)
Female 1.73 1.12 1.53 0.57 4.88
Male 1.07 0.47 1.18 0.11 2.07
Iron biological half-life (years)
Female 3.83 1.72 3.92 0.72 7.46
Male 8.99 6.20 7.24 4.30 31.61
Iron turnover rate (rate/year) (a)
Female 0.25 0.20 0.18 0.09 0.96
Male 0.10 0.04 0.10 0.02 0.16
Serum ferritin (µg/L)
Female 58.65 60.33 36.61 6.58 284.75
Male 164.19 87.41 138.50 50.70 356.75
(a): Percentage of iron losses per rate, transformed into a fraction, i.e. dividing by 100, in order to get values between 0 and 1 2943
Table 15: Summary statistics by subgroups by sex/menstruating status 2944
Mean SD Median Minimum Maximum
Age at start (years)
Women – Menstruating 39.86 4.72 38.72 31.60 46.63
Women – Postmenopausal 49.92 4.92 48.40 45.53 57.62
Women – Unknown
menstruating status 43.49 18.82 43.49 30.19 56.80
Men 42.96 8.03 42.54 30.42 58.30
Body weight (kg)
Women – Menstruating 73.48 10.21 73.60 56.00 87.60
Women – Postmenopausal 67.56 14.36 64.80 53.00 89.20
Women – Unknown
menstruating status 67.25 21.57 67.25 52.00 82.50
Men 91.65 14.89 90.40 61.80 130.90
BMI (kg/m2)
Women – Menstruating 27.89 2.63 25.13 20.47 36.14
Women – Postmenopausal 25.49 3.72 22.84 19.64 30.68
Women – Unknown
menstruating status 23.77 5.66 23.37 19.36 28.89
Men 28.78 3.59 29.32 22.04 35.32
Metabolic body weight (actual body weight to the power of 0.75, kg)
Women – Menstruating 25.05 4.33 28.04 19.38 28.63
Women – Postmenopausal 23.49 4.08 23.80 20.70 29.03
Women – Unknown
menstruating status 23.37 7.24 23.77 18.65 27.37
Men 29.55 3.69 28.27 21.77 38.70

Draft Dietary Reference Values for iron
EFSA Journal 20YY;volume(issue):NNNN 85
Mean SD Median Minimum Maximum
Iron losses (mg/day)
Women – Menstruating 1.97 1.22 1.58 0.65 4.88
Women – Postmenopausal 1.08 0.28 0.99 0.86 1.57
Women – Unknown
menstruating status 1.11 0.77 1.11 0.57 1.66
Men 1.07 0.47 1.18 0.11 2.07
Iron biological half-life (years)
Women – Menstruating 3.46 1.78 3.67 0.72 7.46
Women – Postmenopausal 4.69 1.01 4.24 3.78 5.92
Women – Unknown
menstruating status 5.16 1.69 5.16 3.96 6.36
Men 8.99 6.20 7.24 4.30 31.61
Iron turnover rate (rate/year) (a)
Women – Menstruating 0.29 0.22 0.19 0.09 0.96
Women – Postmenopausal 0.15 0.03 0.16 0.12 0.18
Women – Unknown
menstruating status 0.14 0.05 0.14 0.11 0.17
Men 0.10 0.04 0.10 0.02 0.16
Serum ferritin (µg/L)
Women – Menstruating 47.82 41.40 32.48 6.575 148.75
Women – Postmenopausal 96.88 111.55 39.42 21.93 284.75
Women – Unknown
menstruating status 65.96 27.03 65.96 46.85 85.075
Men 164.19 87.41 138.50 50.70 356.75
(a): Percentage of iron losses per rate, transformed into a fraction, i.e. dividing by 100, in order to get values between 0 and 1 2945 2946
For the two women with unknown menstruating status the Panel considered it reasonable to allocate 2947
them in one of the two groups: menstruating women or postmenopausal women based on the 2948
assessment of age and the use of birth control measures (if any). Due to the limited size of the group, 2949
the postmenopausal women could not be analysed independently. Therefore, it was decided to test 2950
whether these women can be merged with either the group of men or of menstruating women. 2951
8.1. Allocation of women with unknown menstruating status 2952
The dataset included two females for which menstruating status was unknown. In order to avoid their 2953
exclusion from the dataset, whose size was already limited, the two individuals were included in one 2954
of the two female subgroups on the basis of the likelihood of their membership conditional to the 2955
variables age and use of a birth control measures. 2956
According to this criterion the following attribution was performed: 2957

Draft Dietary Reference Values for iron
EFSA Journal 20YY;volume(issue):NNNN 86
Subject code Age Birth control measure Subgroup
25 30 Yes Menstruating women
26 57 Unknown Postmenopausal women
8.2. Allocation of the subgroup of postmenopausal women 2958
The limited number of observations available for postmenopausal women did not allow any analysis 2959
on this group independently. The option of merging these women with the group of men or 2960
menstruating women was investigated. The criterion of the similarity with respect to the variables iron 2961
losses, iron turnover rate, iron half-life and metabolic body weight was considered appropriate for this 2962
purpose. The boxplot of iron losses in the four subgroups is presented in Figure 2. The t-test with 2963
unequal variance (Ramsey, 1980) was used for this scope. 2964
2965
Figure 2: Boxplot of iron losses by group 2966
The results of the comparison between postmenopausal women and men are presented in Table 16. 2967
Table 16: Comparison of postmenopausal women and men 2968
Mean difference Lower CI Upper CI P-value
Iron losses -0.1075 -0.4806 0.2657 0.5321
Iron turnover rate -0.0593 -0.0904 -0.0281 0.0021
Iron biological half-life 4.4219 1.9481 6.8957 0.0009
Metabolic body weight 5.4162 1.5365 9.2959 0.0130
CI, confidence interval 2969
A significant difference in the iron turnover rate, iron half-life and metabolic body weight is observed 2970
between the two groups. The distribution of the variables in the two groups is presented in Figures 3–2971
6. In the figures, number 1 is the group of men and number 3 is the group of postmenopausal women. 2972

Draft Dietary Reference Values for iron
EFSA Journal 20YY;volume(issue):NNNN 87
2973
Figure 3: Distribution of iron losses in men (top) and postmenopausal women (bottom) 2974
2975
Figure 4: Distribution of turnover rate in men (top) and postmenopausal women (bottom) 2976
2977
Figure 5: Distribution of biological half-life in men (top) and postmenopausal women (bottom) 2978
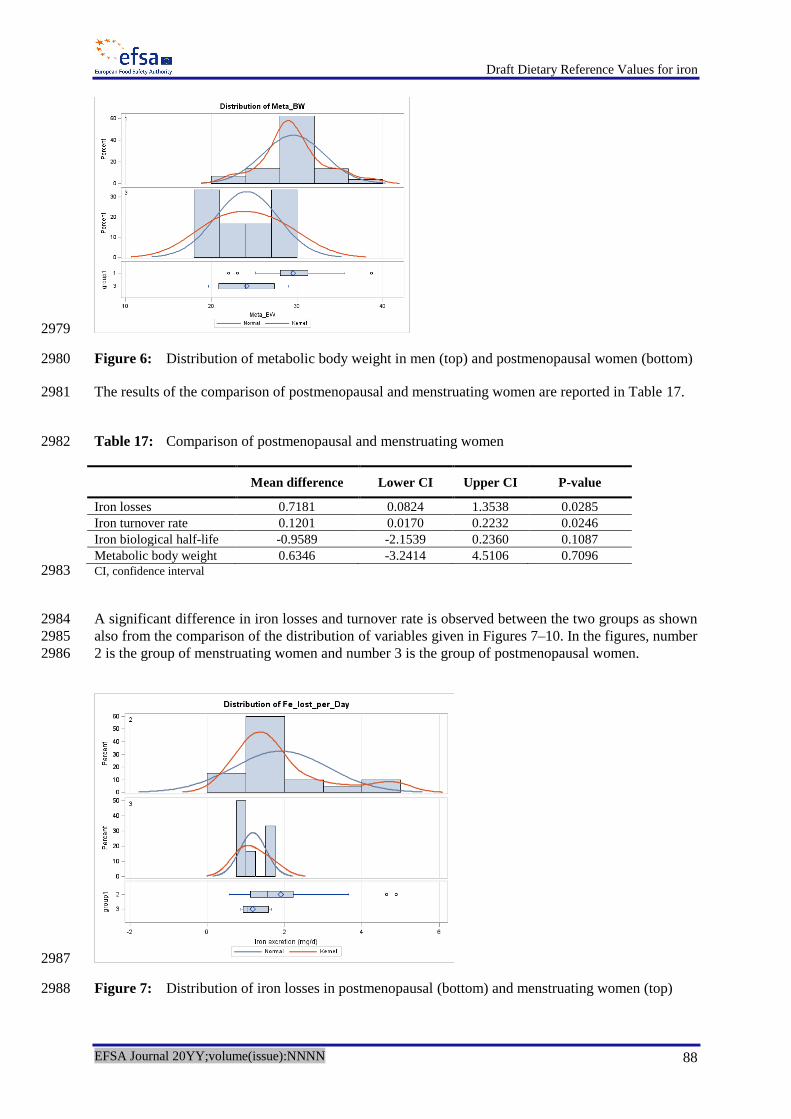
Draft Dietary Reference Values for iron
EFSA Journal 20YY;volume(issue):NNNN 88
2979
Figure 6: Distribution of metabolic body weight in men (top) and postmenopausal women (bottom) 2980
The results of the comparison of postmenopausal and menstruating women are reported in Table 17. 2981
Table 17: Comparison of postmenopausal and menstruating women 2982
Mean difference Lower CI Upper CI P-value
Iron losses 0.7181 0.0824 1.3538 0.0285
Iron turnover rate 0.1201 0.0170 0.2232 0.0246
Iron biological half-life -0.9589 -2.1539 0.2360 0.1087
Metabolic body weight 0.6346 -3.2414 4.5106 0.7096 CI, confidence interval 2983
A significant difference in iron losses and turnover rate is observed between the two groups as shown 2984
also from the comparison of the distribution of variables given in Figures 7–10. In the figures, number 2985
2 is the group of menstruating women and number 3 is the group of postmenopausal women. 2986
2987
Figure 7: Distribution of iron losses in postmenopausal (bottom) and menstruating women (top) 2988

Draft Dietary Reference Values for iron
EFSA Journal 20YY;volume(issue):NNNN 89
2989 Figure 8: Distribution of turnover rate in postmenopausal (bottom) and menstruating women (top) 2990
2991 Figure 9: Distribution of biological half-life in postmenopausal (bottom) and menstruating women 2992
(top) 2993
2994 Figure 10: Distribution of metabolic body weight in postmenopausal (bottom) and menstruating 2995
women (top) 2996

Draft Dietary Reference Values for iron
EFSA Journal 20YY;volume(issue):NNNN 90
Due to the significant difference observed in the means of several variables when comparing 2997
postmenopausal women to either men or menstruating women, it was decided to exclude 2998
postmenopausal women from the analysis. 2999
DATA QUALITY 3000
Information about the setting of the studies and the methodology used to collect the data (including 3001
laboratory techniques) can be found in the references provided by Hunt et al. (2009). 3002
One of the major strengths of the data is represented by the effort done by the researchers to control 3003
for potential confounding deriving from blood loss that could have occurred for reasons other than 3004
elimination via usual routes. Strict eligibility criteria were set up in this respect. Some variables 3005
related to dietary consumption habits and life-style were measured in the study using a questionnaire. 3006
Such data were not made available to EFSA. These aspects could represent potential confounding 3007
factors that influence iron losses and that cannot be accounted for in the current analysis because of 3008
lack of data. It is assumed that the dietary consumption habits and life-style of subjects in the sample 3009
is representative of those of the North-American healthy adult population. Blood samples were 3010
collected every six months. The processing of these data in order to provide a summary measure per 3011
subject as in the dataset provided to EFSA was performed by Hunt et al. (2009) and could not be 3012
investigated further in the present analysis because of lack of information. 3013
The subjects in the sample received a different dose of iron supplements in a previous study in which 3014
they participated and from which they were recruited. Eleven subjects received a single intravenous 3015
dose of 5 µCi Fe mixed with each subject’s own plasma. One to two years before the present study, 3016
42 subjects had received two oral doses separated by several weeks, with a total dose of 1–2 µCi Fe as 3017
haemoglobin iron. For the two subjects with unknown menstruating status, the dose of iron 3018
administered in the previous study is not reported since they were not included in the final analysis. In 3019
principle, differences in the dose of iron administered in the previous study could represent a 3020
confounding factor in the assessment of iron losses, but the Panel considers that sufficient time had 3021
elapsed to enable the physical decay of this isotope with a half-life of 44.5 days. 3022
METHODS OF ANALYSIS 3023
In order to provide a basis for the estimate of various percentiles of iron losses for the EU healthy 3024
adult population, a model was developed according to the following steps: 3025
summary statistics were estimated for the main variables related to iron losses for the two 3026
subgroups as resulting from pre-processing (men and menstruating women); 3027
possible association among variables indicated by the Panel as potentially explanatory 3028
variables for iron losses was investigated in order to reduce the risk of introducing into the 3029
regression model autocorrelated variables; 3030
a regression model for iron losses (in mg/day) was fitted to the data provided by Hunt et al. 3031
(2009) using as a set of potentially explanatory variables those with limited correlation. This 3032
step also included analysis of outliers and assessment of goodness of fit; 3033
use the equation estimated via the regression model to derive a distribution for iron losses 3034
combining the latter equation with parametric distributions fitted on sample data for each of 3035
the input factors. 3036
Due to the significant differences in the distribution of iron losses between men and menstruating 3037
women, the Panel decided to perform separate analyses for the two subgroups. Postmenopausal 3038

Draft Dietary Reference Values for iron
EFSA Journal 20YY;volume(issue):NNNN 91
women were excluded from the analysis since their number was too limited and the similarity with 3039
one of the other two groups did not appear sufficient to merge them. 3040
9. Statistical analysis – Men 3041
9.1. Summary statistics 3042
A description of the main characteristics of the sample of male subjects is provided in Table 18. 3043
Table 18: Summary statistics for men 3044
Variable Number Mean SD Median Minimum Maximum
Initial age (years) 29 42.96 8.03 42.54 30.42 58.30
Body weight (kg) 29 91.65 14.89 90.4 61.8 130.9
BMI (kg/m2) 29 28.78 3.59 29.32 22.04 35.32
Metabolic body weight (kg) 29 29.55 3.59 29.32 22.04 38.70
Iron losses (mg/day) 29 1.07 0.47 1.18 0.11 2.07
Iron losses (µg/kg actual body
weight per day)
29 11.63 4.80 11.82 1.38 20.84
Biological half-life of iron (years) 29 8.99 6.20 7.24 4.30 31.61
Turnover rate (rate/year) (a)
29 0.10 0.04 0.10 0.02 0.16
Serum ferritin (µg/L) 29 164.19 87.41 138.50 50.70 356.75
(a): Percentage of iron losses per rate, transformed into a fraction, i.e. dividing by 100, in order to get values between 0 and 1 3045 3046
The median body weight of about 90 kg and the median BMI of about 29 kg/m2 of this sample of 3047
North-American healthy adult men is larger than the corresponding values in the EU adult male 3048
population (measured median body weight in 16 580 men aged 18–79 years is 80.8 kg; median BMI is 3049
26.1 kg/m2) (EFSA NDA Panel, 2013). This difference could introduce a bias in estimating the 3050
population mean of iron losses with a regression model. As a mitigation action it was decided to use 3051
the metabolic body weight instead. In addition, it was considered appropriate to perform a sensitivity 3052
analysis at the end of the process in order to assess the influence of this input variable on the estimate 3053
of iron losses. 3054
The values of 31.6 for biological half-life (subject 49) and 0.16 for turnover rate (subject 46) appear 3055
extreme with respect to the mean of the sample (8.99 and 0.10, respectively). An investigation of the 3056
possibility that these subjects represent outliers was performed (see Section 9.4). 3057
9.2. Assessing association among variables 3058
A Pearson correlation coefficient was estimated in order to assess the linear correlation among iron 3059
losses (mg/day) and potential explanatory factors metabolic body weight, iron biological half-life, 3060
iron turnover rate, serum ferritin concentration. The variables with the highest level of association are 3061
the turnover rate and biological half-life, which are also highly correlated (-0.84). The turnover rate 3062
was retained because it had the highest level of correlation. Metabolic body weight was also 3063
significantly correlated with iron losses and was retained for setting up the regression model. 3064
3065

Draft Dietary Reference Values for iron
EFSA Journal 20YY;volume(issue):NNNN 92
Table 19: Pearson Correlation Coefficients (Prob > |r| under H0: Rho=0) 3066
Body weight
(kg)
Metabolic body
weight (kg)
Iron losses
(mg/day)
Biological
half-life of
iron (years)
Turnover
rate
(rate/year)
Serum
ferritin
(µg/L)
Body weight (kg) 1 0.99954
< 0.0001
0.40809
0.0280
-0.16678
0.3872
0.04941
0.7991
0.41500
0.0252
Metabolic body
weight (kg) 0.99954
< 0.0001
1 0.41197
(0.0264)
-0.16739
(0.3854)
0.05343
(0.7831)
0.40939
(0.0274)
Iron losses
(mg/day) 0.40809
0.0280
0.41197
(0.0264)
1 -0.79348
(< 0.0001)
0.91898
(< 0.0001)
0.17266
(0.3704)
Biological half-life
of iron (years) -0.16678
0.3872
-0.16739
(0.3854)
-0.79348
(<.0001)
1 -0.83988
(< 0.0001)
0.1833
(0.3412)
Turnover rate
(rate/year) 0.04941
0.7991
0.05343
(0.7831)
0.91898
(< 0.0001)
-0.83988
(< 0.0001)
1 -0.0664
(0.7322)
Serum ferritin
(µg/L) 0.41500
0.0252
0.40939
(0.0274)
0.17266
(0.3704)
0.1833
(0.3412)
-0.0664
(0.7322)
1
3067
Figure 11: Scatter plot and frequency distribution 3068

Draft Dietary Reference Values for iron
EFSA Journal 20YY;volume(issue):NNNN 93
Table 19 shows that turnover rate and biological half-life are highly correlated. Turnover rate has a 3069
stronger linear association with iron losses. In addition, its relationship with iron losses is linear while 3070
the one with half-life is not. Therefore, in order to use a simpler and more parsimonious structure for 3071
the model, turnover rate was kept in the analysis. Metabolic body weight is preferred over body 3072
weight based on the reasoning above. 3073
9.3. Setting up a regression model 3074
A linear regression model was used to explain iron losses. Based on previous correlation analysis, 3075
metabolic body weight and turnover rate were considered as potential covariates that might have an 3076
effect on the output and have limited autocorrelation. 3077
The form of the model is given in equation [1] 3078
ii XXY 22110 [1] 3079
Where: 3080
Yi is iron losses (in mg/day) 3081
j are regression coefficients for the explanatory factors 3082
X1 is metabolic body weight 3083
X2 is turnover rate 3084
i is the random error term on individual i-th with 2,0 N 3085
The goodness of fit of the model was assessed using as indicators the adjusted R-square and the 3086
Akaike (AIC) and Bayesian (BIC) information criteria. Normality of the residuals was assessed 3087
graphically. 3088
The ouput of model fitting is reported in Tables 20–22. 3089
Table 20: Analysis of variance 3090
Source Degrees of
freedom
Sum of
squares
Mean
square
F value Pr > F
Model 2 5.93161 2.96581 541.79 < 0.0001
Error 26 0.14233 0.00547
Corrected total 28 6.07394
3091
Table 21: Indicators for goodness of fit 3092
Root mean-square error 0.07399 R square 0.9766
Dependent mean 1.07059 Adjusted R square 0.9748
Coefficient of variation 6.91085 Akaike (AIC) -148.2
Bayesian (BIC) -144.1

Draft Dietary Reference Values for iron
EFSA Journal 20YY;volume(issue):NNNN 94
Table 22: Parameter estimates 3093
Variable Parameter
estimate
Standard
error
Lower
95 % CI
Upper
95 % CI
Pr > |t|
Intercept -1.44460 0.12000 -1.69126 -1.19794 < 0.0001
Metabolic body weight (kg) 0.04718 0.00390 0.03917 0.05520 < 0.0001
Turnover rate (rate/year ) 11.504 0.384 10.713 12.294 < 0.0001
CI, confidence interval 3094
Both variables are able to explain a significant component of the variability of iron losses in men and 3095
are retained in the model. 3096
9.4. Outlier analysis 3097
Graphical diagnostics for detection of outliers are reported in Figure 12. No individual had externally 3098
studentised residuals outside the range (-3; +3). However, subject 46 was borderline (turnover rate 3099
0.16, iron losses 2.07 mg/day – Cook’s D influence statistic = 0.4, externally studentised 3100
residual = 2.99). The Panel considered it appropriate to exclude the subject from the analysis. 3101
3102
Figure 12: Diagnostics for detection of outliers 3103

Draft Dietary Reference Values for iron
EFSA Journal 20YY;volume(issue):NNNN 95
Summary statistics of the main factors in men after removal of outliers are reported in Table 23. 3104
Table 23: Summary statistics for men after removal of outliers 3105
Variable Number Mean Standard
deviation
Median Minimum Maximum
Initial age (years) 28 42.90 8.18 41.61 30.42 58.30
Body weight (kg) 28 91.37 15.09 89.40 61.80 130.90
BMI (kg/m2) 28 28.65 3.69 28.05 21.77 35.32
Metabolic body weight (kg) 28 29.48 3.64 29.07 22.04 38.70
Iron losses (mg/day) 28 1.03 0.43 1.10 0.11 1.63
Iron losses (µg/kg actual body
weight per day)
28 11.30 4.54 11.40 1.38 19.08
Biological half-life of iron (years) 28 9.16 6.25 7.31 4.41 31.61
Turnover rate (rate/year) 28 0.10 0.03 0.09 0.02 0.16
Serum ferritin (µg /L) 28 159.39 85.02 136.92 50.70 356.75
3106
After exclusion of the outlier, the change in indicators for goodness of fit was negligible. The revised 3107
parameter estimates are reported in Table 24. 3108
Table 24: Parameter estimates after exclusion of one outlier 3109
Variable Parameter
estimate
Standard
error
Lower
95 % CI
Upper
95 % CI
Pr > |t|
Intercept -1.38942 0.10668 -1.60912 -1.16971 < 0.0001
Metabolic body weight (kg) 0.04624 0.00343 0.03918 0.05330 < 0.0001
Turnover rate (rate/year) 11.14889 0.35698 10.41367 11.88410 < 0.0001
CI, confidence interval 3110
9.5. Estimate the distribution of endogenous iron losses via a probabilistic model 3111
The knowledge of the probability distribution of iron losses representing its variation in the target 3112
population is an information of paramount importance when setting DRVs. Data collected on a 3113
reduced sample are unlikely to represent the overall distribution of the EU healthy adults especially 3114
for the tails of the distribution. 3115
The probabilistic approach provides a useful methodological support to fill in gaps in the data as far 3116
as major sources of variability and uncertainty are concerned. Variation in iron losses can be 3117
modelled fitting a parametrical distribution to the observed measurements of the input factors and 3118
using them to derive a probability distribution for the mineral losses using the model estimated via the 3119
regression analysis. The same approach can be used to account for important sources of uncertainty in 3120
the model inputs. 3121

Draft Dietary Reference Values for iron
EFSA Journal 20YY;volume(issue):NNNN 96
In real life the explanatory factors of the regression model (metabolic body weight and turnover rate) 3122
represent quantities whose value varies across the target population. Parametric modelling uses 3123
parametric distributions that are based on the observed data but generate additional values below, 3124
between, and above the observed values. This has the advantage of being able to represent the full 3125
range of potential values for the factors of interest, but requires assumptions to be made about the 3126
shape of the distribution. If unbounded distributions are used, they will certainly generate a small 3127
proportion of unrealistically high values, even if they fit the data well. Truncations have been used in 3128
this analysis to avoid this issue. The model fitting accounts for the inter-individual variability of the 3129
factors in the population. In practice, the distribution of these factors is also somehow uncertain 3130
because of the limited size of the datasets (sampling uncertainty) and the potential limitation in the 3131
representativeness of the sample towards the target population. These considerations could affect the 3132
choice of the shape of the distribution, especially in the lower and upper tails. In this analysis the 3133
potential sources of uncertainty are not assessed quantitatively. Their impact on the distribution of 3134
iron losses and final conclusions are described in Section 9.1 and 13.2. 3135
A different approach was taken for the regression coefficient parametric modelling. These inputs are 3136
assumed to be deterministic (not variable in the population) but uncertain because estimated on a 3137
sample. The uncertainty for these parameters was addressed modelling the 95 % interval estimates 3138
with appropriate distributions. 3139
Monte Carlo simulation techniques were used to generate the parametric distributions and combine 3140
them into the equation model estimated by the regression analysis. Monte Carlo simulations are 3141
numerical sampling techniques that are the most robust and least restrictive with respect to model 3142
design and model input specification (Frey and Rhodes, 1999). One advantage of using Monte Carlo 3143
sampling is that, with a sufficient sample size, it provides an excellent approximation of the output 3144
distribution. Also, since it is a random sampling technique, the resulting distribution of values can be 3145
analysed using standard statistical methods (Burmaster and Anderson, 1994). In a Monte Carlo 3146
simulation the model combining the input distributions is recalculated many times with random 3147
samples of each distribution to produce numerous scenarios or iterations. Each set of model results or 3148
outputs represents a scenario that could occur and the joint distribution of output parameters is a 3149
representation of the variability and/or uncertainty in the outputs. 3150
In this analysis, Monte Carlo sampling techniques have been used to propagate probabilistic factor 3151
inputs through the equation estimated via the regression analysis to generate a probability distribution 3152
for iron losses. The issue of correlation among variables whose distributions are combined is not 3153
addressed in the following since explanatory variables with limited association were selected for the 3154
regression analysis. 3155
The approach foresees the following steps to be performed: 3156
a parametric probability distribution is fitted to the observed data for each input factor 3157
included in the regression model. Since regression parameters are affected by sampling 3158
uncertainty, a distribution is used to account for it; 3159
the fitted distributions are combined in the equation model estimated via the regression 3160
analysis using Monte Carlo sampling techniques; 3161
a distribution for iron losses is estimated; 3162
estimates of the percentiles of the distribution are provided as a basis for computing the AR 3163
and PRI. 3164

Draft Dietary Reference Values for iron
EFSA Journal 20YY;volume(issue):NNNN 97
9.6. Probability distribution for the explanatory variables 3165
The probabilistic distributions for the explanatory variables: 3166
metabolic body weight; 3167
turnover rate 3168
have been fitted on the data from Hunt et al. (2009). 3169
A normal distribution was used for modelling variability in metabolic body weight. Visual analysis of 3170
the data confirmed that this is a reasonable choice. The median and standard deviation of the observed 3171
data after removal of the outlier were taken as mean and standard deviation of the normal distribution. 3172
The median was preferred over the mean since it is more robust with respect to extreme values of the 3173
distribution. Truncation was applied (22, 39) in order to avoid unrealistic values. 3174
The Beta distribution is used for fitting turnover rate. In fact, the Beta distribution, bound by the 3175
interval between 0 and 1, is useful for representing variability in a fraction that cannot exceed 1. 3176
Because the Beta distribution can take on a wide variety of shapes, such as negatively skewed, 3177
symmetric, and positively skewed, it can represent a large range of empirical data. The sampling 3178
median and standard deviation obtained after removal of the outlier were assumed to be the true mean 3179
and standard deviation of the distribution. The shape parameters of the Beta distribution were derived 3180
from them using the method of matching moments (Frey and Rhodes, 1999): 3181
3182
1
1ˆ
2s
XXX 3183
3184
1
11ˆ
2s
XXX
,
3185
where X and 2s are the sampling mean and variance and 3186
and are the estimates of the parameters of the Beta distribution. 3187
3188
It was assumed that the uncertainty in the regression coefficients β0, β1, β2 could be well represented 3189
using a Pert distribution assigning the largest probability to the central value of the estimated 3190
confidence intervals and decreasing probabilities to the other values included between the lower and 3191
upper bound of the confidence interval. 3192
A description of the distributions used for the input factors and the specification of whether they 3193
model variability or uncertainty is provided in Table 25. 3194

Draft Dietary Reference Values for iron
EFSA Journal 20YY;volume(issue):NNNN 98
Table 25: Fitted distributions for the explanatory variables and regression coefficients 3195
Input Factor V/U (a)
Distribution Unit
Distribution of metabolic body weight (X1) V ~Normal(29, 3.6) truncated (22, 39) kg
Distribution of turnover rate (X2) V ~ Beta(6.661, 63.642) truncated (0.02, 0.16)
Intercept (β0) U ~Pert(-1.61, -1.39, -1.17) mg/day
Metabolic body weight regression
coefficient (β1) U ~Pert(0.039, 0.046, 0.053)
mg/day
per kg
Turnover rate regression coefficient (β2) U ~Pert(10.41, 11.15, 11.88) mg/day
per rate
(a): V, variability; U, uncertainty. 3196 3197
The distributions of metabolic body weight and turnover rate are provided in Figures 13–16 (in 3198
couples, frequency distribution based on data and fitted distribution obtained via simulation). Fitted 3199
distributions for the regression coefficients are shown in Figures 17–19. 3200
3201
Figure 13: Frequency distribution of metabolic body weight in the sample of men 3202
3203
Figure 14: Probability distribution of metabolic body weight 3204

Draft Dietary Reference Values for iron
EFSA Journal 20YY;volume(issue):NNNN 99
3205
Figure 15: Frequency distribution of turnover rate in the sample of men 3206
3207
Figure 16: Probability distribution of turnover rate 3208
3209
Figure 17: Probability distribution of intercept 3210
3211
Figure 18: Probability distribution of regression coefficient for metabolic body weight 3212

Draft Dietary Reference Values for iron
EFSA Journal 20YY;volume(issue):NNNN 100
3213
Figure 19: Probability distribution of regression coefficient for turnover rate 3214
10. Results – Men 3215
A distribution of daily iron losses is obtained by combining the probability distributions for the 3216
explanatory variables and regression coefficients into equation [1]. From the distribution it is possible 3217
to derive percentiles of interest. 3218
3219
Figure 20: Distribution of iron losses – 90th percentile 3220
3221
Figure 21: Distribution of iron losses – 95th percentile 3222
3223

Draft Dietary Reference Values for iron
EFSA Journal 20YY;volume(issue):NNNN 101
3224
Figure 22: Distribution of iron losses – 97.5th percentile 3225
3226
Figure 23: Distribution of iron losses – 50th percentile 3227
The 90th, 95
th and 97.5
th percentiles of iron losses (Figure 20–22) are, respectively, equal to around 3228
1.48, 1.61 and 1.72 mg/day. The 50th percentile of the distribution is equal to around 0.95 mg/day 3229
(Figure 23). 3230
11. Statistical analysis – Menstruating women 3231
11.1. Summary statistics 3232
Summary statistics for the group of menstruating women are provided in Table 26. 3233
Table 26: Summary statistics for menstruating women 3234
Variable Number Mean Standard
deviation
Median Minimum Maximum
Initial age (years) 20 39.37 5.08 38.55 30.19 46.63
Body weight (kg) 20 72.41 11.04 73.05 52.00 87.60
BMI (kg/m2) 20 27.43 4.70 27.39 18.65 36.16
Metabolic body weight (kg) 20 24.77 2.86 24.99 19.36 28.63
Iron losses (mg/day) 20 1.90 1.22 1.55 0.57 4.88
Iron losses (µg/kg actual body
weight per day)
20 26.36 17.54 20.58 9.03 75.17

Draft Dietary Reference Values for iron
EFSA Journal 20YY;volume(issue):NNNN 102
Variable Number Mean Standard
deviation
Median Minimum Maximum
Biological half-life of iron (years) 20 3.61 1.85 3.76 0.72 7.46
Turnover rate (rate/year) 20 0.28 0.22 0.18 0.09 0.96
Serum ferritin (µg/L) 20 47.77 40.30 33.38 6.58 148.75
3235
The median body weight of about 72 kg and the median BMI of about 27 kg/m2 of this sample of 3236
North-American healthy adult menstruating women is larger than the corresponding values in the EU 3237
adult female population (measured median body weight in 19 998 women aged 18–79 years is 3238
65.1 kg; median BMI is 24.5 kg/m2) (EFSA NDA Panel, 2013). This difference could introduce a bias 3239
in estimating the population mean of iron losses with a regression model. As a mitigation action it was 3240
decided to use the metabolic body weight instead. In addition, it was considered appropriate to 3241
perform a sensitivity analysis at the end of the process in order to assess the influence of this input 3242
variable on the estimate of iron losses. 3243
The values of 0.7 years for iron biological half-life (subject 14) and 0.96 for iron turnover rate (same 3244
subject) appear extreme with respect to the mean of the sample (3.6 and 0.28, respectively). An 3245
investigation of the possibility that this subject represents an outlier was performed (Section 11.4). 3246
The same summary statistics have also been computed for the group of menstruating women taking 3247
hormonal birth control measures to investigate whether they differ in some respect from the rest of the 3248
group, and are reported in Table 27. 3249
Table 27: Summary statistics for menstruating women taking hormonal birth control measures 3250
Variable Number Mean Standard
deviation
Median Minimum Maximum
Age (years at start) 5 35.25 3.23 36.42 30.19 38.72
Body weight (kg) 5 71.88 15.03 77.30 52.00 87.60
Metabolic body weight (kg) 5 24.60 3.92 26.07 19.36 28.63
Iron losses (mg/day) 5 1.01 0.25 1.09 0.57 1.15
Iron losses (µg/kg actual body
weight per day)
5 14.06 3.03 13.30 10.89 18.81
Biological half-life of iron (year) 5 5.16 1.12 5.72 3.96 6.36
Turnover rate (rate/year) 5 0.14 0.03 0.12 0.11 0.18
Serum ferritin (µg/L) 5 66.60 56.26 46.85 10.90 148.75
3251
11.2. Assessing association among variables 3252
A Pearson correlation coefficient was estimated in order to assess the linear correlation among iron 3253
losses (mg/day) and potential explanatory factors metabolic body weight, iron biological half-life, 3254
iron turnover rate, serum ferritin concentration. As for men, the variables with the highest level of 3255
association are turnover rate and biological half-life, which are also highly correlated (-0.81). The 3256
turnover rate was retained because it had the highest level of linear correlation. Metabolic body 3257
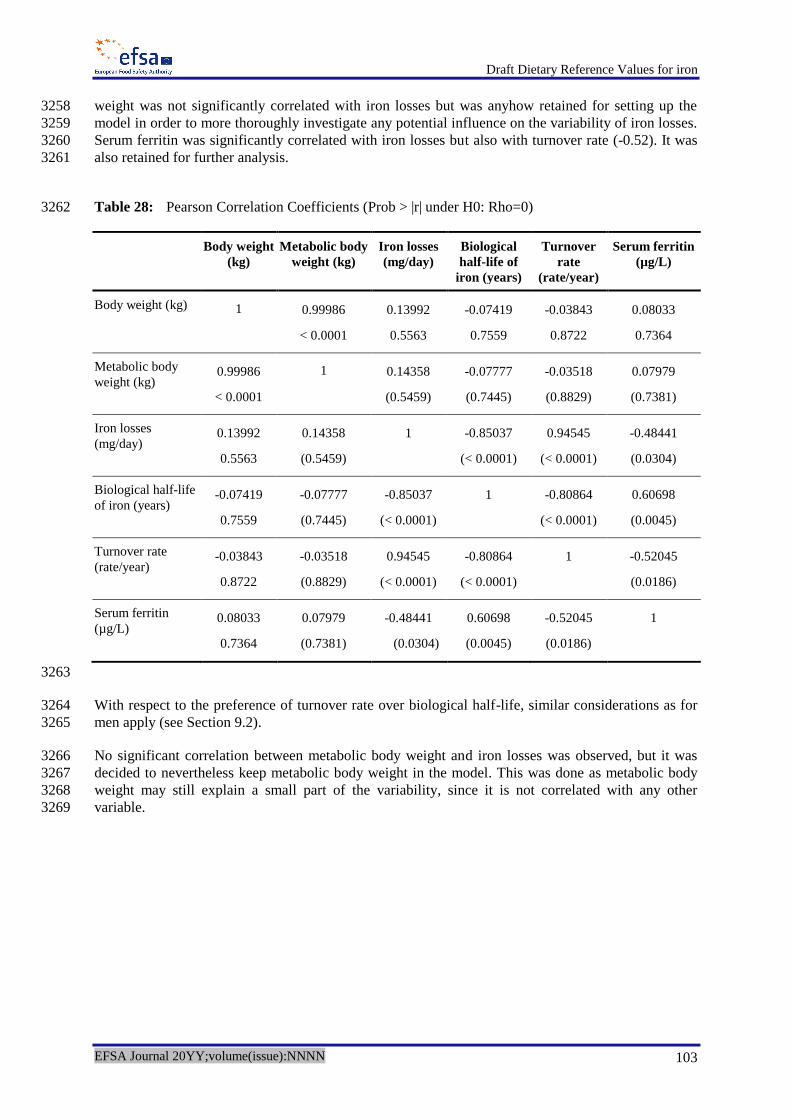
Draft Dietary Reference Values for iron
EFSA Journal 20YY;volume(issue):NNNN 103
weight was not significantly correlated with iron losses but was anyhow retained for setting up the 3258
model in order to more thoroughly investigate any potential influence on the variability of iron losses. 3259
Serum ferritin was significantly correlated with iron losses but also with turnover rate (-0.52). It was 3260
also retained for further analysis. 3261
Table 28: Pearson Correlation Coefficients (Prob > |r| under H0: Rho=0) 3262
Body weight
(kg)
Metabolic body
weight (kg)
Iron losses
(mg/day)
Biological
half-life of
iron (years)
Turnover
rate
(rate/year)
Serum ferritin
(µg/L)
Body weight (kg) 1 0.99986
< 0.0001
0.13992
0.5563
-0.07419
0.7559
-0.03843
0.8722
0.08033
0.7364
Metabolic body
weight (kg) 0.99986
< 0.0001
1 0.14358
(0.5459)
-0.07777
(0.7445)
-0.03518
(0.8829)
0.07979
(0.7381)
Iron losses
(mg/day) 0.13992
0.5563
0.14358
(0.5459)
1
-0.85037
(< 0.0001)
0.94545
(< 0.0001)
-0.48441
(0.0304)
Biological half-life
of iron (years) -0.07419
0.7559
-0.07777
(0.7445)
-0.85037
(< 0.0001)
1
-0.80864
(< 0.0001)
0.60698
(0.0045)
Turnover rate
(rate/year) -0.03843
0.8722
-0.03518
(0.8829)
0.94545
(< 0.0001)
-0.80864
(< 0.0001)
1
-0.52045
(0.0186)
Serum ferritin
(µg/L) 0.08033
0.7364
0.07979
(0.7381)
-0.48441
(0.0304)
0.60698
(0.0045)
-0.52045
(0.0186)
1
3263
With respect to the preference of turnover rate over biological half-life, similar considerations as for 3264
men apply (see Section 9.2). 3265
No significant correlation between metabolic body weight and iron losses was observed, but it was 3266
decided to nevertheless keep metabolic body weight in the model. This was done as metabolic body 3267
weight may still explain a small part of the variability, since it is not correlated with any other 3268
variable. 3269

Draft Dietary Reference Values for iron
EFSA Journal 20YY;volume(issue):NNNN 104
3270
Figure 24: Scatter plot and frequency distribution 3271
11.3. Setting up a regression model 3272
As for men a linear regression model was used in order to explain iron losses in menstruating women. 3273
Based on previous correlation analysis, metabolic body weight, turnover rate and serum ferritin 3274
concentration were considered as potential covariates that might have an effect on the output and have 3275
limited autocorrelation among them. 3276
The form of the model is given in equation [2] 3277
ii XXXY 3322110 [2] 3278
Where: 3279
Yi is iron losses (in mg/day) 3280
j are regression coefficients for the explanatory factors 3281
X1 is metabolic body weight 3282
X2 is turnover rate 3283
X3 is serum ferritin concentration 3284
i is the random error term on individual i-th with 2,0 N 3285

Draft Dietary Reference Values for iron
EFSA Journal 20YY;volume(issue):NNNN 105
The goodness of fit of the model was assessed using as indicators the adjusted R-square and the 3286
Akaike (AIC) and Bayesian (BIC) information criteria. Normality of the residuals was assessed 3287
graphically. 3288
The ouput of model fitting is reported in Tables 29–31. 3289
Table 29: Analysis of variance 3290
Source Degree of
freedom
Sum of
squares
Mean
square
F value Pr > F
Model 3 26.34716 8.78239 65.97 <.0001
Error 16 2.12998 0.13312
Corrected total 19 28.47713 19
Table 30: Indicators for goodness of fit 3291
Root mean-square error 0.36486 R square 0.9252
Dependent mean 1.89619 Adjusted R square 0.9112
Coefficient of variation 19.24176 Akaike (AIC) -38.79
Bayesian (BIC) -35.8
Table 31: Parameter estimates 3292
Variable Parameter
estimate
Standard
error
Lower
95 % CI
Upper
95 % CI
Pr > |t|
Intercept -1.47222 0.75311 -3.06874 0.12431 0.0683
Metabolic body weight (kg) 0.07594 0.02937 0.01367 0.13821 0.0199
Turnover rate (rate/year) 5.39667 0.45518 4.43173 6.36160 < 0.0001
Serum ferritin (µg/L) -0.00013562 0.00244 -0.00531 0.00503 0.9563
CI, confidence interval 3293 3294
Metabolic body weight and turnover rate came out to be significantly explaining the variance of iron 3295
losses, the intercept was marginally insignificant and was kept in the model. Serum ferritin 3296
concentration is not significant when the other variables are in the model. 3297
11.4. Outlier analysis 3298
Graphical diagnostics for detection of outliers are reported in Figure 25. Two individuals had 3299
externally studentised residuals well outside the range (-3; +3). These are subject 14 and 16. 3300

Draft Dietary Reference Values for iron
EFSA Journal 20YY;volume(issue):NNNN 106
Table 32: Outlier analysis for menstruating women 3301
Subject Iron losses Turnover
rate
Biological
half-life
Metabolic
body weight
Serum
ferritin
Cook D Externally
studentised
residuals
14 4.64 0.96 0.72 22 8.30 5 -5.7
16 4.88 0.63 1.10 25 26.7 0.65 5.4
3302
The Panel considered it appropriate to exclude the subjects from the analysis. 3303
3304
Figure 25: Diagnostics for detection of outliers 3305
Summary statistics of the main factors in menstruating women after removal of outliers are reported 3306
in Table 33. 3307
Table 33: Summary statistics after removal of outliers – menstruating women 3308
Variable Number Mean Standard
deviation
Median Minimum Maximum
Initial age (years) 18 38.67 4.85 37.72 30.19 46.63
Body weight (kg) 18 72.94 11.36 74.90 52.00 87.60

Draft Dietary Reference Values for iron
EFSA Journal 20YY;volume(issue):NNNN 107
Variable Number Mean Standard
deviation
Median Minimum Maximum
BMI (kg/m2) 18 27.57 4.90 27.79 18.65 36.14
Metabolic body weight (kg) 18 24.90 2.94 25.46 19.36 28.63
Iron losses (mg/day) 18 1.58 0.78 1.53 0.57 3.67
Iron losses (µg/kg actual body
weight per day)
18 21.43 9.20 19.61 9.03 44.16
Biological half-life of iron (years) 18 3.91 1.69 3.90 1.32 7.46
Turnover rate (rate/year) 18 0.22 0.12 0.18 0.09 0.52
Serum ferritin (µg/L) 18 51.13 41.05 36.61 6.58 148.75
11.5. Model estimates without outliers 3309
After exclusion of the outliers, the change in goodness of fit indicators was negligible. The revised 3310
parameter estimates are reported in Table 34. 3311
Table 34: Parameter estimates after exclusion of two outliers 3312
Variable Parameter
estimate
Standard
error
Lower
95 % CI
Upper
95 % CI
Pr > |t|
Intercept -1.08987 0.33011 -1.79349 -0.38624 0.0048
Metabolic body weight (kg) 0.05460 0.01359 0.02564 0.08356 0.0011
Turnover rate (rate/year ) 5.95745 0.33714 5.23885 6.67605 < 0.0001
3313
The revised model [2a] includes only two explanatory variables significantly explaining the 3314
variability of iron losses: 3315
ii XXY 22110 [2a] 3316
The other assumptions remain fixed. 3317
11.6. Estimate the distribution of iron losses via a probabilistic model 3318
Following the same approach as for men, the following steps have been performed: 3319
a parametric probability distribution is fitted to the observed data for each input factor 3320
included in the regression model. Since regression parameters are affected by sampling 3321
uncertainty, a distribution is used to account for it; 3322
the fitted distributions are combined in the equation model estimated via the regression 3323
analysis using Monte Carlo sampling techniques; 3324
a distribution for iron losses is estimated; 3325
estimates of the percentiles of the distribution are provided as a basis for computing the AR 3326
and PRI. 3327

Draft Dietary Reference Values for iron
EFSA Journal 20YY;volume(issue):NNNN 108
11.7. Probability distribution for the explanatory variables 3328
The probabilistic distributions for the explanatory variables: 3329
metabolic body weight; 3330
turnover rate 3331
have been fitted on the data from Hunt et al. (2009). 3332
In the group of menstruating women the distribution of metabolic body weight is bimodal. This is 3333
probably due to a large frequency in the sample of women of high body weight that could raise doubts 3334
on the representativeness of the sample with respect to the target population. A mixture of two normal 3335
distributions with means and standard deviations of 22, 2 and 28, 2, respectively, was used in order to 3336
fit the observed data after exclusion of outliers. The sampling median and standard deviation were 3337
taken as mean and standard deviation of the combined normal distribution. Truncation was applied in 3338
order to avoid unrealistic values (20,26) and (24,29). 3339
The Beta distribution was used to fit the turnover rate. The same reason as for men applies here. 3340
Sampling median and standard deviation obtained after removal of the outliers were assumed to be 3341
mean and standard deviation of the population distribution. 3342
It was assumed that the uncertainty in the regression coefficients β0, β1, β2 could be well represented 3343
using a Pert distribution assigning the largest probability to the central value of the estimated 3344
confidence intervals and decreasing probabilities to the other values included in the lower and upper 3345
bound of the confidence interval. 3346
A description of the distributions used for the input factors and the specification of whether they 3347
model variability or uncertainty is provided in Table 35. 3348
Table 35: Fitted distributions for the explanatory variables and regression coefficients 3349
Input Factor V/U (a)
Distribution Unit
Distribution of metabolic body weight (X1) V ~Bimodal(0.5*Normal(22,2) truncated (20,26),
0.5*Normal(28,2) truncated (24,29)) kg
Distribution of turnover rate (X2) V ~ Beta(1.845,8.540) truncated (0.04,0.6)
Equation intercept (β0) U ~Pert(-1.79, -1.090, -0.386) mg/day
Metabolic body weight regression coefficient
(β1) U ~Pert(0.026, 0.055, 0.084)
mg/day per
kg
Turnover rate regression coefficient (β2) U ~Pert(5.239, 5.957, 6.676) mg/day per
rate
(a): V, variability; U, uncertainty. 3350 3351
The same methodology as for men was applied to generate the distributions for metabolic body 3352
weight, turnover rate and regression coefficients. 3353
The distributions of metabolic body weight and turnover rate are provided in Figures 26–29 (in 3354
couples, frequency distribution based on data and fitted distribution obtained via simulation). Fitted 3355
distributions for the regression coefficients are shown in Figures 30–32. 3356

Draft Dietary Reference Values for iron
EFSA Journal 20YY;volume(issue):NNNN 109
3357
Figure 26: Frequency distribution of metabolic body weight in the sample of menstruating women 3358
3359
Figure 27: Probability distribution of metabolic body weight 3360
3361
Figure 28: Frequency distribution of turnover rate in the sample of menstruating women 3362

Draft Dietary Reference Values for iron
EFSA Journal 20YY;volume(issue):NNNN 110
3363
Figure 29: Probability distribution of turnover rate 3364
3365
Figure 30: Probability distribution of intercept 3366
3367
Figure 31: Probability distribution of regression coefficient for metabolic body weight 3368
3369
Figure 32: Probability distribution of regression coefficient for turnover rate 3370

Draft Dietary Reference Values for iron
EFSA Journal 20YY;volume(issue):NNNN 111
12. Results – Menstruating women 3371
A distribution of daily iron losses is obtained by combining the probability distributions for the 3372
explanatory variables and regression coefficients into equation [2a]. From the distribution it is 3373
possible to derive percentiles of interest. 3374
3375
Figure 33: Distribution of iron losses – 90th percentile 3376
3377
Figure 34: Distribution of iron losses – 95th percentile 3378
3379
Figure 35: Distribution of iron losses – 97.5th percentile 3380

Draft Dietary Reference Values for iron
EFSA Journal 20YY;volume(issue):NNNN 112
3381
Figure 36: Distribution of iron losses – 50th percentile 3382
The 90th, 95
th and 97.5
th percentiles of iron losses (Figure 33–35) are, respectively, equal to around 3383
2.44, 2.80 and 3.13 mg/day. The 50th percentile of the distribution is equal to around 1.34 mg/day 3384
(Figure 36). 3385
INTERPRETATION OF THE RESULTS 3386
13. Sources of uncertainty and their potential impact on the final estimates 3387
13.1. Definitions and general concepts 3388
In the EFSA context the term uncertainty is intended to cover “all types of limitations in the 3389
knowledge available to assessors at the time an assessment is conducted and within the time and 3390
resources agreed for the assessment” (EFSA Scientific Committee draft Guidance on Uncertainty in 3391
Risk Assessment, unpublished). The need to address uncertainty is expressed in the Codex Working 3392
Principles for Risk Analysis. These state that “constraints, uncertainties and assumptions having an 3393
impact on the risk assessment should be explicitly considered at each step in the risk assessment and 3394
documented in a transparent manner” (Codex, 2015). The Scientific Committee of EFSA explicitly 3395
endorsed this principle in its Guidance on Transparency in Risk Assessment (EFSA, 2009). 3396
In the risk assessment process it is important to characterise, document and explain all types of 3397
uncertainty arising in the process to allow risk managers to properly interpret the results. 3398
Ideally, analysis of the uncertainty would require the following steps: 3399
1. identifying uncertainties; 3400
2. describing uncertainties; 3401
3. assessing individual sources of uncertainty; 3402
4. assessing the overall impact of all identified uncertainties on the assessment output, taking 3403
account of dependencies; 3404
5. assessing the relative contribution of individual uncertainties to overall uncertainty; 3405
6. documenting and reporting the uncertainty analysis. 3406
Uncertainty can be expressed adopting six main approaches: descriptive expression, ordinal scales, 3407
sets, bounds, ranges, and distributions. The first and second of these are qualitative, while the other 3408
four quantify uncertainty to an increasing extent. 3409

Draft Dietary Reference Values for iron
EFSA Journal 20YY;volume(issue):NNNN 113
An EFSA Working Group is currently working on the provision of guidelines on how the uncertainty 3410
analysis should be performed in a harmonised and structured way. Since the activity is ongoing, in the 3411
current risk assessment, only the first two steps (i.e. identification and description) will be considered 3412
in analysing the uncertainty. This will include stating which assumptions have been made in the 3413
various steps of the risk assessment, if any. 3414
The Panel aimed to assess, in a qualitative way, the potential impact of the individual sources of 3415
uncertainty on the final outcome and, possibly, on the combined impact of the multiple uncertainties. 3416
13.2. Identification and description of the sources of uncertainty 3417
The model used to set up the estimates that served as a basis for the AR and PRI relies on some 3418
assumptions about the structure of the regression model (i.e. explanatory variables and linearity of the 3419
relationship). These assumptions have an influence on the final results in the sense that they 3420
determine the equation used as a basis for further probabilistic modelling. In addition, the structure of 3421
the regression model determines the size of the confidence intervals for the regression parameters and, 3422
consequently, their lower and upper bounds that are used as reference for the Pert distributions fitted 3423
to them. Different choices may lead to different results. The Panel considers that the fitting of the 3424
regression model is quite good for both groups (men and menstruating women), which is reassuring. 3425
Some limitations in the data represent a potential source of uncertainty that could introduce a bias in 3426
the final estimates. Observations were taken on North-American healthy adult subjects. The 3427
assumption of their representativeness for the EU healthy adult population may not be completely 3428
met, especially as far as the distribution of body weights is concerned. The small size of the sample is 3429
an additional source of uncertainty that could affect the true shape and variability of the distribution 3430
of the variables involved in the assessment. Further research would be needed in order to collect more 3431
data of this kind. Sources of uncertainty and their potential impact are described in Table 36. 3432
Table 36: Sources of uncertainty and their potential impact on the estimates 3433
Outcome Source of uncertainty Direction of the effect on the
outcome
Estimates of the body weight, BMI
and metabolic body weight, iron
losses and various serum
parameters
Lack of information about:
How repeated measures on
the same individual (2–6
observations per subject taken
during the study) have been
summarised
Aspects related to dietary
consumption and life-style
have not been measured
It is difficult to evaluate the impact
of this on the estimate of the
distribution of iron losses.
Representativeness of the healthy
European adult population
Individuals were North-American
subjects with body weight on
average larger than that of the EU
population.
The representativeness of the
sample in terms of aspects that
might impact on iron losses is
difficult to assess.
The percentiles of the body weight
distribution for both men and
menstruating women are larger than
those of the corresponding EU
population. Due to the linear
positive relationship assumed
between body weight and iron
losses, possible direction of the
impact of this source of uncertainty
would be to overestimate the
percentiles of the distribution of
iron losses. As a mitigation action a

Draft Dietary Reference Values for iron
EFSA Journal 20YY;volume(issue):NNNN 114
Outcome Source of uncertainty Direction of the effect on the
outcome
sensitivity analysis is performed to
evaluate how much of the
variability in iron losses is
attributable to variations in
metabolic body weight.
Since information is lacking on
other aspects characterising the
sample, it is not possible to predict
the impact of potential differences.

Draft Dietary Reference Values for iron
EFSA Journal 20YY;volume(issue):NNNN 115
ABBREVIATIONS 3434
Afssa Agence française de sécurité sanitaire des aliments
AI Adequate Intake
AR Average Requirement
C ascorbic acid (vitamin C)
CI confidence interval
COMA UK Committee on Medical Aspects of Food Policy
CV coefficient of variation
D–A–CH Deutschland–Austria–Confoederatio Helvetica
DcytB/Ferric Reductase duodenal cytochrome B reductase
DMT divalent metal transporter
DRV Dietary Reference Value
EAR Estimated Average Requirement
EDTA ethylenediaminetetraacetic acid
EU European Union
F female
FAO Food and Agriculture Organization
FFQ food frequency questionnaire
Hb haemoglobin
HCP 1 haem carrier protein 1
HIF hypoxaemia inducible factor
HJV haemojuvelin
HRT hormone replacement therapy
IOM U.S. Institute of Medicine of the National Academy of Sciences
IRE iron-responsive elements
IRP iron-responsive proteins
ISC iron-sulfur cluster

Draft Dietary Reference Values for iron
EFSA Journal 20YY;volume(issue):NNNN 116
LOAEL Lowest Observed Adverse Effect Level
LRNI Lower Reference Nutrient Intake
M male
MCH mean cell haemoglobin
MCV mean corpuscular volume
MFP meat, fish and poultry
mRNA messenger ribonucleic acid
NH non-haem iron
NHANES National Health and Nutrition Examination Survey
NNR Nordic Nutrition Recommendations
NOAEL No Observed Adverse Effect Level
P phytate
PRI Population Reference Intake
RDA Recommended Dietary Allowance
RES reticuloendothelial system
RNI Recommended Nutrient Intake
SACN
SCF
UK Scientific Advisory Committee on Nutrition
Scientific Committee for Food
SD standard deviation
SE standard error
SF serum ferritin
sTfR soluble serum transferrin receptor
T tea
TfR transferrin receptor
TIBC total iron binding capacity
TSAT transferrin saturation
UL Tolerable Upper Intake Level

Draft Dietary Reference Values for iron
EFSA Journal 20YY;volume(issue):NNNN 117
WHO World Health Organization
ZPP erythrocyte zinc protoporphyrin
3435