science, technology and innovation in egypt · of scientific research and technology (asrt) is...
TRANSCRIPT

Science, Technology and Innovationin EgyptStatus Brief
The Egyptian Center for the Advancement of Science, Technology, and Innovation
June 2014

AbouT uS
SCopE of ThE rEporT
InTroduCTIon
ThE EgypTIAn STI SySTEm: KEy ACTorS
nATIonAl CompETITIvEnESS And InnovATIon pErformAnCE
3.1. global Competitiveness Index3.1.1. definition of Competitiveness3.1.2. Trends in Egypt’s Competitiveness ranking3.2. global Innovation Index
rElATIonShIp bETwEEn InduSTry And r&d
4.1. Company Spending on r&d4.2. Academia and Industry
goIng forwArd
4
5
6
8
10
20
24
123
4
5

ScopE of ThE rEporT
This report is based on consolidating
national and international studies about Egypt’s position in STI and its impact on the socio-economic development of the country, with additional analysis by ECASTI. It examines the Egyptian STI system, assesses this system based on the global Competitiveness Index and the global Innovation Index, and finally arrives at a set of recommendations to move forward.
WhaT IS ThE EgypTIan cEnTEr for ThEadvancEmEnT of ScIEncE, TEchnolgy, and InnovaTIon (EcaSTI)?
The Egyptian Center for the Advancement of Science, Technology and Innovation (ECASTI) is a start-up non-governmental foundation aiming to enhance the framework of Science and Innovation in Egypt and monitor the country’s performance in this field. ECASTI is registered under number 9312 for the year 2013.
during this critical phase in Egypt’s history, it is essential that we integrate Science, Technology, and Innovation (STI) into national development policies and the economic reform agenda, using the efforts of all actors and stakeholders to build Egypt’s renaissance. government cannot be expected to take the full responsibility for the Scientific research and Innovation System; rather, the private sector and civil society organizations have a key role to play in driving STI in Egypt.
In this context, the role of ECASTI becomes particularly important. our mission is to “consolidate and increase the importance of STI and its outcomes in Egyptian society in order to achieve sustainable socio-economic development that is commensurate with the aspirations of this nation.”
for more information about ECASTI, kindly visit our website at www.ecasti.org.

Egypt is the cradle of civilization. This is not an empty motto or a cliché, but a historical fact that some may forget in light of the challenges the country has faced in recent years. however, with the advent of the January 25 revolution came a renewed hope for Egypt and an opportunity for revival, one that can only be built through innovation and hard work.
Experiences of “developing” countries that have become significant economic powers show that such transformation can only be achieved through an integrated ecosystem driving innovation and linking the various stakeholders. This ecosystem includes not only innovative technology generation, but also supportive laws and legislation that incentivize innovation and reward success, a venture capital system, as well as financial, material and human resources. Such an innovation ecosystem is the foundation of global competitiveness.
while significant effort has gone into attempting to build a technology-driven economy, these efforts have not achieved the anticipated success for many reasons, chief amongst which is the absence of this integrated ecosystem serving a clearly defined national vision. Egypt, like most developing countries, is therefore a consumer and not a producer of technology. Consequently, it is essential to recognize the importance of the local production of new technologies and its impact on Egyptian national sovereignty and security. In this report, we present the key existing components in the ecosystem and the current performance of Egypt as a first step to identifying the way forward.
InTroduCTIon1

Egypt’s STI system is characterized by a high degree of centralization and domination by the public sector. At the top, we have the higher council for Science and Technology, consisting of a panel of ministers and experts (including expatriate scientists) that are re-elected every three years. This council is responsible for identifying Egypt’s developmental priorities and the science and technology research strategy necessary to support them (bond, maram, Soliman, & Khattab, 2013).
The ministry of higher Education and Scientific research is responsible for implementing the national research policy and strategy of all public universities and research institutes (bond et. al, 2013).
The actual research and development field is largely the domain of state-run universities and research centers. According to a Scientific research Institutions map issued by the ministry of Scientific research (2010), the ministry has 13 affiliated research centers, in addition to those affiliated with public and private universities.
There are also a number of research centers affiliated with a range of other ministries:
• ministry of Communication and Information Technology (1 research center)• ministry of Investment (1 research center)• ministry of housing ( 3 research centers)• ministry of petroleum (6 research centers)• ministry of Trade and Industry (3 research centers)• ministry of Education (2 research centers)• ministry of Agriculture ( 24 research centers)• ministry of health and population (7 research centers)• ministry of Civil Aviation (1 research center)• ministry of Energy and Electricity (6 research centers)• ministry of water resources and Irrigation ( 15 research centers)• ministry of Transportation (2 research centers)
These centers are being reorganized under the umbrella of the Supreme council of Scientific research centers and Institutes in order to create more cohesion among their activities (bond et al., 2013).
within the ministry of higher Education and Scientific research, the academy of Scientific research and Technology (aSrT) is responsible for raising awareness and promoting scientific culture and thinking, assessing science and technology indicators, and encouraging the complete cycle of innovation (Academy of Scientific research and Technology, “Science, Technology, and Innovation System in Egypt”).
finally, there is also the Science and Technology development fund (STdf), a peer-review grant-awarding body that was modeled on germany’s dfg and which now serves as the main research funding channel in Egypt, a role previously occupied by the ASrT (bond et al., 2013).
In an independent exercise conducted by ECASTI, our research team has identified a total of 429 research centers in Egypt, including both publicly and privately-funded centers. figure 1 shows the distribution of these research centers among the various entities with which they are affiliated. The majority (60%) are affiliated with one of Egypt’s public universities. In fact, Cairo university alone claims nearly one quarter of all identified research centers.
figure 1: Affiliation of Identified research Centers
Cairo university
Ain Shams university
other public universities
private universities
government ministries
other government bodies
Independent Centers
private Sector
ThE EgypTIAn STI SySTEm: Key Actors
The Egyptian Center for the Advancement of Science, Technology, and Innovation
9
2

figure 2: The global Competitiveness Index framework
Source: schwab, K., World economic Forum (2013). the Global competitiveness report 2013-2014. Geneva: World economic Forum
nATIonAl CompETITIvEnESSAnd InnovATIon pErformAnCE3
After reviewing the main institutions shaping the STI field in Egypt, it is equally important to assess the effectiveness of the STI system and how it affects various aspects of the socio-economic reforms required at this critical stage of Egypt’s history. These can be assessed through two main comprehensive international indices:
• The global Competitiveness Index• The global Innovation Index
3.1. globAl CompETITIvEnESS IndEx
The world Economic forum's global Competitiveness Index (gCI) measures the competitiveness of various countries using more than 130 indicators. In publication for over 30 years, the gCI currently covers approximately 148 countries and is recognized as the most reliable international metric for benchmarking competitiveness.
prior to the January 25 revolution, Egypt’s social, institutional, and economic challenges were reflected in Egypt’s low ranking on the gCI. Its position has since deteriorated further, dropping by 11 positions to reach a ranking of 118 out of 148 countries in 2013-2014.
3.1.1. dEfInITIon of CompETITIvEnESSAccording to the 2013-2014 global Competitiveness report, competitiveness is defined as “the set of institutions, policies, and factors that determine the level of productivity of a country” (Schwab, 2013). This level of productivity determines the level of prosperity that can be achieved by an economy as well as the rates of return on investment, both of which are fundamental drivers of growth rates. An economy’s competitiveness therefore increases with the likelihood that it will grow faster over time (Schwab, 2013).
The gCI measures various aspects of competitiveness through weighted averages of a number of determinants that drive productivity, all of which are grouped into 12 pillars of competitiveness, shown in figure 2 (Schwab, 2013). These pillars, which are based on the economic theory of development stages, are not independent; rather, they tend to reinforce one another, wherein a weakness in one pillar often has a negative impact on others.
gloBal compETITIvEnESS IndEX
bASIC rEQuIrEmEnTS Sub-IndEx
EffICIEnCy EnhAnCErS Sub-IndEx
InnovATIon And SophISTICATIon fACTorS Sub-IndEx
pillar 1. Institutionspillar 2. Infrastructurepillar 3. macroeconomic enviromentpillar 4. health and primary education
Key forfactor-driven
economies
Key forefficiency-driven
economies
Key forinnovation-driven
economies
pillar 5. higher education and trainingpillar 6. goods market efficiancypillar 7. labor market efficiencypillar 8. financial market developmentpillar 9. Technological readinesspillar 10. market size
pillar 11. business sophisticationpillar 12. Innovation
According to this theory, countries go through three stages of economic development. In the first stage, economies are factor-driven and competitiveness is based on factor endowments, mainly low-skilled labor and natural resources. while firms sell basic products or commodities and compete on the basis of price, their low productivity is also reflected in low wages. At this stage, competitiveness is therefore dependent upon well-functioning public and private institutions (pillar 1), a well-developed infrastructure (pillar 2), a stable macroeconomic environment (pillar 3), and a healthy workforce with at least a basic education (pillar 4) (Schwab, 2013).
however, both productivity and wages increase as countries become more competitive and move into the efficiency-driven stage of development. At this stage, production processes become more efficient and product quality must improve in order to remain competitive as wages increase. Competitiveness is therefore powered by higher education and training (pillar 5), efficient goods markets (pillar 6), well-functioning labor markets (pillar 7), developed financial markets (pillar 8), the ability to harness the benefits of existing technologies (pillar 9), and a large domestic or foreign market (pillar 10) (Schwab, 2013).
finally, the increase in wages and associated standard of living will only be sustainable if businesses can compete with new and unique products (Schwab, 2013). Competitiveness then becomes driven by the use of sophisticated production processes (pillar 11) and the innovation of new ones (pillar 12) as countries enter the innovation-driven stage.
The Egyptian Center for the Advancement of Science, Technology, and Innovation
11

3.1.2. TrEndS In EgypT’S CompETITIvEnESS rAnKIng As noted earlier, Egypt dropped by 11 positions in this year’s gCI, ranking 118 out of 148 countries. This was likely influenced by Egypt’s continued transition, political instability, and deteriorating security situation since the January 25 revolution, all of which pose a challenge to the country’s competitiveness and economic growth. It is crucial to consider Egypt›s ranking in comparison to other relevant countries. In this report, we chose to contrast Egypt’s performance against that of Jordan as a comparable country, malaysia and Turkey as Islamic countries that have experienced significant advances, and Israel as the innovation leader in the middle East. Table 1 focuses on the pillars directly related to STI: primary education, higher education and training, labor market efficiency, and innovation. The bold numbers represent the highest rankings in the group.
The Egyptian Center for the Advancement of Science, Technology, and Innovation
12
Source: schwab, K., World economic Forum (2013). the Global competitiveness report 2013-2014. Geneva: World economic Forum.
Table 1: STI Indicators in the global Competitiveness Index
The Egyptian Center for the Advancement of Science, Technology, and Innovation
13
pillars directly influencing the STI Egyptian Ecosystem (according to the
2013-2014 gCI/148 countries)Egypt Jordan Israel malaysia Turkey
health and primary Education 100 65 38 33 59
primary enrollment 58 96 45 55 23
Quality of primary education 148 44 71 33 92
higher Education and Training 118 56 34 46 65
Secondary education enrollment 102 79 28 105 89
Tertiary education enrollment 82 70 32 62 46
Quality of the educational system 145 27 56 19 91
Quality of math and science education 145 30 78 27 101
Quality of management schools 145 47 42 35 101
Internet access in schools 125 44 39 36 63
Availability of research and training services 103 43 34 20 70
Extent of staff training 138 83 49 11 65
labor market Efficiency 146 101 57 25 130
redundancy costs, weeks of salary 136 14 124 110 128
reliance on professional management 137 86 50 21 66
Capacity to retain talent (brain drain) 133 53 49 20 78
Innovation 120 53 3 25 50
Capacity for innovation 111 69 4 15 45
Quality of scientific research institutions 127 62 1 27 63
Company spending in r&d 123 90 6 17 68
university – industry collaboration in r&d 133 85 8 16 52
gov. procurement of advancement tech products 116 51 9 4 23
Availability of scientists and engineers 54 7 8 19 53
pCT patents. application/million pop. 74 87 5 31 41
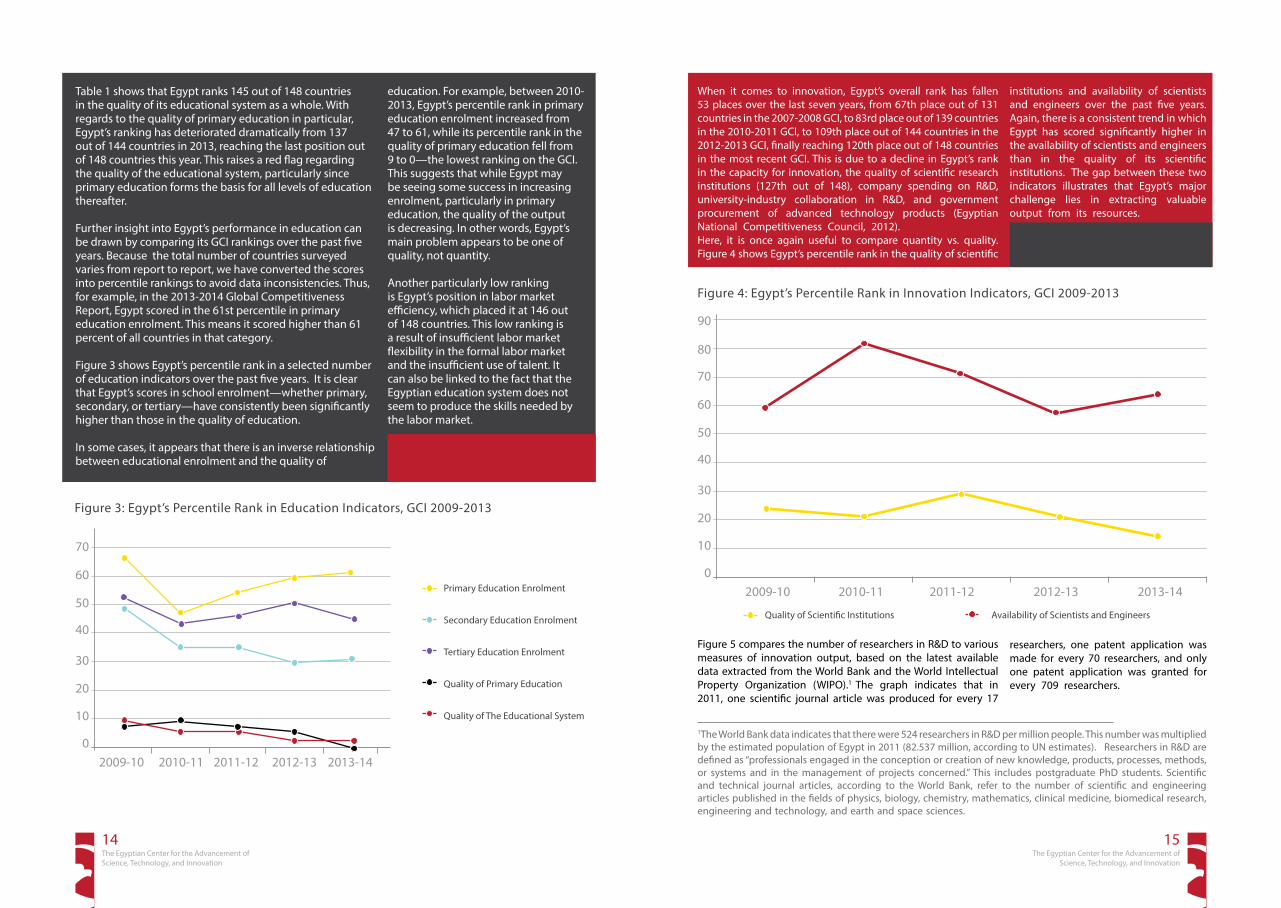
Table 1 shows that Egypt ranks 145 out of 148 countries in the quality of its educational system as a whole. with regards to the quality of primary education in particular, Egypt’s ranking has deteriorated dramatically from 137 out of 144 countries in 2013, reaching the last position out of 148 countries this year. This raises a red flag regarding the quality of the educational system, particularly since primary education forms the basis for all levels of education thereafter.
further insight into Egypt’s performance in education can be drawn by comparing its gCI rankings over the past five years. because the total number of countries surveyed varies from report to report, we have converted the scores into percentile rankings to avoid data inconsistencies. Thus, for example, in the 2013-2014 global Competitiveness report, Egypt scored in the 61st percentile in primary education enrolment. This means it scored higher than 61 percent of all countries in that category.
figure 3 shows Egypt’s percentile rank in a selected number of education indicators over the past five years. It is clear that Egypt’s scores in school enrolment—whether primary, secondary, or tertiary—have consistently been significantly higher than those in the quality of education.
In some cases, it appears that there is an inverse relationship between educational enrolment and the quality of
education. for example, between 2010-2013, Egypt’s percentile rank in primary education enrolment increased from 47 to 61, while its percentile rank in the quality of primary education fell from 9 to 0—the lowest ranking on the gCI. This suggests that while Egypt may be seeing some success in increasing enrolment, particularly in primary education, the quality of the output is decreasing. In other words, Egypt’s main problem appears to be one of quality, not quantity.
Another particularly low ranking is Egypt’s position in labor market efficiency, which placed it at 146 out of 148 countries. This low ranking is a result of insufficient labor market flexibility in the formal labor market and the insufficient use of talent. It can also be linked to the fact that the Egyptian education system does not seem to produce the skills needed by the labor market.
figure 3: Egypt’s percentile rank in Education Indicators, gCI 2009-2013
when it comes to innovation, Egypt’s overall rank has fallen 53 places over the last seven years, from 67th place out of 131 countries in the 2007-2008 gCI, to 83rd place out of 139 countries in the 2010-2011 gCI, to 109th place out of 144 countries in the 2012-2013 gCI, finally reaching 120th place out of 148 countries in the most recent gCI. This is due to a decline in Egypt’s rank in the capacity for innovation, the quality of scientific research institutions (127th out of 148), company spending on r&d, university-industry collaboration in r&d, and government procurement of advanced technology products (Egyptian national Competitiveness Council, 2012).here, it is once again useful to compare quantity vs. quality. figure 4 shows Egypt’s percentile rank in the quality of scientific
institutions and availability of scientists and engineers over the past five years. Again, there is a consistent trend in which Egypt has scored significantly higher in the availability of scientists and engineers than in the quality of its scientific institutions. The gap between these two indicators illustrates that Egypt’s major challenge lies in extracting valuable output from its resources.
figure 5 compares the number of researchers in r&d to various measures of innovation output, based on the latest available data extracted from the world bank and the world Intellectual property organization (wIpo).1 The graph indicates that in 2011, one scientific journal article was produced for every 17
researchers, one patent application was made for every 70 researchers, and only one patent application was granted for every 709 researchers.
1The world bank data indicates that there were 524 researchers in r&d per million people. This number was multiplied by the estimated population of Egypt in 2011 (82.537 million, according to un estimates). researchers in r&d are defined as “professionals engaged in the conception or creation of new knowledge, products, processes, methods, or systems and in the management of projects concerned.” This includes postgraduate phd students. Scientific and technical journal articles, according to the world bank, refer to the number of scientific and engineering articles published in the fields of physics, biology, chemistry, mathematics, clinical medicine, biomedical research, engineering and technology, and earth and space sciences.
The Egyptian Center for the Advancement of Science, Technology, and Innovation
14The Egyptian Center for the Advancement of
Science, Technology, and Innovation
15
primary Education Enrolment
Secondary Education Enrolment
Tertiary Education Enrolment
Quality of primary Education
Quality of The Educational System
0
10
20
30
40
2009-10 2011-12 2013-142010-11 2012-13
50
60
70
0
10
20
30
40
2009-10 2011-12 2013-142010-11 2012-13
50
60
70
80
90
figure 4: Egypt’s percentile rank in Innovation Indicators, gCI 2009-2013
Quality of Scientific Institutions Availability of Scientists and Engineers

figure 5: Innovation output Compared to Available researchers, 2011
Extracted from: the World Bank Databank and the WIPo.
3.2. globAl InnovATIon IndExAccording to the global Innovation Index (gII) of 2008-2009, innovation is “the amalgamation of invention and creativity that leads to the generation of social and economic value” (InSEAd, 2009). Alternatively, it can also be defined as “the implementation of a new or significantly improved product (good or service), or process, a new marketing method, or a new organizational method in business practices, workplace organization or external relations (oECd, 2010).
pillars of the global innovation Index like the gCI, the gII measures innovation using a number of pillars of innovation, shown in figure 6.
figure 6: global Innovation Index framework
Source: cornell University, INseAD, & WIPo (2013). the Global Innovation Index 2013: the Local Dynamics of Innovation. Geneva: World Intellectual Property organization (WIPo).
The Egyptian Center for the Advancement of Science, Technology, and Innovation
16The Egyptian Center for the Advancement of
Science, Technology, and Innovation
17
0
20000
61618
2,515
43,249
40000
researchersin r&d
Scientific & Technical Journal Articles
produced
resident patent Applications
resident patent grants
humancapital and
research
Education
Tertiaryeducation
research &development
Institutions
businessenvironment
regulatoryenvironment
politicalenvironment ICT
generalinfrastructure
Ecologicalsustainability
Infrastructure
Credit
Investment
Trade &competition
marketSophistication
Knowledgeabsorption
Innovationlinkages
Knowledgeworkers
BusinessSophistication
Knowledgediffusion
Knowledgeimpact
Knowledgecreation
Knowledge andtechnology
outputs
online Creativity
Creative goodsand services
Intangibleassets
creativeoutputs
gloBal InnovaTIon IndEX (average)
InnovaTIon EffIcIEncy raTIo (ratio)
Innovation InputSub-Index
Innovation outputSub-Index
Egypt’s overall ranking in the gII is 108 out of 142 countries. only four Arab countries ranked lower than Egypt on the gII: Syria, Algeria, Sudan and yemen. meanwhile, it ranks 17 out of 20 countries in north Africa and western Asia, while Israel is number 1. This indicates that Egypt has a much lower competitiveness in innovation even compared to its peers in the region.

Table 2: STI Indicators in the global Innovation Index
Source: cornell University, INseAD, & WIPo (2013). the Global Innovation Index 2013: the Local Dynamics of Innovation. Geneva : World Intellectual Property organization (WIPo).
pillars directly influencing the STI Egyptian ecosystem
(according to the 2013 gII / 142 countries)Egypt Jordan Israel malaysia Turkey
human Capital and research 81 53 8 40 76
Education 73 45 46 84 102
public expenditure/pupil, %gdp/capita 70 n/a 59 61 94
Tertiary education 103 56 36 15 78
Tertiary enrolment, % gross 73 67 30 58 43
research & development 56 57 3 41 43
researchers, headcounts/mn pop. 51 37 n/a 60 41
gross expenditure on r&d. %gdp 82 62 1 49 38
QS university ranking, average score top 3 45 55 21 29 42
business sophistication 99 47 5 27 108
Knowledge workers 67 79 11 43 81
Knowledge-intensive employment 34 n/a 28 65 76
firms offering formal training 85 82 n/a 30 67
r&d performed by business n/a n/a 1 32 37
r&d financed by business n/a n/a 41 1 31
Innovation linkages 74 18 2 52 111
university/industry research collaboration 122 91 8 17 69
State of cluster development 78 49 35 11 51
r&d financed by abroad n/a n/a 6 86 80
Knowledge absorption 132 91 73 3 115
fdI net inflows, % gdp 139 42 48 56 90
Knowledge and technology outputs 113 75 3 24 49
Knowledge creation 69 51 11 68 40
domestic resident patent 63 67 29 50 34
Citable documents h index 48 82 15 52 36
Knowledge Impact 114 92 20 30 29
growth rate of ppp$ gdp/worker, % 107 92 70 34 6
new businesses/th pop. 64–15 95 70 26 42 64
Computer software spending, % gdp 67 32 38 25 7
Knowledge diffusion 108 59 2 17 109
royalty & license fees receipts, % service exports 48 n/a 17 38 n/a
fdI net outflows, % gdp 70 84 43 11 66
Creative outputs 114 59 23 38 69
Creative goods and services 92 39 21 30 50
online Creativity 108 90 16 59 56
The Egyptian Center for the Advancement of Science, Technology, and Innovation
18The Egyptian Center for the Advancement of
Science, Technology, and Innovation
19
As with the gCI, we can compare Egypt’s ranking to other countries in the region as well as those at a similar stage of development. Table 2 compares Egypt to Israel, Jordan, malaysia, and Turkey. The underlined numbers represent strengths which, according to the gII, are ranks of 1 as well as all percent ranks greater than the 10th highest percent rank among the 84 indicators of the gII in a specific economy. The bold numbers represent weaknesses, which are all scores with percent ranks lower than the 10th smallest percent rank among the 84 indicators of the gII in a specific economy.
looking at Table 2, we find that Egypt does not hold a comparative advantage in any of the main innovation pillars, while Israel occupies the most advanced ranks in the majority of indicators, particularly those directly related to the production of r&d.
The quality and level of education and research activity are key determinants of a country’s innovation potential. when looking at the sub-indicators of the human capital and research pillar, we find that research and development in fact represent a source of strength in the Egyptian economy. however, this potential is not fully realized, as evidenced by other sub-indicators. Egypt’s lowest rankings are in university/industry collaboration (122) as well as knowledge absorption (132). moreover, there is no available information about r&d produced or financed by business, while Israel, for example, is number 1 in r&d conducted by business as well as gross expenditure on r&d (% gdp).
Although Israel is the only innovation leader in the region, Jordan joined the group of what the gII has termed “innovation learners.” These countries have demonstrated high levels of innovation due to improvements in their institutional framework, innovation structure, skilled labor force, credit investment and trade markets, and sophisticated business community, even if this progress is not uniform. on the other hand, Egypt, along with oman, Algeria, Kuwait, the united Arab Emirates, bahrain, yemen, Syria, and lebanon, was considered by the gII to have performed below par, normalized to its income level (Cornell university, InSEAd, & wIpo, 2013). Thus, Egypt once again faces the challenge of translating the available inputs into valuable outputs.
rElATIonShIp bETwEEn InduSTry And r&d4Science-based collaboration between academia and industry is key to addressing today’s global challenges. Successful partnerships between academic institutions and industry can be mutually beneficial, ensuring that research discoveries reach those who need them and serve the purposes for which they were made at affordable prices. moreover, the combined credibility and influence of academia and industry is more effective at achieving beneficial results for society than when each of these sectors works in isolation (Corillon & mahaffy, 2012). This collaboration is measured by the sub-pillar “innovation linkages” in the gII.
4.1. CompAny SpEndIng on r&dAs indicated by both the gCI and gII, Egypt has a low ranking with regard to
company spending on r&d, occupying the 123rd position on the gCI. This rank can be brought into perspective when compared to Israel, for example, which occupies the 6th position in the same indicator. meanwhile, there was no information available on r&d financed and performed by business in the gII, though we find that malaysia ranks number 1 in r&d financed by business and Israel ranks number 1 in r&d performed by business.
In fact, outside a few sectors such as IT, Egypt’s ability to attract foreign direct Investment (fdI) has neither translated into substantial technology transfer to domestic industries, nor to investment in industrial r&d (bond et al., 2013).
4.2. ACAdEmIA And InduSTry
The weak collaboration between academia and industry is rooted in a lack of understanding and at times trust between the two, hindering their ability to serve each other’s needs. Academics have little incentive to engage with industry and may not see the research potential in such collaboration while industry may regard research as impractical and unreliable and may not see the business potential of research results (bond et al., 2013). There is also a clear communication gap where in many cases there is a failure to articulate industry problems in ways to attract the attention of researchers and a failure to articulate research results in ways to attract the interest of industry.
The 2013-2014 gCI ranks Egypt 133rd out of 148 countries on university-industry collaboration on r&d. In addition, Egypt ranks 122nd out of 142 countries on the gII in university/industry research collaboration, while Jordan is number 91 and Israel is number 8. This ranking is calculated as an average based on answers to the question, “to what extent do business and universities collaborate on research and development (r&d) in your country?” with a score of 1 indicating no collaboration at all and 7 indicating extensive collaboration (world Economic forum, 2011-12). A low ranking in university-industry collaboration is particularly detrimental to Egypt’s r&d prospects given the very minimal r&d conducted in industry.
once again, we will refer to Egypt’s percentile rank in the gCI to track its performance over the past five years. figure 7 shows Egypt’s percentile rank in company spending on r&d and university-industry collaboration between 2009-2013.
The Egyptian Center for the Advancement of Science, Technology, and Innovation
21

70
60
50
40
30
20
10
0
2009-10 2010-11 2011-12 2012-13 2013-14
Company Spending on r&d
university-Industry Collaboration on r&d
figure 7: Egypt’s percentile rank in r&d Indicators, gCI 2009-2013 The figure indicates a rapid decline in Egypt’s ranking in company spending on r&d and a more modest decline in university-industry collaboration. In only five years, Egypt moved from the 60th percentile to the 17th percentile in the former and from 28th percentile to the 10th percentile in the latter. however, Egypt’s position in university-industry collaboration was already much weaker than that of company spending on r&d in 2009. Thus, Egypt’s competitiveness in this area is not only weak, but also declining.
According to Egypt’s Innovation Ecosystem, a report released by the STdf in 2012, academia-industry collaboration in Egypt is hindered by the following gaps:
• research is conducted without knowledge of all dimensions of the problem at hand; researchers are not exposed to business operations, facilities, and resources, resulting in research that is either disconnected from existing needs or that solves industry problems, but cannot be implemented because it fails to consider business-related aspects.
• Though there is valuable research being conducted by capable researchers in Egyptian institutions, most industrial entities do not trust academic research and remain unaware of the achievements and capabilities of the academic community.
• The main route to strengthening academia-industry collaboration is the “open Innovation” approach, which assumes that entities can benefit from external research besides their own to access worldwide knowledge and advance their own development. Industry r&d departments can therefore use external research conducted at universities and research institutions, while these institutions can be encouraged to sell or license unwanted technologies to others in order to generate revenue.
• most industrial entities do not have in-house r&d departments. due to a lack of trust in their ability to turn research into valuable industrial innovations, they prefer to buy foreign technologies rather than develop their own.
• Though there are a few initiatives that aim to promote r&d and an open innovation culture in industry, these have been on a small scale and have not yet had any success stories.
• There are insufficient focal points at universities and research centers to link them with industry (Science and Technology development fund, 2012).
The Egyptian Center for the Advancement of Science, Technology, and Innovation
22The Egyptian Center for the Advancement of
Science, Technology, and Innovation
23

rEfErEnCES
Academy of Scientific research and Technology. Science, Technology, and Innovation System in Egypt.
bond, m., maram, h., Soliman, A., & Khattab, r. (2013). Science and Innovation in Egypt. San francisco: Creative Commons.
Corillon, C. & mahaffy, p., Committee on freedom and responsibility in the conduct of Science (2012). Scientific relations between Academia and Industry: building on a new Era of Interactions for the benefit of Society. International Council for Science.
Cornell university, InSEAd, & wIpo (2013). The global Innovation Index 2013: The local dynamics of Innovation. geneva : world Intellectual property organization (wIpo).
Egyptian national Competitiveness Council (2012). The 8th Egyptian Competitiveness report: A Sustainable Competitiveness Strategy for Egypt.
InSEAd (2009). global Innovation Index 2008-2009.
ministry of Scientific research (2010). map of Egyptian Scientific research Institutions 2010.
oECd (2010). ministerial report on the oECd Innovation Strategy 2010.
Schwab, K., world Economic forum (2013). The global Competitiveness report 2013-2014.
Science and Technology development fund (2012). Egypt’s Innovation Ecosystem. Cairo: Science and Technology development fund.
world Economic forum (2011-12). Executive opinion Survey 2011–2012.
goIng forwArd5based on the findings of this report and an analysis of numerous previous studies, it is clear that the following steps are necessary to move forward:
develop clear, specific, measurable, time-specific goals for national innovation and a strategy to implement these goals cutting across all ministries. Ensure the accountability for achieving these goals is clearly defined.
Tie any increase in funding as per the constitution to quantifiable contribution to achieving the identified goals.
review the components of the innovation eco-system, ensure the mandates of public institutions are clearly defined, non-overlapping and complementary, and that these institutions adhere to their mandates in a consistent way. Activate the inactive ones and eliminate the redundant ones.
Identify national challenges and ensure that publicly-funded research and innovation target these challenges.
review all laws and policies directly and indirectly affecting innovation in universities, research centers and industry (large and SmEs) in a holistic way to remove obstacles and address any unintended consequences.
Support investment in innovation in industry and support mechanisms for strong linkages with universities and research centers.
Support innovation and policy research in social sciences and create a culture of evidence-based decision making.
reform the educational system to reflect the needs of the marketplace and incorporate the competencies necessary for innovative and entrepreneurial thinking. This includes, for example, a revision of school curricula and teaching methodologies.
reform vocational and technical education as a fundamental component of innovation.
1
2
3
4
5
6
7
8
9
rESEArCh And wrITIng TEAm
magy Tarek Aboul KheirAsmaa El gammal
nayera Abdelrahmannoha rabie
This report was printed with financial assistance from misr El Kheir foundation.
ACKnowlEdgEmEnTSSpecial thanks to dr. Tyseer Aboulnasr, ECASTI board member and Selection Committee Chair, for her valuable
contributions to this report.

4 Al-Ahram Street, misr El Kheir building, nafoura Square, El mokattam
mobile: +(202) 012 [email protected]