science proficiency and course taking in high school · science proficiency and course taking in...
TRANSCRIPT

�������� ��� �� � ������ ����������
����������� ������ � ���� ����� ����
Science Proficiency and Course Takingin High School
The Relationship of Science Course-taking Patterns toIncreases in Science Proficiency Between 8th and 12thGrades
�� �� ������� � ������ �
������ � ������ ��� ������� ��� ��� ����� ���� ��� !

�������� ��� �� � ������ ����������
����������� ������ � ���� ����� ����
Science Proficiency and Course Takingin High School
The Relationship of Science Course-taking Patterns toIncreases in Science Proficiency Between 8th and 12thGrades
Timothy MadiganBureau of the Census
�� �� ������� � ������ �
������ � ������ ��� ������� ��� ��� ����� ���� ��� !
���� ������� � ������ �
������� ����
���������
������ � ������ ��� ������� ��� ��� �����
�������� � �����
���� � ��� ���������
��� ��� ���� � ������ � �������
������ � ��������� ��
���� ���
��� �������� ������ ��� �� ������ ���������� !����" �� ��� #����� ������� ����� ��� �����������
���� $���� ��� ��#������ ���� ������� �� �� ������ �� ��� %����� ������ ��� ����� ������� &� � ������ �
������������� ������� �� �������� �������� ���� $�� ��� ��#��� � �� ��� ���#���� ���������� �� ��� ���������
�� �� ������ �� ��� %����� ������' ���� �� ��� # (���� ��#���� ��� �#������$�� ���� ��� �� ��� �������
��� ������������ �� � �� ����������' ������ ����� ��� ����� �� ������ �������� �� ��#��)��� ����� �����������
� �����' ��� ��)��* ��� ��#��� �� �� ������ ����)����� �� ������� �� ������
���� ����)����� ��� �������� �� ������� ���� #������ �� ������ ���� �����' #��)��� ����������� �����(���
���#����� ��� ��� ���� ���������� �� �� ������ ���� � ��� ������' ��� ��#��� ����� � ��� �� ��� ����
+ ���� ���� �� ��� %� ��#������� �� �� ������� ��� ��������� ��� ������� ����� �� ������ #���� ��,����
#������������� ���� ����� ��� ��� ������� # (���
� ����)� �� ��,� � � #��� ��� �)����(�� �� � )����� �� ������� ��� �� ���� ��� ���� �� �##��#����� �� �
)����� �� � ������� -� � �� � � � ������� ��� ��� (��� . ��� �� � � � ����� �� ���� ��������
����������� �������)�� &� � ��)� �� �������� �� � ��������� �(� � ���� �� �� ����� ���� #��� ��
�� ��#���� *� *� �� ��,� �� ���� ���� � ������ ������ � � �������� ��/
�������� ������ ��� �� ������ ����������
0����� �� �� �������� �������� ��� &�#��)�����
%� ��#������� �� �� ������
111 ��* ����� 2)�� �� �
���������� �� 3434561718
����� 899:
�������� ���� �
%� ��#������� �� �� ������� �������� ������ ��� �� ������ ����������� ����� �������� ��
���� � ���� ��� ������� ��� ������ �� �� ����� ���� ������ ������ �� ����� �
����� �������� ��� �� !�� �� "#�� $���� � ���� 9:65;5� ( ������ ������� ���������
��/ 899:

���
Foreword
Relatively little attention has been given to the relationship between course taking and achievement inscience. This report examines factors related to gains in science proficiency between 8th and 12thgrade. This analysis uses achievement testing and transcript data in the National EducationLongitudinal Study of 1988 (NELS:88) to investigate how changes in science proficiency are related toscience course-taking histories of high school students. Like an earlier report by Rock, Owings, andLee (National Center for Education Statistics 1994) on changes in the mathematics proficiency ofstudents between 8th and 10th grades, the analysis takes into account initial proficiency of students—acrucial characteristic related to both gains in proficiency and course-taking patterns. This focusenables the reader to understand how course-taking patterns are related to gains in proficiency amongstudents who in eighth grade were at the bottom, middle, and top of the science proficiencydistribution. The report also explores the extent to which gains in science proficiency are related tostudent race-ethnicity, gender, and socioeconomic background, after accounting for differences amongthese groups in science course taking.
Mary FraseActing Associate Commissioner

��
Table of Contents
Foreword....................................................................................................................................................... iii
Acknowledgments ...................................................................................................................................... vii
Highlights ................................................................................................................................................... viii
Introduction....................................................................................................................................................1
Science Proficiency Levels .............................................................................................................................2
The Science Proficiency Level of Students and Changes Over Time.........................................................2
Science Course-taking Patterns and Gains in Science Proficiency Level...................................................4
Science Course Taking and Gains in Proficiency Level by 8th Grade ProficiencyLevel ................................................................................................................................................................6
Increases in Proficiency Level, Type and Number of Science Courses, andDemographic Factors: A Multiple Logistic Regression Approach ...........................................................7
Exploring How Gender, Race-ethnic, and Socioeconomic Differences in Chancesof Increasing in Science Proficiency Level Are Influenced by Variation inScience Course Taking...................................................................................................................................9
Summary.......................................................................................................................................................11
Appendix A ..................................................................................................................................................16Logistic Regression..........................................................................................................................24
Appendix B: Technical Notes for NELS:88 ...............................................................................................25Respondents Who Were Missing Key Information......................................................................26Sampling Errors ...............................................................................................................................28Variables Used in Analysis .............................................................................................................29
References .....................................................................................................................................................31

�
List of Tables
Table 1. Percent of 1988 8th-grade students whose science proficiency level decreased,remained the same, or increased between 1988 and 1992, by selected school and studentcharacteristics .................................................................................................................................................4
Table 2. Percent of 1988 8th-grade students who took various semesters of science and typesof science courses in high school by selected school and student characteristics ....................................5
Table 3. Percent of 1988 8th-grade students whose science proficiency increased by one ormore levels between 1988 and 1992 by 8th-grade science proficiency level, semesters ofscience, curriculum, and science courses taken in high school..................................................................6
Table 4. Estimated logistic regression coefficients for the regression of increase in scienceproficiency level between 1988 and 1992 on student, school, and course-taking characteristicsby science proficiency level in 8th grade......................................................................................................8
Table 5. Logistic regression coefficients for contrasts of interest in models predicting changesof increasing in science proficiency level with and without controls for course taking ........................10
Appendix A
Table A1. Standard errors for table 1.........................................................................................................16
Table A2. Standard errors for table 2.........................................................................................................17
Table A3. Standard errors for table 3.........................................................................................................18
Table A4. Data for Figure 1: Percent of NELS students at different levels of science proficiency:1988 and 1992 ...............................................................................................................................................19
Table A5. Standard errors for table A4......................................................................................................19
Table A6. Percent of NELS students at various levels of science proficiency in 1992...........................20
Table A7. Percent of 1988 8th-grade students whose science proficiency level decreased,remained the same or increased between 1988 and 1992 .........................................................................21
Table A8. Estimated logistic regression coefficients for the regression of increase in scienceproficiency level between 1988 and 1992 on student, school, and course-taking characteristics..........22
Table A9. Estimated odds ratios for the logistic regression coefficients in table 4 ................................23
Appendix B
Table B1. Percentage of respondents who were missing key information, by demographicand schooling characteristics.......................................................................................................................27

��
List of Figures
Figure 1. Science proficiency levels of NELS students at two points in time ..........................................3
Figure 2. Change in science proficiency levels of 1988 8th-graders between 1988 and 1992, byproficiency level in 1988 ................................................................................................................................3
Figure 3. Percent of 1988 8th-grade students who increased in science proficiency levelbetween 1988 and 1992 by semesters of science taken in high school.......................................................6
Figure 4. Percent of 1988 8th-grade students who increased in science proficiency levelbetween 1988 and 1992 by type of science courses taken...........................................................................6

���
Acknowledgments
The author would like to thank all those who helped in the production of this report. Nabeel Alsalam,Mary Frase, and Jeffery Owings from the National Center for Education Statistics (NCES) providedabundant feedback from start to finish. Paul Siegel and Suzanne Bianchi from the Census Bureauprovided many useful suggestions. Mary Pontorno and Christopher Gaebler from the Census Bureauand Bruce Daniel from Pinkerton Computer Consultants, Inc. provided data and programmingassistance.
A host of additional reviewers helped by providing invaluable comments or advice. They includeLarry Suter from the National Science Foundation; Sentra Raizen of the Center for ScienceImprovement; Thomas Hoffer of the National Opinion Research Center; Don Rock and Judy Pollack ofEducational Testing Service; Robert Burton, Sue Ahmed, Andrew Kolstad, and Jeanne Griffith fromNCES; and Deborah Carter from the American Council for Education.
Rebecca Pratt and Carol Rohr from Pinkerton Computer Consultants, Inc. and Margaret Harding fromthe Census Bureau provided help with desktop publishing and graphics production.

����
Highlights
A number of previous cross-sectional studieshave found a strong relationship between astudent’s course-taking history in science duringhigh school and his or her current achievement inscience. However, it has been difficult to interpretthis evidence as the effect of course taking. It isequally plausible that students who take morescience courses or more difficult science courseswould also have been high achievers if testedbefore high school. With extensive longitudinaldata on both achievement and course taking nowat hand, a more definitive analysis is possible.This analysis uses data on science achievementand transcript reports of science course taking ofstudents from the National EducationLongitudinal Study of 1988 (NELS:88) to estimatethe relationship between their science coursetaking and the change in their science proficiencylevel between 8th and 12th grades.
� How many students increase in scienceproficiency level between 8th and 12th grades?
Fifty-four percent of students showed an increasein their science proficiency level, while 35 percentstayed at the same level and 11 percent declined.The chances of increasing in science proficiencylevel varied with the demographic and academiccharacteristics of students.
� Is taking more science courses related to gains inscience proficiency level between 8th and 12thgrades?
Generally speaking, taking eight or moresemesters of science was positively associatedwith increasing in science proficiency level. Thisresult held in most situations even afteraccounting for the association betweensocioeconomic status (SES), achievement level ineighth grade, gender, and race-ethnicity on theone hand and both course taking and increasingin science proficiency on the other. The numberof science courses taken was not, however, theonly information about course taking available inNELS:88. Information on the level of sciencecourse taken was also available and proveduseful.
� Is taking advanced level science courses such asphysics and chemistry related to gains in scienceproficiency between 8th and 12th grades?
For students who started at the top scienceproficiency level in eighth grade, taking moreadvanced science courses was related to increasesin science proficiency level. Furthermore, aftercontrolling for level of science course taken,evidence of a positive relationship between thenumber of science courses and chances ofincreasing in science proficiency level was notfound. Taking challenging science courses seemsto be crucial for high initial achievers.
For students who started at low to middle levelsof science proficiency in eighth grade, both takingadvanced level science courses and a highernumber of science courses were related toincreasing in science proficiency level.
� Are demographic characteristics of students relatedto chances of increasing in science proficiency levelduring high school?
The answer is yes. Asian and white studentswere more likely than black and Hispanicstudents to increase in science proficiency level.Students of parents with high levels of education,occupational rankings, and incomes (i.e., highSES) were more likely to increase in scienceproficiency level than students of parents withlower levels.
� After accounting for differences betweendemographic groups in the number and level ofscience courses taken, do differences in theirchances of increasing in science proficiency leveldisappear?
Gender, race, and familial SES continued toexhibit a relationship to chances of increasing inscience proficiency level even after adjusting fordifferences in science course taking. In futureresearch on this topic, researchers might consideralternative intervening variables or ways ofextracting more information out of the course-taking variables.

�
Introduction
Some people are concerned that our nation’sstudents are being out-paced in scientific literacyby students from other advanced, industrialnations.1 Many education professionals andpolicymakers have outlined solutions to thisproblem. Increasing the number of sciencecourses required for high school graduation,some have argued, will help students in the U.S.progress toward becoming first in the world inscience achievement.2 Others have called for anintegrated approach to science whichcontinuously exposes all students to sciencematerial throughout high school.3
These recommendations for more exposure toscience are based in part on research that hasdocumented a positive relationship betweencourse taking and achievement.4 Jones et al.5
found a positive relationship between totalnumber of science (and mathematics) credits ahigh school student took and his or her scienceproficiency level in 12th grade. Mullis andJenkins 6 also found a positive relationshipbetween course taking and proficiency, butquestioned the nature of the relationship becausebrighter students may simply take more courses.
In the area of mathematics, Rock, Owings andLee7 have shown course taking to be positivelyrelated to increases in a student's proficiency levelbetween 8th and 10th grades. Among studentswho started at the same proficiency level ineighth grade, those who took higher levelmathematics courses were more likely to increaseto higher proficiency levels two years later thanstudents who did not take higher level courses.Their results suggest that course taking affectsmathematics proficiency. More importantly, theyshow that taking more advanced mathematicscourses seems to help both low and highachievers.
Differential course-taking patterns may beresponsible for part of the gap between themathematics and science achievement of highschool males versus females and of whites andAsians compared to blacks and Hispanics.8 Blacksand Hispanics take fewer mathematics andscience courses than whites and Asians and thescience courses they take are clustered at lowerlevels.9 High school males are less likely to stop
taking science and mathematics courses thanfemales.10 Indeed, in mathematics, Rock, Owingsand Lee found that the types of mathematicscourses males and females took explained someof the difference in gains in mathematicsproficiency levels between 8th and 10th grades.Furthermore, research comparing public andprivate schools and on effective schools in generalhas found that good schools are often organizedaround a challenging academic or collegepreparatory curriculum.11
This report uses longitudinal data to examinewhether students at the same level of scienceproficiency during eighth grade have higherscience proficiency levels four years later if theytook more semesters of science in the interim ascompared to students who took fewer semestersof science. It will ascertain the relationshipbetween taking challenging science courses inhigh school and experiencing gains in scienceproficiency. In addition, the relationships amongschool and student characteristics, high schoolcurriculum and changes in proficiency level arealso examined.
The analysis begins by describing the distributionof students across levels of science proficiency, theamount of change in proficiency between 8th and12th grades, and the course-taking patterns ofstudents. The relationship between increases inproficiency level and science course taking whilecontrolling initial proficiency level is thenexamined. Results from this section should beuseful to people who ponder whether low-achieving students would benefit from toughercourse-taking standards. Finally, the relativeinfluences of family background, studentdemographic characteristics, and school andcourse-taking factors on chances of increasing inscience proficiency level are modeled withmultiple, logistic regression.
Data from the National Education LongitudinalStudy of 1988 (NELS:88) were analyzed in thisreport. These data provide the best availableresource to examine growth in science proficiencyduring high school. Other non-longitudinalnational surveys have provided only cross-sectional snapshots of the relationship betweencourse taking and achievement. This does notfacilitate the testing of causal relationships.Previous longitudinal surveys sponsored by the

�
National Center for Education Statistics (NCES)spanned only part of a high school student'scareer and therefore, provided an incompletepicture of achievement during high school.12
In NELS:88 the same students were interviewedin eighth grade and 2 and 4 years later when mostwere in 10th and 12th grades, and detailedcourse-taking histories of the students wereobtained through a transcript study component.These features, combined with measures ofstudent science proficiency at multiple points oftime, help make NELS:88 a valuable resource forresearchers interested in exploring factors relatedto gains in achievement or differences inachievement among students.
In 1992, transcripts were collected for a sample(14,283) of the original eighth-grade students.The NELS:88 sample used in this report iscomprised of 7,584 students representing thelongitudinal panel who had 8th and 12th gradescience scores and complete transcript records.13
Science Proficiency Levels
To measure change in student achievement overtime requires a measure that covers a broad rangeof achievement, both within a grade level andacross grades as students advance throughschool. A psychometric methodology called itemresponse theory (IRT) is ideal for measuring suchchange. It characterizes a wide range of items onachievement tests in terms of how difficult theyare and, in particular, of how likely students withvarious levels of proficiency are to answer themcorrectly. IRT allows for the introduction of newand more difficult test items over time that relateto the performance scale created from itemsadministered earlier during a student’s career.Thus, when a cohort of students who were testedin 8th grade reach 12th grade, more difficult testitems can be included on the 12th grade testwhich cover a higher range of performance andyet report test performance on the scale that wasconstructed for them when they were eighth-graders.
An alternative to calculating an IRT scale score isto assign each student at each grade to aproficiency level. Based upon common difficultylevels of groups of items used on the scienceachievement test in NELS:88, certain criteria were
established to represent thresholds ofunderstanding basic science concepts andapplications.14 In the base year, students wereassigned to level “Below 1” if their test resultsindicated that they did not understand simplescientific facts or information. This wasdetermined if they did not correctly answer atleast three out of four test questions relating tobasic scientific knowledge. They were assigned tolevel “1” if their test performance indicated thatthey understood basic science, i.e., they answeredat least three of the level 1 questions correctly.This level of understanding could be obtainedthrough everyday experiences. They wereassigned to level “2” if they, in addition to beingat level 1, understood science concepts that werefundamental to, or laid the foundation for, thebuilding up of more complex scientificknowledge. They needed to correctly answer atleast three items from a group of fourrepresenting fundamental science concepts. In asimilar manner, in the followup surveys studentscould have been assigned to the above levels or tolevel “3,” which represents an understanding ofcomplex science concepts and additionalproblem-solving abilities.15 These gross levels ofproficiency are useful for describing achievementof U.S. students or modeling school and familyprocesses involved with learning.16
The Science Proficiency Level ofStudents and Changes Over Time
Almost half of the 1988 eighth-grade studentsscored at science level 1 (figure 1 and table A4).Some 22 percent were below level 1 and 31percent above level 1. Four years later, when theyreached 12th grade, 15 percent of the studentswere below level 1. The majority of studentswere at level 2 or higher. Based on previouscross-sectional research, it is not surprising to findthat over one-fifth of eighth- grade students havelittle understanding of basic science and that bythe end of high school, fifteen percent still donot.17
Because NELS:88 is longitudinal and assessesstudent achievement at multiple points in time, itprovides researchers with data ideal forexamining how much growth in achievementoccurs during high school. Between 1988 and1992 some 54 percent of students improved their

�
science proficiency by one or more levels (figure 2and table A7).
A little more than one-third (35 percent) remainedat the same level while 11 percent lost ground.(These results are based on changes from oneproficiency level to another and do not take intoaccount changes in proficiency within a level.)Nearly the same proportion of students decreasedor simply maintained their science proficiencylevel as the proportion who increased.
The large percentage of students who did notgain at least one level may reflect a variety offactors. Students may have simply forgottenwhat they learned by 1988 or during the interimcovered in this study, especially if they had nottaken any science recently. They may havegained but not enough to cross the threshold to
the next level. At any rate, these results areconsistent with findings from other researchabout students: (1) they spend a large amount oftime tending to—or being distracted by—maintenance and procedural matters (i.e.,announcements, the taking of attendance, thecollection of sick notes and assignments, thedistribution of hallway passes, the changing ofrooms and teachers, the correction of out-of-linestudents) rather than engaging in instructionalactivities,18 (2) they receive inflated gradesalthough their performance on objective tests maynot warrant it,19 and (3) they pursue littleadvanced science coursework.20
The likelihood of students increasing their scienceproficiency level is a function of their initialscience proficiency. Students who started at thehighest level were least likely to increase. Thereare a variety of possible explanations for thispattern.21 It may reflect regression to the mean.22
Indeed, students who started at level 2 were morelikely than those at level 1 to decrease. The lowerchances of increasing among high proficiencyeighth-graders might also reflect varyingdifficulties in moving from one level to the next.Lower levels represent competency in basic,everyday science and higher levels representmore complex problem solving skills in additionto all lower level skills. Thus, it may be possiblethat moving up may be easier for students whostart at the lower end of the proficiencydistribution. Finally, more students may havebeen clumped not far below the threshold forlevel 1 science proficiency than below that forhigher levels. If that were the case, moving up inproficiency level would have been more likely forthose at the bottom. Whatever the explanation,the results found here are in agreement withsome other longitudinal findings on gains inachievement: students initially low inachievement are more likely to gain than studentswith higher initial achievement.23
By cross-classifying changes in science proficiencylevel with various student and schoolcharacteristics, one can see which groups ofstudents were most likely to change (table 1).24
Figure 1.—Science proficiency levels of NELS students attwo points in time
�
��
��
��
��
��
��
��
�
�
���
� � � ����� ��
���� �� ���
������������� �����
����� � 1 � ���� ��� �
SOURCE: U.S. Department of Education, National Center forEducation Statistics, National Education Longitudinal Study of1988.
Figure 2.—Change in science proficiency levelsof 1988 8th-graders between 1988 and1992, by proficiency level in 1988
�
��
��
��
��
��
��
��
�
�
���
�� �� ����� � ����� � ����� �
������� ��������� �� �� �� ����
������������� �����
�������� ��� ��� ���� �������
SOURCE: U.S. Department of Education, National Centerfor Education Statistics, National Longitudinal Study of 1988.

�
Male students were more likely than females toincrease their science proficiency level between8th and 12th grades, 56 and 51 percentrespectively. Higher proportions of Asianstudents than black, Hispanic, or AmericanIndians increased in proficiency levels between8th and 12th grades. White students were morelikely than black and Hispanic students toincrease. Students from higher SES backgroundswere generally more likely than students fromlower SES backgrounds to increase in scienceproficiency over the high school years. Non-Catholic, private high school students were morelikely than public to increase in level ofproficiency and less likely to decrease.
Science Course-taking Patterns andGains in Science Proficiency Level
Differences in the chances of increasing in scienceproficiency level may be related to differences inthe number and types of science courses taken bystudents. Indeed, a cross-classification of sciencecourse taking by student characteristics revealsconsiderable variation (table 2).25,26
Groups of students who took many sciencecourses or more advanced courses tended to bethe same ones who in table 1 were more likely toshow an increase in science proficiency level.White students were more likely than blacks toincrease in proficiency level and 29 percent ofwhites took 8 or more semesters of science27
compared to 18 percent of blacks. Students fromhigh SES backgrounds were more likely toincrease in science proficiency level and 42percent took 8 or more semesters of science.Students from lower SES backgrounds were lesslikely (26 percent or less) to take 8 or moresemesters of science. Males were more likely toincrease than females and they were more likelyto have taken physics, but did not differ in thenumber of courses taken.
These patterns suggest the possibility that coursetaking may account for at least some of theobservable differences between groups in thelikelihood of increasing in science proficiencylevel. One exception to this pattern involves thevariable representing 1988 science proficiencylevel. In this case, students who had high scienceproficiency levels in 1988 took more courses andmore rigorous ones but were less likely toadvance. This exception to the general patternillustrates the complexity of the relationshipbetween changes in science proficiency on the onehand and course taking and initial scienceproficiency on the other hand. This relationshipwill be investigated in more detail in a multiplelogistic regression analysis below.
Both the amount and nature of science coursetaking is related to likelihood of gains in scienceproficiency level. Of students who took 8 or moresemesters of science during high school, 68percent increased one or more levels in scienceproficiency (figure 3 and table A7).
In contrast, among students who took less than 4semesters of science, 40 percent increased theirlevel of proficiency. Except for the comparisonbetween students who took 4–5.99 versus lessthan 4 semesters of science, as the number ofsemesters of science increased, the more likelystudents were to increase their proficiency.
Table 1.—Percent of 1988 8th-grade students whosescience proficiency level decreased,remained the same, or increased between1988 and 1992, by selected school andstudent characteristics
School and student Change in science proficiency levelcharacteristics Decrease Same Increase
Total 11 35 54Gender Male 11 33 56 Female 11 38 51Race-ethnicity Asian 8 30 62 Hispanic 11 41 49 Black 18 42 39 White 10 34 56 American Indian 15 45 40SES quartile Low 17 42 42 Low-medium 14 39 47 Medium-high 10 35 55 High 6 29 65Type of school Public 12 36 53 Catholic 9 33 58 Other private 4 27 69
SOURCE: U.S. Department of Education, National Center forEducation Statistics, National Longitudinal Study of 1988.

�
The type of science course taken by students wasrelated to increases in science proficiency level.Students who took physics were significantlymore likely to increase in science proficiency thanboth groups who took less rigorous courses.Those who took chemistry only were more likelyto increase than those who took neither
chemistry nor physics. Of students whosetranscripts indicated that they took physics, 70percent increased in science proficiency level(figure 4) compared to 54 percent of students whotook chemistry but not physics and 42 percent ofstudents who took neither physics or chemistry.
Table 2.—Percent of 1988 8th-grade students who took various semesters of science and types of science courses in high school by selected school and student characteristics
Number of semesters of science: Science courses takenNo
School and chemistry- Chemistry-student characteristics 0.0-3.99 4.0-5.99 6.0-7.99 8.0 or more physics no physics Physics
Total 6 33 34 27 38 34 28Gender
Male 6 34 32 28 39 30 31Female 6 33 36 26 37 39 24
Race-ethnicityAsian 3 32 29 36 26 33 42Hispanic 8 46 29 17 52 31 18Black 6 43 33 18 47 35 18White 6 31 35 29 36 35 29American Indian 6 49 31 14 60 19 21
SES quartileLow 11 48 29 12 63 26 11Low-medium 7 41 32 20 48 32 20Medium-high 5 33 36 26 36 37 27High 3 19 36 42 17 39 44
Type of schoolPublic 6 35 33 26 40 34 26Catholic 1 25 39 34 17 37 47Other private 4 20 43 33 16 37 47
CurriculumAcademic 2 18 39 42 16 42 43General 9 46 31 15 56 29 15Vocational 13 57 26 5 73 21 6
Science coursesNo chemistry-physics 14 66 18 2 — — —Chemistry-no physics 1 21 56 22 — — —Physics 1 5 28 67 — — —
1988 proficiency levelBelow 1 11 46 31 11 60 29 11Level 1 5 35 35 24 39 36 25Level 2 2 21 34 42 20 36 44
— Not available.
SOURCE: U.S. Department of Education, National Center for Education Statistics, National Education Longitudinal Studyof 1988.

�
Science Course Taking and Gains inProficiency Level by 8th GradeProficiency Level
We have just seen that students who take morescience courses are more likely to increase theirscience proficiency level. We saw earlier thatstudents with high levels of initial proficiencywere less likely to increase their scienceproficiency than students with low initial levels ofproficiency (figure 2), and that students withhigher initial proficiency levels were more likelythan students with low initial proficiency to takemore science courses (table 2). In order to unravelhow course taking is related to gains inproficiency, the next step in the analysisincorporates students' initial science proficiencylevel into the examination of the relation betweenincreases in levels of science proficiency andtaking science courses.
A strong, positive relationship existed betweentaking a high number of science courses duringhigh school and increases in level of scienceproficiency regardless of science proficiency levelin 1988 (table 3). Students who took eight ormore semesters of science were more likely toincrease their science proficiency level thanstudents with the same initial proficiency levelwho took fewer semesters of science.
For students who took less than eight semestersof science a positive relationship between numberof semesters of science and increases in scienceproficiency level was less evident. Amongstudents who scored below science proficiencylevel 1 in eighth grade, there were no significantdifferences in chances of increasing in scienceproficiency if they took anywhere from 0 to 7.99semesters of science. However, students whowere at level 1 in eighth grade and took 6–7.99semesters of science were more likely to increasein science proficiency level than students at level 1who took less science. Those who took 4–5.99semesters were not more likely to increase thanthose who took 0–3.99 semesters. Amongstudents who scored at level 2 in eighth grade,
������ ������ � �� ���� ��������� ����� �� ��������� ������ � �� ���� ��������� ����� �� ���
� ������� � ���� �� �������� �� ������ ������� � ���� �� �������� �� �����
������ ���� � � ���� �� �� ������ �������� ���� � � ���� �� �� ������ ��
���� �� ��!� � ���� ���������� �� ��!� � ���� ������
�
��
��
��
��
��
��
��
�� �������� �������� �������� ��� � ���
��������� � ����� � ��� �� ���� �����
��������������
SOURCE: U.S. Department of Education, National Center forEducation Statistics, National Longitudinal Study of 1988.
Figure 4.—Percent of 1988 8th-grade students whoincreased in science proficiency levelbetween 1988 and 1992 by type ofscience courses taken
�
��
��
��
��
��
��
��
�� �
�����������
�������
�����������
�������
�������
���� � ����� ������ � ���
��������������
SOURCE: U.S. Department of Education, National Center forEducation Statistics, National Education Longitudinal Studyof 1988.
Table 3.—Percent of 1988 8th-grade studentswhose science proficiency increasedby one or more levels between 1988and 1992 by 8th-grade scienceproficiency level, semesters of science,curriculum, and science courses takenin high school
Proficiency level in 1988
Course-taking and Level Levelcurriculum Below 1 1 2 Total 63 55 46Semesters of science
0.0–3.99 50 35 274.0–5.99 60 40 276.0–7.99 64 59 428.0 or more 85 75 59
CurriculumAcademic 68 67 53General 60 45 36Vocational 63 39 16
Science coursesNo chemistry-physics 58 37 18Chemistry-no physics 65 59 41Physics 86 75 63
SOURCE: U.S. Department of Education, NationalCenter for Educational Statistics, National EducationLongitudinal Study of 1988.

those who took 6–7.99 semesters of science weremore likely to increase in science proficiency thanstudents who took 4–5.99 semesters. These twogroups of students were not more likely toincrease than students who took 0–3.99 semestersof science.28
At every level of initial proficiency a strong,significant relationship was found between takingphysics and whether students increased inscience proficiency level. Students who tookphysics were more likely to increase than thosewho took chemistry but not physics or neither. Inaddition, students who started at levels 1 and 2and took only chemistry were more likely toincrease than students who did not takechemistry.
The type of high school curriculum reported bythe student was also related to increases in theirscience proficiency level.29 Students who startedout at proficiency levels 1 and 2 in eighth gradeand who identified themselves as being in anacademic curriculum were more likely than thosereporting they were in a general or vocationalcurriculum to increase their science proficiencylevel . For students who started below level 1,however, there was no significant relationshipbetween self-reported curriculum and gains inscience proficiency level.
Increases in Proficiency Level, Typeand Number of Science Courses, andDemographic Factors: A MultipleLogistic Regression Approach
The number and type of science courses takenwere found to be related to increases in scienceproficiency level. These two predicators ofincreases are related to each other and to otherpredictors of increases such as self-reportedcurriculum, socioeconomic status, gender, andrace. The ability to sort out which of thesepredictors has an independent effect on increaseswhile controlling for the effects of the otherswould prove valuable to our understanding ofthe complexity of factors related to increases inscience proficiency. Logistic regression is anadvanced, multivariate statistical technique whichallows one to sort out such complexity. It isdesigned for estimating the relationship of aqualitative or quantitative explanatory variable to
a dichotomous outcome variable (in this case,whether a student increased his or her level ofscience proficiency), taking into account therelationship of other explanatory variables to theoutcome variables. A technical description oflogistic regression can be found in the appendix.
Table 4 contains the results of three logisticregression models, one for students at each levelof eighth-grade science proficiency.30 Theexplanatory variables used in each model arelisted on the left hand side of the table. Forexample, variables representing gender, race-ethnicity, SES, type of school, semesters ofscience, self-identified curriculum, and type ofscience courses taken are believed to be related tothe chances of a student increasing in scienceproficiency level. Below each variable are itscategories and the contrast group is inparentheses. The contrast group is the group thatall other groups under a particular variableshould be compared with (the comparison group,in other words). The coefficients for eachcategory of every variable are in the center of thetable. A positive coefficient indicates that therelationship is in a positive direction (or the groupof interest has a greater chances than the contrastgroup of increasing) and vice versa. An asteriskrepresents a statistically significant relationshipbetween being in a particular category and thelikelihood of increasing in science proficiencylevel, compared to the contrast category inparentheses.
The level of rigor of science courses taken in highschool was related to increases in scienceproficiency level (table 4). Across all three levelsof eighth-grade science proficiency, students whodid not take physics or chemistry weresignificantly less likely to increase in scienceproficiency level than students who took physics.Among students who started at levels one andtwo, those who took neither physics or chemistrywere less likely to increase than those who tookchemistry.
The type of curriculum that students reportedbeing in was related to increases in scienceproficiency level for students who started atscience proficiency levels one and two in eighthgrade. Students who reported being in a general

or vocational curriculum were less likely toincrease in proficiency than students whoreported being in an academic curriculum.
For students in the upper part of the scienceproficiency distribution, the rigor of courses takenand curriculum appear more related to increasesin science proficiency level than the quantity ofcourses taken. Among students at scienceproficiency level 2 in eighth grade, the number ofsemesters of science taken was not related toincreases in science proficiency level, whereasboth the type of science courses and self-reportedcurriculum were.
These results call into question the generalemphasis on taking more courses for increasingachievement. For high achieving students, thisemphasis seems especially inappropriate. Thenumber of courses taken by students who start atthe high end of the proficiency distribution is an
imperfect indication of the type of courses takenor curriculum enrolled in. If researchers attemptto predict achievement gains with a variablemeasuring number of courses and do not accountfor type of courses taken and curriculum, theywill probably obtain spurious relationships.
Among students who started at the lower ormiddle science proficiency levels there is evidenceof a positive relationship between the number ofscience courses taken and chances of increasing inscience proficiency level. Those who took lessthan eight semesters of science were less likely toincrease in proficiency level than those who tookeight or more semesters.31
Differences in the number and rigor of coursestaken by students from various demographicbackgrounds did not completely eliminatedifferences in their chances of increasing inscience proficiency, especially at levels 1 and 2.
Table 4.—Estimated logistic regression coefficients for the regression of increase in science proficiency levelbetween 1988 and 1992 on student, school, and course-taking characteristics by science proficiencylevel in 8th grade
Science proficiency level in 1988
Below 1 Level 1 Level 2
Intercept 2.22 (0.37) 1.75 (0.15) 0.60 (0.15)Gender (vs. female)
Male 0.22 (0.17) 0.22 * (0.09) 0.44 * (0.11)Race-ethnicity (vs. white)
Asian -0.13 (0.33) -0.07 (0.23) 0.25 (0.21)Hispanic -0.20 (0.16) -0.28 (0.18) -0.16 (0.28)Black -0.71 * (0.19) -0.87 * (0.17) -0.82 * (0.25)American Indian -0.30 (0.56) -0.89 * (0.43) 0.23 (1.07)
SES (vs. high)Low -0.31 (0.31) -0.83 * (0.17) -0.73 * (0.20)Low-medium 0.08 (0.31) -0.77 * (0.13) -0.47 * (0.18)Medium-high -0.15 (0.34) -0.44 * (0.13) -0.22 (0.14)
Type of school (vs. public)Catholic 0.17 (0.37) -0.40 * (0.20) -0.14 (0.21)Other private -0.02 (0.37) 0.01 (0.24) 0.54 * (0.20)
Semesters of science (vs. 8.0 or more)0–3.99 -1.13 * (0.34) -0.71 * (0.24) 0.34 (0.44)4.0–5.99 -0.63 * (0.29) -0.59 * (0.16) -0.20 (0.25)6.0–7.99 -0.63 * (0.31) -0.33 * (0.13) -0.21 (0.14)
Curriculum (vs. academic)General -0.04 (0.21) -0.48 * (0.10) -0.37 * (0.14)Vocational 0.23 (0.24) -0.44 * (0.18) -0.83 * (0.29)
Science courses (vs. physics)No chemistry-physics -1.04 * (0.27) -0.77 * (0.15) -1.60 * (0.24)Chemistry-no physics -0.82 * (0.30) -0.33 * (0.12) -0.67 * (0.13)
* p<0.05 or t>1.96 for the test hypothesis of no difference in science proficiency growth between this group and the omitted group.NOTE: Standard errors of the estimates are in parentheses.SOURCE: U.S. Department of Education, National Center for Education Statistics, National Education Longitudinal Study of 1988.

�
When these factors were taken intoconsideration through multiple logisticregression, significant differences in chances ofincreasing in science proficiency level remainedbetween males and females who started out atlevels 1 and 2 in eighth grade: males were morelikely to increase. Significant differencespersisted between blacks and whites at alllevels of initial proficiency with blacks lesslikely to increase.
Students from low and low-medium SESbackgrounds who started at levels 1 and 2 inhigh school remained significantly less likely toincrease their science proficiency level thanstudents from high SES backgrounds. Studentsfrom medium-high SES backgrounds whostarted at level 1 were also less likely toincrease than students from advantagedbackgrounds. Students from other (i.e., non-Catholic) private schools who were atproficiency level 2 in eighth grade continued tobe more likely to increase in proficiency levelthan public school students. Students fromCatholic schools who started at level 1 wereless likely than public school students toincrease.32
Exploring How Gender, Race-ethnic,and Socioeconomic Differences inChances of Increasing in ScienceProficiency Level Are Influenced byVariation in Science Course Taking
The evidence that course taking is stronglyassociated with the likelihood of increasing inscience proficiency level between 8th and 12thgrades is compelling. Equally important is theevidence showing that the chances of increasingare lower for females than for males, for blacksthan for whites, and for students from low thanthose from high SES backgrounds. The nextnatural question is to ask to what extent dodifferences in course-taking behavior betweenthese groups account for differences in chances ofincreasing in science proficiency level. If astudent characteristic that is negatively associatedwith chances of increasing is also negativelyrelated to taking higher levels or numbers ofscience courses, then one would expect thatcharacteristic to have a smaller negative
relationship to chances of increasing oncedifferences in course taking are taken intoaccount.
Characteristics of black students tend to fit thecriteria which would lead one to expect areduction in the (negative) relationship betweenbeing black and chances of increasing in scienceproficiency level. The simple descriptive statisticsin tables 1 and 2 indicate that black high schoolstudents were less likely than whites to take 8 ormore science courses or to take physics (18 versus29 percent). They were also less likely to increasein science proficiency level (39 versus 56 percent).
In a simple logistic regression model comparingblack and white students’ chances of increasing inscience proficiency level, accounting fordifferences in science course taking significantlyreduces the estimated coefficient representingblacks (table 5, from -.68 to -.56). 33 In otherwords, being a black student has less of anegative relationship to chances of increasingonce adjustments are made for differencesbetween blacks and whites in science coursetaking.
Males may outperform females on tests of scienceachievement in part because, as some researchersargue, males were more exposed to science.Above it is shown that males were more likelythan females to increase in science proficiencylevel (table 1). But there is no evidencesuggesting that they took a larger number ofscience courses (table 2). Males were more likelyto have taken physics, however. Given theseresults and considering the logic outlined above,one would not expect course taking to explain asubstantial part of the gender gap in chances ofincreasing.
Results from logistic regression analyses confirmthis expectation. In a simple logistic regressionmodel comparing male and female students’chances of increasing in science proficiency level,adding course-taking variables had little effect onthe estimated coefficient for gender (table 5, from.21 to .20). The 5 percent decrease in magnitude isnot a significant change. Adjusting for differencesin course taking does not reduce the relationshipof gender to chances of increasing in scienceproficiency level because the differences in science

��
course taking between males and females weresmall.
Examining how course taking affects therelationship of gender and race-ethnicity tochances of increasing in science proficiency levelwould be as easy and straightforward as in theabove analyses if course taking was the onlyexplanation for increasing. But chances ofincreasing are also related to initial scienceproficiency level and to socioeconomic status(figure 2 and table 1). One can more thoroughlyunderstand how course taking relates to genderand race-ethnicity differences in chances ofincreasing in science proficiency by alsoconsidering the role of such additional correlates.
Towards this end, a logistic regression model wasestimated to predict chances of increasing formales and females while adjusting for differencesin initial science proficiency level, socioeconomicstatus, race-ethnicity, and type of school (e.g.,“full controls”). When course-taking variableswere then added to this model, the relationshipbetween gender and chances of increasing inscience proficiency level changed in the directionopposite of what was expected—it increased (.23versus .28). The coefficient representing thecontrast between males and females became 22percent larger, indicating that males were evenmore likely to increase than females when coursetaking was controlled.
Table 5.—Logistic regression coefficients for contrasts of interest in models predicting changes of increasing in science proficiency level with and without controls for course taking
Control variables Percentage difference3
Other Course-takingContrast of Course-taking predictors plus other Column Column
interest None only1 only2 predictors 1 versus 2 3 versus 41 2 3 4
Black vs. -0.68 -0.56 -0.69 -0.77 18% 12%white (0.12) (0.11) (0.12) (0.12)
Male vs. 0.21 0.20 0.23 0.28 5% 22%female (0.06) (0.07) (0.07) (0.08)
Low vs. -0.97 -0.56 -1.12 -0.67 42% 40%high SES (0.10) (0.11) (0.13) (0.13)
Low-medium -0.74 -0.45 -0.83 -0.5 39% 40%vs. high SES (0.10) (0.10) (0.11) (0.11)
Medium-high -0.44 -0.27 -0.51 -0.32 39% 37%vs. high SES (0.09) (0.09) (0.10) (0.11)
1 Course taking is represented by three variables: number of science course, type of science courses, and self-identifiedcurriculum.2 The other predictor variables in the model are initial science proficiency level, type of school, and the remainingdemographic variables (i.e., for Race-ethnicity, the latter would include Gender and SES).3 In log-odds coefficients. Specifically, the absolute value of the coefficient in the reduced model minus the coefficientin the fuller model divided by the coefficient in the reduced model.NOTE: Coefficients represent the log-odds ratio. Exponentiating the coefficient produces the odds ratio. For example,exponentiating -.69 leads to .50 which implies that the odds of an increase in science proficiency level are one-half asgreat among blacks compared to whites. Standard errors are in parentheses.SOURCE: U.S. Department of Education, National Center for Education Statistics, National Education Longitudinal Studyof 1988.

��
There is an explanation behind this increase. Inthis sample, once adjustments were made fordifferences in initial proficiency, SES, and type ofschool, females were slightly more likely thanmales to take more science courses and to reportthat they were in an academic curriculum.34
When this course-taking advantage is statisticallyremoved through regression analysis, the endresult is a larger difference between males andfemales in chances of increasing in scienceproficiency level.
In contrast to the simple bivariate model whereadding course-taking variables reduced thenegative relationship between black studentsversus white and chances of increasing in scienceproficiency level, adding course-taking variablesto the model containing additional correlates didnot change the black versus white comparison (-.69 versus -.77). Specifically, the logisticcoefficient representing chances of increasing forblacks compared to whites appears to be largeronce course-taking differences are controlled.However, this change is not large enough to beconsidered substantively important (12 percent isless than the 15 percent criteria described infootnote 33).
Further analyses of the data on black and whitecourse-taking patterns helped to explain why thisoutcome occurred. 35 There is no abundantevidence that blacks who were at the same SESand proficiency level as whites were more likelythan whites in this sample to have taken more ofthe courses related to increasing in scienceproficiency level (although the coefficients tendedto be in the positive direction, they were eithersmaller or only slightly larger than their standarderrors). Thus, when course-taking variables wereadded to the model predicting chances ofincreasing in science proficiency level, thecoefficient representing the contrast betweenblacks versus whites did not become significantlylarger.
A large body of literature describes how studentsfrom low socioeconomic backgrounds are placedinto less demanding groups, courses, andcurriculums, a practice which tends to exacerbatedifferences in achievement among students.36 Onewould expect, therefore, that after adjusting forcourse-taking differences, the fact that students
were from low socioeconomic backgroundswould have less of an impact on their chances ofincreasing in science proficiency level.
Students from low SES backgrounds in NELS:88were clearly less likely than those from high SESbackgrounds to take 8 or more semesters ofscience or to take physics—even among studentswho started at the same science proficiency levelin eighth grade. This consistent negativecorrelation is important according to the logicoutlined above for it implies that SES will be lessrelated to chances of increasing in scienceproficiency once course-taking differences arecontrolled. In fact when course-taking variableswere added to the bivariate and full modelspredicting chances of increasing, large reductionsoccurred in the coefficients representing studentsfrom the lower versus highest socioeconomicbackgrounds (table 5, from -.97 to -.56 and -1.12to -.67 respectively).37
In summary, no overwhelmingly strong norconsistent evidence was found to support thehypothesis that differences between males andfemales or whites and blacks in chances ofincreasing in science proficiency level areaccounted for by differences in the number orlevel of science course taking. This interpretationis tentative, and additional analysis and data arerequired to further clarify the evidence. Incontrast, a substantial part of the positiverelationship between a student’s SES backgroundand chances of increasing appears to be due todifferences in course taking.
Summary
Previous cross-sectional studies have showncourse taking to be related to achievement, withhigher performing students tending to take ahigher number of and more difficult courses.This relationship, however, may be interpreted inat least two ways. More course taking may leadto higher achievement or students who take morecourses may have been higher achievers to beginwith.38 Longitudinal data allows for investigatingchanges in proficiency while taking initialperformance levels into account. This analysisexamined the relationship between gains inscience proficiency level and science course takingfor a group of 8th-graders in 1988 over a 4-year

��
period, taking into account a variety ofcharacteristics of students, including initialscience proficiency level.
The major finding from this analysis is thatstudents who take higher level science courses aremore likely to gain in science proficiency levelthan those who do not. This relationship wasespecially evident for students who started at thetop level of proficiency in the eighth grade.Among students who started at the lowest levelof proficiency in the eighth grade, thisrelationship was relatively weaker. However,their chances of gaining in proficiency were alsorelated to the number of science courses that theyhad taken. Science course taking, therefore, isimportant for students at all levels of initialscience proficiency.
The rigor of course taking was highly related tothe likelihood of increasing in science proficiencylevel over a 4-year period for 1988 eighth-graders,even after taking into account a number of otherfactors, including number of science coursestaken. Among students at similar levels ofscience proficiency in 1988, those who tookphysics in high school were more likely todemonstrate a gain in science proficiency levelthan those who did not. Except for students withlow levels of eighth-grade science proficiency,those who took chemistry were more likely toincrease than those who took neither chemistrynor physics. Similarly, except for students whostarted at the lowest level, those who said thatthey were in an academic curriculum were morelikely to increase than those who said they werein another type of curriculum.
The number of science courses taken in highschool was also related to gains in scienceproficiency level, but not consistently across allgroups of students. When the rigor of coursesand other factors were taken into account, thenumber of courses taken was not related to gainsin proficiency level for those students who haddemonstrated relatively high levels of proficiencyas eighth-graders. Among students who had lowto moderate levels of proficiency in eighth grade,however, those who took many semesters ofscience (eight or more) were more likely to gain inproficiency level than those who took less thaneight. The most consistent pattern seems to be
that what science courses students take in highschool is more related to increases in scienceproficiency level than the number of sciencecourses.
Turning to the relationship between demographiccharacteristics of students and chances ofincreasing in science proficiency level, somefindings seem noteworthy. While some analystshave argued that differences in course-takingpatterns are the reasons for differentialachievement among students from variousdemographic backgrounds, the evidencepresented here casts some doubt on thisargument. Even after taking differences in coursetaking and self-identified curriculum into account,students from high SES backgrounds who startedhigh school at middle or high levels of scienceproficiency were more likely to increase in levelthan students from low SES backgrounds. Inaddition, males who started at middle or highlevels of proficiency were more likely thanfemales to increase, and white students weremore likely to increase than black students. Thesefindings from demographic comparisons point tothe need for more comprehensive research ongender, race, and SES differences in scienceachievement growth.
Although transcripts from NELS do not revealwhat was taught in specific courses, they doindicate the course level, e.g., whether it wasremedial, general, honors, or advancedplacement. In future analysis of factors related toproficiency growth, researchers might want topursue such descriptive details about the coursestaken by students. They might also explorewhether the motivations that students havetoward pursuing a career in science affects theirgains in science proficiency. Do motivationsexplain part or all of the gender, race-ethnic, andSES differences in chances of gaining in scienceproficiency? Or are characteristics of scienceteachers such as credentials, experience, orattitudes toward equitably teaching all studentsresponsible for the differences? What role doparents play in the learning of science duringhigh school? Many interesting questions await tobe answered. This analysis only has tapped intoa tiny part of the enormous information inNELS:88 about student achievement over time.

��
Notes
1. International Mathematics and Science Assessments, U.S.Department of Education, National Center for EducationStatistics (NCES) 1992.
2. National Commission on Excellence in Education, ANation at Risk, 1983; see also Walberg 1984.
3. Aldridge 1992; National Science Teachers Association (NSTA)1990.
4. See Welch, Anderson, and Harris 1982; Rock, Owings, andLee, U.S. Department of Education 1994; relating to the ACT seeGaribaldi 1992.
5. 1992 in The 1990 Science Report Card; see also table 2 below.
6. 1988, p.90 in The Science Report Card by Mullis and Jenkins.
7. See note 4 above. Also see Hoffer et. al, U.S. Department ofEducation 1995.
8. See The 1990 Science Report Card for evidence of the gapand some evidence of differential course taking; see also Levin,Sabar and Libman 1991.
9. Hill, Pettus and Hedin 1990.
10. Crawley and Coe 1990.
11. Mackenzie 1983; Purkey and Smith 1983; Walberg andShanahan 1983; Coleman and Hoffer 1987; Lee and Bryk 1989,Chubb and Moe 1990; Mullis et. al. 1994.
12. In fact, results from preliminary analyses of NELS:88achievement data suggest that less growth in achievementoccurred over the last two years of high school than the firsttwo (Ralph et. al 1996; see also Alexander, Entwisle andDauber 1994 for evidence of decreasing gains inachievement as students proceed through school). The HighSchool and Beyond longitudinal survey of 1980, whichproduced data that is used widely by educationresearchers, covered only the last two years of high school—the least productive in terms of overall gains in achievementacross students. It was, however, an improvement over theNational Educational Longitudinal Survey of 1972, whichcovered only the final year of high school.
Some 24,599 eighth-grade students from across the nationwere interviewed in the base year (1988). Followup studiesattempted to re-interview these same students 2 and 4 yearslater when most, but not all, were in 10th and 12th grades,respectively. Descriptions of the sampling design, itemnonresponse, and the variables included in the report arereported in Appendix B.
13. Both base year and second followup science proficiencyscores were available for 9,832 of the 24,599 base year students.Of these students, 9,322 did not drop out of high schoolpermanently between the surveys (i.e., they could be dropoutswho returned to school or alternative completers). Of thesestudents, 7,584 had complete transcript information available.Thus, the scope of the report is limited to a longitudinal sample of1988 eighth-graders who had science test scores available attwo points in time, had complete transcript records, and wereenrolled in school during the spring of 1992. (Students who didnot reach 12th grade by 1992 were excluded from this analysis
because they had incomplete transcript data.) The data wereweighted by a relative weight which was created by dividingthe expansion panel weight (F2PNLWT) by the averageexpansion panel weight. The weighing scheme did notcompensate for test or transcript non-response. Additionalinformation about the sample is presented in Appendixes A andB.
14. For details see the Psychometric Report by Rock et. al., U.S.Department of Education 1991 and the Second Followup:Student Component Data File User’s Manual, U.S. Department ofEducation 1992.
15. Levels have the same interpretation in both years. Note,however, that level 3 was not part of the base-year test. The skillsor abilities needed to correctly answer questions that were usedas indicators for each level do not depend on participation in aparticular course. Instead, they transcend such knowledge bytapping into broader conceptual understandings of scienceand related problem-solving skills.
16. By forcing all students into a few groups, students withdiffering degrees of understanding of science are combined intoa single level. The aim was to create measures of scienceproficiency with more practical utility than alternative continuousmeasurements such as ones created using Item Response Theory(IRT). Some students may increase (or decrease) in scienceproficiency during high school and yet not change their level ofscience proficiency. See the appendix for a discussion of thereliability of the proficiency levels.
17. U.S. Department of Education, Office of Research 1992.
18. Cusik 1973.
19. U.S. Department of Education, Office of Research 1994;Goldman 1985.
20. The National Education Goals Report 1993; Feldman andAtkin 1993.
21. The relatively lower chances of gaining for those at thetop level of proficiency in eighth grade was not due to aceiling effect. The 1992 science test included questions thatcovered proficiency one level higher than the highest onecovered by questions on the 1988 eighth grade test.
22. Regression to the mean has a special statisticalinterpretation. The lack of perfect reliability in measuringability means that in the absence of any changes inunderlying true ability, persons who scored far from their truescore are likely to score closer to the true score when re-tested, so that high scores will tend to go down and lowscores will tend to go up.
23. See for instance Epstein 1991 or Lee et. al. 1995. Note thatthis is not the case with Rock, Owings and Lee’s (1994) findings,perhaps because in their analysis students in the lowest twocategories of eighth-grade proficiency were combined andstudents were only tracked until 10th grade. In the future,researchers might want to explore this issue in more detail.24. A breakdown of the science proficiency level of studentsin 1992, when they are about to leave high school, by coursetaking and demographic characteristics is reported inappendix table A6.
25. Course taking in science is limited to a few broad areas.Descriptive frequencies indicate that relatively few students

��
take physics (roughly one-fourth), nearly half take chemistry,and over 80 percent take biology. Earth science is taken bya little more than one-fifth of students. Approximately 60percent of students take courses outside these areas ofscience with only 8 percent of such students taking morethan 2 courses. See the second followup transcriptcomponent data file user’s manual for exact figures (U.S.Department of Education 1994).
The breakdown used here of the types of science coursestaken by students probably reflects the most commonsequence of courses taken in science. It is a parsimoniousbreakdown which facilitates exploring how course taking isrelated to gains in achievement. More detailed breakdownsare possible, such as one which encompasses AP biology orzoology course taking. However, students who take physicsare probably the ones taking such courses and would bepicked up in this analysis. At any rate, pursuing detailedbreakdowns in future research might further enrich ourunderstanding of how course taking is related to gains inachievement.
Based primarily on the fact that they are offered later in thehigh school curriculum and fewer students take them,physics and chemistry are assumed to be more rigorous thanother types of science courses.
26. The percentage of high school seniors who have takenphysics has increased by 11 percentage points from thebeginning of the 1980s (U.S. Department of Education, NCES,1995). One might attribute part of this increase to the factthat states have been increasing their science requirements(Suter 1993).
27. Two semesters of science equal one Carnegie unit ofscience. A Carnegie unit represents one credit for thecompletion of a 1-hour per day/5 days per week, 1-year course.Twenty-seven percent of NELS:88 students took 8 or moresemesters of science.
28. The reader is cautioned about interpreting the comparisonbetween students at level 2 in eighth grade who took 6–7.99semesters of science versus those who took 0–3.99 semesters andincreases in science proficiency level. The cell representingstudents at level 2 in eighth grade who took 0–3.99 semesters ofscience contains a small number of cases. This leads to a largestandard error for the estimated percent of these students whoincreased in science proficiency level. Consequently, finding asignificant difference when making comparisons involving thisgroup is difficult. This caution applies also to other parts of thisanalysis where relatively large standard errors were generated.
29. Note that in table 3 curriculum also is related to bothnumber and type of science courses taken.
30. Results from an overall regression (all students combined)which includes 1988 proficiency level as a predictor can befound in the appendix (table A10). Except for a small loss ofdetail, the results generally reflect the relationships described intable 4. In addition, they also indicate that, with all othervariables controlled, students who started at lower initialproficiency levels were more likely to increase than those whostarted at higher levels.
31. When a set of inferences come from the same set ofsample data they are not independent. Thus, determiningthe probability of the set of estimates being correct is moredifficult than in the case when there is only one inference.The Bonferoni procedure, a general procedure for making
inferences in this situation, involves adjusting the statementconfidence coefficients for each inference to reflect theprobability that after repeated sampling the entire set ofcoefficients would be correct (Neter, Wasserman, andKutner 1990). Applying this logic to all possible inferencesthat could be made about the relationship between the fourcategories of number of science courses taken and chancesof increasing in science proficiency level (from results of themultiple logistic regression analysis), the necessary critical t-value for testing inferences would be 2.64. Using this valuewould lead one to conclude that only one in the set of sixinferences for students who started below level 1 and onlytwo for those who started at level 1 indicate a significantrelationship between number of courses and increasing. Thiswould lead to a slightly different interpretation of therelationship, mainly that evidence of a positive relationship isnot so strong. In practice, however, few researchers makeany type of adjustment (Johnson and Wichern 1988).
32. Some caution should be exercised in interpreting thiscoefficient. For example, adjusting the significance level toaccount for multiple comparisons, as described in footnote31, would lead one to accept the null hypothesis of norelationship.
33. To determine whether changes in the coefficients intable 5 were statistically significant would require applyingsophisticated statistical tests (see Clogg et al 1995; Cloggand Petkova 1995; Allison 1995) that are beyond the scopeof this report. Instead, a simple rule of thumb is used todetermine if the change is important: if the coefficientchanged by at least 15 percent, the change is deemed tobe of substantive interest.
34. Based on regressions not reported here but available uponrequest from the author.
35. Based on regressions not reported here but available uponrequest from the author.
36. See, for example, Gamoran et. al. 1995, Oakes 1985 and Rist1970.
37. Gamoran and Mare 1989 found somewhat similar results intheir analysis of the effects of tracking on math achievement inthe High School and Beyond survey data. Blacks and femaleswere more likely than non-Blacks and males respectively to befound in the academic track when initial achievement, SES, andother variables were controlled. This tended to compensate forthe disadvantage associated with the gross (i.e., withoutadjustments for initial achievement, SES, etc.) higher probabilityof blacks and females not to be in the academic track.Compensation of this type was not found for students from lowSES backgrounds, however. Tracking reinforced initialdifferences in achievement among students from various SESbackgrounds.
38. In real life this relationship could go in both directions.Although I have not tested whether gains cause coursetaking, I have shown that course taking is related to gains,controlling for initial achievement. This is an importantfinding to note, especially if one is inclined to believe thatthe only explanation for the relationship betweenachievement and course taking is that smarter students takemore courses.

��
Appendix A
Table A1.—Standard errors for table 1
School and student Change in science proficiency levelcharacteristics Decrease Same Increase Total 0.6 0.8 0.9Gender Male 0.9 1.2 1.3 Female 0.6 1.0 1.0Race-ethnicity Asian 1.8 2.7 2.9 Hispanic 1.4 2.6 2.4 Black 3.6 2.8 2.7 White 0.5 0.9 1.0 American Indian 6.3 6.7 6.2SES quartile Low 1.3 1.8 1.7 Low-medium 1.6 1.6 1.6 Medium-high 0.8 1.3 1.3 High 0.5 1.7 1.7Type of school Public 0.6 0.9 0.9 Catholic 1.5 3.4 3.2 Other private 1.2 4.5 4.7
SOURCE: U.S. Department of Education, National Center for Education Statistics, National Education Longitudinal Study of 1988.

��
Table A2.—Standard errors for table 2
Science courses takenNo
School and Number of semesters of science chemistry- Chemistry-student characteristics 0.0–3.99 4.0–5.99 6.0–7.99 8.0 or more physics no physics Physics
Total 0.4 1.0 0.8 1.0 1.0 0.9 1.0Gender Male 0.5 1.4 1.2 1.2 1.4 1.3 1.3 Female 0.5 1.1 1.0 1.1 1.1 1.2 1.1Race-ethnicity Asian 1.3 4.0 2.7 3.8 3.5 3.6 4.0 Hispanic 1.8 2.6 2.2 2.1 3.0 2.9 2.0 Black 1.3 3.5 2.5 2.6 3.4 2.8 2.5 White 0.5 1.1 1.0 1.1 1.0 1.0 1.1 American Indian 3.9 6.4 7.1 4.1 7.9 5.9 6.6SES quartile Low 1.3 1.9 2.0 1.1 1.8 1.7 1.0 Low-medium 0.8 1.8 1.3 1.2 1.7 1.6 1.2 Medium-high 0.6 1.4 1.4 1.6 1.4 1.5 1.3 High 0.4 1.3 1.7 1.8 1.2 1.9 2.0Type of school Public 0.5 1.0 0.8 0.9 1.0 0.9 0.9 Catholic 0.8 3.6 3.7 4.4 2.9 3.8 4.4 Other private 1.9 4.7 6.0 7.6 4.7 6.0 7.9Curriculum Academic 0.3 1.1 1.3 1.5 0.8 1.4 1.5 General 0.8 1.5 1.2 1.0 1.5 1.2 1.0 Vocational 1.6 2.5 2.2 1.4 2.3 2.1 1.4Science courses No chemistry-or physics 1.0 1.5 1.1 0.4 — — — Chemistry-no physics 0.2 1.4 1.6 1.4 — — — Physics 0.3 0.7 1.6 1.8 — — —1988 proficiency level Below 1 1.1 1.8 1.9 1.1 1.9 1.9 1.1 Level 1 0.5 1.3 1.2 1.1 1.3 1.2 1.2 Level 2 0.4 1.3 1.3 1.6 1.1 1.5 1.6
— Not applicable.SOURCE: U.S. Department of Education, National Center for Education Statistics, National Education Longitudinal Study of 1988.

��
Table A3.—Standard errors for table 3
Course taking and Proficiency level in 1988curriculum Below 1 Level 1 Level 2
Total 1.9 1.2 1.6Semesters of science 0.0–3.99 5.0 3.7 7.0 4.0–5.99 2.1 2.0 2.9 6.0–7.99 4.5 1.8 2.4 8.0 or more 2.8 2.0 2.5Curriculum Academic 4.4 1.4 2.0 Vocational 3.6 3.3 3.6 General 2.0 2.0 2.6Science courses No chemistry-or physics 1.9 1.8 2.2 Chemistry-no physics 4.9 1.7 2.5 Physics 2.7 1.8 2.0
SOURCE: U.S. Department of Education, National Center for Education Statistics, National Education Longitudinal Study of 1988.

��
Table A4.—Data for Figure 1: Percent of NELS students at different levels of science proficiency: 1988 and 1992
Table A5.—Standard errors for table A4
Proficiency level
Year Below 1 Level 1 Level 2 Level 3
1988 8th-grade 22 47 31 —1992 15 29 32 24
— Not applicable.SOURCE: U.S. Department of Education, National Center for Education Statistics, National Education Longitudinal Study of 1988.
Proficiency level
Year Below 1 Level 1 Level 2 Level 3
1988 8th-grade 0.8 0.8 0.8 —1992 0.7 0.7 0.8 0.7
— Not applicable.SOURCE: U.S. Department of Education, National Center for Education Statistics, National Education Longitudinal Study of 1988.

��
Table A6.—Percent of NELS students at various levels of science proficiency in 1992
School and student At or above:characteristics Below level 1 Level 1 Level 2 Level 3
Total 15 (0.7) 85 (0.7) 56 (0.9) 24 (0.7)Gender Male 13 (1.1) 87 (1.1) 59 (1.3) 28 (1.0) Female 17 (0.8) 83 (0.8) 53 (1.1) 19 (0.8)Race-ethnicity Asian 12 (1.7) 88 (1.7) 61 (3.5) 32 (3.1) Hispanic 22 (1.8) 78 (1.8) 43 (2.4) 13 (1.7) Black 35 (3.5) 65 (3.5) 29 (2.8) 6 (0.9) White 11 (0.7) 89 (0.7) 61 (0.9) 27 (0.8) American Indian 31 (7.1) 69 (7.1) 27 (6.1) 12 (3.9)SES quartile Low 27 (1.6) 73 (1.6) 33 (1.7) 9 (1.0) Low-medium 18 (1.6) 82 (1.6) 47 (1.6) 17 (1.1) Medium-high 13 (0.9) 87 (0.9) 58 (1.4) 23 (1.2) High 7 (1.4) 93 (1.4) 74 (1.5) 38 (1.5)Type of school Public 15 (0.8) 85 (0.8) 55 (1.0) 23 (0.7) Catholic 10 (1.9) 90 (1.9) 64 (3.4) 30 (3.1) Other private 9 (3.7) 91 (3.7) 71 (5.3) 35 (5.0)Semesters of science 0.0–3.99 31 (0.4) 69 (0.4) 26 (2.3) 7 (1.4) 4.0–5.99 22 (1.3) 78 (1.3) 39 (1.4) 11 (0.8) 6.0–7.99 13 (1.3) 87 (1.3) 59 (1.5) 23 (1.2) 8.0 or more 5 (0.6) 95 (0.6) 80 (1.1) 44 (1.7)Curriculum Academic 8 (0.9) 92 (0.9) 70 (1.1) 34 (1.1) Vocational 23 (1.8) 77 (1.8) 36 (2.1) 7 (1.1) General 21 (1.2) 79 (1.2) 44 (1.3) 15 (1.0)Science courses No chemistry-no physics 26 (1.2) 74 (1.2) 34 (1.2) 7 (0.6) Chemistry-no physics 12 (1.3) 88 (1.3) 61 (1.5) 23 (1.1) Physics 4 (0.5) 96 (0.5) 81 (1.1) 46 (1.6)1988 proficiency level Below 1 37 (1.9) 63 (1.9) 23 (1.2) 4 (0.5) Level 1 12 (0.9) 88 (0.9) 55 (1.2) 18 (0.8) Level 2 3 (0.5) 97 (0.5) 83 (1.1) 46 (1.6)
NOTE: Standard errors are in parentheses.
SOURCE: U.S. Department of Education, National Center for Education Statistics, National Education Longitudinal Study of 1988.
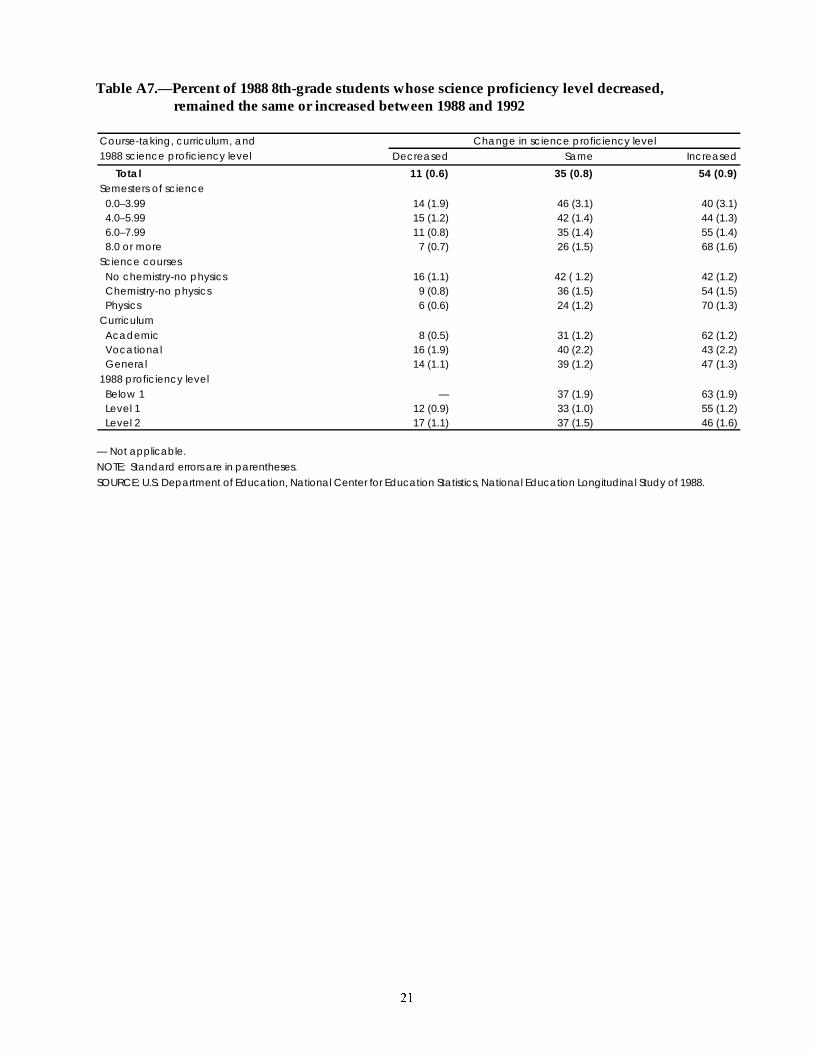
��
Table A7.—Percent of 1988 8th-grade students whose science proficiency level decreased, remained the same or increased between 1988 and 1992
Course-taking, curriculum, and Change in science proficiency level1988 science proficiency level Decreased Same Increased
Total 11 (0.6) 35 (0.8) 54 (0.9)Semesters of science 0.0–3.99 14 (1.9) 46 (3.1) 40 (3.1) 4.0–5.99 15 (1.2) 42 (1.4) 44 (1.3) 6.0–7.99 11 (0.8) 35 (1.4) 55 (1.4) 8.0 or more 7 (0.7) 26 (1.5) 68 (1.6)Science courses No chemistry-no physics 16 (1.1) 42 ( 1.2) 42 (1.2) Chemistry-no physics 9 (0.8) 36 (1.5) 54 (1.5) Physics 6 (0.6) 24 (1.2) 70 (1.3)Curriculum Academic 8 (0.5) 31 (1.2) 62 (1.2) Vocational 16 (1.9) 40 (2.2) 43 (2.2) General 14 (1.1) 39 (1.2) 47 (1.3)1988 proficiency level Below 1 — 37 (1.9) 63 (1.9) Level 1 12 (0.9) 33 (1.0) 55 (1.2) Level 2 17 (1.1) 37 (1.5) 46 (1.6)
— Not applicable.
NOTE: Standard errors are in parentheses.
SOURCE: U.S. Department of Education, National Center for Education Statistics, National Education Longitudinal Study of 1988.

��
Table A8.—Estimated logistic regression coefficients for the regression of increase in science proficiency level between 1988 and 1992 on student, school, and course-taking
characteristics
Intercept 0.71 * (0.10)
Gender (vs. female)Male 0.28 * (0.08)
Race-ethnicty (vs. white)Asian -0.02 -0.14Hispanic -0.20 -0.12Black -0.78 * (0.12)American Indian -0.57 -0.32
SES (vs. high)Low -0.67 * (0.13)Low-medium -0.50 * (0.11)Medium-high -0.31 * (0.11)
Type of school (vs. public)Other private 0.22 -0.17Catholic -0.20 -0.15
Semesters of science (vs. 8 or more)0.0–3.99 -0.63 * (0.17)4.0–5.99 -0.45 * (0.11)6.0–7.99 -0.32 * (0.10)
Curriculum (vs. academic)General -0.36 * (0.09)Vocational -0.28 * (0.12)
Science courses (vs. physics)No chemistry-or physics -1.05 * (0.10)Chemistry-no physics -0.58 * (0.09)
1988 proficiency level (vs. 2)Below 1 1.79 * (0.17)Level 1 0.91 * (0.09)
* p<.05NOTE: Standard errors are in parentheses.SOURCE: U.S. Department of Education, National Center for Education Statistics, National Education Longitudinal Study of 1988.

��
Table A9.—Estimated odds ratios for the logistic regression coefficients in table 4
Science proficiency level in 1988Selected characteristics Below 1 Level 1 Level 2
Gener (vs. female)
Male 1.25 1.25 1.55
Race-ethnicity (vs. white)
Asian 0.88 0.93 1.28
Hispanic 0.82 0.76 0.85
Black 0.49 0.42 0.44
American Indian 0.74 0.41 1.26
SES (vs. high)
Low 0.73 0.44 0.48
Low-medium 1.08 0.46 0.63
Medium-high 0.86 0.64 0.80
Type of school (vs. public)
Catholic 1.19 0.67 0.87
Other private 0.98 1.01 1.72
Semesters of science (vs. 8.0 or more) 0.0–3.99 0.32 0.49 1.40 4.0–5.99 0.53 0.55 0.82 6.0–7.99 0.53 0.72 0.81Curriculum (vs. academic)
General 0.96 0.62 0.69 Vocational 1.26 0.64 0.44Science courses (vs. physics) No chemistry-or physics 0.35 0.46 0.20 Chemistry-no physics 0.44 0.72 0.51
SOURCE: U.S. Department of Education, National Center for Education Statistics, National Education Longitudinal Study of 1988

�
Logistic Regression
The logistic regression model is of the followingform:
log[p/(1-p)]=B0 + B1x1 + ... + Bixi
An odds ratio is computed by dividing theprobability that an event occurred by theprobability that it did not (p/1-p). In this analysisthe event of interest is whether a student's scienceproficiency level increased. The log of the oddsratio is then taken and used as the outcomevariable in logistic regression. In the abovemodel, B0 represents the intercept which can beinterpreted as the log-odds of the outcomevariable when all the explanatory variables arezero, B1x1 represents the increase in the log-oddsof the outcome variable accounted for by anincrement in the explanatory variable x1, and Bixi
represents the increase in the log-odds of theoutcome variable accounted for by an incrementin the explanatory variable xi. If more than oneexplanatory variable is included in the logisticregression model (as in this analysis), then Bixi
represents the effect of xi on the outcome afteradjusting for the effects of the other explanatoryvariable(s).
One can determine the change in the odds ofincreasing in science proficiency by going fromone category of an independent variable toanother, a statistic easier to interpret than the log-odds, by exponentiating the appropriatecoefficient of interest. For example, at initialproficiency level 1, in terms of odds ratios, maleswere 1.25 times more likely than females toincrease in proficiency, controlling fordemographic and course-taking factors.Likewise, in terms of odds ratios, students fromhigh SES backgrounds were over two times aslikely to increase in proficiency compared to theirlow SES background peers. Among studentswho were at level 2 in eighth grade, in terms ofodds ratios, those who took physics were fivetimes as likely to increase in proficiency level thanthose who took neither chemistry nor physics.See table A9 for the odds ratios of other variablesin table 4.

��
Appendix B: Technical Notes for NELS:88*
The NELS:88 base year survey comprised anational probability sample of all regular publicand private 8th-grade schools in the 50 states andthe District of Columbia in the 1987–88 schoolyear. During the base year data collection,students, parents, teachers, and schooladministrators were selected to participate in thesurvey. The total 8th grade enrollment from 1,052NELS:88 sample schools was 202,996. During thelisting procedures (before 24–26 students wereselected per school), 5.35 percent of students wereexcluded because they were identified by schoolstaff as being incapable of completing theNELS:88 instruments because of limitations intheir language proficiency or because of mental orphysical disabilities. Ultimately, 93 percent, or24,599, of the sample students participated in thebase year survey in the spring of 1988.
The NELS:88 second followup survey wasconducted during the spring of 1992. Students,dropouts, parents, teachers, and schooladministrators participated in the followup,which set a target subsample of 21,188 students.Some 97 percent of these students weresuccessfully located. For the current report, datafrom base year ineligibles (BYI), students deemednot capable of answering the questionnaire due tolanguage or mental difficulties, were not usedbecause measures that reflect science proficiencyfor two points in time (base year and secondfollowup), a necessary requirement fordetermining the progression of science skills ofstudents, are not available for these students.
The scope of the cohort data presented in thisreport is limited to students who were sampledand attending schools both during the base yearand second followup surveys. Excluded fromthis study are sampled eighth graders whodropped out of school. Also excluded from thisanalysis are BYI students and freshened students(ones in followup surveys who did not have theopportunity to participate in 1988 for variousreasons including not being in country) who werenot selected in the base year sample. Altogether,the in-scope sample consists of
14,814 cases. Among them, 7,230 either did nothave complete transcript information (which wasobtained from a special transcript component ofthe second followup survey) or did not completesufficient numbers of test items so that theirscience proficiency could be determined in thebase year and/or the second followup. Due tothe absence of these key pieces of data, they weretreated as missing. Thus, 7,584 cases were usedfor this analysis. (Due to decisions that weremade in conducting various parts of the NELS:88survey, these numbers should not be used toconstruct a survey “response rate.”)
A brief sketch of the number of students involvedin NELS:88 and the final number used in thisanalysis is as follows:
1) Target base year sample size............. 26,432Realized sample size...........................24,599
2) Target second followup (F2) sample size .......................................21,188
Realized sample size.........................20,6233) Number of realized F2 students representing the 8th-grade panel......16,4894) Number of above (3) students who did not drop out.................................. 14,8145) Number of above (4) students with base year cognitive tests, second followup cognitive tests, and complete transcripts (number used in analyses)............................................ 7,584
The results of these analyses apply to thepopulation of children who were in 8th grade in1988 and in 12th grade four years later.
*Parts of these notes can be found in Rock, Owings, and Lee(1994). In addition, Judy Pollack from Educational TestingServices in Princeton, N.J. provided technical information onthe psychometric properties of the NELS:88 scienceproficiency levels.

��
Respondents Who Were Missing Key Information
Certain patterns were noted in the types ofstudents who were missing information. Femaleswere less likely than males; Hispanics, blacks, andAmerican Indians were less likely than whites;and low SES students were less likely than highSES students to have complete key information(Appendix Table B1). These groups of students,therefore, were more likely to be excluded fromthe analyses. Aggregate results may tend to over-represent patterns for whites, males and studentsfrom high SES family backgrounds.
Additional comparisons reveal that the groupwithout key information was slightly less likelythan the group with such information to: (1) beclassified at a higher proficiency level in the 8thgrade; (2) be classified at a higher proficiency levelin 12th grade; (3) take more science courses; (4)report being enrolled in an academic curriculum;and (5) take physics or chemistry as opposed toneither of these courses.
Because students without key information wereless likely to be proficient at higher levels ineighth grade, the distribution of the eighth-gradescience proficiency levels reported in this analysismay be biased upward. Similarly, thedistribution of 12th-grade science proficiencyreported here may also be biased upward.
The estimated effects of these variables in theanalysis sample may or may not differ from theireffect in the full population. If the averageincrease in science proficiency level for studentswith incomplete data was similar to that of theircounterparts with complete data, the analysisreported here is not affected by excluding thesestudents. However, if among students with thesame characteristics, i.e., eigth-grade scienceproficiency, sciences courses taken, etc., thosewith incomplete data had a substantially differentaverage increase in science proficiency from thosewith complete data, the analysis may under oroverestimate the effects of these variablesdepending on the direction of the difference. Forexample, if among excluded students with fewscience courses taken the average increase inscience proficiency was less than among includedstudents with few science courses taken, the effectof courses taken would have beenunderestimated.

��
Table B1.—Percentage of respondents1 who were missing key information, by demographic and schooling characteristics
Sampling Errors
Did not have key informationStudent and school Unweighted Weighted Standardcharacteristics number number Percent2 error
Total 6,786 7,230 49 (0.8)Gender
Male 3,286 3,563 47 (1.1)Female 3,500 3,667 50 (1.1)
Race-ethnicityAsian 407 227 42 (2.9)Hispanic 890 782 56 (1.9)Black 771 1,137 60 (2.7)White 4,621 4,955 46 (1.0)American Indian 75 98 62 (4.7)Missing3 32 47 — —
SES quartileLow 1,571 1,699 57 (1.5)Low-medium 1,631 1,808 49 (1.4)Medium-high 1,664 1,877 48 (1.4)High 1,920 1,846 44 (1.5)
Type of schoolPublic 5,650 6,112 47 (1.0)Catholic 330 385 46 (3.7)Other private 506 291 50 (4.9)Missing3 461 450 — —
CurriculumGeneral 2,714 3,249 52 (1.2)Academic 2,935 2,602 41 (1.2)Other 717 797 49 (2.1)Missing3 307 628 — —
Semesters of science0–3.99 789 937 71 (2.1)4.0–5.99 1,634 1,592 39 (1.2)6.0–7.99 1,474 1,289 33 (1.2)8.0 or more 1,003 766 26 (1.1)Missing3 1,886 2,646 — —
Science coursesNo chemistry-no physics 2,415 2,585 47 (1.2)Chemistry-no physics 1,347 1,170 31 (1.2)Physics 1,138 830 28 (1.2)Missing3 1,886 2,646 — —
1988 proficiency levelBelow 1 1,505 1,719 50 (1.4)Level 1 2,427 2,708 43 (1.2)Level 2 1,278 1,267 35 (1.4)Missing3 1,576 1,535 — —
1992 proficiency levelBelow 1 506 559 33 (2.0)Level 1 841 969 31 (1.7)Level 2 718 747 23 (1.5)Level 3 446 459 20 (1.6)Missing3 4,275 4,496 — —
—Not applicable.1Out of 14,814 8th-grade longitudinal panel respondents who did not drop out of school. See Appendix B for more information on the sample. Studentswere classified as missing key information if they did not have both base year and second followup cognitive tests. In addition, students who wereinvolved in the transcript component of NELS:88 but did not have complete or only partial traynscript information were classified as missing key data.2If students were missing information on a stratification variable such as race or school sector, then they were not used to calculate the percentage withoutkey information for that particular variable.3This variable code represents missing cases on the stratification variable. For example, no student was missing information on gender and 47 were missingrace information. Note that 2,646 respondents were not involved in the transcript study, and show up as missing for the variables Science courses andSemesters of science. In addition, the number of respondents who were missing 1992 proficiency level information is relatively large because the responserate on the cognitive tests in the second followup was only 77 percent, as compared to 97 percent in the base year.NOTE: Frequencies were weighted with a relative weight.SOURCE: U.S. Department of Education, National Center for Education Statistics, National Education Longitudinal Study of 1988.

��
The data were weighted using the secondfollowup panel weight (F2PNLWT) divided bythe average panel weight to reflect the samplingrates (probability of selection) and adjustments forunit non-response.* The complex sample designwas taken into account when a Taylor seriesapproximation procedure was used to computethe standard errors in this report. The standarderror is a measure of the variability of a sampleestimate due to sampling. It indicates, for a givensample size, how much variance there is in thepopulation of possible estimates of a parameter.
�
� ���� ��� �� � ������� ��� �� ��������� �� ��� ���� ���
��� ������� ���� ��� �������� � ���������� � �������
��� ��� ��� ��������� ���� ��� ��� ��� ������� �����
���������� ����� � �� ���� ����� � ������ ������� �������
���� ������ ��� �� �� ������� ������ ������ ������� ���� ����
����� ��� ��� ��������� ���� ��� �� ��� !"#$ ���
��������� ���� ������
If all possible samples were selected under similarconditions, intervals of 1.96 standard errors belowto 1.96 standard errors above a particular statisticwould include the true population parameterbeing estimated for about 95 percent of thesesamples (i.e., 95 percent confidence interval).Comparisons noted in this report are significantat the 0.05 level. Except for results in the logisticregression section, all comparisons weredetermined using Bonferroni adjusted t-tests.(See the footnote above for a discussion of theprocedures followed in the logistic regressionsection.)

��
Variables Used in Analysis
Science proficiency. Proficiency levels inscience achievement form a hierarchical scalewith each succeeding level characterized byincreased complexity. A proficiency at a givenlevel implies proficiency at all levels below it.
Each proficiency level is marked by a block offour items that have similar difficulty. Forexample, the level 1 items mostly deal withknowledge of simple scientific concepts.
Item #1 - Identify components of the solar system.
Item #2 - Read a graph depicting the solubility ofchemicals.
Item #3 - Choose a statement about the source ofthe moon's light.
Item #4 - Identify the example of a simple reflex.
In addition to requiring the same cognitiveoperations, the items for a particular level exhibitsimilar item difficulty parameters. Since theunderlying cognitive demand model is assumedto be hierarchical, students who are proficient onthe level 2 items should also demonstrateproficiency on the level 1 items. While four itemsmay seem like a relatively small number of items,they do prevent the chances of guessing correctlyat a level and are essentially parallel measures ofthe same content or processing skill. The fouritems are not a subscale that attempts todiscriminate individuals along a continuousdimension but are simply used to make a“know/can do” versus “do not know/cannot do”determination at a certain point referencing aspecific skill. A full description of thepsychometric properties of the NELS:88 base yeartest battery is presented by Rock & Pollack (1991).Descriptions of followup batteries are available inforthcoming followup NELS:88 psychometricreports.
Reliability of proficiency levels. An estimate ofthe reliability of a set of hierarchically orderedproficiency levels must take into account thehierarchical nature of the underlying cognitivemodel and consider the reproducibility of theresponse pattern. In a three-level model as usedin science a person who demonstrates proficiencyon two of those levels should show a
response pattern consistent with the hierarchicalnature of the proficiency levels. For instance, aresponse pattern where students fail to pass thelowest level but succeed at the higher levelswould not be consistent with the assumedcognitive model where the increased difficultygoes from low to high. Guttman's coefficient ofreproducibility is one measure of the deviation ofresponse patterns from the ideal when there is anunderlying order hierarchy. Guttman'scoefficient of reproducibility is equal to one - [totalnumber of deviations from the ideal across allrespondents/(number of respondents) (numberof levels)]. A corrected version of this coefficientof reproducibility, one which removes thoseindividuals who had either a perfect score on thethree levels or a zero score since they would haveno opportunity for having deviations from theideal response pattern, was found to be .95.Coefficients over .90 are considered quite high.However, when the measuring instrument hasonly three ordered and well spaced levels there isless opportunity for errors to occur.
Semesters of science. Measured in Carnegieunits. A Carnegie unit represents one credit forthe completion of a one-hour, one-year coursefive days a week. This measure was convertedinto semesters by assuming that one Carnegieunit represents two semesters of science.Approximately 27 percent (s.e.=.96) of thestudents took 8 or more, 34 percent (s.e.=.82) tookat least 6 but fewer than 8, 33 percent (s.e.=.98)took at least 4 but less than 6, and the rest (6percent) less than 4 semesters of science.
Science courses. If a student's transcriptindicated that she or he took a physics course,then they received the value of “3” on thisvariable. Students who took chemistry but notphysics received a two and those who tookneither chemistry nor physics received a one.
Curriculum. Categorical variable coded asgeneral, academic, or vocational from studentself-reports of high school curriculum in 1992.Students who could not identify their type ofcurriculum were included in the general category.
Type of school. Categorical variable created fromresponses to the second followup school

��
questionnaire coded as public, Catholic, and otherprivate. Other private schools are composed ofboth non-Catholic religious and non-religiousprivate.
Gender. Male and female.
Race-ethnicity. Asian-Pacific Islander, Hispanic,Black-not Hispanic, White-not Hispanic, andAmerican Indian.
SES (Socioeconomic status). Base-year parentdata on father's education level, mother'seducation level, father's occupation, mother'soccupation, and family income were standardizedand a continuous scale was created. This scalewas then divided into four to create quartiles.Parent data were used unless parent informationwas missing, then student responses to questionsabout their parents were used. In a few caseswhere data on all five components of SES werenot available, scale scores were constructed basedon the components that were available.

��
References
Aldrige, Bill G. 1992. “Project on Scope, Sequence, and Coordination: A New Synthesis for ImprovingScience Education,” Journal of Science Education and Technology (1)1:13-21.
Alexander, Karl L., Doris R. Entwilse, and Susan L. Dauber. 1994. On the Success of Failure: A Reassessment ofthe Effects of Retention in the Primary Grades. New York: Cambridge University Press.
Allison, Paul D. 1995. “The Impact of Random Predictors on Comparisons of Coefficients between Models:Comment on Clogg, Petkova, and Haritou.” American Journal of Sociology 100(5):1294-1305.
Chubb, John E. & Terry M. Moe. 1990. Politics, Markets, and America's Schools. Washington, D.C.: TheBrookings Institution.
Clogg, Clifford C. and Eva Petkova. 1995. “Reply to Allison: More on Comparing Regression Coefficients.”American Journal of Sociology 100(5):1305-1312.
Clogg, Clifford C., Eva Petkova, and Adamantios Haritou. 1995. “Statistical Methods for ComparingRegression Coefficients between Models.” American Journal of Sociology 100(5):1261-1293.
Coleman, James & Thomas Hoffer. 1987. Public and Private High Schools: The Impact of Communities. NewYork: Basic Books, Inc.
Crawley, Frank E. and Annette S. Coe. 1990. “Determinants of Middle School Students’ Intention to Enrollin a High School Science Course: An Application of the Theory of Reasoned Action,” Journal of Research inScience Teaching 27(5):461-476.
Cusik, Philip. 1973. Inside High School. Holt, Rinehart and Winston.
Epstein, Joyce L. 1991. “Effects on Student Achievement of Teachers' Practices of Parent Involvement,”Advances in Reading/Language Research 5:261-276.
Feldman, Allan and J. Myron Atkin. 1993. “Research in Science Education in the USA,” Journal ofCurriculum Studies 25(3):281-289.
Gamoran, Adam, and Robert D. Mare. 1989. “Secondary School Tracking and Educational Inequality:Compensation, Reinforcement, or Neutrality?” American Journal of Sociology 94:1146-1183.
Gamoran, Adam, M. Nystrand, Mark Berends, and P.C. LePore. 1995. “An Organizational Analysis of theEffects of Ability Grouping.” American Educational Research Journal 32(4):687-715.
Garibaldi, Antoine M. 1992. “Creating Prescriptions for Success in Urban Schools: Turning the Corner onPathological Explanations for Academic Failure,” in Hard Work and High Expectations: Motivating Students toLearn, Tommy Tomlinson, Editor. U.S. Department of Education, Office of Educational Research andImprovement.
Goldman, Louis. 1985. “The Betrayal of the Gatekeepers: Grade Inflation,” The Journal of General Education37(2):97-121.
Hill, Oliver W., Clinton Pettus, and Barbara A. Hedin. 1990. “Three Studies of Factors Affecting theAttitudes of Blacks and Females toward the Pursuit of Science and Science-related Carriers,” Journal ofResearch in Science Teaching 27(4):289-314.
Johnson, Richard A. & Dan W. Wichern. 1988. Applied Multivariate Statistical Analysis. Englewood Cliffs,NJ: Prentice Hall.
Jones, Lee R., Ina V.S. Mullis, Senta A. Raizen, Iris R. Weiss, and Elizabeth A. Weston. 1992. The 1990Science Report Card. NAEP's Assessment of Fourth, Eighth, and Twelfth Graders. Educational Testing Service,Princeton, N.J.
��
Lee, Valerie E. & Anthony S. Bryk. 1989. “A Multilevel Model of the Social Distribution of High SchoolAchievement,” Sociology of Education 62:172-192.
Lee, Valerie, Susanna Loeb, & Sally Lubeck. 1995 “The Effect of Social Context on the CognitiveDevelopment of Children in Chapter 1 Preschool Classrooms,” paper presented at the AmericanSociological Association Annual Meeting, Washington, D.C.
Levin, Tamar, Naama Sabar, and Zipora Libman. 1991. “Achievements and Attitudinal Patterns of Boysand Girls in Science,” Journal of Research in Science Teaching 28(4):315-328.
Mackenzie, Donald E. 1983. “Research for School Improvement: An Appraisal of Some Recent Trends,”Review of Educational Research (April):5-17.
Mullis, Ina V.S. and Lynn B. Jenkins. 1988. The Science Report Card. Trends and Achievement Based on the 1986National Assessment. Educational Testing Service Report No: 17-S-01. Princeton, N.J.
The National Commission on Excellence in Education. 1983. A Nation at Risk. U.S. Department of Education,Washington, D.C.
The National Education Goals Report. 1993. Building a Nation of Learners, The National Report Vol.1.Washington, D.C.: U.S. Government Printing Office.
National Science Teachers Association (NSTA). 1990. Science Teachers Speak Out: The NSTA Lead Paper onScience and Technology Education for the 21st Century, The National Science Teachers Association Board ofDirectors.
Neter, John, William Wasserman, & Michael H. Kutner. 1990. Applied Linear Statistical Models.Boston:Irwin.
Oakes, Jeannie. 1985. Keeping Track: How Schools Structure Inequality. New Haven: Yale UniversityPress.
Purkey, Stewart C. & Marshall S. Smith. 1983. “Effective Schools: A Review,” The Elementary School Journal83(4):427-452.
Ralph, John, Dana Keller, and James Crouse. 1996. “The National Educational Longitudinal Study: What ItTells Us About High School Academic Achievement,” paper presented at the American EducationalResearch Association annual meeting in New York.
Rist, Ray C. 1970. “Student Social Class and Teacher Expectation: The Self-Fulfilling Prophecy in GhettoEducation,” Harvard Educational Review 40:411-451.
Suter, Larry E., editor. 1993. Indicators of Science and Mathematics Education 1992. Washington, D.C.:National Science Foundation.
U.S. Department of Education, National Center for Education Statistics. 1995. The Condition of Education1995. Report #95-273.
U.S. Department of Education, National Center for Education Statistics. 1994. “Changes in Math ProficiencyBetween 8th and 10th Grades.” Statistics in Brief (93-455), Washington, D.C. (Rock, Donald, Jeffry Owings,and Ralph Lee).
U.S. Department of Education, National Center for Education Statistics. 1994. “Effective Schools inMathematics.” Perspectives from the NAEP 1992 Assessment. Report #23-RR-01 (Mullis, Ina V.S., FrankJenkins, and Eugene G. Johnson).
U.S. Department of Education, National Center for Education Statistics. 1992. “International Mathematicsand Science Assessments: What Have We Learned?” Research and Development Report 92-011 (Elliot A.Medrich & Jeanne E. Griffith).

��
U.S. Department of Education, National Center for Education Statistics. 1991. “Psychometric Report for theNELS:88 Base Year Test Battery.” Technical Report 91-468, (Rock, Donald A., Judith Pollack, Jeffery Owings,and Anne Hafner).
U.S. Department of Education, National Center for Education Statistics. 1994. Second Followup: TranscriptComponent Data File User’s Manual. Report #94-377.
U.S. Department of Education, National Center for Education Statistics. 1992. Second Followup: StudentComponent Data File User's Manual. Report #93-374.
U.S. Department of Education, National Center for Education Statistics. 1995. “Social BackgroundDifferences in High School Mathematics and Science Coursetaking and Achievement.” Report #95-206(Hoffer, Thomas, Kenneth Rasinski, and Whitney Moore).
U.S. Department of Education, Office of Research. 1992. Meeting Goal 3: How Well Are We Doing? EducationResearch. Report #92-3071.
U.S. Department of Education, Office of Research 1994. What Do Student Grades Mean? Differences AcrossSchools. Education Research Report. Report #94-3401.
Walberg, Herbert J. 1984 (May). “Improving the Productivity of America's Schools,” Educational Leadership,pp. 19-27.
Walberg, Herbert J. & Timothy Shanahan. 1983. “High School Effects on Individual Students,” EducationalResearcher (August/September):4-9.
Welch, Wayne W., Ronald E. Anderson and Linda J. Harris. 1982. “The Effects of Schooling on MathematicsAchievement,” American Educational Research Journal 19(1):145-153.