science policy, budgets and politics: what the future may hold michael s. lubell chairman, physics...
TRANSCRIPT
Science Policy, Budgets and Politics: What the Future May
Hold
Michael S. Lubell
Chairman, Physics Department
CCNY, New York, NY
and
Director of Public Affairs
American Physical Society, Washington, DC
BESAC Meeting, December 6, 2004
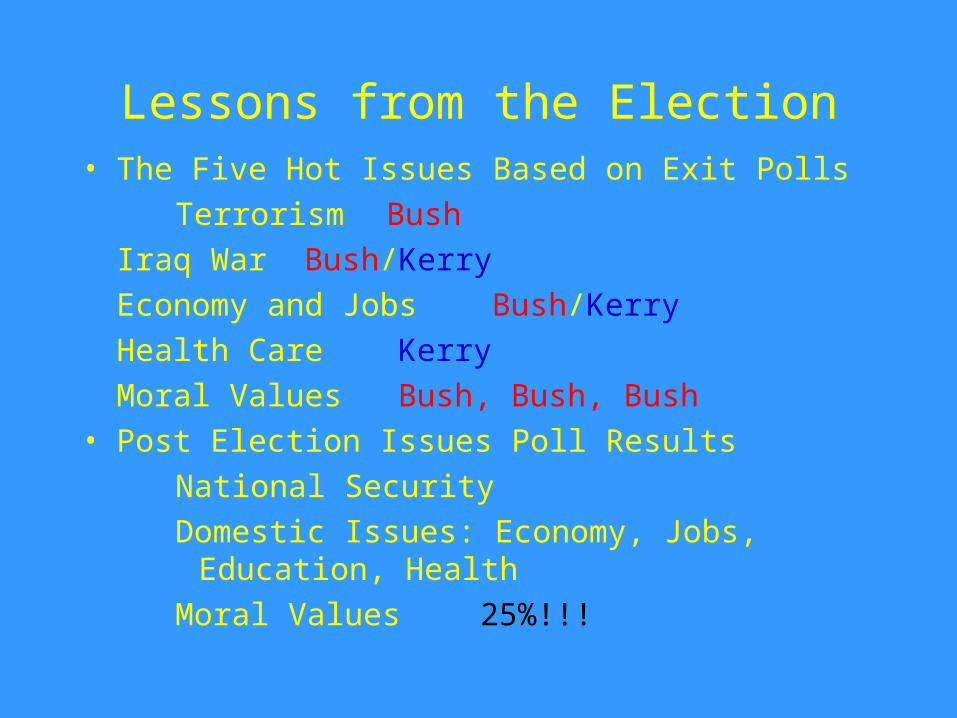
Lessons from the Election• The Five Hot Issues Based on Exit Polls
Terrorism Bush
Iraq War Bush/Kerry
Economy and Jobs Bush/Kerry
Health Care Kerry
Moral Values Bush, Bush, Bush
• Post Election Issues Poll Results
National Security
Domestic Issues: Economy, Jobs, Education, Health
Moral Values 25%!!!

Science’s Image
• Elitist
• Arrogant
• Liberal
• Democrat
• Out of Touch with Middle America
• Enemy of the Bush Administration – Cuts Both Ways

Science the Enemy of the Bush Administration
• Kyoto Protocols
• ABM Treaty
• Stem Cell Research
• Evolution vs. Creationism
• The Union of Concerned Scientists Reports
• Scientists for Change
Building Bridges
• To the Public• More than 85 percent of people polled believe that
science is beneficial
• But only 20 percent people polled name jobs and the economy as a principal benefit
• Fewer than 10 percent can name any place where research is performed

Building Bridges
• To the White House• Repair the damage
• Speak the language
• Engage industrial allies
• Encourage conservative scientists to speak out

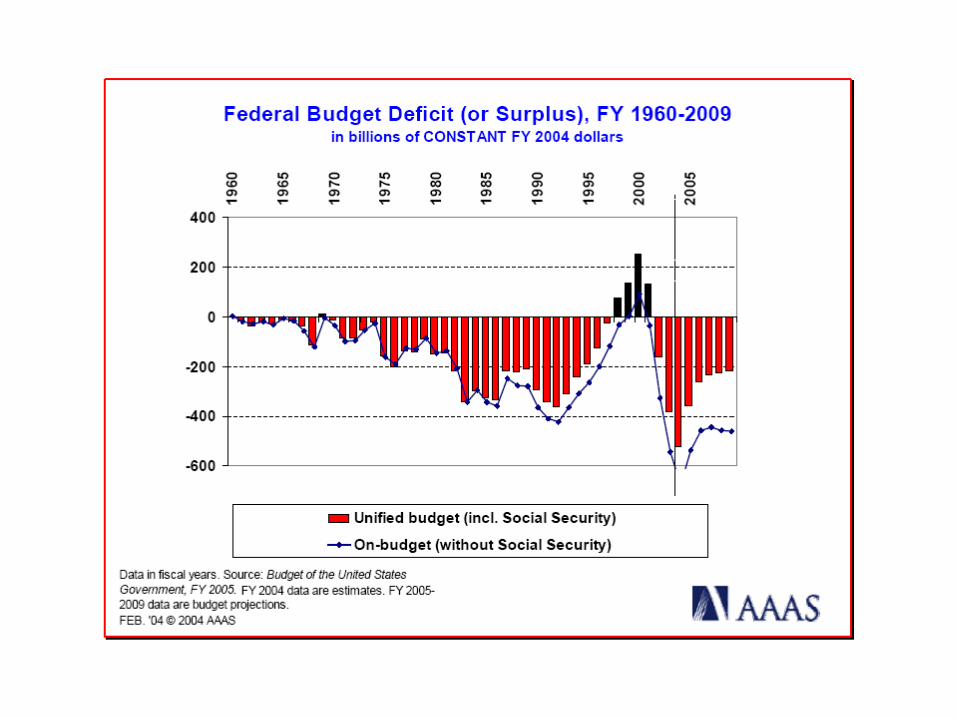
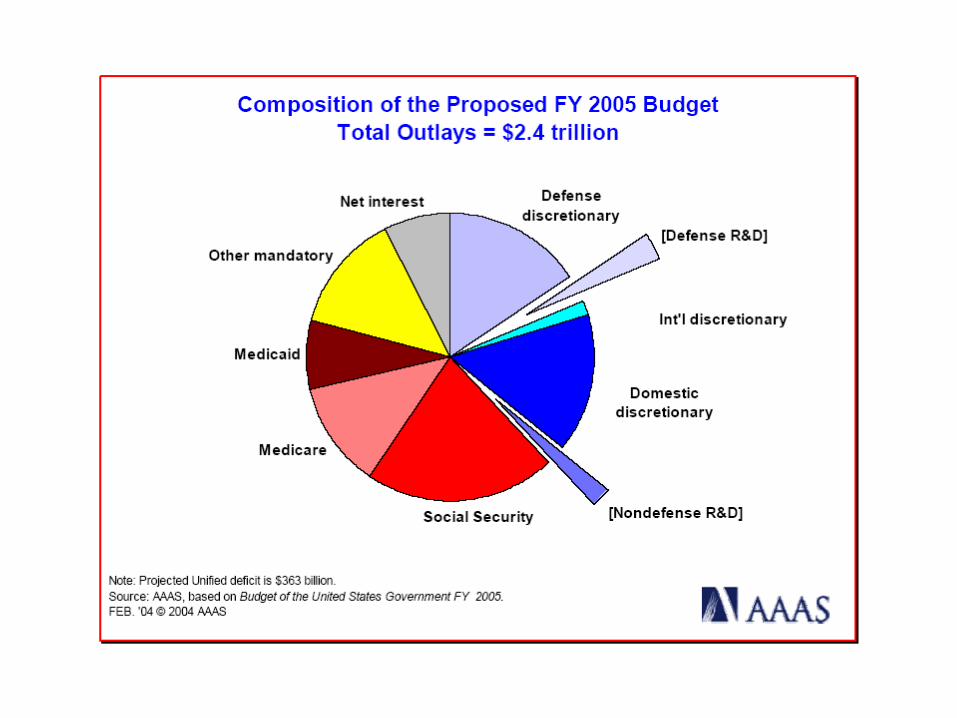
The Budgetary Challenges
• Structural deficit (FY04: $413 b unified $575 b on-budget)
• Historic current accounts deficit ($50 b/mo; 5.6% of GDP)
• Foreign ownership of federal debt (92% during last 4 yrs)
• The sinking dollar
• Entitlement pressures – Social Security & Medicare
• Tax cuts
• Iraq war
• Homeland security

Timeline for the FY 2007 Budget• Spring 2005: OMB Guidance to Agencies
• Summer 2005: Agency Planning
• Sept. 2005: Agency Requests Submitted to OMB
• Thanksgiving 2005: OMB “Pass Backs” Sent to Agencies
• Jan. 2006: Presidential Request Finalized
• Monday, Feb. 6, 2006: Presidential Budget Submitted to Congress
• April 15, 2006: Budget Resolution Passed by Congress – Or Not!
• Spring and Summer 2006: 13 Appropriations Bills Passed by House
• Spring and Summer 2006: 13 Appropriations Bills Passed by Senate
• Summer 2006: 13 Appropriations Bills Conferenced
• Sept. 30, 2006: 13 Appropriations Bills Passed and Signed into Law
• Oct. 1, 2006: Start of FY 2007

The Inside Story of the FY 05 Budget
• DOE Champions: Hobson, Visclosky, Biggert, Domenici, Reid, Alexander, Bingaman
• The NSF Squeeze: Veterans and Moon-Mars
• Evils and Benefits of an Omnibus Bill

Science Messages
• Economic Growth and Jobs
• Competitiveness
• National Security
• Health Care
• High Tech Workforce
Benchmarking the Future
• Patents
• High-Tech Industry Output
• R & D Spending
• Publications
• Student Enrollments

U.S. Patent Applications
1,000
10,000
100,000
1,000,000
1989 1994 1999
Year
Num
ber o
f Pat
ent A
pplic
ation
s
United States
Emerging Economies
"Old" Economies
Source: 2004 NSF Science and Engineering Indicators. Compiled by the APS Office of Public Affairs.
Emerging Economies:China, Hong Kong, India, Ireland, Israel, Singapore, South Korea, Taiwan
Old Economies:Canada, France, Germany, Italy, Japan, Netherlands, Sweden, Switzerland, United Kingdom

High Tech Industry Gross Output
10,000
100,000
1,000,000
10,000,000
1989 1994 1999 2004
Year
Mill
ions
of 1
997
U.S
Dol
lars
United States
China
Source: 2004 NSF Science and Engineering Indicators.
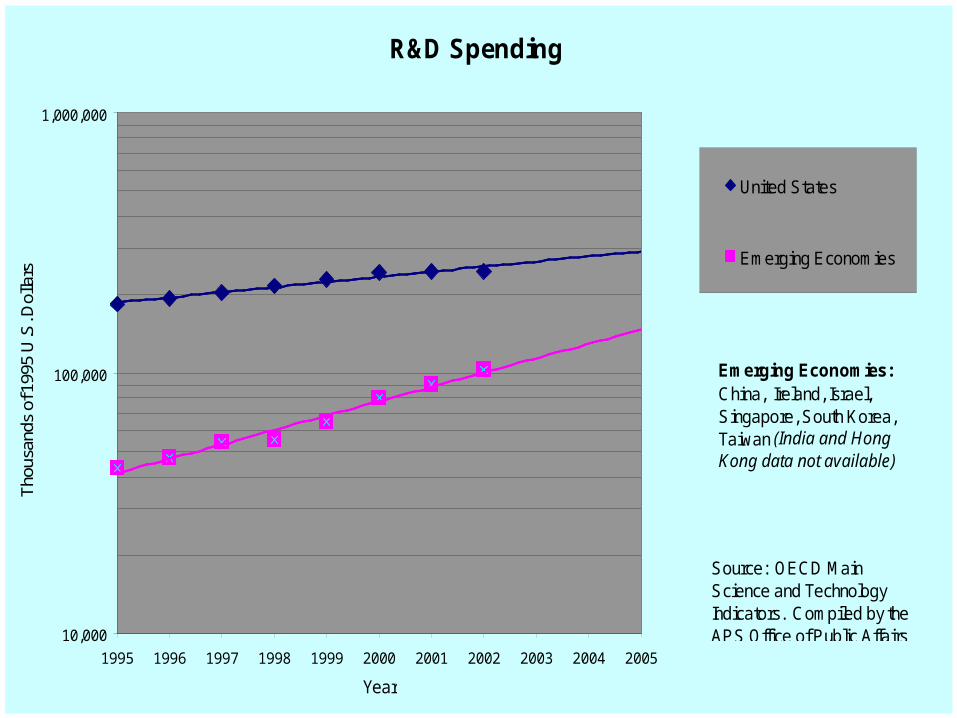
R&D Spending
10,000
100,000
1,000,000
1995 1996 1997 1998 1999 2000 2001 2002 2003 2004 2005
Year
Tho
usan
ds o
f 199
5 U
.S. D
olla
rs
United States
Emerging Economies
Emerging Economies:China, Ireland, Israel, Singapore, South Korea, Taiwan (India and Hong Kong data not available)
Source: OECD Main Science and Technology Indicators. Compiled by the APS Office of Public Affairs.
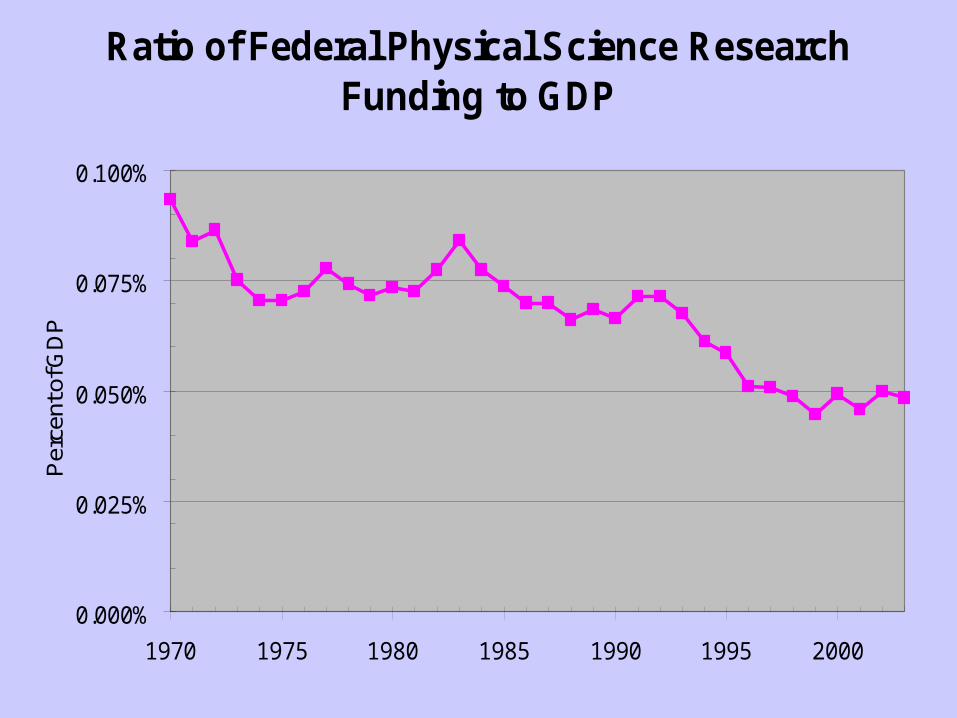
Ratio of Federal Physical Science Research Funding to GDP
0.000%
0.025%
0.050%
0.075%
0.100%
1970 1975 1980 1985 1990 1995 2000
Per
cent
of G
DP

Physics Review Submissions
0
5000
10000
15000
20000
25000
30000
1983 1985 1987 1989 1991 1993 1995 1997 1999 2001 2003
United States Western Europe Rest
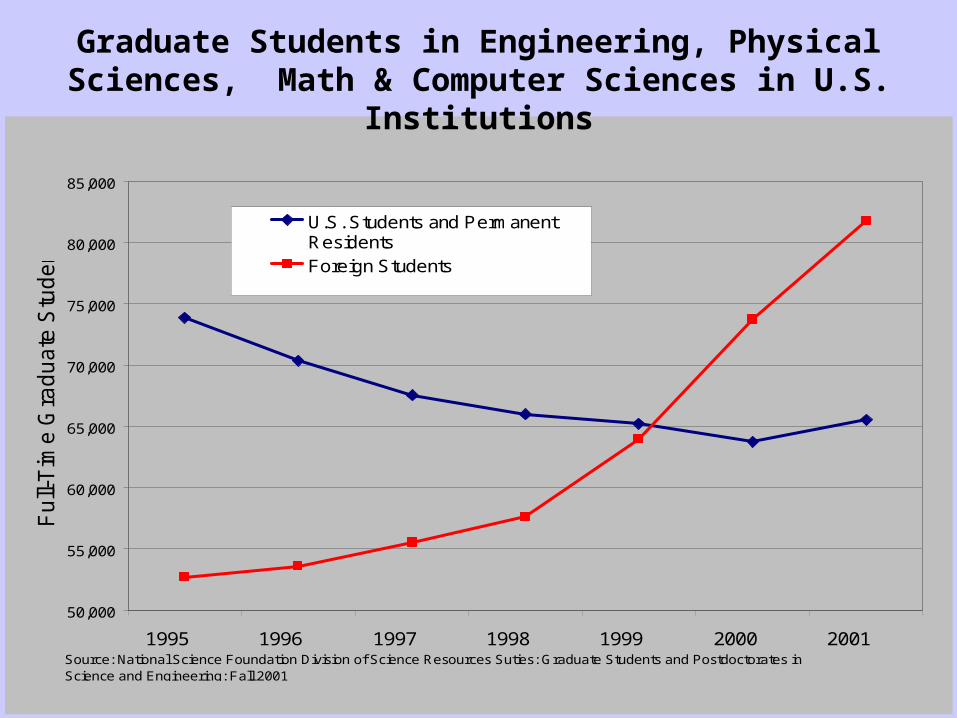
50,000
55,000
60,000
65,000
70,000
75,000
80,000
85,000
1995 1996 1997 1998 1999 2000 2001
Fu
ll-T
ime
Gra
du
ate
Stu
de
nts
U.S. Students and PermanentResidentsForeign Students
Source: National Science Foundation Division of Science Resources Suties: Graduate Students and Postdoctorates in Science and Engineering: Fall 2001
Graduate Students in Engineering, Physical Sciences, Math & Computer Sciences in U.S. Institutions
0
10000
20000
30000
40000
50000
60000
70000
80000
0
20000
40000
60000
80000
100000
120000
140000
160000
180000
1955 1960 1965 1975 1985 19951970 1980 1990 2000
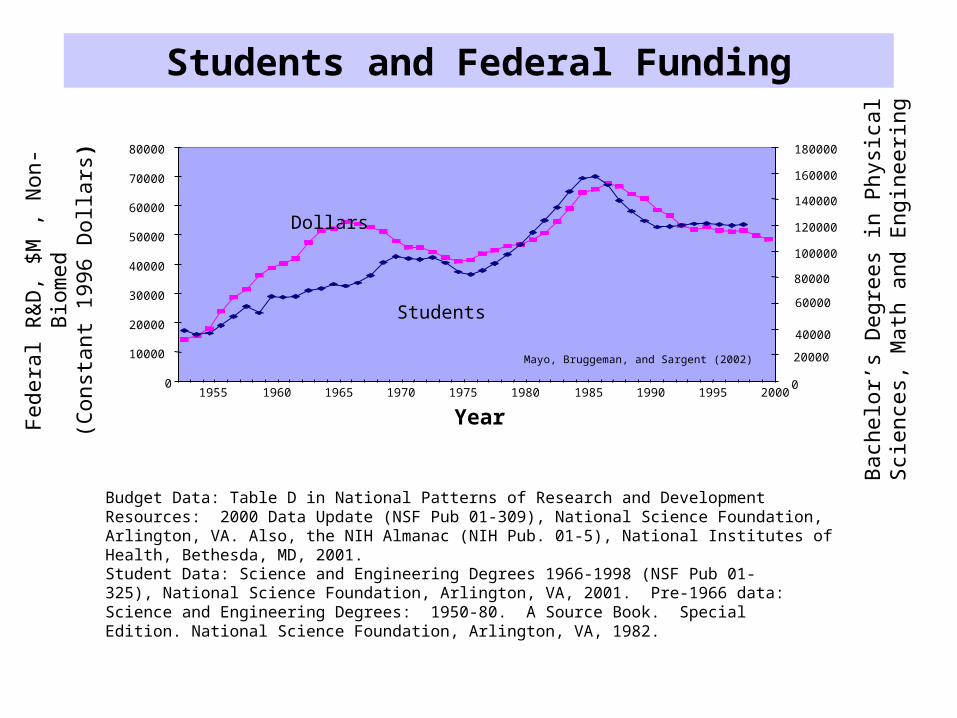
Students and Federal FundingF
eder
al R
&D
, $M
, N
on-B
iom
ed(C
onst
ant 1
996
Dol
lars
)
Bac
helo
r’s D
egre
es in
Phy
sica
l Sci
ence
s,
Mat
h an
d E
ngin
eerin
g
Year
Budget Data: Table D in National Patterns of Research and Development Resources: 2000 Data Update (NSF Pub 01-309), National Science Foundation, Arlington, VA. Also, the NIH Almanac (NIH Pub. 01-5), National Institutes of Health, Bethesda, MD, 2001.
Student Data: Science and Engineering Degrees 1966-1998 (NSF Pub 01-325), National Science Foundation, Arlington, VA, 2001. Pre-1966 data: Science and Engineering Degrees: 1950-80. A Source Book. Special Edition. National Science Foundation, Arlington, VA, 1982.
Dollars
Students
Mayo, Bruggeman, and Sargent (2002)

What can we do?
• Engage the public – all elements
• Get political – both parties
• Use our power in numbers — we’re very large