science engineering mathematics physical sciences life
TRANSCRIPT

Table 7. Doctorate-granting institutions, by state or location and major science and engineering fields of study: 2016
State or location and institution
Science Engineering
Life sciencesPhysical sciences and earth sciences
Mathematics and computer
sciences Psychology and social sciences
All institutions 54,904 12,568 1,385 8,884 2,299 6,252 2,704 1,227 2,321 3,957 2,085 1,872 9,078 3,946 460 1,238 745 615 2,074 9,469 369 1,089 923 565 1,827 256 985 1,299 2,156
Alabama 721 201 31 140 30 53 25 10 18 46 24 22 82 62 2 11 3 2 2 131 6 9 18 10 25 6 16 19 22
Alabama A&M U. 8 5 3 2 0 3 0 0 3 0 0 0 0 0 0 0 0 0 0 0 0 0 0 0 0 0 0 0 0
Alabama State U. 22 3 0 3 0 0 0 0 0 0 0 0 0 0 0 0 0 0 0 0 0 0 0 0 0 0 0 0 0
Auburn U., Auburn 270 63 25 30 8 6 4 1 1 16 7 9 38 28 0 6 2 0 2 65 3 1 12 4 17 6 5 6 11
Tuskegee U. 7 4 1 3 0 0 0 0 0 0 0 0 0 0 0 0 0 0 0 3 0 0 0 0 0 0 2 0 1
U. Alabama, Birmingham 157 92 1 76 15 13 7 1 5 9 5 4 12 10 0 0 0 2 0 16 0 6 0 2 0 0 3 2 3
U. Alabama, Huntsville 32 5 0 5 0 7 1 3 3 4 3 1 1 1 0 0 0 0 0 15 3 0 1 1 4 0 0 4 2
U. Alabama, Tuscaloosa 197 18 0 13 5 21 13 2 6 17 9 8 26 18 2 5 1 0 0 31 0 1 5 3 4 0 6 7 5
U. South Alabama 28 11 1 8 2 3 0 3 0 0 0 0 5 5 0 0 0 0 0 1 0 1 0 0 0 0 0 0 0
Alaska 48 20 10 10 0 14 0 12 2 1 1 0 6 2 2 0 0 0 2 5 0 0 0 2 1 0 0 2 0
All
field
s
Tota
l
Aer
ospa
ce, a
eron
autic
al, a
nd a
stro
naut
ical
Bio
engi
neer
ing
and
biom
edic
al
Che
mic
al
Civ
il
Elec
tric
al, e
lect
roni
cs, a
nd c
omm
unic
atio
ns
Indu
stria
l and
man
ufac
turin
g
Mat
eria
ls s
cien
ce
Mec
hani
cal
Oth
er e
ngin
eerin
g
Tota
l
Agr
icul
tura
l sci
ence
s an
d na
tura
l res
ourc
es
Bio
logi
cal a
nd b
iom
edic
al s
cien
ces
Hea
lth s
cien
ces
Tota
l
Che
mis
try
Geo
scie
nces
, atm
osph
eric
, and
oce
an s
cien
ces
Phys
ics
and
astr
onom
y
Tota
l
Com
pute
r and
info
rmat
ion
scie
nces
Mat
hem
atic
s an
d st
atis
tics
Tota
l
Psyc
holo
gy
Ant
hrop
olog
y
Econ
omic
s
Polit
ical
sci
ence
and
gov
ernm
ent
Soci
olog
y
Oth
er s
ocia
l sci
ence
s

Table 7. Doctorate-granting institutions, by state or location and major science and engineering fields of study: 2016
State or location and institution
Science Engineering
Life sciencesPhysical sciences and earth sciences
Mathematics and computer
sciences Psychology and social sciences
U. Alaska, Anchorage 1 0 0 0 0 0 0 0 0 0 0 0 1 1 0 0 0 0 0 0 0 0 0 0 0 0 0 0 0
U. Alaska, Fairbanks 47 20 10 10 0 14 0 12 2 1 1 0 5 1 2 0 0 0 2 5 0 0 0 2 1 0 0 2 0
Arizona 889 155 28 89 38 120 38 22 60 47 28 19 152 47 19 13 11 9 53 171 4 14 8 15 42 15 17 11 45
Arizona State U. 411 49 8 30 11 40 21 7 12 28 18 10 59 18 4 5 2 4 26 104 4 7 5 12 33 9 10 7 17
Northern Arizona U. 39 13 4 8 1 0 0 0 0 0 0 0 18 8 0 1 5 0 4 0 0 0 0 0 0 0 0 0 0
Prescott C. 3 1 1 0 0 0 0 0 0 0 0 0 0 0 0 0 0 0 0 0 0 0 0 0 0 0 0 0 0
U. Arizona 436 92 15 51 26 80 17 15 48 19 10 9 75 21 15 7 4 5 23 67 0 7 3 3 9 6 7 4 28
Arkansas 250 104 26 63 15 19 7 2 10 15 11 4 24 5 1 1 0 0 17 28 0 2 3 4 4 2 4 1 8
Arkansas State U., Jonesboro 8 4 3 1 0 1 0 1 0 0 0 0 1 0 1 0 0 0 0 0 0 0 0 0 0 0 0 0 0
U. Arkansas for Medical Sciences 39 37 0 31 6 0 0 0 0 0 0 0 1 1 0 0 0 0 0 0 0 0 0 0 0 0 0 0 0
All
field
s
Tota
l
Aer
ospa
ce, a
eron
autic
al, a
nd a
stro
naut
ical
Bio
engi
neer
ing
and
biom
edic
al
Che
mic
al
Civ
il
Elec
tric
al, e
lect
roni
cs, a
nd c
omm
unic
atio
ns
Indu
stria
l and
man
ufac
turin
g
Mat
eria
ls s
cien
ce
Mec
hani
cal
Oth
er e
ngin
eerin
g
Tota
l
Agr
icul
tura
l sci
ence
s an
d na
tura
l res
ourc
es
Bio
logi
cal a
nd b
iom
edic
al s
cien
ces
Hea
lth s
cien
ces
Tota
l
Che
mis
try
Geo
scie
nces
, atm
osph
eric
, and
oce
an s
cien
ces
Phys
ics
and
astr
onom
y
Tota
l
Com
pute
r and
info
rmat
ion
scie
nces
Mat
hem
atic
s an
d st
atis
tics
Tota
l
Psyc
holo
gy
Ant
hrop
olog
y
Econ
omic
s
Polit
ical
sci
ence
and
gov
ernm
ent
Soci
olog
y
Oth
er s
ocia
l sci
ence
s

Table 7. Doctorate-granting institutions, by state or location and major science and engineering fields of study: 2016
State or location and institution
Science Engineering
Life sciencesPhysical sciences and earth sciences
Mathematics and computer
sciences Psychology and social sciences
U. Arkansas, Fayetteville 162 49 23 19 7 14 6 1 7 5 1 4 16 4 0 1 0 0 11 25 0 2 3 4 4 2 4 1 5
U. Arkansas, Little Rock 41 14 0 12 2 4 1 0 3 10 10 0 6 0 0 0 0 0 6 3 0 0 0 0 0 0 0 0 3
California 6,118 1,217 103 948 166 817 328 190 299 475 254 221 1,299 563 78 188 107 86 277 1,146 49 155 91 44 271 2 154 163 217
Alliant International U., Alameda 30 0 0 0 0 0 0 0 0 0 0 0 30 30 0 0 0 0 0 0 0 0 0 0 0 0 0 0 0
Alliant International U., Alhambra 21 0 0 0 0 0 0 0 0 0 0 0 21 21 0 0 0 0 0 0 0 0 0 0 0 0 0 0 0
Alliant International U., Fresno 22 0 0 0 0 0 0 0 0 0 0 0 22 22 0 0 0 0 0 0 0 0 0 0 0 0 0 0 0
Alliant International U., San Diego 41 0 0 0 0 0 0 0 0 0 0 0 34 34 0 0 0 0 0 0 0 0 0 0 0 0 0 0 0
All
field
s
Tota
l
Aer
ospa
ce, a
eron
autic
al, a
nd a
stro
naut
ical
Bio
engi
neer
ing
and
biom
edic
al
Che
mic
al
Civ
il
Elec
tric
al, e
lect
roni
cs, a
nd c
omm
unic
atio
ns
Indu
stria
l and
man
ufac
turin
g
Mat
eria
ls s
cien
ce
Mec
hani
cal
Oth
er e
ngin
eerin
g
Tota
l
Agr
icul
tura
l sci
ence
s an
d na
tura
l res
ourc
es
Bio
logi
cal a
nd b
iom
edic
al s
cien
ces
Hea
lth s
cien
ces
Tota
l
Che
mis
try
Geo
scie
nces
, atm
osph
eric
, and
oce
an s
cien
ces
Phys
ics
and
astr
onom
y
Tota
l
Com
pute
r and
info
rmat
ion
scie
nces
Mat
hem
atic
s an
d st
atis
tics
Tota
l
Psyc
holo
gy
Ant
hrop
olog
y
Econ
omic
s
Polit
ical
sci
ence
and
gov
ernm
ent
Soci
olog
y
Oth
er s
ocia
l sci
ence
s

Table 7. Doctorate-granting institutions, by state or location and major science and engineering fields of study: 2016
State or location and institution
Science Engineering
Life sciencesPhysical sciences and earth sciences
Mathematics and computer
sciences Psychology and social sciences
Azusa Pacific U. 13 6 0 0 6 0 0 0 0 0 0 0 0 0 0 0 0 0 0 0 0 0 0 0 0 0 0 0 0
Biola U. 29 0 0 0 0 0 0 0 0 0 0 0 19 12 2 0 0 0 5 0 0 0 0 0 0 0 0 0 0
California Institute of Integral Studies 47 2 0 1 1 0 0 0 0 0 0 0 25 20 2 0 0 0 3 0 0 0 0 0 0 0 0 0 0
California Institute of Technology 189 26 1 25 0 74 27 23 24 8 2 6 9 2 0 6 0 0 1 72 11 3 7 1 13 0 13 14 10
Chapman U. 24 0 0 0 0 0 0 0 0 0 0 0 1 0 0 0 0 0 1 0 0 0 0 0 0 0 0 0 0
City of Hope, Irell and Manella Graduate School of Biological Sciences 11 11 0 11 0 0 0 0 0 0 0 0 0 0 0 0 0 0 0 0 0 0 0 0 0 0 0 0 0
Claremont Graduate U. 146 3 0 1 2 0 0 0 0 13 9 4 53 21 0 13 12 0 7 1 0 0 0 0 0 0 0 1 0
All
field
s
Tota
l
Aer
ospa
ce, a
eron
autic
al, a
nd a
stro
naut
ical
Bio
engi
neer
ing
and
biom
edic
al
Che
mic
al
Civ
il
Elec
tric
al, e
lect
roni
cs, a
nd c
omm
unic
atio
ns
Indu
stria
l and
man
ufac
turin
g
Mat
eria
ls s
cien
ce
Mec
hani
cal
Oth
er e
ngin
eerin
g
Tota
l
Agr
icul
tura
l sci
ence
s an
d na
tura
l res
ourc
es
Bio
logi
cal a
nd b
iom
edic
al s
cien
ces
Hea
lth s
cien
ces
Tota
l
Che
mis
try
Geo
scie
nces
, atm
osph
eric
, and
oce
an s
cien
ces
Phys
ics
and
astr
onom
y
Tota
l
Com
pute
r and
info
rmat
ion
scie
nces
Mat
hem
atic
s an
d st
atis
tics
Tota
l
Psyc
holo
gy
Ant
hrop
olog
y
Econ
omic
s
Polit
ical
sci
ence
and
gov
ernm
ent
Soci
olog
y
Oth
er s
ocia
l sci
ence
s

Table 7. Doctorate-granting institutions, by state or location and major science and engineering fields of study: 2016
State or location and institution
Science Engineering
Life sciencesPhysical sciences and earth sciences
Mathematics and computer
sciences Psychology and social sciences
Claremont School of Theology 8 0 0 0 0 0 0 0 0 0 0 0 1 1 0 0 0 0 0 0 0 0 0 0 0 0 0 0 0
Fielding Graduate U. 93 2 1 0 1 0 0 0 0 0 0 0 74 66 1 0 1 0 6 0 0 0 0 0 0 0 0 0 0
Frederick S. Pardee RAND Graduate School 22 1 1 0 0 0 0 0 0 0 0 0 20 0 0 0 2 0 18 0 0 0 0 0 0 0 0 0 0
Fuller Theological Seminary 33 0 0 0 0 0 0 0 0 0 0 0 13 11 2 0 0 0 0 0 0 0 0 0 0 0 0 0 0
Graduate Theological Union 25 0 0 0 0 0 0 0 0 0 0 0 2 0 0 0 0 0 2 0 0 0 0 0 0 0 0 0 0
Hebrew Union C.-Jewish Institute of 1 0 0 0 0 0 0 0 0 0 0 0 0 0 0 0 0 0 0 0 0 0 0 0 0 0 0 0 0
All
field
s
Tota
l
Aer
ospa
ce, a
eron
autic
al, a
nd a
stro
naut
ical
Bio
engi
neer
ing
and
biom
edic
al
Che
mic
al
Civ
il
Elec
tric
al, e
lect
roni
cs, a
nd c
omm
unic
atio
ns
Indu
stria
l and
man
ufac
turin
g
Mat
eria
ls s
cien
ce
Mec
hani
cal
Oth
er e
ngin
eerin
g
Tota
l
Agr
icul
tura
l sci
ence
s an
d na
tura
l res
ourc
es
Bio
logi
cal a
nd b
iom
edic
al s
cien
ces
Hea
lth s
cien
ces
Tota
l
Che
mis
try
Geo
scie
nces
, atm
osph
eric
, and
oce
an s
cien
ces
Phys
ics
and
astr
onom
y
Tota
l
Com
pute
r and
info
rmat
ion
scie
nces
Mat
hem
atic
s an
d st
atis
tics
Tota
l
Psyc
holo
gy
Ant
hrop
olog
y
Econ
omic
s
Polit
ical
sci
ence
and
gov
ernm
ent
Soci
olog
y
Oth
er s
ocia
l sci
ence
s

Table 7. Doctorate-granting institutions, by state or location and major science and engineering fields of study: 2016
State or location and institution
Science Engineering
Life sciencesPhysical sciences and earth sciences
Mathematics and computer
sciences Psychology and social sciences
Religion, Los Angeles
Keck Graduate Institute 1 1 0 1 0 0 0 0 0 0 0 0 0 0 0 0 0 0 0 0 0 0 0 0 0 0 0 0 0
La Sierra U. 8 0 0 0 0 0 0 0 0 0 0 0 0 0 0 0 0 0 0 0 0 0 0 0 0 0 0 0 0
Loma Linda U. 55 26 0 14 12 2 0 2 0 0 0 0 26 26 0 0 0 0 0 0 0 0 0 0 0 0 0 0 0
Palo Alto U. 55 0 0 0 0 0 0 0 0 0 0 0 55 55 0 0 0 0 0 0 0 0 0 0 0 0 0 0 0
San Diego State U., San Diego 14 1 0 1 0 3 0 1 2 7 0 7 0 0 0 0 0 0 0 0 0 0 0 0 0 0 0 0 0
Sanford-Burnham Medical Research Institute, La Jolla 5 5 0 5 0 0 0 0 0 0 0 0 0 0 0 0 0 0 0 0 0 0 0 0 0 0 0 0 0
Saybrook U. 47 7 0 2 5 0 0 0 0 1 1 0 31 30 0 0 0 0 1 0 0 0 0 0 0 0 0 0 0
All
field
s
Tota
l
Aer
ospa
ce, a
eron
autic
al, a
nd a
stro
naut
ical
Bio
engi
neer
ing
and
biom
edic
al
Che
mic
al
Civ
il
Elec
tric
al, e
lect
roni
cs, a
nd c
omm
unic
atio
ns
Indu
stria
l and
man
ufac
turin
g
Mat
eria
ls s
cien
ce
Mec
hani
cal
Oth
er e
ngin
eerin
g
Tota
l
Agr
icul
tura
l sci
ence
s an
d na
tura
l res
ourc
es
Bio
logi
cal a
nd b
iom
edic
al s
cien
ces
Hea
lth s
cien
ces
Tota
l
Che
mis
try
Geo
scie
nces
, atm
osph
eric
, and
oce
an s
cien
ces
Phys
ics
and
astr
onom
y
Tota
l
Com
pute
r and
info
rmat
ion
scie
nces
Mat
hem
atic
s an
d st
atis
tics
Tota
l
Psyc
holo
gy
Ant
hrop
olog
y
Econ
omic
s
Polit
ical
sci
ence
and
gov
ernm
ent
Soci
olog
y
Oth
er s
ocia
l sci
ence
s

Table 7. Doctorate-granting institutions, by state or location and major science and engineering fields of study: 2016
State or location and institution
Science Engineering
Life sciencesPhysical sciences and earth sciences
Mathematics and computer
sciences Psychology and social sciences
Scripps Research Institute 35 21 0 21 0 14 13 0 1 0 0 0 0 0 0 0 0 0 0 0 0 0 0 0 0 0 0 0 0
Sofia U. 9 1 0 1 0 0 0 0 0 0 0 0 8 8 0 0 0 0 0 0 0 0 0 0 0 0 0 0 0
Stanford U. 763 120 9 110 1 102 34 20 48 65 29 36 102 23 14 25 17 12 11 255 21 20 12 10 77 1 27 44 43
U. California, Berkeley 796 139 30 100 9 111 56 11 44 69 35 34 139 14 9 25 22 14 55 175 0 13 17 13 38 0 19 33 42
U. California, Davis 501 194 39 141 14 67 29 10 28 35 20 15 70 20 7 14 4 1 24 83 1 20 6 4 11 0 13 12 16
U. California, Irvine 393 58 0 53 5 73 39 11 23 59 39 20 82 14 8 15 10 17 18 54 1 10 4 3 6 0 6 3 21
U. California, Los Angeles 689 153 2 121 30 69 20 14 35 54 28 26 127 35 8 31 15 6 32 125 5 22 15 5 30 0 19 19 10
U. California, Merced 37 7 1 6 0 8 1 1 6 5 4 1 10 9 0 0 0 0 1 6 0 1 0 0 1 0 0 3 1
U. California, Riverside 239 52 8 44 0 36 17 7 12 28 15 13 35 13 4 8 2 4 4 45 0 9 9 0 7 0 8 6 6
All
field
s
Tota
l
Aer
ospa
ce, a
eron
autic
al, a
nd a
stro
naut
ical
Bio
engi
neer
ing
and
biom
edic
al
Che
mic
al
Civ
il
Elec
tric
al, e
lect
roni
cs, a
nd c
omm
unic
atio
ns
Indu
stria
l and
man
ufac
turin
g
Mat
eria
ls s
cien
ce
Mec
hani
cal
Oth
er e
ngin
eerin
g
Tota
l
Agr
icul
tura
l sci
ence
s an
d na
tura
l res
ourc
es
Bio
logi
cal a
nd b
iom
edic
al s
cien
ces
Hea
lth s
cien
ces
Tota
l
Che
mis
try
Geo
scie
nces
, atm
osph
eric
, and
oce
an s
cien
ces
Phys
ics
and
astr
onom
y
Tota
l
Com
pute
r and
info
rmat
ion
scie
nces
Mat
hem
atic
s an
d st
atis
tics
Tota
l
Psyc
holo
gy
Ant
hrop
olog
y
Econ
omic
s
Polit
ical
sci
ence
and
gov
ernm
ent
Soci
olog
y
Oth
er s
ocia
l sci
ence
s

Table 7. Doctorate-granting institutions, by state or location and major science and engineering fields of study: 2016
State or location and institution
Science Engineering
Life sciencesPhysical sciences and earth sciences
Mathematics and computer
sciences Psychology and social sciences
U. California, San Diego 521 102 0 87 15 99 31 43 25 35 15 20 90 26 6 15 13 11 19 115 1 25 1 2 29 0 19 9 29
U. California, San Francisco 123 94 0 67 27 6 5 0 1 0 0 0 9 0 1 0 0 4 4 12 0 12 0 0 0 0 0 0 0
U. California, Santa Barbara 328 25 7 18 0 60 21 15 24 34 15 19 73 22 6 12 3 9 21 66 0 1 11 0 18 0 21 7 8
U. California, Santa Cruz 174 41 4 35 2 40 8 15 17 23 17 6 36 10 5 11 2 4 4 8 0 0 0 0 3 0 1 0 4
U. of the Pacific 6 1 0 0 1 1 1 0 0 0 0 0 2 2 0 0 0 0 0 0 0 0 0 0 0 0 0 0 0
U. of the West 4 0 0 0 0 0 0 0 0 0 0 0 0 0 0 0 0 0 0 0 0 0 0 0 0 0 0 0 0
U. San Diego 37 15 0 0 15 0 0 0 0 0 0 0 6 0 0 0 0 0 6 0 0 0 0 0 0 0 0 0 0
U. San Francisco 32 0 0 0 0 0 0 0 0 0 0 0 3 0 0 0 0 0 3 0 0 0 0 0 0 0 0 0 0
U. Southern California 491 103 0 83 20 52 26 17 9 39 25 14 71 16 3 13 4 4 31 129 9 19 9 6 38 1 8 12 27
Colorado 1,070 225 37 159 29 167 37 69 61 73 32 41 125 63 4 14 9 9 26 233 26 12 33 27 34 1 12 31 57
All
field
s
Tota
l
Aer
ospa
ce, a
eron
autic
al, a
nd a
stro
naut
ical
Bio
engi
neer
ing
and
biom
edic
al
Che
mic
al
Civ
il
Elec
tric
al, e
lect
roni
cs, a
nd c
omm
unic
atio
ns
Indu
stria
l and
man
ufac
turin
g
Mat
eria
ls s
cien
ce
Mec
hani
cal
Oth
er e
ngin
eerin
g
Tota
l
Agr
icul
tura
l sci
ence
s an
d na
tura
l res
ourc
es
Bio
logi
cal a
nd b
iom
edic
al s
cien
ces
Hea
lth s
cien
ces
Tota
l
Che
mis
try
Geo
scie
nces
, atm
osph
eric
, and
oce
an s
cien
ces
Phys
ics
and
astr
onom
y
Tota
l
Com
pute
r and
info
rmat
ion
scie
nces
Mat
hem
atic
s an
d st
atis
tics
Tota
l
Psyc
holo
gy
Ant
hrop
olog
y
Econ
omic
s
Polit
ical
sci
ence
and
gov
ernm
ent
Soci
olog
y
Oth
er s
ocia
l sci
ence
s

Table 7. Doctorate-granting institutions, by state or location and major science and engineering fields of study: 2016
State or location and institution
Science Engineering
Life sciencesPhysical sciences and earth sciences
Mathematics and computer
sciences Psychology and social sciences
Colorado School of Mines 115 2 0 2 0 36 3 24 9 4 2 2 6 0 0 6 0 0 0 67 0 2 17 2 2 0 10 4 30
Colorado State U., Fort Collins 249 93 33 57 3 37 8 19 10 23 5 18 24 19 0 2 0 2 1 34 0 3 3 2 12 1 0 9 4
U. Colorado Boulder 400 47 4 39 4 81 20 25 36 32 18 14 45 11 4 6 7 7 10 106 24 3 13 21 15 0 2 12 16
U. Colorado Colorado Springs 22 0 0 0 0 2 0 0 2 4 4 0 1 1 0 0 0 0 0 4 0 0 0 0 0 0 0 2 2
U. Colorado Denver 34 6 0 0 6 0 0 0 0 3 1 2 10 4 0 0 0 0 6 8 0 1 0 2 1 0 0 1 3
U. Colorado, Denver, Aurora, Anschutz Medical Campus 69 68 0 56 12 0 0 0 0 0 0 0 1 1 0 0 0 0 0 0 0 0 0 0 0 0 0 0 0
U. Denver 115 4 0 4 0 10 5 1 4 5 2 3 25 14 0 0 2 0 9 14 2 3 0 0 4 0 0 3 2
All
field
s
Tota
l
Aer
ospa
ce, a
eron
autic
al, a
nd a
stro
naut
ical
Bio
engi
neer
ing
and
biom
edic
al
Che
mic
al
Civ
il
Elec
tric
al, e
lect
roni
cs, a
nd c
omm
unic
atio
ns
Indu
stria
l and
man
ufac
turin
g
Mat
eria
ls s
cien
ce
Mec
hani
cal
Oth
er e
ngin
eerin
g
Tota
l
Agr
icul
tura
l sci
ence
s an
d na
tura
l res
ourc
es
Bio
logi
cal a
nd b
iom
edic
al s
cien
ces
Hea
lth s
cien
ces
Tota
l
Che
mis
try
Geo
scie
nces
, atm
osph
eric
, and
oce
an s
cien
ces
Phys
ics
and
astr
onom
y
Tota
l
Com
pute
r and
info
rmat
ion
scie
nces
Mat
hem
atic
s an
d st
atis
tics
Tota
l
Psyc
holo
gy
Ant
hrop
olog
y
Econ
omic
s
Polit
ical
sci
ence
and
gov
ernm
ent
Soci
olog
y
Oth
er s
ocia
l sci
ence
s

Table 7. Doctorate-granting institutions, by state or location and major science and engineering fields of study: 2016
State or location and institution
Science Engineering
Life sciencesPhysical sciences and earth sciences
Mathematics and computer
sciences Psychology and social sciences
U. Northern Colorado 66 5 0 1 4 1 1 0 0 2 0 2 13 13 0 0 0 0 0 0 0 0 0 0 0 0 0 0 0
Connecticut 759 215 9 169 37 91 40 10 41 50 26 24 127 41 9 28 19 8 22 84 0 19 11 5 15 0 14 11 9
U. Bridgeport 4 0 0 0 0 0 0 0 0 2 2 0 0 0 0 0 0 0 0 2 0 0 0 0 0 0 0 0 2
U. Connecticut, Storrs 330 89 4 58 27 34 19 4 11 26 14 12 60 31 4 7 3 1 14 57 0 9 5 5 12 0 11 9 6
U. Hartford 1 0 0 0 0 0 0 0 0 0 0 0 0 0 0 0 0 0 0 0 0 0 0 0 0 0 0 0 0
U. New Haven 2 0 0 0 0 0 0 0 0 0 0 0 2 0 0 0 0 0 2 0 0 0 0 0 0 0 0 0 0
Wesleyan U. 15 7 0 7 0 6 4 0 2 2 0 2 0 0 0 0 0 0 0 0 0 0 0 0 0 0 0 0 0
Yale U. 407 119 5 104 10 51 17 6 28 20 10 10 65 10 5 21 16 7 6 25 0 10 6 0 3 0 3 2 1
Delaware 280 55 15 30 10 49 20 15 14 21 10 11 49 15 0 7 4 4 19 84 0 2 27 3 11 1 19 10 11
Delaware State U. 11 4 0 4 0 5 3 0 2 2 0 2 0 0 0 0 0 0 0 0 0 0 0 0 0 0 0 0 0
U. Delaware 269 51 15 26 10 44 17 15 12 19 10 9 49 15 0 7 4 4 19 84 0 2 27 3 11 1 19 10 11
District of Columbia 609 63 1 51 11 32 15 8 9 31 19 12 200 62 6 36 36 3 57 72 5 5 0 1 16 0 1 10 34
All
field
s
Tota
l
Aer
ospa
ce, a
eron
autic
al, a
nd a
stro
naut
ical
Bio
engi
neer
ing
and
biom
edic
al
Che
mic
al
Civ
il
Elec
tric
al, e
lect
roni
cs, a
nd c
omm
unic
atio
ns
Indu
stria
l and
man
ufac
turin
g
Mat
eria
ls s
cien
ce
Mec
hani
cal
Oth
er e
ngin
eerin
g
Tota
l
Agr
icul
tura
l sci
ence
s an
d na
tura
l res
ourc
es
Bio
logi
cal a
nd b
iom
edic
al s
cien
ces
Hea
lth s
cien
ces
Tota
l
Che
mis
try
Geo
scie
nces
, atm
osph
eric
, and
oce
an s
cien
ces
Phys
ics
and
astr
onom
y
Tota
l
Com
pute
r and
info
rmat
ion
scie
nces
Mat
hem
atic
s an
d st
atis
tics
Tota
l
Psyc
holo
gy
Ant
hrop
olog
y
Econ
omic
s
Polit
ical
sci
ence
and
gov
ernm
ent
Soci
olog
y
Oth
er s
ocia
l sci
ence
s

Table 7. Doctorate-granting institutions, by state or location and major science and engineering fields of study: 2016
State or location and institution
Science Engineering
Life sciencesPhysical sciences and earth sciences
Mathematics and computer
sciences Psychology and social sciences
American U. 51 1 1 0 0 0 0 0 0 0 0 0 39 13 4 13 2 0 7 0 0 0 0 0 0 0 0 0 0
Catholic U. of America 92 11 0 5 6 3 1 0 2 3 3 0 13 6 0 0 6 0 1 9 0 0 0 0 7 0 0 1 1
Gallaudet U. 10 0 0 0 0 0 0 0 0 0 0 0 7 3 0 0 0 0 4 0 0 0 0 0 0 0 0 0 0
George Washington U. 252 13 0 13 0 9 5 2 2 19 9 10 64 15 2 15 9 0 23 60 5 4 0 1 9 0 1 8 32
Georgetown U. 111 18 0 18 0 9 6 0 3 5 5 0 44 6 0 8 15 0 15 0 0 0 0 0 0 0 0 0 0
Howard U. 93 20 0 15 5 11 3 6 2 4 2 2 33 19 0 0 4 3 7 3 0 1 0 0 0 0 0 1 1
Florida 2,287 478 66 288 124 297 113 79 105 180 106 74 368 173 23 13 21 30 108 375 16 27 23 31 59 31 31 54 103
Barry U. 24 1 0 0 1 0 0 0 0 0 0 0 10 10 0 0 0 0 0 0 0 0 0 0 0 0 0 0 0
Embry-Riddle Aeronautical U., Daytona Beach 3 0 0 0 0 0 0 0 0 0 0 0 0 0 0 0 0 0 0 3 3 0 0 0 0 0 0 0 0
Florida A&M U. 14 6 2 1 3 1 0 0 1 0 0 0 0 0 0 0 0 0 0 2 0 0 0 0 1 0 0 0 1
Florida Atlantic U. 103 18 0 11 7 5 0 1 4 9 4 5 14 11 0 0 1 0 2 8 1 0 0 0 0 0 1 2 4
All
field
s
Tota
l
Aer
ospa
ce, a
eron
autic
al, a
nd a
stro
naut
ical
Bio
engi
neer
ing
and
biom
edic
al
Che
mic
al
Civ
il
Elec
tric
al, e
lect
roni
cs, a
nd c
omm
unic
atio
ns
Indu
stria
l and
man
ufac
turin
g
Mat
eria
ls s
cien
ce
Mec
hani
cal
Oth
er e
ngin
eerin
g
Tota
l
Agr
icul
tura
l sci
ence
s an
d na
tura
l res
ourc
es
Bio
logi
cal a
nd b
iom
edic
al s
cien
ces
Hea
lth s
cien
ces
Tota
l
Che
mis
try
Geo
scie
nces
, atm
osph
eric
, and
oce
an s
cien
ces
Phys
ics
and
astr
onom
y
Tota
l
Com
pute
r and
info
rmat
ion
scie
nces
Mat
hem
atic
s an
d st
atis
tics
Tota
l
Psyc
holo
gy
Ant
hrop
olog
y
Econ
omic
s
Polit
ical
sci
ence
and
gov
ernm
ent
Soci
olog
y
Oth
er s
ocia
l sci
ence
s

Table 7. Doctorate-granting institutions, by state or location and major science and engineering fields of study: 2016
State or location and institution
Science Engineering
Life sciencesPhysical sciences and earth sciences
Mathematics and computer
sciences Psychology and social sciences
Florida Institute of Technology 49 4 1 2 1 7 2 2 3 10 9 1 6 6 0 0 0 0 0 18 3 0 0 2 5 0 0 1 7
Florida International U. 138 23 0 18 5 23 13 6 4 9 9 0 24 11 1 4 1 1 6 36 0 4 0 4 6 0 3 4 15
Florida State U. 362 34 0 29 5 61 24 17 20 42 13 29 61 29 0 7 5 5 15 22 1 1 2 2 4 3 2 5 2
Nova Southeastern U. 102 0 0 0 0 1 0 1 0 40 27 13 47 20 0 0 0 0 27 1 0 0 0 0 0 0 0 0 1
U. Central Florida 245 27 0 13 14 46 12 1 33 17 16 1 34 21 0 0 0 9 4 72 2 0 1 8 13 15 2 12 19
U. Florida 730 241 57 132 52 91 49 17 25 35 17 18 96 31 13 2 13 8 29 138 6 11 16 8 17 2 22 17 39
U. Miami 215 54 5 39 10 41 7 27 7 8 4 4 32 20 0 0 1 3 8 24 0 9 0 3 3 3 0 3 3
U. South Florida, Tampa 287 69 1 43 25 20 6 7 7 10 7 3 43 14 9 0 0 4 16 51 0 2 4 4 10 8 1 10 12
U. West Florida 15 1 0 0 1 1 0 0 1 0 0 0 1 0 0 0 0 0 1 0 0 0 0 0 0 0 0 0 0
Georgia 1,464 327 32 242 53 142 81 20 41 116 71 45 174 74 11 24 14 8 43 333 27 35 29 15 73 6 31 48 69
Clark Atlanta U. 16 4 0 4 0 5 5 0 0 0 0 0 1 0 0 0 0 0 1 0 0 0 0 0 0 0 0 0 0
All
field
s
Tota
l
Aer
ospa
ce, a
eron
autic
al, a
nd a
stro
naut
ical
Bio
engi
neer
ing
and
biom
edic
al
Che
mic
al
Civ
il
Elec
tric
al, e
lect
roni
cs, a
nd c
omm
unic
atio
ns
Indu
stria
l and
man
ufac
turin
g
Mat
eria
ls s
cien
ce
Mec
hani
cal
Oth
er e
ngin
eerin
g
Tota
l
Agr
icul
tura
l sci
ence
s an
d na
tura
l res
ourc
es
Bio
logi
cal a
nd b
iom
edic
al s
cien
ces
Hea
lth s
cien
ces
Tota
l
Che
mis
try
Geo
scie
nces
, atm
osph
eric
, and
oce
an s
cien
ces
Phys
ics
and
astr
onom
y
Tota
l
Com
pute
r and
info
rmat
ion
scie
nces
Mat
hem
atic
s an
d st
atis
tics
Tota
l
Psyc
holo
gy
Ant
hrop
olog
y
Econ
omic
s
Polit
ical
sci
ence
and
gov
ernm
ent
Soci
olog
y
Oth
er s
ocia
l sci
ence
s

Table 7. Doctorate-granting institutions, by state or location and major science and engineering fields of study: 2016
State or location and institution
Science Engineering
Life sciencesPhysical sciences and earth sciences
Mathematics and computer
sciences Psychology and social sciences
Emory U. 228 87 0 72 15 24 23 0 1 11 2 9 32 10 5 3 5 3 6 0 0 0 0 0 0 0 0 0 0
Georgia Institute of Technology 531 30 0 28 2 62 24 11 27 65 54 11 19 8 0 2 0 0 9 324 27 33 29 15 72 6 28 48 66
Georgia Regents U. 20 20 0 19 1 0 0 0 0 0 0 0 0 0 0 0 0 0 0 0 0 0 0 0 0 0 0 0 0
Georgia Southern U. 2 0 0 0 0 0 0 0 0 2 0 2 0 0 0 0 0 0 0 0 0 0 0 0 0 0 0 0 0
Georgia State U. 198 29 0 24 5 17 11 0 6 14 8 6 37 18 0 10 3 2 4 0 0 0 0 0 0 0 0 0 0
Kennesaw State U. 4 0 0 0 0 0 0 0 0 0 0 0 1 0 0 0 0 0 1 0 0 0 0 0 0 0 0 0 0
Mercer U. 3 3 0 0 3 0 0 0 0 0 0 0 0 0 0 0 0 0 0 0 0 0 0 0 0 0 0 0 0
Morehouse School of Medicine 7 7 0 7 0 0 0 0 0 0 0 0 0 0 0 0 0 0 0 0 0 0 0 0 0 0 0 0 0
U. Georgia 455 147 32 88 27 34 18 9 7 24 7 17 84 38 6 9 6 3 22 9 0 2 0 0 1 0 3 0 3
All
field
s
Tota
l
Aer
ospa
ce, a
eron
autic
al, a
nd a
stro
naut
ical
Bio
engi
neer
ing
and
biom
edic
al
Che
mic
al
Civ
il
Elec
tric
al, e
lect
roni
cs, a
nd c
omm
unic
atio
ns
Indu
stria
l and
man
ufac
turin
g
Mat
eria
ls s
cien
ce
Mec
hani
cal
Oth
er e
ngin
eerin
g
Tota
l
Agr
icul
tura
l sci
ence
s an
d na
tura
l res
ourc
es
Bio
logi
cal a
nd b
iom
edic
al s
cien
ces
Hea
lth s
cien
ces
Tota
l
Che
mis
try
Geo
scie
nces
, atm
osph
eric
, and
oce
an s
cien
ces
Phys
ics
and
astr
onom
y
Tota
l
Com
pute
r and
info
rmat
ion
scie
nces
Mat
hem
atic
s an
d st
atis
tics
Tota
l
Psyc
holo
gy
Ant
hrop
olog
y
Econ
omic
s
Polit
ical
sci
ence
and
gov
ernm
ent
Soci
olog
y
Oth
er s
ocia
l sci
ence
s

Table 7. Doctorate-granting institutions, by state or location and major science and engineering fields of study: 2016
State or location and institution
Science Engineering
Life sciencesPhysical sciences and earth sciences
Mathematics and computer
sciences Psychology and social sciences
Hawaii 201 45 8 29 8 27 4 15 8 7 3 4 50 13 3 8 4 2 20 14 0 0 0 4 6 0 0 3 1
U. Hawaii, Manoa 201 45 8 29 8 27 4 15 8 7 3 4 50 13 3 8 4 2 20 14 0 0 0 4 6 0 0 3 1
Idaho 109 32 11 20 1 18 6 5 7 4 2 2 12 11 0 0 0 0 1 15 1 0 1 1 1 0 1 2 8
Boise State U. 2 1 0 1 0 0 0 0 0 0 0 0 0 0 0 0 0 0 0 1 0 0 0 0 0 0 0 0 1
Idaho State U. 38 2 0 2 0 7 0 1 6 0 0 0 9 9 0 0 0 0 0 3 0 0 0 0 0 0 0 0 3
U. Idaho 69 29 11 17 1 11 6 4 1 4 2 2 3 2 0 0 0 0 1 11 1 0 1 1 1 0 1 2 4
Illinois 2,427 466 49 354 63 284 155 20 109 157 78 79 453 195 29 76 33 33 87 384 9 37 37 35 64 12 66 43 81
Benedictine U. 20 1 0 0 1 0 0 0 0 0 0 0 1 1 0 0 0 0 0 0 0 0 0 0 0 0 0 0 0
Chicago Theological Seminary 4 0 0 0 0 0 0 0 0 0 0 0 1 1 0 0 0 0 0 0 0 0 0 0 0 0 0 0 0
DePaul U. 28 0 0 0 0 0 0 0 0 3 3 0 18 18 0 0 0 0 0 0 0 0 0 0 0 0 0 0 0
Garrett-Evangelical Theological Seminary 8 0 0 0 0 0 0 0 0 0 0 0 0 0 0 0 0 0 0 0 0 0 0 0 0 0 0 0 0
All
field
s
Tota
l
Aer
ospa
ce, a
eron
autic
al, a
nd a
stro
naut
ical
Bio
engi
neer
ing
and
biom
edic
al
Che
mic
al
Civ
il
Elec
tric
al, e
lect
roni
cs, a
nd c
omm
unic
atio
ns
Indu
stria
l and
man
ufac
turin
g
Mat
eria
ls s
cien
ce
Mec
hani
cal
Oth
er e
ngin
eerin
g
Tota
l
Agr
icul
tura
l sci
ence
s an
d na
tura
l res
ourc
es
Bio
logi
cal a
nd b
iom
edic
al s
cien
ces
Hea
lth s
cien
ces
Tota
l
Che
mis
try
Geo
scie
nces
, atm
osph
eric
, and
oce
an s
cien
ces
Phys
ics
and
astr
onom
y
Tota
l
Com
pute
r and
info
rmat
ion
scie
nces
Mat
hem
atic
s an
d st
atis
tics
Tota
l
Psyc
holo
gy
Ant
hrop
olog
y
Econ
omic
s
Polit
ical
sci
ence
and
gov
ernm
ent
Soci
olog
y
Oth
er s
ocia
l sci
ence
s

Table 7. Doctorate-granting institutions, by state or location and major science and engineering fields of study: 2016
State or location and institution
Science Engineering
Life sciencesPhysical sciences and earth sciences
Mathematics and computer
sciences Psychology and social sciences
Illinois Institute of Technology 86 4 0 3 1 5 2 0 3 12 6 6 12 12 0 0 0 0 0 41 1 6 8 1 9 0 5 1 10
Illinois State U. 43 5 0 3 2 0 0 0 0 0 0 0 8 7 0 0 0 0 1 0 0 0 0 0 0 0 0 0 0
Institute for Clinical Social Work, Chicago 14 0 0 0 0 0 0 0 0 0 0 0 1 0 0 0 0 0 1 0 0 0 0 0 0 0 0 0 0
Loyola U., Chicago 74 19 0 15 4 4 4 0 0 0 0 0 28 21 0 0 0 4 3 0 0 0 0 0 0 0 0 0 0
Lutheran School of Theology, Chicago 2 0 0 0 0 0 0 0 0 0 0 0 0 0 0 0 0 0 0 0 0 0 0 0 0 0 0 0 0
National Louis U. 4 0 0 0 0 0 0 0 0 0 0 0 4 4 0 0 0 0 0 0 0 0 0 0 0 0 0 0 0
Northern Illinois U. 74 7 0 7 0 7 4 0 3 3 0 3 33 22 0 3 4 0 4 2 0 0 0 0 0 0 2 0 0
Northwestern U. 454 84 2 79 3 61 41 5 15 23 8 15 84 25 5 24 9 5 16 103 0 14 10 6 9 4 28 14 18
All
field
s
Tota
l
Aer
ospa
ce, a
eron
autic
al, a
nd a
stro
naut
ical
Bio
engi
neer
ing
and
biom
edic
al
Che
mic
al
Civ
il
Elec
tric
al, e
lect
roni
cs, a
nd c
omm
unic
atio
ns
Indu
stria
l and
man
ufac
turin
g
Mat
eria
ls s
cien
ce
Mec
hani
cal
Oth
er e
ngin
eerin
g
Tota
l
Agr
icul
tura
l sci
ence
s an
d na
tura
l res
ourc
es
Bio
logi
cal a
nd b
iom
edic
al s
cien
ces
Hea
lth s
cien
ces
Tota
l
Che
mis
try
Geo
scie
nces
, atm
osph
eric
, and
oce
an s
cien
ces
Phys
ics
and
astr
onom
y
Tota
l
Com
pute
r and
info
rmat
ion
scie
nces
Mat
hem
atic
s an
d st
atis
tics
Tota
l
Psyc
holo
gy
Ant
hrop
olog
y
Econ
omic
s
Polit
ical
sci
ence
and
gov
ernm
ent
Soci
olog
y
Oth
er s
ocia
l sci
ence
s
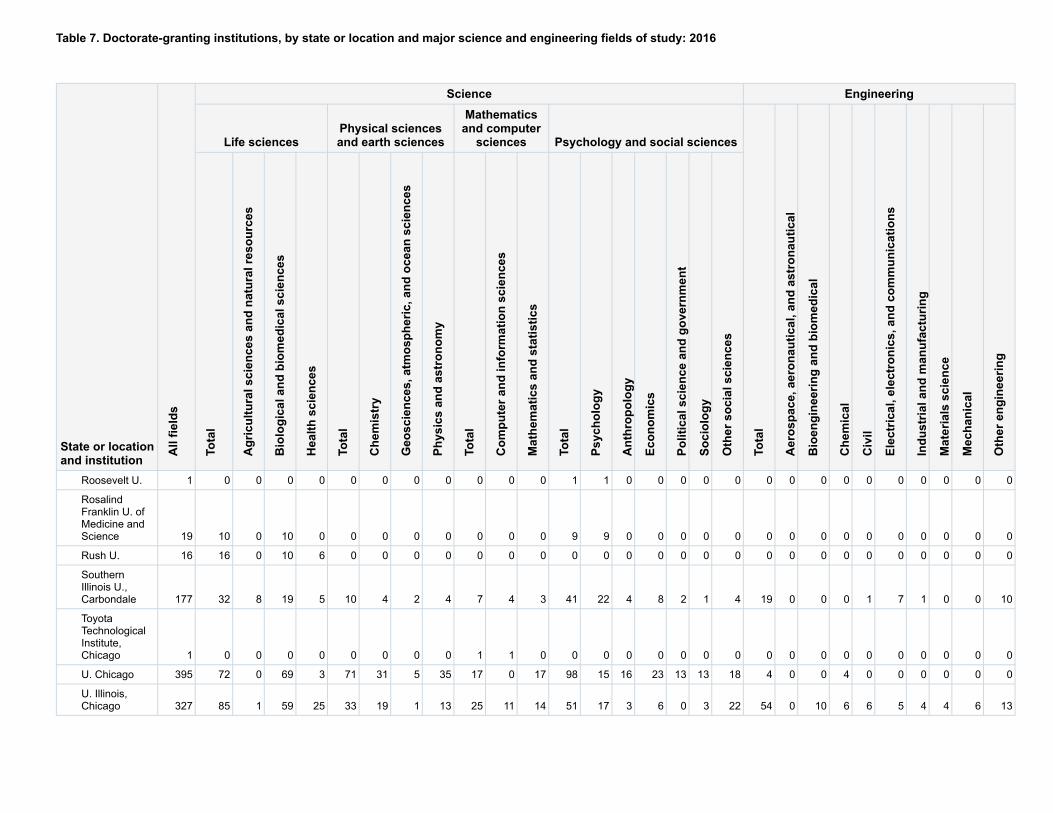
Table 7. Doctorate-granting institutions, by state or location and major science and engineering fields of study: 2016
State or location and institution
Science Engineering
Life sciencesPhysical sciences and earth sciences
Mathematics and computer
sciences Psychology and social sciences
Roosevelt U. 1 0 0 0 0 0 0 0 0 0 0 0 1 1 0 0 0 0 0 0 0 0 0 0 0 0 0 0 0
Rosalind Franklin U. of Medicine and Science 19 10 0 10 0 0 0 0 0 0 0 0 9 9 0 0 0 0 0 0 0 0 0 0 0 0 0 0 0
Rush U. 16 16 0 10 6 0 0 0 0 0 0 0 0 0 0 0 0 0 0 0 0 0 0 0 0 0 0 0 0
Southern Illinois U., Carbondale 177 32 8 19 5 10 4 2 4 7 4 3 41 22 4 8 2 1 4 19 0 0 0 1 7 1 0 0 10
Toyota Technological Institute, Chicago 1 0 0 0 0 0 0 0 0 1 1 0 0 0 0 0 0 0 0 0 0 0 0 0 0 0 0 0 0
U. Chicago 395 72 0 69 3 71 31 5 35 17 0 17 98 15 16 23 13 13 18 4 0 0 4 0 0 0 0 0 0
U. Illinois, Chicago 327 85 1 59 25 33 19 1 13 25 11 14 51 17 3 6 0 3 22 54 0 10 6 6 5 4 4 6 13
All
field
s
Tota
l
Aer
ospa
ce, a
eron
autic
al, a
nd a
stro
naut
ical
Bio
engi
neer
ing
and
biom
edic
al
Che
mic
al
Civ
il
Elec
tric
al, e
lect
roni
cs, a
nd c
omm
unic
atio
ns
Indu
stria
l and
man
ufac
turin
g
Mat
eria
ls s
cien
ce
Mec
hani
cal
Oth
er e
ngin
eerin
g
Tota
l
Agr
icul
tura
l sci
ence
s an
d na
tura
l res
ourc
es
Bio
logi
cal a
nd b
iom
edic
al s
cien
ces
Hea
lth s
cien
ces
Tota
l
Che
mis
try
Geo
scie
nces
, atm
osph
eric
, and
oce
an s
cien
ces
Phys
ics
and
astr
onom
y
Tota
l
Com
pute
r and
info
rmat
ion
scie
nces
Mat
hem
atic
s an
d st
atis
tics
Tota
l
Psyc
holo
gy
Ant
hrop
olog
y
Econ
omic
s
Polit
ical
sci
ence
and
gov
ernm
ent
Soci
olog
y
Oth
er s
ocia
l sci
ence
s

Table 7. Doctorate-granting institutions, by state or location and major science and engineering fields of study: 2016
State or location and institution
Science Engineering
Life sciencesPhysical sciences and earth sciences
Mathematics and computer
sciences Psychology and social sciences
U. Illinois, Urbana-Champaign 678 131 38 80 13 93 50 7 36 66 45 21 63 20 1 12 5 7 18 161 8 7 9 21 34 3 27 22 30
Wheaton C., Wheaton 2 0 0 0 0 0 0 0 0 0 0 0 0 0 0 0 0 0 0 0 0 0 0 0 0 0 0 0 0
Indiana 1,518 266 34 180 52 179 99 22 58 128 71 57 187 68 10 15 20 22 52 328 36 21 35 20 68 12 11 46 79
Ball State U. 25 5 3 0 2 0 0 0 0 0 0 0 12 11 0 0 0 0 1 0 0 0 0 0 0 0 0 0 0
Indiana State U. 73 4 0 4 0 1 0 1 0 1 1 0 3 2 0 0 0 0 1 6 0 0 0 0 0 3 0 1 2
Indiana U., Bloomington 405 55 2 37 16 45 24 5 16 30 19 11 101 32 7 8 8 11 35 1 0 0 0 0 0 0 0 0 1
Indiana U.-Purdue U., Indianapolis 74 49 0 36 13 2 0 2 0 6 5 1 3 0 0 1 0 1 1 0 0 0 0 0 0 0 0 0 0
Purdue U., West Lafayette 727 131 28 82 21 93 51 11 31 69 32 37 45 17 3 5 2 5 13 270 29 17 27 15 55 9 11 39 68
U. Notre Dame 214 22 1 21 0 38 24 3 11 22 14 8 23 6 0 1 10 5 1 51 7 4 8 5 13 0 0 6 8
All
field
s
Tota
l
Aer
ospa
ce, a
eron
autic
al, a
nd a
stro
naut
ical
Bio
engi
neer
ing
and
biom
edic
al
Che
mic
al
Civ
il
Elec
tric
al, e
lect
roni
cs, a
nd c
omm
unic
atio
ns
Indu
stria
l and
man
ufac
turin
g
Mat
eria
ls s
cien
ce
Mec
hani
cal
Oth
er e
ngin
eerin
g
Tota
l
Agr
icul
tura
l sci
ence
s an
d na
tura
l res
ourc
es
Bio
logi
cal a
nd b
iom
edic
al s
cien
ces
Hea
lth s
cien
ces
Tota
l
Che
mis
try
Geo
scie
nces
, atm
osph
eric
, and
oce
an s
cien
ces
Phys
ics
and
astr
onom
y
Tota
l
Com
pute
r and
info
rmat
ion
scie
nces
Mat
hem
atic
s an
d st
atis
tics
Tota
l
Psyc
holo
gy
Ant
hrop
olog
y
Econ
omic
s
Polit
ical
sci
ence
and
gov
ernm
ent
Soci
olog
y
Oth
er s
ocia
l sci
ence
s

Table 7. Doctorate-granting institutions, by state or location and major science and engineering fields of study: 2016
State or location and institution
Science Engineering
Life sciencesPhysical sciences and earth sciences
Mathematics and computer
sciences Psychology and social sciences
Iowa 712 192 18 131 43 62 35 9 18 51 16 35 90 38 3 15 5 6 23 127 8 9 7 13 19 3 14 15 39
Iowa State U. 322 81 18 56 7 28 17 3 8 27 12 15 43 13 0 12 0 4 14 96 8 1 5 8 15 2 13 11 33
Maharishi U. of Management 3 0 0 0 0 0 0 0 0 0 0 0 0 0 0 0 0 0 0 0 0 0 0 0 0 0 0 0 0
St. Ambrose U. 4 0 0 0 0 0 0 0 0 0 0 0 0 0 0 0 0 0 0 0 0 0 0 0 0 0 0 0 0
U. Iowa 369 109 0 75 34 34 18 6 10 24 4 20 47 25 3 3 5 2 9 31 0 8 2 5 4 1 1 4 6
U. Northern Iowa 14 2 0 0 2 0 0 0 0 0 0 0 0 0 0 0 0 0 0 0 0 0 0 0 0 0 0 0 0
Kansas 514 145 35 74 36 40 27 1 12 26 9 17 104 53 1 12 4 12 22 65 4 5 5 8 9 5 4 5 20
Kansas State U. 175 69 32 31 6 14 7 0 7 11 6 5 29 16 0 4 1 4 4 20 0 0 1 5 5 2 1 0 6
U. Kansas 302 74 3 42 29 24 18 1 5 13 3 10 63 25 1 8 3 8 18 27 2 5 4 3 3 0 1 0 9
Wichita State U. 37 2 0 1 1 2 2 0 0 2 0 2 12 12 0 0 0 0 0 18 2 0 0 0 1 3 2 5 5
Kentucky 480 132 12 88 32 22 12 2 8 33 14 19 80 40 3 6 4 4 23 59 0 5 12 6 6 5 4 8 13
All
field
s
Tota
l
Aer
ospa
ce, a
eron
autic
al, a
nd a
stro
naut
ical
Bio
engi
neer
ing
and
biom
edic
al
Che
mic
al
Civ
il
Elec
tric
al, e
lect
roni
cs, a
nd c
omm
unic
atio
ns
Indu
stria
l and
man
ufac
turin
g
Mat
eria
ls s
cien
ce
Mec
hani
cal
Oth
er e
ngin
eerin
g
Tota
l
Agr
icul
tura
l sci
ence
s an
d na
tura
l res
ourc
es
Bio
logi
cal a
nd b
iom
edic
al s
cien
ces
Hea
lth s
cien
ces
Tota
l
Che
mis
try
Geo
scie
nces
, atm
osph
eric
, and
oce
an s
cien
ces
Phys
ics
and
astr
onom
y
Tota
l
Com
pute
r and
info
rmat
ion
scie
nces
Mat
hem
atic
s an
d st
atis
tics
Tota
l
Psyc
holo
gy
Ant
hrop
olog
y
Econ
omic
s
Polit
ical
sci
ence
and
gov
ernm
ent
Soci
olog
y
Oth
er s
ocia
l sci
ence
s

Table 7. Doctorate-granting institutions, by state or location and major science and engineering fields of study: 2016
State or location and institution
Science Engineering
Life sciencesPhysical sciences and earth sciences
Mathematics and computer
sciences Psychology and social sciences
Asbury Theological Seminary 8 0 0 0 0 0 0 0 0 0 0 0 3 0 2 0 0 0 1 0 0 0 0 0 0 0 0 0 0
Southern Baptist Theological Seminary 36 0 0 0 0 0 0 0 0 0 0 0 4 3 0 0 0 0 1 0 0 0 0 0 0 0 0 0 0
U. Kentucky 299 83 11 48 24 15 6 2 7 24 11 13 51 22 1 6 4 4 14 43 0 5 7 6 4 1 4 7 9
U. Louisville 137 49 1 40 8 7 6 0 1 9 3 6 22 15 0 0 0 0 7 16 0 0 5 0 2 4 0 1 4
Louisiana 658 176 39 108 29 70 34 16 20 44 19 25 102 56 1 11 5 4 25 86 0 10 13 9 7 0 6 10 31
Grambling State U. 3 0 0 0 0 0 0 0 0 0 0 0 0 0 0 0 0 0 0 0 0 0 0 0 0 0 0 0 0
Louisiana State U., Baton Rouge 324 76 34 33 9 48 23 11 14 22 10 12 41 16 0 5 5 4 11 49 0 1 9 8 6 0 3 9 13
Louisiana State U., Health Sciences 24 24 0 18 6 0 0 0 0 0 0 0 0 0 0 0 0 0 0 0 0 0 0 0 0 0 0 0 0
All
field
s
Tota
l
Aer
ospa
ce, a
eron
autic
al, a
nd a
stro
naut
ical
Bio
engi
neer
ing
and
biom
edic
al
Che
mic
al
Civ
il
Elec
tric
al, e
lect
roni
cs, a
nd c
omm
unic
atio
ns
Indu
stria
l and
man
ufac
turin
g
Mat
eria
ls s
cien
ce
Mec
hani
cal
Oth
er e
ngin
eerin
g
Tota
l
Agr
icul
tura
l sci
ence
s an
d na
tura
l res
ourc
es
Bio
logi
cal a
nd b
iom
edic
al s
cien
ces
Hea
lth s
cien
ces
Tota
l
Che
mis
try
Geo
scie
nces
, atm
osph
eric
, and
oce
an s
cien
ces
Phys
ics
and
astr
onom
y
Tota
l
Com
pute
r and
info
rmat
ion
scie
nces
Mat
hem
atic
s an
d st
atis
tics
Tota
l
Psyc
holo
gy
Ant
hrop
olog
y
Econ
omic
s
Polit
ical
sci
ence
and
gov
ernm
ent
Soci
olog
y
Oth
er s
ocia
l sci
ence
s

Table 7. Doctorate-granting institutions, by state or location and major science and engineering fields of study: 2016
State or location and institution
Science Engineering
Life sciencesPhysical sciences and earth sciences
Mathematics and computer
sciences Psychology and social sciences
Center-New Orleans
Louisiana State U., Medical Center, Shreveport 12 12 0 12 0 0 0 0 0 0 0 0 0 0 0 0 0 0 0 0 0 0 0 0 0 0 0 0 0
Louisiana Tech U. 38 4 0 3 1 2 0 1 1 3 3 0 4 4 0 0 0 0 0 16 0 5 0 1 0 0 2 0 8
New Orleans Baptist Theological Seminary 15 0 0 0 0 0 0 0 0 0 0 0 3 3 0 0 0 0 0 0 0 0 0 0 0 0 0 0 0
Southern U. and A&M C., Baton Rouge 21 8 3 0 5 0 0 0 0 1 1 0 5 0 0 0 0 0 5 0 0 0 0 0 0 0 0 0 0
Tulane U. 116 29 1 28 0 12 8 1 3 8 0 8 22 10 1 5 0 0 6 8 0 4 4 0 0 0 0 0 0
U. Louisiana, Lafayette 43 12 1 7 4 1 0 1 0 10 5 5 1 1 0 0 0 0 0 8 0 0 0 0 0 0 0 0 8
All
field
s
Tota
l
Aer
ospa
ce, a
eron
autic
al, a
nd a
stro
naut
ical
Bio
engi
neer
ing
and
biom
edic
al
Che
mic
al
Civ
il
Elec
tric
al, e
lect
roni
cs, a
nd c
omm
unic
atio
ns
Indu
stria
l and
man
ufac
turin
g
Mat
eria
ls s
cien
ce
Mec
hani
cal
Oth
er e
ngin
eerin
g
Tota
l
Agr
icul
tura
l sci
ence
s an
d na
tura
l res
ourc
es
Bio
logi
cal a
nd b
iom
edic
al s
cien
ces
Hea
lth s
cien
ces
Tota
l
Che
mis
try
Geo
scie
nces
, atm
osph
eric
, and
oce
an s
cien
ces
Phys
ics
and
astr
onom
y
Tota
l
Com
pute
r and
info
rmat
ion
scie
nces
Mat
hem
atic
s an
d st
atis
tics
Tota
l
Psyc
holo
gy
Ant
hrop
olog
y
Econ
omic
s
Polit
ical
sci
ence
and
gov
ernm
ent
Soci
olog
y
Oth
er s
ocia
l sci
ence
s

Table 7. Doctorate-granting institutions, by state or location and major science and engineering fields of study: 2016
State or location and institution
Science Engineering
Life sciencesPhysical sciences and earth sciences
Mathematics and computer
sciences Psychology and social sciences
U. Louisiana, Monroe 19 8 0 4 4 0 0 0 0 0 0 0 10 10 0 0 0 0 0 0 0 0 0 0 0 0 0 0 0
U. New Orleans 43 3 0 3 0 7 3 2 2 0 0 0 16 12 0 1 0 0 3 5 0 0 0 0 1 0 1 1 2
Maine 75 22 7 15 0 5 1 2 2 3 3 0 15 7 1 0 0 0 7 8 0 1 3 1 1 0 1 1 0
U. Maine 59 22 7 15 0 5 1 2 2 3 3 0 9 7 1 0 0 0 1 8 0 1 3 1 1 0 1 1 0
U. Southern Maine 16 0 0 0 0 0 0 0 0 0 0 0 6 0 0 0 0 0 6 0 0 0 0 0 0 0 0 0 0
Maryland 1,274 401 18 286 97 136 43 20 73 132 81 51 187 63 3 26 24 7 64 226 12 44 18 11 46 0 21 37 37
Bowie State U. 2 0 0 0 0 0 0 0 0 2 2 0 0 0 0 0 0 0 0 0 0 0 0 0 0 0 0 0 0
Johns Hopkins U. 476 227 1 166 60 39 18 2 19 34 19 15 52 14 2 7 11 2 16 78 0 31 10 2 8 0 9 11 7
Loyola U., Maryland 5 0 0 0 0 0 0 0 0 0 0 0 2 2 0 0 0 0 0 0 0 0 0 0 0 0 0 0 0
Morgan State U. 28 6 0 2 4 1 1 0 0 0 0 0 2 0 0 0 0 0 2 5 0 0 0 0 3 0 0 0 2
All
field
s
Tota
l
Aer
ospa
ce, a
eron
autic
al, a
nd a
stro
naut
ical
Bio
engi
neer
ing
and
biom
edic
al
Che
mic
al
Civ
il
Elec
tric
al, e
lect
roni
cs, a
nd c
omm
unic
atio
ns
Indu
stria
l and
man
ufac
turin
g
Mat
eria
ls s
cien
ce
Mec
hani
cal
Oth
er e
ngin
eerin
g
Tota
l
Agr
icul
tura
l sci
ence
s an
d na
tura
l res
ourc
es
Bio
logi
cal a
nd b
iom
edic
al s
cien
ces
Hea
lth s
cien
ces
Tota
l
Che
mis
try
Geo
scie
nces
, atm
osph
eric
, and
oce
an s
cien
ces
Phys
ics
and
astr
onom
y
Tota
l
Com
pute
r and
info
rmat
ion
scie
nces
Mat
hem
atic
s an
d st
atis
tics
Tota
l
Psyc
holo
gy
Ant
hrop
olog
y
Econ
omic
s
Polit
ical
sci
ence
and
gov
ernm
ent
Soci
olog
y
Oth
er s
ocia
l sci
ence
s

Table 7. Doctorate-granting institutions, by state or location and major science and engineering fields of study: 2016
State or location and institution
Science Engineering
Life sciencesPhysical sciences and earth sciences
Mathematics and computer
sciences Psychology and social sciences
Notre Dame of Maryland U. 9 0 0 0 0 0 0 0 0 0 0 0 0 0 0 0 0 0 0 0 0 0 0 0 0 0 0 0 0
Towson U. 15 2 0 0 2 0 0 0 0 10 10 0 0 0 0 0 0 0 0 0 0 0 0 0 0 0 0 0 0
U. Maryland Baltimore 67 58 0 43 15 1 1 0 0 0 0 0 1 0 0 0 0 0 1 0 0 0 0 0 0 0 0 0 0
U. Maryland, Baltimore County 83 10 1 8 1 15 5 2 8 22 14 8 19 10 0 0 0 0 9 12 0 1 1 0 5 0 1 2 2
U. Maryland, College Park 546 77 12 51 14 77 18 13 46 64 36 28 99 27 1 19 12 5 35 131 12 12 7 9 30 0 11 24 26
U. Maryland, Eastern Shore 16 4 4 0 0 3 0 3 0 0 0 0 2 0 0 0 1 0 1 0 0 0 0 0 0 0 0 0 0
Uniformed Services U. of the Health Sciences 27 17 0 16 1 0 0 0 0 0 0 0 10 10 0 0 0 0 0 0 0 0 0 0 0 0 0 0 0
Massachusetts 2,897 713 29 580 104 407 162 56 189 194 105 89 464 110 25 115 53 32 129 575 26 84 48 22 111 3 69 85 127
Bentley U. 6 0 0 0 0 0 0 0 0 0 0 0 0 0 0 0 0 0 0 0 0 0 0 0 0 0 0 0 0
All
field
s
Tota
l
Aer
ospa
ce, a
eron
autic
al, a
nd a
stro
naut
ical
Bio
engi
neer
ing
and
biom
edic
al
Che
mic
al
Civ
il
Elec
tric
al, e
lect
roni
cs, a
nd c
omm
unic
atio
ns
Indu
stria
l and
man
ufac
turin
g
Mat
eria
ls s
cien
ce
Mec
hani
cal
Oth
er e
ngin
eerin
g
Tota
l
Agr
icul
tura
l sci
ence
s an
d na
tura
l res
ourc
es
Bio
logi
cal a
nd b
iom
edic
al s
cien
ces
Hea
lth s
cien
ces
Tota
l
Che
mis
try
Geo
scie
nces
, atm
osph
eric
, and
oce
an s
cien
ces
Phys
ics
and
astr
onom
y
Tota
l
Com
pute
r and
info
rmat
ion
scie
nces
Mat
hem
atic
s an
d st
atis
tics
Tota
l
Psyc
holo
gy
Ant
hrop
olog
y
Econ
omic
s
Polit
ical
sci
ence
and
gov
ernm
ent
Soci
olog
y
Oth
er s
ocia
l sci
ence
s

Table 7. Doctorate-granting institutions, by state or location and major science and engineering fields of study: 2016
State or location and institution
Science Engineering
Life sciencesPhysical sciences and earth sciences
Mathematics and computer
sciences Psychology and social sciences
Boston C. 130 17 0 13 4 16 14 0 2 4 0 4 28 8 0 10 4 6 0 1 0 0 0 0 0 0 0 0 1
Boston U. 385 119 1 99 19 41 12 11 18 19 9 10 63 15 3 25 6 3 11 60 0 23 0 0 11 0 7 8 11
Brandeis U. 83 24 0 20 4 14 4 0 10 6 2 4 24 4 1 2 0 4 13 0 0 0 0 0 0 0 0 0 0
Clark U. 38 12 3 9 0 5 2 0 3 0 0 0 20 9 0 6 0 0 5 0 0 0 0 0 0 0 0 0 0
Harvard U. 677 218 2 194 22 101 28 8 65 25 5 20 133 15 15 33 28 8 34 25 0 3 0 0 2 0 8 3 9
Massachusetts C. of Pharmacy and Health Sciences 5 5 0 0 5 0 0 0 0 0 0 0 0 0 0 0 0 0 0 0 0 0 0 0 0 0 0 0 0
Massachusetts Institute of Technology 646 93 0 86 7 127 47 26 54 57 29 28 57 8 1 26 4 0 18 279 25 25 28 10 53 0 40 58 40
New England Conservatory 7 0 0 0 0 0 0 0 0 0 0 0 0 0 0 0 0 0 0 0 0 0 0 0 0 0 0 0 0
Northeastern U. 186 26 0 16 10 25 14 2 9 16 9 7 36 13 0 2 6 7 8 68 0 6 4 6 17 3 4 8 20
Simmons C. 5 0 0 0 0 0 0 0 0 0 0 0 0 0 0 0 0 0 0 0 0 0 0 0 0 0 0 0 0
All
field
s
Tota
l
Aer
ospa
ce, a
eron
autic
al, a
nd a
stro
naut
ical
Bio
engi
neer
ing
and
biom
edic
al
Che
mic
al
Civ
il
Elec
tric
al, e
lect
roni
cs, a
nd c
omm
unic
atio
ns
Indu
stria
l and
man
ufac
turin
g
Mat
eria
ls s
cien
ce
Mec
hani
cal
Oth
er e
ngin
eerin
g
Tota
l
Agr
icul
tura
l sci
ence
s an
d na
tura
l res
ourc
es
Bio
logi
cal a
nd b
iom
edic
al s
cien
ces
Hea
lth s
cien
ces
Tota
l
Che
mis
try
Geo
scie
nces
, atm
osph
eric
, and
oce
an s
cien
ces
Phys
ics
and
astr
onom
y
Tota
l
Com
pute
r and
info
rmat
ion
scie
nces
Mat
hem
atic
s an
d st
atis
tics
Tota
l
Psyc
holo
gy
Ant
hrop
olog
y
Econ
omic
s
Polit
ical
sci
ence
and
gov
ernm
ent
Soci
olog
y
Oth
er s
ocia
l sci
ence
s

Table 7. Doctorate-granting institutions, by state or location and major science and engineering fields of study: 2016
State or location and institution
Science Engineering
Life sciencesPhysical sciences and earth sciences
Mathematics and computer
sciences Psychology and social sciences
Smith C. 11 0 0 0 0 0 0 0 0 0 0 0 0 0 0 0 0 0 0 0 0 0 0 0 0 0 0 0 0
Springfield C. 11 5 0 0 5 0 0 0 0 0 0 0 0 0 0 0 0 0 0 0 0 0 0 0 0 0 0 0 0
Suffolk U. 10 1 0 1 0 0 0 0 0 0 0 0 9 9 0 0 0 0 0 0 0 0 0 0 0 0 0 0 0
Tufts U., Medford 131 43 2 39 2 8 7 0 1 11 6 5 28 16 0 0 0 0 12 25 0 10 6 1 6 0 0 0 2
U. Massachusetts, Amherst 298 59 17 36 6 45 23 5 17 27 21 6 50 7 5 11 5 4 18 49 0 2 8 2 8 0 4 5 20
U. Massachusetts, Boston 50 14 4 4 6 4 2 2 0 7 7 0 13 6 0 0 0 0 7 0 0 0 0 0 0 0 0 0 0
U. Massachusetts, Dartmouth 32 6 0 1 5 2 0 2 0 0 0 0 0 0 0 0 0 0 0 12 0 6 0 0 4 0 0 0 2
U. Massachusetts, Lowell 96 14 0 7 7 15 6 0 9 11 10 1 3 0 0 0 0 0 3 39 0 6 0 1 7 0 2 3 20
All
field
s
Tota
l
Aer
ospa
ce, a
eron
autic
al, a
nd a
stro
naut
ical
Bio
engi
neer
ing
and
biom
edic
al
Che
mic
al
Civ
il
Elec
tric
al, e
lect
roni
cs, a
nd c
omm
unic
atio
ns
Indu
stria
l and
man
ufac
turin
g
Mat
eria
ls s
cien
ce
Mec
hani
cal
Oth
er e
ngin
eerin
g
Tota
l
Agr
icul
tura
l sci
ence
s an
d na
tura
l res
ourc
es
Bio
logi
cal a
nd b
iom
edic
al s
cien
ces
Hea
lth s
cien
ces
Tota
l
Che
mis
try
Geo
scie
nces
, atm
osph
eric
, and
oce
an s
cien
ces
Phys
ics
and
astr
onom
y
Tota
l
Com
pute
r and
info
rmat
ion
scie
nces
Mat
hem
atic
s an
d st
atis
tics
Tota
l
Psyc
holo
gy
Ant
hrop
olog
y
Econ
omic
s
Polit
ical
sci
ence
and
gov
ernm
ent
Soci
olog
y
Oth
er s
ocia
l sci
ence
s

Table 7. Doctorate-granting institutions, by state or location and major science and engineering fields of study: 2016
State or location and institution
Science Engineering
Life sciencesPhysical sciences and earth sciences
Mathematics and computer
sciences Psychology and social sciences
U. Massachusetts, Medical School 55 54 0 52 2 0 0 0 0 0 0 0 0 0 0 0 0 0 0 0 0 0 0 0 0 0 0 0 0
Worcester Polytechnic Institute 35 3 0 3 0 4 3 0 1 11 7 4 0 0 0 0 0 0 0 17 1 3 2 2 3 0 4 0 2
Michigan 1,907 372 51 264 57 222 102 32 88 135 63 72 313 121 25 50 30 29 58 357 10 28 27 12 73 17 45 70 75
Andrews U. 26 0 0 0 0 0 0 0 0 0 0 0 3 3 0 0 0 0 0 0 0 0 0 0 0 0 0 0 0
Calvin Theological Seminary 4 0 0 0 0 0 0 0 0 0 0 0 0 0 0 0 0 0 0 0 0 0 0 0 0 0 0 0 0
Central Michigan U. 28 1 0 1 0 1 0 0 1 1 0 1 14 14 0 0 0 0 0 5 0 0 0 0 0 0 5 0 0
Eastern Michigan U. 46 0 0 0 0 0 0 0 0 2 2 0 11 10 0 0 0 0 1 3 0 0 0 0 0 0 0 0 3
Michigan State U. 503 123 34 73 16 43 19 4 20 36 10 26 84 22 10 11 5 10 26 60 0 1 10 2 18 0 6 12 11
All
field
s
Tota
l
Aer
ospa
ce, a
eron
autic
al, a
nd a
stro
naut
ical
Bio
engi
neer
ing
and
biom
edic
al
Che
mic
al
Civ
il
Elec
tric
al, e
lect
roni
cs, a
nd c
omm
unic
atio
ns
Indu
stria
l and
man
ufac
turin
g
Mat
eria
ls s
cien
ce
Mec
hani
cal
Oth
er e
ngin
eerin
g
Tota
l
Agr
icul
tura
l sci
ence
s an
d na
tura
l res
ourc
es
Bio
logi
cal a
nd b
iom
edic
al s
cien
ces
Hea
lth s
cien
ces
Tota
l
Che
mis
try
Geo
scie
nces
, atm
osph
eric
, and
oce
an s
cien
ces
Phys
ics
and
astr
onom
y
Tota
l
Com
pute
r and
info
rmat
ion
scie
nces
Mat
hem
atic
s an
d st
atis
tics
Tota
l
Psyc
holo
gy
Ant
hrop
olog
y
Econ
omic
s
Polit
ical
sci
ence
and
gov
ernm
ent
Soci
olog
y
Oth
er s
ocia
l sci
ence
s

Table 7. Doctorate-granting institutions, by state or location and major science and engineering fields of study: 2016
State or location and institution
Science Engineering
Life sciencesPhysical sciences and earth sciences
Mathematics and computer
sciences Psychology and social sciences
Michigan Technological U. 86 16 9 7 0 17 3 6 8 8 5 3 5 4 0 0 0 0 1 32 0 4 3 1 2 1 5 10 6
Oakland U. 56 7 0 7 0 3 2 1 0 8 4 4 4 4 0 0 0 0 0 14 0 0 0 0 3 1 0 6 4
U. Detroit Mercy 9 0 0 0 0 0 0 0 0 0 0 0 9 9 0 0 0 0 0 0 0 0 0 0 0 0 0 0 0
U. Michigan, Ann Arbor 819 176 6 139 31 131 59 20 52 49 25 24 114 19 13 29 21 9 23 201 10 19 10 6 41 10 27 31 47
U. Michigan, Dearborn 4 0 0 0 0 0 0 0 0 2 2 0 0 0 0 0 0 0 0 2 0 0 0 0 1 0 0 1 0
Van Andel Institute 2 2 0 2 0 0 0 0 0 0 0 0 0 0 0 0 0 0 0 0 0 0 0 0 0 0 0 0 0
Wayne State U. 204 37 0 32 5 21 15 0 6 20 12 8 40 17 2 7 3 7 4 27 0 4 3 2 2 3 2 8 3
Western Michigan U. 120 10 2 3 5 6 4 1 1 9 3 6 29 19 0 3 1 3 3 13 0 0 1 1 6 2 0 2 1
Minnesota 1,465 416 29 182 205 79 41 12 26 55 34 21 371 217 1 33 11 8 101 145 9 27 19 10 27 2 14 21 16
All
field
s
Tota
l
Aer
ospa
ce, a
eron
autic
al, a
nd a
stro
naut
ical
Bio
engi
neer
ing
and
biom
edic
al
Che
mic
al
Civ
il
Elec
tric
al, e
lect
roni
cs, a
nd c
omm
unic
atio
ns
Indu
stria
l and
man
ufac
turin
g
Mat
eria
ls s
cien
ce
Mec
hani
cal
Oth
er e
ngin
eerin
g
Tota
l
Agr
icul
tura
l sci
ence
s an
d na
tura
l res
ourc
es
Bio
logi
cal a
nd b
iom
edic
al s
cien
ces
Hea
lth s
cien
ces
Tota
l
Che
mis
try
Geo
scie
nces
, atm
osph
eric
, and
oce
an s
cien
ces
Phys
ics
and
astr
onom
y
Tota
l
Com
pute
r and
info
rmat
ion
scie
nces
Mat
hem
atic
s an
d st
atis
tics
Tota
l
Psyc
holo
gy
Ant
hrop
olog
y
Econ
omic
s
Polit
ical
sci
ence
and
gov
ernm
ent
Soci
olog
y
Oth
er s
ocia
l sci
ence
s

Table 7. Doctorate-granting institutions, by state or location and major science and engineering fields of study: 2016
State or location and institution
Science Engineering
Life sciencesPhysical sciences and earth sciences
Mathematics and computer
sciences Psychology and social sciences
Luther Seminary 8 0 0 0 0 0 0 0 0 0 0 0 1 1 0 0 0 0 0 0 0 0 0 0 0 0 0 0 0
Mayo Clinic, Mayo Graduate School 35 30 0 29 1 0 0 0 0 0 0 0 0 0 0 0 0 0 0 5 0 5 0 0 0 0 0 0 0
U. Minnesota, Twin Cities 787 198 29 114 55 79 41 12 26 47 26 21 141 64 1 32 10 8 26 136 9 22 19 10 27 2 14 21 12
Walden U. 635 188 0 39 149 0 0 0 0 8 8 0 229 152 0 1 1 0 75 4 0 0 0 0 0 0 0 0 4
Mississippi 448 116 32 57 27 38 28 5 5 14 8 6 56 30 0 5 5 2 14 30 0 2 1 5 3 2 1 3 13
Jackson State U. 64 3 1 1 1 10 9 1 0 0 0 0 14 9 0 0 0 0 5 0 0 0 0 0 0 0 0 0 0
Mississippi State U. 153 51 30 19 2 11 6 2 3 10 6 4 7 1 0 0 0 2 4 26 0 2 1 5 3 2 1 3 9
U. Mississippi, Jackson, Medical Center 29 26 0 20 6 0 0 0 0 0 0 0 2 1 0 0 0 0 1 0 0 0 0 0 0 0 0 0 0
U. Mississippi, Oxford 92 25 0 7 18 8 8 0 0 0 0 0 19 9 0 4 4 0 2 0 0 0 0 0 0 0 0 0 0
All
field
s
Tota
l
Aer
ospa
ce, a
eron
autic
al, a
nd a
stro
naut
ical
Bio
engi
neer
ing
and
biom
edic
al
Che
mic
al
Civ
il
Elec
tric
al, e
lect
roni
cs, a
nd c
omm
unic
atio
ns
Indu
stria
l and
man
ufac
turin
g
Mat
eria
ls s
cien
ce
Mec
hani
cal
Oth
er e
ngin
eerin
g
Tota
l
Agr
icul
tura
l sci
ence
s an
d na
tura
l res
ourc
es
Bio
logi
cal a
nd b
iom
edic
al s
cien
ces
Hea
lth s
cien
ces
Tota
l
Che
mis
try
Geo
scie
nces
, atm
osph
eric
, and
oce
an s
cien
ces
Phys
ics
and
astr
onom
y
Tota
l
Com
pute
r and
info
rmat
ion
scie
nces
Mat
hem
atic
s an
d st
atis
tics
Tota
l
Psyc
holo
gy
Ant
hrop
olog
y
Econ
omic
s
Polit
ical
sci
ence
and
gov
ernm
ent
Soci
olog
y
Oth
er s
ocia
l sci
ence
s

Table 7. Doctorate-granting institutions, by state or location and major science and engineering fields of study: 2016
State or location and institution
Science Engineering
Life sciencesPhysical sciences and earth sciences
Mathematics and computer
sciences Psychology and social sciences
U. Southern Mississippi 110 11 1 10 0 9 5 2 2 4 2 2 14 10 0 1 1 0 2 4 0 0 0 0 0 0 0 0 4
Missouri 917 219 22 158 39 94 52 20 22 64 26 38 143 75 11 27 13 4 13 144 3 20 16 7 24 3 5 15 51
Concordia Seminary 6 0 0 0 0 0 0 0 0 0 0 0 1 0 0 0 0 0 1 0 0 0 0 0 0 0 0 0 0
Missouri U. of Science and Technology 107 2 1 1 0 21 11 6 4 13 6 7 0 0 0 0 0 0 0 71 3 1 6 4 13 1 3 6 34
Saint Louis U. 111 20 2 10 8 6 3 3 0 4 0 4 23 18 0 0 0 0 5 2 0 1 0 0 0 0 1 0 0
U. Missouri, Columbia 308 74 16 45 13 33 23 5 5 23 7 16 49 26 6 6 7 3 1 31 0 3 1 3 8 2 0 7 7
U. Missouri, Kansas City 64 10 0 3 7 7 5 1 1 8 6 2 19 10 0 7 0 1 1 3 0 0 0 0 2 0 0 0 1
U. Missouri, Saint Louis 57 6 2 2 2 3 3 0 0 0 0 0 21 11 0 0 5 0 5 0 0 0 0 0 0 0 0 0 0
Washington U., Saint Louis 264 107 1 97 9 24 7 5 12 16 7 9 30 10 5 14 1 0 0 37 0 15 9 0 1 0 1 2 9
All
field
s
Tota
l
Aer
ospa
ce, a
eron
autic
al, a
nd a
stro
naut
ical
Bio
engi
neer
ing
and
biom
edic
al
Che
mic
al
Civ
il
Elec
tric
al, e
lect
roni
cs, a
nd c
omm
unic
atio
ns
Indu
stria
l and
man
ufac
turin
g
Mat
eria
ls s
cien
ce
Mec
hani
cal
Oth
er e
ngin
eerin
g
Tota
l
Agr
icul
tura
l sci
ence
s an
d na
tura
l res
ourc
es
Bio
logi
cal a
nd b
iom
edic
al s
cien
ces
Hea
lth s
cien
ces
Tota
l
Che
mis
try
Geo
scie
nces
, atm
osph
eric
, and
oce
an s
cien
ces
Phys
ics
and
astr
onom
y
Tota
l
Com
pute
r and
info
rmat
ion
scie
nces
Mat
hem
atic
s an
d st
atis
tics
Tota
l
Psyc
holo
gy
Ant
hrop
olog
y
Econ
omic
s
Polit
ical
sci
ence
and
gov
ernm
ent
Soci
olog
y
Oth
er s
ocia
l sci
ence
s

Table 7. Doctorate-granting institutions, by state or location and major science and engineering fields of study: 2016
State or location and institution
Science Engineering
Life sciencesPhysical sciences and earth sciences
Mathematics and computer
sciences Psychology and social sciences
Montana 118 45 9 34 2 22 8 8 6 12 3 9 17 11 3 1 0 0 2 3 0 0 0 0 1 0 0 1 1
Montana State U., Bozeman 52 14 3 11 0 14 5 3 6 10 3 7 2 0 0 0 0 0 2 3 0 0 0 0 1 0 0 1 1
U. Montana, Missoula 66 31 6 23 2 8 3 5 0 2 0 2 15 11 3 1 0 0 0 0 0 0 0 0 0 0 0 0 0
Nebraska 388 159 30 99 30 25 12 7 6 25 10 15 52 36 0 1 5 3 7 50 0 4 2 5 7 1 4 7 20
Creighton U. 8 8 0 8 0 0 0 0 0 0 0 0 0 0 0 0 0 0 0 0 0 0 0 0 0 0 0 0 0
U. Nebraska-Lincoln 276 68 30 34 4 25 12 7 6 21 6 15 37 26 0 1 4 3 3 50 0 4 2 5 7 1 4 7 20
U. Nebraska, Medical Center 86 80 0 55 25 0 0 0 0 1 1 0 5 5 0 0 0 0 0 0 0 0 0 0 0 0 0 0 0
U. Nebraska, Omaha 18 3 0 2 1 0 0 0 0 3 3 0 10 5 0 0 1 0 4 0 0 0 0 0 0 0 0 0 0
Nevada 229 35 1 24 10 32 12 14 6 0 0 0 51 35 1 3 2 5 5 36 0 0 1 12 5 0 3 5 10
U. Nevada, Las Vegas 110 13 1 5 7 9 4 3 2 0 0 0 19 10 0 0 1 5 3 17 0 0 0 5 5 0 1 2 4
All
field
s
Tota
l
Aer
ospa
ce, a
eron
autic
al, a
nd a
stro
naut
ical
Bio
engi
neer
ing
and
biom
edic
al
Che
mic
al
Civ
il
Elec
tric
al, e
lect
roni
cs, a
nd c
omm
unic
atio
ns
Indu
stria
l and
man
ufac
turin
g
Mat
eria
ls s
cien
ce
Mec
hani
cal
Oth
er e
ngin
eerin
g
Tota
l
Agr
icul
tura
l sci
ence
s an
d na
tura
l res
ourc
es
Bio
logi
cal a
nd b
iom
edic
al s
cien
ces
Hea
lth s
cien
ces
Tota
l
Che
mis
try
Geo
scie
nces
, atm
osph
eric
, and
oce
an s
cien
ces
Phys
ics
and
astr
onom
y
Tota
l
Com
pute
r and
info
rmat
ion
scie
nces
Mat
hem
atic
s an
d st
atis
tics
Tota
l
Psyc
holo
gy
Ant
hrop
olog
y
Econ
omic
s
Polit
ical
sci
ence
and
gov
ernm
ent
Soci
olog
y
Oth
er s
ocia
l sci
ence
s
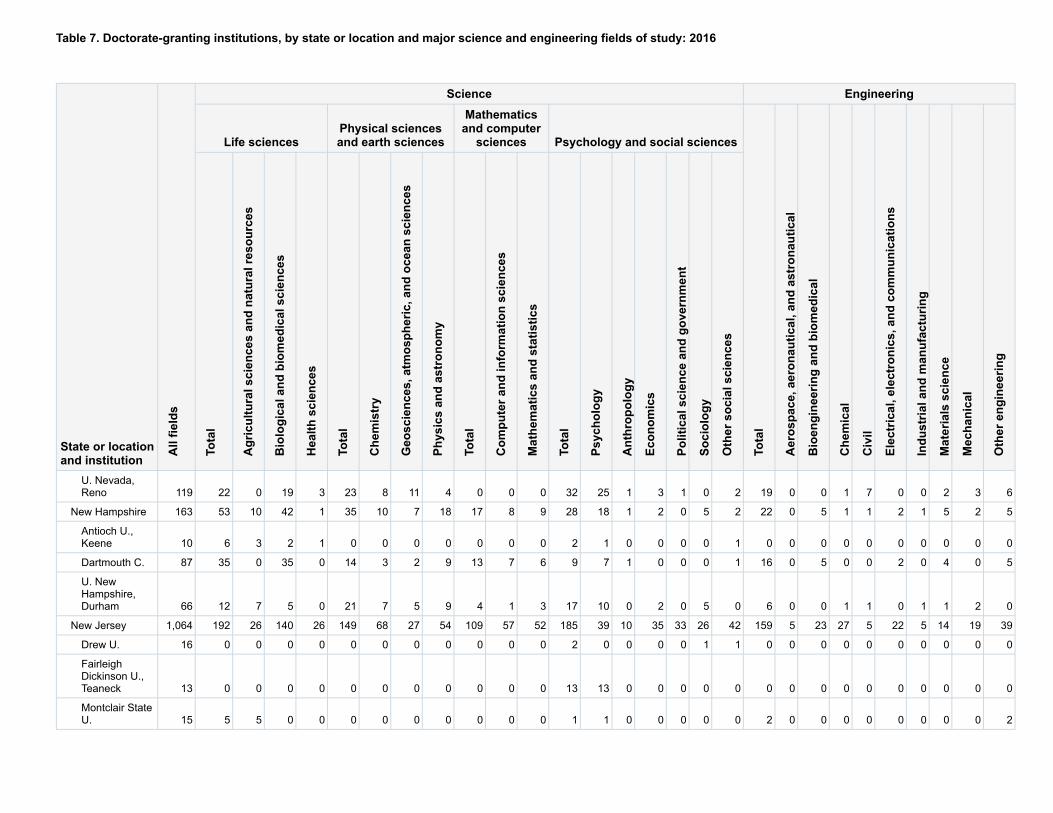
Table 7. Doctorate-granting institutions, by state or location and major science and engineering fields of study: 2016
State or location and institution
Science Engineering
Life sciencesPhysical sciences and earth sciences
Mathematics and computer
sciences Psychology and social sciences
U. Nevada, Reno 119 22 0 19 3 23 8 11 4 0 0 0 32 25 1 3 1 0 2 19 0 0 1 7 0 0 2 3 6
New Hampshire 163 53 10 42 1 35 10 7 18 17 8 9 28 18 1 2 0 5 2 22 0 5 1 1 2 1 5 2 5
Antioch U., Keene 10 6 3 2 1 0 0 0 0 0 0 0 2 1 0 0 0 0 1 0 0 0 0 0 0 0 0 0 0
Dartmouth C. 87 35 0 35 0 14 3 2 9 13 7 6 9 7 1 0 0 0 1 16 0 5 0 0 2 0 4 0 5
U. New Hampshire, Durham 66 12 7 5 0 21 7 5 9 4 1 3 17 10 0 2 0 5 0 6 0 0 1 1 0 1 1 2 0
New Jersey 1,064 192 26 140 26 149 68 27 54 109 57 52 185 39 10 35 33 26 42 159 5 23 27 5 22 5 14 19 39
Drew U. 16 0 0 0 0 0 0 0 0 0 0 0 2 0 0 0 0 1 1 0 0 0 0 0 0 0 0 0 0
Fairleigh Dickinson U., Teaneck 13 0 0 0 0 0 0 0 0 0 0 0 13 13 0 0 0 0 0 0 0 0 0 0 0 0 0 0 0
Montclair State U. 15 5 5 0 0 0 0 0 0 0 0 0 1 1 0 0 0 0 0 2 0 0 0 0 0 0 0 0 2
All
field
s
Tota
l
Aer
ospa
ce, a
eron
autic
al, a
nd a
stro
naut
ical
Bio
engi
neer
ing
and
biom
edic
al
Che
mic
al
Civ
il
Elec
tric
al, e
lect
roni
cs, a
nd c
omm
unic
atio
ns
Indu
stria
l and
man
ufac
turin
g
Mat
eria
ls s
cien
ce
Mec
hani
cal
Oth
er e
ngin
eerin
g
Tota
l
Agr
icul
tura
l sci
ence
s an
d na
tura
l res
ourc
es
Bio
logi
cal a
nd b
iom
edic
al s
cien
ces
Hea
lth s
cien
ces
Tota
l
Che
mis
try
Geo
scie
nces
, atm
osph
eric
, and
oce
an s
cien
ces
Phys
ics
and
astr
onom
y
Tota
l
Com
pute
r and
info
rmat
ion
scie
nces
Mat
hem
atic
s an
d st
atis
tics
Tota
l
Psyc
holo
gy
Ant
hrop
olog
y
Econ
omic
s
Polit
ical
sci
ence
and
gov
ernm
ent
Soci
olog
y
Oth
er s
ocia
l sci
ence
s

Table 7. Doctorate-granting institutions, by state or location and major science and engineering fields of study: 2016
State or location and institution
Science Engineering
Life sciencesPhysical sciences and earth sciences
Mathematics and computer
sciences Psychology and social sciences
New Jersey Institute of Technology 55 5 1 3 1 10 3 2 5 12 9 3 4 0 0 0 0 0 4 22 0 4 5 0 2 0 3 2 6
Princeton Theological Seminary 9 0 0 0 0 0 0 0 0 0 0 0 0 0 0 0 0 0 0 0 0 0 0 0 0 0 0 0 0
Princeton U. 373 30 0 30 0 84 41 12 31 42 22 20 82 4 5 27 24 15 7 50 5 2 12 1 12 0 4 4 10
Rowan U. 3 3 0 3 0 0 0 0 0 0 0 0 0 0 0 0 0 0 0 0 0 0 0 0 0 0 0 0 0
Rutgers, State U. New Jersey, Camden 8 1 0 1 0 0 0 0 0 0 0 0 2 0 0 0 0 0 2 0 0 0 0 0 0 0 0 0 0
Rutgers, State U. New Jersey, New Brunswick 416 122 19 93 10 43 19 10 14 41 18 23 54 11 5 8 7 10 13 60 0 13 9 4 5 5 7 10 7
Rutgers, State U. New Jersey, Newark 73 14 1 7 6 5 4 1 0 3 1 2 20 3 0 0 2 0 15 0 0 0 0 0 0 0 0 0 0
Seton Hall U. 32 10 0 1 9 0 0 0 0 0 0 0 7 7 0 0 0 0 0 0 0 0 0 0 0 0 0 0 0
All
field
s
Tota
l
Aer
ospa
ce, a
eron
autic
al, a
nd a
stro
naut
ical
Bio
engi
neer
ing
and
biom
edic
al
Che
mic
al
Civ
il
Elec
tric
al, e
lect
roni
cs, a
nd c
omm
unic
atio
ns
Indu
stria
l and
man
ufac
turin
g
Mat
eria
ls s
cien
ce
Mec
hani
cal
Oth
er e
ngin
eerin
g
Tota
l
Agr
icul
tura
l sci
ence
s an
d na
tura
l res
ourc
es
Bio
logi
cal a
nd b
iom
edic
al s
cien
ces
Hea
lth s
cien
ces
Tota
l
Che
mis
try
Geo
scie
nces
, atm
osph
eric
, and
oce
an s
cien
ces
Phys
ics
and
astr
onom
y
Tota
l
Com
pute
r and
info
rmat
ion
scie
nces
Mat
hem
atic
s an
d st
atis
tics
Tota
l
Psyc
holo
gy
Ant
hrop
olog
y
Econ
omic
s
Polit
ical
sci
ence
and
gov
ernm
ent
Soci
olog
y
Oth
er s
ocia
l sci
ence
s

Table 7. Doctorate-granting institutions, by state or location and major science and engineering fields of study: 2016
State or location and institution
Science Engineering
Life sciencesPhysical sciences and earth sciences
Mathematics and computer
sciences Psychology and social sciences
Stevens Institute of Technology 51 2 0 2 0 7 1 2 4 11 7 4 0 0 0 0 0 0 0 25 0 4 1 0 3 0 0 3 14
New Mexico 305 60 8 42 10 43 5 10 28 23 12 11 36 18 2 3 3 3 7 61 2 2 10 3 13 2 2 9 18
New Mexico Institute of Mining and Technology 16 0 0 0 0 11 1 7 3 2 1 1 0 0 0 0 0 0 0 3 0 0 0 0 0 0 0 0 3
New Mexico State U., Las Cruces 97 19 5 12 2 11 1 1 9 8 4 4 6 6 0 0 0 0 0 24 1 0 6 0 5 2 0 4 6
U. New Mexico, Albuquerque 192 41 3 30 8 21 3 2 16 13 7 6 30 12 2 3 3 3 7 34 1 2 4 3 8 0 2 5 9
New York 4,196 907 51 755 101 446 183 57 206 338 182 156 835 373 65 116 74 72 135 524 5 85 55 20 107 14 62 74 102
Adelphi U. 18 2 0 0 2 0 0 0 0 0 0 0 14 14 0 0 0 0 0 0 0 0 0 0 0 0 0 0 0
Albany Medical C. 7 7 0 7 0 0 0 0 0 0 0 0 0 0 0 0 0 0 0 0 0 0 0 0 0 0 0 0 0
All
field
s
Tota
l
Aer
ospa
ce, a
eron
autic
al, a
nd a
stro
naut
ical
Bio
engi
neer
ing
and
biom
edic
al
Che
mic
al
Civ
il
Elec
tric
al, e
lect
roni
cs, a
nd c
omm
unic
atio
ns
Indu
stria
l and
man
ufac
turin
g
Mat
eria
ls s
cien
ce
Mec
hani
cal
Oth
er e
ngin
eerin
g
Tota
l
Agr
icul
tura
l sci
ence
s an
d na
tura
l res
ourc
es
Bio
logi
cal a
nd b
iom
edic
al s
cien
ces
Hea
lth s
cien
ces
Tota
l
Che
mis
try
Geo
scie
nces
, atm
osph
eric
, and
oce
an s
cien
ces
Phys
ics
and
astr
onom
y
Tota
l
Com
pute
r and
info
rmat
ion
scie
nces
Mat
hem
atic
s an
d st
atis
tics
Tota
l
Psyc
holo
gy
Ant
hrop
olog
y
Econ
omic
s
Polit
ical
sci
ence
and
gov
ernm
ent
Soci
olog
y
Oth
er s
ocia
l sci
ence
s

Table 7. Doctorate-granting institutions, by state or location and major science and engineering fields of study: 2016
State or location and institution
Science Engineering
Life sciencesPhysical sciences and earth sciences
Mathematics and computer
sciences Psychology and social sciences
Alfred U. 5 0 0 0 0 0 0 0 0 0 0 0 0 0 0 0 0 0 0 5 0 1 0 0 0 0 4 0 0
Clarkson U. 21 2 0 2 0 6 6 0 0 2 0 2 0 0 0 0 0 0 0 11 0 0 2 2 3 0 1 1 2
Cold Spring Harbor Laboratory 8 8 0 8 0 0 0 0 0 0 0 0 0 0 0 0 0 0 0 0 0 0 0 0 0 0 0 0 0
Columbia U. in the City of New York 500 103 2 84 17 73 25 16 32 50 25 25 58 2 10 17 16 5 8 73 0 18 4 2 15 1 7 9 17
Columbia U., Teachers C. 180 13 0 2 11 0 0 0 0 1 0 1 44 34 4 3 1 0 2 0 0 0 0 0 0 0 0 0 0
Cornell U. 492 113 30 81 2 73 24 7 42 49 26 23 72 17 6 17 6 12 14 104 3 24 16 7 14 0 9 14 17
Cornell U., Graduate School of Medical Sciences 58 57 0 55 2 1 1 0 0 0 0 0 0 0 0 0 0 0 0 0 0 0 0 0 0 0 0 0 0
CUNY, City C. 38 0 0 0 0 6 2 3 1 1 1 0 0 0 0 0 0 0 0 31 0 4 6 4 6 0 0 7 4
All
field
s
Tota
l
Aer
ospa
ce, a
eron
autic
al, a
nd a
stro
naut
ical
Bio
engi
neer
ing
and
biom
edic
al
Che
mic
al
Civ
il
Elec
tric
al, e
lect
roni
cs, a
nd c
omm
unic
atio
ns
Indu
stria
l and
man
ufac
turin
g
Mat
eria
ls s
cien
ce
Mec
hani
cal
Oth
er e
ngin
eerin
g
Tota
l
Agr
icul
tura
l sci
ence
s an
d na
tura
l res
ourc
es
Bio
logi
cal a
nd b
iom
edic
al s
cien
ces
Hea
lth s
cien
ces
Tota
l
Che
mis
try
Geo
scie
nces
, atm
osph
eric
, and
oce
an s
cien
ces
Phys
ics
and
astr
onom
y
Tota
l
Com
pute
r and
info
rmat
ion
scie
nces
Mat
hem
atic
s an
d st
atis
tics
Tota
l
Psyc
holo
gy
Ant
hrop
olog
y
Econ
omic
s
Polit
ical
sci
ence
and
gov
ernm
ent
Soci
olog
y
Oth
er s
ocia
l sci
ence
s

Table 7. Doctorate-granting institutions, by state or location and major science and engineering fields of study: 2016
State or location and institution
Science Engineering
Life sciencesPhysical sciences and earth sciences
Mathematics and computer
sciences Psychology and social sciences
CUNY, Graduate Center 431 58 3 39 16 35 12 2 21 29 14 15 152 76 12 13 12 7 32 4 0 1 0 1 2 0 0 0 0
Fordham U. 107 7 0 7 0 0 0 0 0 0 0 0 48 41 0 1 0 2 4 0 0 0 0 0 0 0 0 0 0
Hofstra U. 25 0 0 0 0 0 0 0 0 0 0 0 25 25 0 0 0 0 0 0 0 0 0 0 0 0 0 0 0
Icahn School of Medicine at Mt. Sinai 24 24 0 24 0 0 0 0 0 0 0 0 0 0 0 0 0 0 0 0 0 0 0 0 0 0 0 0 0
Jewish Theological Seminary of America 2 0 0 0 0 0 0 0 0 0 0 0 0 0 0 0 0 0 0 0 0 0 0 0 0 0 0 0 0
Long Island U., Brooklyn 18 0 0 0 0 0 0 0 0 0 0 0 18 18 0 0 0 0 0 0 0 0 0 0 0 0 0 0 0
Long Island U., Brookville 3 0 0 0 0 0 0 0 0 3 3 0 0 0 0 0 0 0 0 0 0 0 0 0 0 0 0 0 0
New School 62 0 0 0 0 0 0 0 0 0 0 0 49 17 2 11 4 8 7 0 0 0 0 0 0 0 0 0 0
All
field
s
Tota
l
Aer
ospa
ce, a
eron
autic
al, a
nd a
stro
naut
ical
Bio
engi
neer
ing
and
biom
edic
al
Che
mic
al
Civ
il
Elec
tric
al, e
lect
roni
cs, a
nd c
omm
unic
atio
ns
Indu
stria
l and
man
ufac
turin
g
Mat
eria
ls s
cien
ce
Mec
hani
cal
Oth
er e
ngin
eerin
g
Tota
l
Agr
icul
tura
l sci
ence
s an
d na
tura
l res
ourc
es
Bio
logi
cal a
nd b
iom
edic
al s
cien
ces
Hea
lth s
cien
ces
Tota
l
Che
mis
try
Geo
scie
nces
, atm
osph
eric
, and
oce
an s
cien
ces
Phys
ics
and
astr
onom
y
Tota
l
Com
pute
r and
info
rmat
ion
scie
nces
Mat
hem
atic
s an
d st
atis
tics
Tota
l
Psyc
holo
gy
Ant
hrop
olog
y
Econ
omic
s
Polit
ical
sci
ence
and
gov
ernm
ent
Soci
olog
y
Oth
er s
ocia
l sci
ence
s

Table 7. Doctorate-granting institutions, by state or location and major science and engineering fields of study: 2016
State or location and institution
Science Engineering
Life sciencesPhysical sciences and earth sciences
Mathematics and computer
sciences Psychology and social sciences
New York Medical C. 6 6 0 6 0 0 0 0 0 0 0 0 0 0 0 0 0 0 0 0 0 0 0 0 0 0 0 0 0
New York U. 483 85 0 72 13 28 19 0 9 45 21 24 103 27 15 19 10 12 20 29 0 1 1 0 13 0 0 4 10
Pace U. 1 0 0 0 0 0 0 0 0 1 1 0 0 0 0 0 0 0 0 0 0 0 0 0 0 0 0 0 0
Rensselaer Polytechnic Institute, Troy 142 11 0 11 0 16 6 1 9 23 16 7 4 1 0 1 0 0 2 72 1 4 10 1 20 2 4 18 12
Rochester Institute of Technology 35 5 2 2 1 12 0 0 12 7 6 1 2 1 0 1 0 0 0 8 0 0 0 0 2 0 0 1 5
Rockefeller U. 31 27 0 27 0 4 4 0 0 0 0 0 0 0 0 0 0 0 0 0 0 0 0 0 0 0 0 0 0
St. John's U., Queens 55 27 0 18 9 2 2 0 0 0 0 0 8 7 0 0 0 0 1 0 0 0 0 0 0 0 0 0 0
SUNY, Binghamton U. 131 13 0 9 4 8 4 1 3 15 8 7 27 9 2 3 6 2 5 23 0 0 1 0 5 5 4 3 5
SUNY, C. of Environmental 20 17 12 5 0 1 1 0 0 0 0 0 0 0 0 0 0 0 0 2 0 0 1 0 0 0 0 0 1
All
field
s
Tota
l
Aer
ospa
ce, a
eron
autic
al, a
nd a
stro
naut
ical
Bio
engi
neer
ing
and
biom
edic
al
Che
mic
al
Civ
il
Elec
tric
al, e
lect
roni
cs, a
nd c
omm
unic
atio
ns
Indu
stria
l and
man
ufac
turin
g
Mat
eria
ls s
cien
ce
Mec
hani
cal
Oth
er e
ngin
eerin
g
Tota
l
Agr
icul
tura
l sci
ence
s an
d na
tura
l res
ourc
es
Bio
logi
cal a
nd b
iom
edic
al s
cien
ces
Hea
lth s
cien
ces
Tota
l
Che
mis
try
Geo
scie
nces
, atm
osph
eric
, and
oce
an s
cien
ces
Phys
ics
and
astr
onom
y
Tota
l
Com
pute
r and
info
rmat
ion
scie
nces
Mat
hem
atic
s an
d st
atis
tics
Tota
l
Psyc
holo
gy
Ant
hrop
olog
y
Econ
omic
s
Polit
ical
sci
ence
and
gov
ernm
ent
Soci
olog
y
Oth
er s
ocia
l sci
ence
s

Table 7. Doctorate-granting institutions, by state or location and major science and engineering fields of study: 2016
State or location and institution
Science Engineering
Life sciencesPhysical sciences and earth sciences
Mathematics and computer
sciences Psychology and social sciences
Science and Forestry
SUNY, C. of Optometry 2 1 0 1 0 0 0 0 0 0 0 0 1 1 0 0 0 0 0 0 0 0 0 0 0 0 0 0 0
SUNY, Downstate Medical Center 11 6 0 6 0 0 0 0 0 0 0 0 0 0 0 0 0 0 0 5 0 5 0 0 0 0 0 0 0
SUNY, Stony Brook U. 272 40 1 39 0 63 21 18 24 49 20 29 43 12 5 8 8 8 2 35 0 8 0 0 8 0 14 3 2
SUNY, U. Albany 183 21 0 19 2 19 8 3 8 14 8 6 49 19 3 3 3 10 11 16 0 3 1 0 0 0 9 0 3
SUNY, U. Buffalo 335 71 0 56 15 33 22 2 9 28 20 8 52 19 5 2 3 3 20 54 0 3 9 3 7 6 2 6 18
SUNY, Upstate Medical U. 18 18 0 18 0 0 0 0 0 0 0 0 0 0 0 0 0 0 0 0 0 0 0 0 0 0 0 0 0
Syracuse U. 133 15 1 12 2 18 7 2 9 10 7 3 19 2 1 4 2 3 7 19 1 5 1 0 5 0 1 5 1
All
field
s
Tota
l
Aer
ospa
ce, a
eron
autic
al, a
nd a
stro
naut
ical
Bio
engi
neer
ing
and
biom
edic
al
Che
mic
al
Civ
il
Elec
tric
al, e
lect
roni
cs, a
nd c
omm
unic
atio
ns
Indu
stria
l and
man
ufac
turin
g
Mat
eria
ls s
cien
ce
Mec
hani
cal
Oth
er e
ngin
eerin
g
Tota
l
Agr
icul
tura
l sci
ence
s an
d na
tura
l res
ourc
es
Bio
logi
cal a
nd b
iom
edic
al s
cien
ces
Hea
lth s
cien
ces
Tota
l
Che
mis
try
Geo
scie
nces
, atm
osph
eric
, and
oce
an s
cien
ces
Phys
ics
and
astr
onom
y
Tota
l
Com
pute
r and
info
rmat
ion
scie
nces
Mat
hem
atic
s an
d st
atis
tics
Tota
l
Psyc
holo
gy
Ant
hrop
olog
y
Econ
omic
s
Polit
ical
sci
ence
and
gov
ernm
ent
Soci
olog
y
Oth
er s
ocia
l sci
ence
s

Table 7. Doctorate-granting institutions, by state or location and major science and engineering fields of study: 2016
State or location and institution
Science Engineering
Life sciencesPhysical sciences and earth sciences
Mathematics and computer
sciences Psychology and social sciences
Union Theological Seminary 7 0 0 0 0 0 0 0 0 0 0 0 0 0 0 0 0 0 0 0 0 0 0 0 0 0 0 0 0
U. Rochester 240 79 0 74 5 48 19 2 27 11 6 5 30 14 0 13 3 0 0 32 0 7 3 0 7 0 7 3 5
Yeshiva U. 92 71 0 71 0 0 0 0 0 0 0 0 17 17 0 0 0 0 0 1 0 1 0 0 0 0 0 0 0
North Carolina 1,809 529 51 376 102 167 77 32 58 169 74 95 243 99 10 42 20 16 56 300 3 52 17 19 61 12 44 36 56
Duke U. 408 130 9 110 11 36 11 13 12 28 16 12 74 28 6 13 13 5 9 72 0 30 0 0 22 0 3 10 7
East Carolina U. 40 25 1 20 4 2 0 0 2 0 0 0 11 10 0 0 0 0 1 0 0 0 0 0 0 0 0 0 0
North Carolina Agricultural and Technical State U. 47 5 1 4 0 1 0 1 0 3 3 0 1 0 0 1 0 0 0 22 0 0 2 0 4 3 1 7 5
North Carolina State U. 482 85 34 48 3 52 28 8 16 77 25 52 34 15 0 12 0 3 4 163 3 11 15 15 25 9 36 15 34
Southeastern Baptist 19 0 0 0 0 0 0 0 0 0 0 0 0 0 0 0 0 0 0 0 0 0 0 0 0 0 0 0 0
All
field
s
Tota
l
Aer
ospa
ce, a
eron
autic
al, a
nd a
stro
naut
ical
Bio
engi
neer
ing
and
biom
edic
al
Che
mic
al
Civ
il
Elec
tric
al, e
lect
roni
cs, a
nd c
omm
unic
atio
ns
Indu
stria
l and
man
ufac
turin
g
Mat
eria
ls s
cien
ce
Mec
hani
cal
Oth
er e
ngin
eerin
g
Tota
l
Agr
icul
tura
l sci
ence
s an
d na
tura
l res
ourc
es
Bio
logi
cal a
nd b
iom
edic
al s
cien
ces
Hea
lth s
cien
ces
Tota
l
Che
mis
try
Geo
scie
nces
, atm
osph
eric
, and
oce
an s
cien
ces
Phys
ics
and
astr
onom
y
Tota
l
Com
pute
r and
info
rmat
ion
scie
nces
Mat
hem
atic
s an
d st
atis
tics
Tota
l
Psyc
holo
gy
Ant
hrop
olog
y
Econ
omic
s
Polit
ical
sci
ence
and
gov
ernm
ent
Soci
olog
y
Oth
er s
ocia
l sci
ence
s

Table 7. Doctorate-granting institutions, by state or location and major science and engineering fields of study: 2016
State or location and institution
Science Engineering
Life sciencesPhysical sciences and earth sciences
Mathematics and computer
sciences Psychology and social sciences
Theological Seminary
U. North Carolina, Chapel Hill 510 198 6 137 55 54 30 8 16 43 19 24 76 22 4 12 7 8 23 12 0 6 0 0 0 0 3 0 3
U. North Carolina, Charlotte 105 13 0 8 5 4 1 0 3 18 11 7 18 5 0 0 0 0 13 26 0 0 0 4 10 0 1 4 7
U. North Carolina, Greensboro 140 33 0 13 20 5 3 0 2 0 0 0 29 19 0 4 0 0 6 0 0 0 0 0 0 0 0 0 0
U. North Carolina, Wilmington 2 0 0 0 0 2 0 2 0 0 0 0 0 0 0 0 0 0 0 0 0 0 0 0 0 0 0 0 0
Wake Forest U. 56 40 0 36 4 11 4 0 7 0 0 0 0 0 0 0 0 0 0 5 0 5 0 0 0 0 0 0 0
North Dakota 185 52 24 22 6 18 9 5 4 23 13 10 19 11 0 3 0 1 4 27 1 1 1 0 6 1 2 2 13
North Dakota State U. 113 36 24 11 1 11 7 1 3 22 12 10 9 4 0 3 0 1 1 20 0 1 0 0 3 1 2 2 11
All
field
s
Tota
l
Aer
ospa
ce, a
eron
autic
al, a
nd a
stro
naut
ical
Bio
engi
neer
ing
and
biom
edic
al
Che
mic
al
Civ
il
Elec
tric
al, e
lect
roni
cs, a
nd c
omm
unic
atio
ns
Indu
stria
l and
man
ufac
turin
g
Mat
eria
ls s
cien
ce
Mec
hani
cal
Oth
er e
ngin
eerin
g
Tota
l
Agr
icul
tura
l sci
ence
s an
d na
tura
l res
ourc
es
Bio
logi
cal a
nd b
iom
edic
al s
cien
ces
Hea
lth s
cien
ces
Tota
l
Che
mis
try
Geo
scie
nces
, atm
osph
eric
, and
oce
an s
cien
ces
Phys
ics
and
astr
onom
y
Tota
l
Com
pute
r and
info
rmat
ion
scie
nces
Mat
hem
atic
s an
d st
atis
tics
Tota
l
Psyc
holo
gy
Ant
hrop
olog
y
Econ
omic
s
Polit
ical
sci
ence
and
gov
ernm
ent
Soci
olog
y
Oth
er s
ocia
l sci
ence
s

Table 7. Doctorate-granting institutions, by state or location and major science and engineering fields of study: 2016
State or location and institution
Science Engineering
Life sciencesPhysical sciences and earth sciences
Mathematics and computer
sciences Psychology and social sciences
U. North Dakota 72 16 0 11 5 7 2 4 1 1 1 0 10 7 0 0 0 0 3 7 1 0 1 0 3 0 0 0 2
Ohio 2,043 479 41 353 85 257 121 29 107 126 72 54 246 124 4 16 10 21 71 407 28 39 39 14 90 12 38 54 93
Air Force Institute of Technology 41 0 0 0 0 7 0 0 7 7 4 3 0 0 0 0 0 0 0 24 10 0 0 0 7 0 1 0 6
Bowling Green State U., Bowling Green 66 8 0 6 2 5 5 0 0 3 0 3 26 12 0 0 0 2 12 0 0 0 0 0 0 0 0 0 0
Case Western Reserve U. 212 69 0 66 3 31 13 4 14 13 10 3 11 4 2 0 0 3 2 55 2 11 2 2 9 0 6 6 17
Cleveland State U. 54 15 0 15 0 2 2 0 0 0 0 0 6 4 0 0 0 0 2 9 0 5 0 0 2 0 0 1 1
Hebrew Union C.-Jewish Institute of Religion, Cincinnati 1 0 0 0 0 0 0 0 0 0 0 0 0 0 0 0 0 0 0 0 0 0 0 0 0 0 0 0 0
All
field
s
Tota
l
Aer
ospa
ce, a
eron
autic
al, a
nd a
stro
naut
ical
Bio
engi
neer
ing
and
biom
edic
al
Che
mic
al
Civ
il
Elec
tric
al, e
lect
roni
cs, a
nd c
omm
unic
atio
ns
Indu
stria
l and
man
ufac
turin
g
Mat
eria
ls s
cien
ce
Mec
hani
cal
Oth
er e
ngin
eerin
g
Tota
l
Agr
icul
tura
l sci
ence
s an
d na
tura
l res
ourc
es
Bio
logi
cal a
nd b
iom
edic
al s
cien
ces
Hea
lth s
cien
ces
Tota
l
Che
mis
try
Geo
scie
nces
, atm
osph
eric
, and
oce
an s
cien
ces
Phys
ics
and
astr
onom
y
Tota
l
Com
pute
r and
info
rmat
ion
scie
nces
Mat
hem
atic
s an
d st
atis
tics
Tota
l
Psyc
holo
gy
Ant
hrop
olog
y
Econ
omic
s
Polit
ical
sci
ence
and
gov
ernm
ent
Soci
olog
y
Oth
er s
ocia
l sci
ence
s

Table 7. Doctorate-granting institutions, by state or location and major science and engineering fields of study: 2016
State or location and institution
Science Engineering
Life sciencesPhysical sciences and earth sciences
Mathematics and computer
sciences Psychology and social sciences
Kent State U., Kent 156 38 0 24 14 20 4 1 15 13 9 4 22 17 0 0 1 0 4 0 0 0 0 0 0 0 0 0 0
Miami U., Oxford 45 13 2 11 0 10 3 7 0 0 0 0 12 9 0 0 0 0 3 0 0 0 0 0 0 0 0 0 0
Northeast Ohio Medical U. 1 1 0 0 1 0 0 0 0 0 0 0 0 0 0 0 0 0 0 0 0 0 0 0 0 0 0 0 0
Ohio State U., Columbus 716 192 35 115 42 72 30 10 32 50 30 20 93 28 2 16 7 11 29 137 8 9 16 2 37 5 19 21 20
Ohio U., Delaware 118 16 2 13 1 17 4 2 11 7 3 4 10 9 0 0 0 0 1 17 0 0 5 2 3 3 0 0 4
U. Akron, Akron 122 4 0 4 0 37 27 2 8 1 0 1 15 10 0 0 0 4 1 50 1 6 8 6 2 0 2 10 15
U. Cincinnati, Uptown West Campus 283 76 1 58 17 34 22 2 10 15 5 10 30 10 0 0 2 1 17 54 7 5 5 1 9 1 6 8 12
U. Dayton 41 3 0 3 0 2 0 0 2 0 0 0 0 0 0 0 0 0 0 23 0 0 0 0 13 0 1 5 4
U. Toledo 136 33 0 28 5 19 11 0 8 7 1 6 13 13 0 0 0 0 0 17 0 2 3 1 4 2 0 3 2
All
field
s
Tota
l
Aer
ospa
ce, a
eron
autic
al, a
nd a
stro
naut
ical
Bio
engi
neer
ing
and
biom
edic
al
Che
mic
al
Civ
il
Elec
tric
al, e
lect
roni
cs, a
nd c
omm
unic
atio
ns
Indu
stria
l and
man
ufac
turin
g
Mat
eria
ls s
cien
ce
Mec
hani
cal
Oth
er e
ngin
eerin
g
Tota
l
Agr
icul
tura
l sci
ence
s an
d na
tura
l res
ourc
es
Bio
logi
cal a
nd b
iom
edic
al s
cien
ces
Hea
lth s
cien
ces
Tota
l
Che
mis
try
Geo
scie
nces
, atm
osph
eric
, and
oce
an s
cien
ces
Phys
ics
and
astr
onom
y
Tota
l
Com
pute
r and
info
rmat
ion
scie
nces
Mat
hem
atic
s an
d st
atis
tics
Tota
l
Psyc
holo
gy
Ant
hrop
olog
y
Econ
omic
s
Polit
ical
sci
ence
and
gov
ernm
ent
Soci
olog
y
Oth
er s
ocia
l sci
ence
s

Table 7. Doctorate-granting institutions, by state or location and major science and engineering fields of study: 2016
State or location and institution
Science Engineering
Life sciencesPhysical sciences and earth sciences
Mathematics and computer
sciences Psychology and social sciences
Wright State U., Dayton 50 11 1 10 0 1 0 1 0 10 10 0 8 8 0 0 0 0 0 20 0 1 0 0 4 1 2 0 12
Youngstown State U. 1 0 0 0 0 0 0 0 0 0 0 0 0 0 0 0 0 0 0 1 0 0 0 0 0 0 1 0 0
Oklahoma 538 111 21 74 16 48 13 18 17 22 13 9 79 45 3 8 1 5 17 100 3 3 15 6 21 4 3 14 31
Oklahoma City U. 9 1 0 0 1 0 0 0 0 0 0 0 0 0 0 0 0 0 0 0 0 0 0 0 0 0 0 0 0
Oklahoma State U., Center for Health Sciences 4 3 0 3 0 1 0 1 0 0 0 0 0 0 0 0 0 0 0 0 0 0 0 0 0 0 0 0 0
Oklahoma State U., Stillwater 255 60 20 33 7 20 8 2 10 8 5 3 28 15 0 5 1 1 6 49 3 2 5 6 11 2 2 9 9
U. Oklahoma, Norman 234 45 1 36 8 25 4 15 6 11 5 6 44 24 3 3 0 4 10 39 0 1 8 0 10 2 0 2 16
U. Tulsa 36 2 0 2 0 2 1 0 1 3 3 0 7 6 0 0 0 0 1 12 0 0 2 0 0 0 1 3 6
All
field
s
Tota
l
Aer
ospa
ce, a
eron
autic
al, a
nd a
stro
naut
ical
Bio
engi
neer
ing
and
biom
edic
al
Che
mic
al
Civ
il
Elec
tric
al, e
lect
roni
cs, a
nd c
omm
unic
atio
ns
Indu
stria
l and
man
ufac
turin
g
Mat
eria
ls s
cien
ce
Mec
hani
cal
Oth
er e
ngin
eerin
g
Tota
l
Agr
icul
tura
l sci
ence
s an
d na
tura
l res
ourc
es
Bio
logi
cal a
nd b
iom
edic
al s
cien
ces
Hea
lth s
cien
ces
Tota
l
Che
mis
try
Geo
scie
nces
, atm
osph
eric
, and
oce
an s
cien
ces
Phys
ics
and
astr
onom
y
Tota
l
Com
pute
r and
info
rmat
ion
scie
nces
Mat
hem
atic
s an
d st
atis
tics
Tota
l
Psyc
holo
gy
Ant
hrop
olog
y
Econ
omic
s
Polit
ical
sci
ence
and
gov
ernm
ent
Soci
olog
y
Oth
er s
ocia
l sci
ence
s

Table 7. Doctorate-granting institutions, by state or location and major science and engineering fields of study: 2016
State or location and institution
Science Engineering
Life sciencesPhysical sciences and earth sciences
Mathematics and computer
sciences Psychology and social sciences
Oregon 455 130 35 74 21 76 38 21 17 33 17 16 71 28 2 12 4 4 21 55 0 5 4 5 11 2 6 3 19
Oregon Health and Science U. 44 33 1 24 8 2 2 0 0 3 3 0 0 0 0 0 0 0 0 4 0 4 0 0 0 0 0 0 0
Oregon State U., Corvallis 203 73 33 29 11 33 13 15 5 13 5 8 22 11 1 3 0 0 7 36 0 1 4 5 6 2 5 2 11
Portland State U. 66 6 1 5 0 12 8 2 2 10 7 3 13 6 0 0 1 1 5 14 0 0 0 0 5 0 0 1 8
U. Oregon 142 18 0 16 2 29 15 4 10 7 2 5 36 11 1 9 3 3 9 1 0 0 0 0 0 0 1 0 0
Pennsylvania 2,721 587 20 451 116 260 124 28 108 245 146 99 375 156 14 56 30 30 89 581 10 77 64 20 83 15 83 86 143
Bryn Mawr C. 14 0 0 0 0 1 1 0 0 1 0 1 4 3 0 0 0 0 1 0 0 0 0 0 0 0 0 0 0
Carnegie Mellon U. 317 16 1 14 1 23 9 0 14 81 62 19 18 6 0 5 0 0 7 142 0 8 15 5 25 1 20 21 47
Drexel U. 172 42 3 33 6 16 5 1 10 16 12 4 14 12 0 1 0 0 1 69 0 17 5 7 10 0 13 9 8
Duquesne U. 71 20 0 8 12 4 4 0 0 0 0 0 7 7 0 0 0 0 0 0 0 0 0 0 0 0 0 0 0
Gannon U. 2 0 0 0 0 0 0 0 0 0 0 0 0 0 0 0 0 0 0 0 0 0 0 0 0 0 0 0 0
All
field
s
Tota
l
Aer
ospa
ce, a
eron
autic
al, a
nd a
stro
naut
ical
Bio
engi
neer
ing
and
biom
edic
al
Che
mic
al
Civ
il
Elec
tric
al, e
lect
roni
cs, a
nd c
omm
unic
atio
ns
Indu
stria
l and
man
ufac
turin
g
Mat
eria
ls s
cien
ce
Mec
hani
cal
Oth
er e
ngin
eerin
g
Tota
l
Agr
icul
tura
l sci
ence
s an
d na
tura
l res
ourc
es
Bio
logi
cal a
nd b
iom
edic
al s
cien
ces
Hea
lth s
cien
ces
Tota
l
Che
mis
try
Geo
scie
nces
, atm
osph
eric
, and
oce
an s
cien
ces
Phys
ics
and
astr
onom
y
Tota
l
Com
pute
r and
info
rmat
ion
scie
nces
Mat
hem
atic
s an
d st
atis
tics
Tota
l
Psyc
holo
gy
Ant
hrop
olog
y
Econ
omic
s
Polit
ical
sci
ence
and
gov
ernm
ent
Soci
olog
y
Oth
er s
ocia
l sci
ence
s

Table 7. Doctorate-granting institutions, by state or location and major science and engineering fields of study: 2016
State or location and institution
Science Engineering
Life sciencesPhysical sciences and earth sciences
Mathematics and computer
sciences Psychology and social sciences
Indiana U. Pennsylvania 66 0 0 0 0 0 0 0 0 0 0 0 15 2 0 0 0 4 9 0 0 0 0 0 0 0 0 0 0
Lehigh U. 121 9 1 7 1 10 0 3 7 13 3 10 20 16 0 4 0 0 0 55 0 5 6 1 7 2 9 11 14
Lutheran Theological Seminary, Philadelphia 1 0 0 0 0 0 0 0 0 0 0 0 0 0 0 0 0 0 0 0 0 0 0 0 0 0 0 0 0
Marywood U. 13 1 0 0 1 0 0 0 0 0 0 0 7 7 0 0 0 0 0 0 0 0 0 0 0 0 0 0 0
Pennsylvania State U., University Park and Hershey Medical Center 680 128 13 97 18 92 38 18 36 53 26 27 95 43 0 13 6 12 21 166 10 7 17 3 23 9 21 27 49
Temple U. 273 46 1 36 9 26 17 0 9 20 7 13 55 24 1 1 9 4 16 13 0 4 0 0 1 0 1 1 6
Thomas Jefferson U. 21 21 0 19 2 0 0 0 0 0 0 0 0 0 0 0 0 0 0 0 0 0 0 0 0 0 0 0 0
All
field
s
Tota
l
Aer
ospa
ce, a
eron
autic
al, a
nd a
stro
naut
ical
Bio
engi
neer
ing
and
biom
edic
al
Che
mic
al
Civ
il
Elec
tric
al, e
lect
roni
cs, a
nd c
omm
unic
atio
ns
Indu
stria
l and
man
ufac
turin
g
Mat
eria
ls s
cien
ce
Mec
hani
cal
Oth
er e
ngin
eerin
g
Tota
l
Agr
icul
tura
l sci
ence
s an
d na
tura
l res
ourc
es
Bio
logi
cal a
nd b
iom
edic
al s
cien
ces
Hea
lth s
cien
ces
Tota
l
Che
mis
try
Geo
scie
nces
, atm
osph
eric
, and
oce
an s
cien
ces
Phys
ics
and
astr
onom
y
Tota
l
Com
pute
r and
info
rmat
ion
scie
nces
Mat
hem
atic
s an
d st
atis
tics
Tota
l
Psyc
holo
gy
Ant
hrop
olog
y
Econ
omic
s
Polit
ical
sci
ence
and
gov
ernm
ent
Soci
olog
y
Oth
er s
ocia
l sci
ence
s

Table 7. Doctorate-granting institutions, by state or location and major science and engineering fields of study: 2016
State or location and institution
Science Engineering
Life sciencesPhysical sciences and earth sciences
Mathematics and computer
sciences Psychology and social sciences
U. of the Sciences Philadelphia 9 7 0 3 4 2 2 0 0 0 0 0 0 0 0 0 0 0 0 0 0 0 0 0 0 0 0 0 0
U. Pennsylvania 464 141 0 132 9 49 27 1 21 28 13 15 74 9 10 25 5 4 21 56 0 13 10 0 5 0 14 5 9
U. Pittsburgh, Pittsburgh 447 143 1 101 41 36 21 4 11 33 23 10 55 20 3 7 10 6 9 76 0 23 10 4 10 3 5 11 10
Villanova U. 22 5 0 0 5 1 0 1 0 0 0 0 0 0 0 0 0 0 0 4 0 0 1 0 2 0 0 1 0
Westminster Theological Seminary 2 0 0 0 0 0 0 0 0 0 0 0 0 0 0 0 0 0 0 0 0 0 0 0 0 0 0 0 0
Widener U., Chester 26 8 0 1 7 0 0 0 0 0 0 0 11 7 0 0 0 0 4 0 0 0 0 0 0 0 0 0 0
Puerto Rico 216 49 3 45 1 22 12 3 7 5 0 5 99 94 0 1 0 0 4 11 0 1 5 1 0 0 3 0 1
Carlos Albizu U., San Juan 38 0 0 0 0 0 0 0 0 0 0 0 38 38 0 0 0 0 0 0 0 0 0 0 0 0 0 0 0
All
field
s
Tota
l
Aer
ospa
ce, a
eron
autic
al, a
nd a
stro
naut
ical
Bio
engi
neer
ing
and
biom
edic
al
Che
mic
al
Civ
il
Elec
tric
al, e
lect
roni
cs, a
nd c
omm
unic
atio
ns
Indu
stria
l and
man
ufac
turin
g
Mat
eria
ls s
cien
ce
Mec
hani
cal
Oth
er e
ngin
eerin
g
Tota
l
Agr
icul
tura
l sci
ence
s an
d na
tura
l res
ourc
es
Bio
logi
cal a
nd b
iom
edic
al s
cien
ces
Hea
lth s
cien
ces
Tota
l
Che
mis
try
Geo
scie
nces
, atm
osph
eric
, and
oce
an s
cien
ces
Phys
ics
and
astr
onom
y
Tota
l
Com
pute
r and
info
rmat
ion
scie
nces
Mat
hem
atic
s an
d st
atis
tics
Tota
l
Psyc
holo
gy
Ant
hrop
olog
y
Econ
omic
s
Polit
ical
sci
ence
and
gov
ernm
ent
Soci
olog
y
Oth
er s
ocia
l sci
ence
s

Table 7. Doctorate-granting institutions, by state or location and major science and engineering fields of study: 2016
State or location and institution
Science Engineering
Life sciencesPhysical sciences and earth sciences
Mathematics and computer
sciences Psychology and social sciences
Inter American U. Puerto Rico, San Juan 28 1 0 0 1 0 0 0 0 0 0 0 13 13 0 0 0 0 0 0 0 0 0 0 0 0 0 0 0
Ponce School of Medicine and Health Sciences 6 5 0 5 0 0 0 0 0 0 0 0 1 0 0 0 0 0 1 0 0 0 0 0 0 0 0 0 0
Pontifical Catholic U. Puerto Rico, Ponce 24 0 0 0 0 0 0 0 0 0 0 0 24 24 0 0 0 0 0 0 0 0 0 0 0 0 0 0 0
U. Central del Caribe 8 8 0 8 0 0 0 0 0 0 0 0 0 0 0 0 0 0 0 0 0 0 0 0 0 0 0 0 0
U. Puerto Rico, Mayaguez 22 3 1 2 0 9 6 3 0 0 0 0 0 0 0 0 0 0 0 10 0 1 5 1 0 0 2 0 1
U. Puerto Rico, Medical Sciences Campus 20 20 0 20 0 0 0 0 0 0 0 0 0 0 0 0 0 0 0 0 0 0 0 0 0 0 0 0 0
All
field
s
Tota
l
Aer
ospa
ce, a
eron
autic
al, a
nd a
stro
naut
ical
Bio
engi
neer
ing
and
biom
edic
al
Che
mic
al
Civ
il
Elec
tric
al, e
lect
roni
cs, a
nd c
omm
unic
atio
ns
Indu
stria
l and
man
ufac
turin
g
Mat
eria
ls s
cien
ce
Mec
hani
cal
Oth
er e
ngin
eerin
g
Tota
l
Agr
icul
tura
l sci
ence
s an
d na
tura
l res
ourc
es
Bio
logi
cal a
nd b
iom
edic
al s
cien
ces
Hea
lth s
cien
ces
Tota
l
Che
mis
try
Geo
scie
nces
, atm
osph
eric
, and
oce
an s
cien
ces
Phys
ics
and
astr
onom
y
Tota
l
Com
pute
r and
info
rmat
ion
scie
nces
Mat
hem
atic
s an
d st
atis
tics
Tota
l
Psyc
holo
gy
Ant
hrop
olog
y
Econ
omic
s
Polit
ical
sci
ence
and
gov
ernm
ent
Soci
olog
y
Oth
er s
ocia
l sci
ence
s

Table 7. Doctorate-granting institutions, by state or location and major science and engineering fields of study: 2016
State or location and institution
Science Engineering
Life sciencesPhysical sciences and earth sciences
Mathematics and computer
sciences Psychology and social sciences
U. Puerto Rico, Rio Piedras 70 12 2 10 0 13 6 0 7 5 0 5 23 19 0 1 0 0 3 1 0 0 0 0 0 0 1 0 0
Rhode Island 325 63 6 43 14 57 22 15 20 25 13 12 60 20 3 14 9 6 8 37 0 4 4 1 4 1 4 5 14
Brown U. 235 39 0 34 5 46 20 8 18 22 12 10 47 8 3 13 9 6 8 24 0 3 2 0 1 0 4 4 10
Salve Regina U. 6 0 0 0 0 0 0 0 0 0 0 0 0 0 0 0 0 0 0 0 0 0 0 0 0 0 0 0 0
U. Rhode Island 84 24 6 9 9 11 2 7 2 3 1 2 13 12 0 1 0 0 0 13 0 1 2 1 3 1 0 1 4
South Carolina 544 139 20 75 44 57 41 6 10 34 11 23 60 26 4 10 4 1 15 122 0 17 19 9 14 9 7 30 17
Clemson U. 235 43 20 21 2 24 18 1 5 19 8 11 22 10 0 9 0 0 3 83 0 14 4 6 8 9 6 24 12
Medical U. South Carolina 40 39 0 24 15 0 0 0 0 0 0 0 0 0 0 0 0 0 0 0 0 0 0 0 0 0 0 0 0
U. South Carolina, Columbia 269 57 0 30 27 33 23 5 5 15 3 12 38 16 4 1 4 1 12 39 0 3 15 3 6 0 1 6 5
South Dakota 113 46 13 21 12 20 14 4 2 5 5 0 14 5 0 0 2 4 3 18 0 5 2 0 4 0 2 0 5
All
field
s
Tota
l
Aer
ospa
ce, a
eron
autic
al, a
nd a
stro
naut
ical
Bio
engi
neer
ing
and
biom
edic
al
Che
mic
al
Civ
il
Elec
tric
al, e
lect
roni
cs, a
nd c
omm
unic
atio
ns
Indu
stria
l and
man
ufac
turin
g
Mat
eria
ls s
cien
ce
Mec
hani
cal
Oth
er e
ngin
eerin
g
Tota
l
Agr
icul
tura
l sci
ence
s an
d na
tura
l res
ourc
es
Bio
logi
cal a
nd b
iom
edic
al s
cien
ces
Hea
lth s
cien
ces
Tota
l
Che
mis
try
Geo
scie
nces
, atm
osph
eric
, and
oce
an s
cien
ces
Phys
ics
and
astr
onom
y
Tota
l
Com
pute
r and
info
rmat
ion
scie
nces
Mat
hem
atic
s an
d st
atis
tics
Tota
l
Psyc
holo
gy
Ant
hrop
olog
y
Econ
omic
s
Polit
ical
sci
ence
and
gov
ernm
ent
Soci
olog
y
Oth
er s
ocia
l sci
ence
s

Table 7. Doctorate-granting institutions, by state or location and major science and engineering fields of study: 2016
State or location and institution
Science Engineering
Life sciencesPhysical sciences and earth sciences
Mathematics and computer
sciences Psychology and social sciences
Dakota State U. 6 0 0 0 0 0 0 0 0 5 5 0 0 0 0 0 0 0 0 0 0 0 0 0 0 0 0 0 0
South Dakota School of Mines and Technology 11 1 1 0 0 5 0 3 2 0 0 0 0 0 0 0 0 0 0 5 0 1 2 0 0 0 2 0 0
South Dakota State U. 56 32 12 11 9 9 8 1 0 0 0 0 7 0 0 0 0 4 3 8 0 0 0 0 4 0 0 0 4
U. South Dakota 40 13 0 10 3 6 6 0 0 0 0 0 7 5 0 0 2 0 0 5 0 4 0 0 0 0 0 0 1
Tennessee 924 232 15 174 43 90 43 14 33 44 18 26 127 65 12 16 11 7 16 150 1 20 15 7 30 6 13 13 45
East Tennessee State U. 24 14 0 5 9 0 0 0 0 0 0 0 5 5 0 0 0 0 0 0 0 0 0 0 0 0 0 0 0
Meharry Medical C. 4 4 0 4 0 0 0 0 0 0 0 0 0 0 0 0 0 0 0 0 0 0 0 0 0 0 0 0 0
Mid-America Baptist 3 0 0 0 0 0 0 0 0 0 0 0 0 0 0 0 0 0 0 0 0 0 0 0 0 0 0 0 0
All
field
s
Tota
l
Aer
ospa
ce, a
eron
autic
al, a
nd a
stro
naut
ical
Bio
engi
neer
ing
and
biom
edic
al
Che
mic
al
Civ
il
Elec
tric
al, e
lect
roni
cs, a
nd c
omm
unic
atio
ns
Indu
stria
l and
man
ufac
turin
g
Mat
eria
ls s
cien
ce
Mec
hani
cal
Oth
er e
ngin
eerin
g
Tota
l
Agr
icul
tura
l sci
ence
s an
d na
tura
l res
ourc
es
Bio
logi
cal a
nd b
iom
edic
al s
cien
ces
Hea
lth s
cien
ces
Tota
l
Che
mis
try
Geo
scie
nces
, atm
osph
eric
, and
oce
an s
cien
ces
Phys
ics
and
astr
onom
y
Tota
l
Com
pute
r and
info
rmat
ion
scie
nces
Mat
hem
atic
s an
d st
atis
tics
Tota
l
Psyc
holo
gy
Ant
hrop
olog
y
Econ
omic
s
Polit
ical
sci
ence
and
gov
ernm
ent
Soci
olog
y
Oth
er s
ocia
l sci
ence
s

Table 7. Doctorate-granting institutions, by state or location and major science and engineering fields of study: 2016
State or location and institution
Science Engineering
Life sciencesPhysical sciences and earth sciences
Mathematics and computer
sciences Psychology and social sciences
Theological Seminary
Middle Tennessee State U. 37 4 0 1 3 1 1 0 0 1 0 1 3 0 0 2 0 0 1 0 0 0 0 0 0 0 0 0 0
Tennessee State U. 20 6 3 3 0 0 0 0 0 0 0 0 9 9 0 0 0 0 0 2 0 0 0 0 1 0 0 0 1
Tennessee Technological U. 12 0 0 0 0 0 0 0 0 0 0 0 0 0 0 0 0 0 0 7 0 0 3 1 2 0 0 0 1
U. Memphis 154 5 0 3 2 9 4 5 0 9 4 5 30 24 0 0 0 0 6 14 0 2 0 3 3 0 0 1 5
U. Tennessee, Chattanooga 5 0 0 0 0 0 0 0 0 1 1 0 0 0 0 0 0 0 0 4 0 0 0 0 0 0 0 1 3
U. Tennessee, Health Science Center 30 28 0 15 13 0 0 0 0 0 0 0 2 1 0 0 0 0 1 0 0 0 0 0 0 0 0 0 0
U. Tennessee, Knoxville 335 59 12 42 5 38 17 7 14 20 7 13 46 18 10 6 4 1 7 78 1 7 5 0 17 6 10 5 27
All
field
s
Tota
l
Aer
ospa
ce, a
eron
autic
al, a
nd a
stro
naut
ical
Bio
engi
neer
ing
and
biom
edic
al
Che
mic
al
Civ
il
Elec
tric
al, e
lect
roni
cs, a
nd c
omm
unic
atio
ns
Indu
stria
l and
man
ufac
turin
g
Mat
eria
ls s
cien
ce
Mec
hani
cal
Oth
er e
ngin
eerin
g
Tota
l
Agr
icul
tura
l sci
ence
s an
d na
tura
l res
ourc
es
Bio
logi
cal a
nd b
iom
edic
al s
cien
ces
Hea
lth s
cien
ces
Tota
l
Che
mis
try
Geo
scie
nces
, atm
osph
eric
, and
oce
an s
cien
ces
Phys
ics
and
astr
onom
y
Tota
l
Com
pute
r and
info
rmat
ion
scie
nces
Mat
hem
atic
s an
d st
atis
tics
Tota
l
Psyc
holo
gy
Ant
hrop
olog
y
Econ
omic
s
Polit
ical
sci
ence
and
gov
ernm
ent
Soci
olog
y
Oth
er s
ocia
l sci
ence
s

Table 7. Doctorate-granting institutions, by state or location and major science and engineering fields of study: 2016
State or location and institution
Science Engineering
Life sciencesPhysical sciences and earth sciences
Mathematics and computer
sciences Psychology and social sciences
Vanderbilt U. 300 112 0 101 11 42 21 2 19 13 6 7 32 8 2 8 7 6 1 45 0 11 7 3 7 0 3 6 8
Texas 3,976 827 71 607 149 459 181 123 155 289 154 135 529 244 21 56 41 31 136 819 33 70 79 70 196 17 72 98 184
Baylor C. of Medicine 77 77 0 76 1 0 0 0 0 0 0 0 0 0 0 0 0 0 0 0 0 0 0 0 0 0 0 0 0
Baylor U. 79 11 0 9 2 17 8 5 4 12 0 12 12 6 0 0 2 4 0 2 0 0 0 0 2 0 0 0 0
Brite Divinity S. 1 0 0 0 0 0 0 0 0 0 0 0 0 0 0 0 0 0 0 0 0 0 0 0 0 0 0 0 0
Dallas Theological Seminary 8 0 0 0 0 0 0 0 0 0 0 0 0 0 0 0 0 0 0 0 0 0 0 0 0 0 0 0 0
Lamar U. 11 0 0 0 0 0 0 0 0 0 0 0 0 0 0 0 0 0 0 11 0 0 4 1 1 3 0 1 1
Prairie View A&M U. 4 0 0 0 0 0 0 0 0 0 0 0 3 0 0 0 0 0 3 0 0 0 0 0 0 0 0 0 0
Rice U. 208 25 1 23 1 49 26 8 15 27 11 16 23 6 4 8 3 0 2 59 0 23 5 0 8 0 9 7 7
Sam Houston State U. 20 0 0 0 0 0 0 0 0 0 0 0 11 6 0 0 0 0 5 0 0 0 0 0 0 0 0 0 0
Southern Methodist U. 68 2 0 2 0 9 4 3 2 18 9 9 8 2 1 3 0 0 2 13 0 0 0 0 6 0 0 2 5
All
field
s
Tota
l
Aer
ospa
ce, a
eron
autic
al, a
nd a
stro
naut
ical
Bio
engi
neer
ing
and
biom
edic
al
Che
mic
al
Civ
il
Elec
tric
al, e
lect
roni
cs, a
nd c
omm
unic
atio
ns
Indu
stria
l and
man
ufac
turin
g
Mat
eria
ls s
cien
ce
Mec
hani
cal
Oth
er e
ngin
eerin
g
Tota
l
Agr
icul
tura
l sci
ence
s an
d na
tura
l res
ourc
es
Bio
logi
cal a
nd b
iom
edic
al s
cien
ces
Hea
lth s
cien
ces
Tota
l
Che
mis
try
Geo
scie
nces
, atm
osph
eric
, and
oce
an s
cien
ces
Phys
ics
and
astr
onom
y
Tota
l
Com
pute
r and
info
rmat
ion
scie
nces
Mat
hem
atic
s an
d st
atis
tics
Tota
l
Psyc
holo
gy
Ant
hrop
olog
y
Econ
omic
s
Polit
ical
sci
ence
and
gov
ernm
ent
Soci
olog
y
Oth
er s
ocia
l sci
ence
s

Table 7. Doctorate-granting institutions, by state or location and major science and engineering fields of study: 2016
State or location and institution
Science Engineering
Life sciencesPhysical sciences and earth sciences
Mathematics and computer
sciences Psychology and social sciences
Southwestern Baptist Theological Seminary 17 0 0 0 0 0 0 0 0 0 0 0 1 0 0 0 0 0 1 0 0 0 0 0 0 0 0 0 0
St. Mary's U., San Antonio 5 0 0 0 0 0 0 0 0 0 0 0 2 2 0 0 0 0 0 0 0 0 0 0 0 0 0 0 0
Stephen F. Austin State U. 2 2 2 0 0 0 0 0 0 0 0 0 0 0 0 0 0 0 0 0 0 0 0 0 0 0 0 0 0
Texas A&M U., College Station and Health Science Center 684 136 38 71 27 89 33 25 31 42 16 26 74 24 5 20 6 2 17 203 11 12 19 21 41 6 9 24 60
Texas A&M U.-Commerce 19 0 0 0 0 0 0 0 0 0 0 0 6 5 0 0 0 0 1 0 0 0 0 0 0 0 0 0 0
Texas A&M U.-Corpus Christi 20 1 0 1 0 3 0 3 0 0 0 0 2 2 0 0 0 0 0 0 0 0 0 0 0 0 0 0 0
Texas A&M U.-Kingsville 5 2 2 0 0 0 0 0 0 0 0 0 0 0 0 0 0 0 0 3 0 0 0 0 0 0 0 0 3
All
field
s
Tota
l
Aer
ospa
ce, a
eron
autic
al, a
nd a
stro
naut
ical
Bio
engi
neer
ing
and
biom
edic
al
Che
mic
al
Civ
il
Elec
tric
al, e
lect
roni
cs, a
nd c
omm
unic
atio
ns
Indu
stria
l and
man
ufac
turin
g
Mat
eria
ls s
cien
ce
Mec
hani
cal
Oth
er e
ngin
eerin
g
Tota
l
Agr
icul
tura
l sci
ence
s an
d na
tura
l res
ourc
es
Bio
logi
cal a
nd b
iom
edic
al s
cien
ces
Hea
lth s
cien
ces
Tota
l
Che
mis
try
Geo
scie
nces
, atm
osph
eric
, and
oce
an s
cien
ces
Phys
ics
and
astr
onom
y
Tota
l
Com
pute
r and
info
rmat
ion
scie
nces
Mat
hem
atic
s an
d st
atis
tics
Tota
l
Psyc
holo
gy
Ant
hrop
olog
y
Econ
omic
s
Polit
ical
sci
ence
and
gov
ernm
ent
Soci
olog
y
Oth
er s
ocia
l sci
ence
s

Table 7. Doctorate-granting institutions, by state or location and major science and engineering fields of study: 2016
State or location and institution
Science Engineering
Life sciencesPhysical sciences and earth sciences
Mathematics and computer
sciences Psychology and social sciences
Texas Christian U. 23 0 0 0 0 6 3 0 3 1 0 1 4 3 0 0 1 0 0 0 0 0 0 0 0 0 0 0 0
Texas Southern U. 27 5 0 3 2 0 0 0 0 0 0 0 7 0 0 0 0 0 7 0 0 0 0 0 0 0 0 0 0
Texas State U. 53 3 0 3 0 1 1 0 0 0 0 0 13 1 0 0 0 0 12 7 0 1 0 0 0 0 5 1 0
Texas Tech U. 300 43 18 25 0 17 7 4 6 14 6 8 33 25 0 4 2 0 2 48 1 1 5 2 9 4 1 13 12
Texas Tech U., Health Sciences Center 10 10 0 7 3 0 0 0 0 0 0 0 0 0 0 0 0 0 0 0 0 0 0 0 0 0 0 0 0
Texas Woman's U. 98 29 0 9 20 0 0 0 0 0 0 0 33 27 0 0 0 4 2 0 0 0 0 0 0 0 0 0 0
U. Dallas 8 0 0 0 0 0 0 0 0 0 0 0 2 0 0 0 2 0 0 0 0 0 0 0 0 0 0 0 0
U. Houston 276 33 1 23 9 55 17 23 15 26 14 12 41 24 0 8 4 0 5 68 0 1 15 10 13 1 5 12 11
U. North Texas, Denton 237 18 2 12 4 28 20 0 8 25 18 7 45 38 0 0 3 4 0 13 0 0 0 0 0 0 10 2 1
All
field
s
Tota
l
Aer
ospa
ce, a
eron
autic
al, a
nd a
stro
naut
ical
Bio
engi
neer
ing
and
biom
edic
al
Che
mic
al
Civ
il
Elec
tric
al, e
lect
roni
cs, a
nd c
omm
unic
atio
ns
Indu
stria
l and
man
ufac
turin
g
Mat
eria
ls s
cien
ce
Mec
hani
cal
Oth
er e
ngin
eerin
g
Tota
l
Agr
icul
tura
l sci
ence
s an
d na
tura
l res
ourc
es
Bio
logi
cal a
nd b
iom
edic
al s
cien
ces
Hea
lth s
cien
ces
Tota
l
Che
mis
try
Geo
scie
nces
, atm
osph
eric
, and
oce
an s
cien
ces
Phys
ics
and
astr
onom
y
Tota
l
Com
pute
r and
info
rmat
ion
scie
nces
Mat
hem
atic
s an
d st
atis
tics
Tota
l
Psyc
holo
gy
Ant
hrop
olog
y
Econ
omic
s
Polit
ical
sci
ence
and
gov
ernm
ent
Soci
olog
y
Oth
er s
ocia
l sci
ence
s

Table 7. Doctorate-granting institutions, by state or location and major science and engineering fields of study: 2016
State or location and institution
Science Engineering
Life sciencesPhysical sciences and earth sciences
Mathematics and computer
sciences Psychology and social sciences
U. North Texas, Health Science Center 17 17 0 17 0 0 0 0 0 0 0 0 0 0 0 0 0 0 0 0 0 0 0 0 0 0 0 0 0
U. of St. Thomas, Houston 2 0 0 0 0 0 0 0 0 0 0 0 0 0 0 0 0 0 0 0 0 0 0 0 0 0 0 0 0
U. of the Incarnate Word 11 0 0 0 0 0 0 0 0 0 0 0 1 0 0 0 0 0 1 0 0 0 0 0 0 0 0 0 0
U. Texas Health Science Center, Houstona 114 108 0 81 27 0 0 0 0 3 3 0 2 2 0 0 0 0 0 1 0 1 0 0 0 0 0 0 0
U. Texas Health Science Center, San Antonio 47 40 0 31 9 1 0 0 1 1 1 0 1 1 0 0 0 0 0 3 0 3 0 0 0 0 0 0 0
U. Texas Medical Branch 49 42 0 31 11 0 0 0 0 0 0 0 1 1 0 0 0 0 0 1 0 1 0 0 0 0 0 0 0
All
field
s
Tota
l
Aer
ospa
ce, a
eron
autic
al, a
nd a
stro
naut
ical
Bio
engi
neer
ing
and
biom
edic
al
Che
mic
al
Civ
il
Elec
tric
al, e
lect
roni
cs, a
nd c
omm
unic
atio
ns
Indu
stria
l and
man
ufac
turin
g
Mat
eria
ls s
cien
ce
Mec
hani
cal
Oth
er e
ngin
eerin
g
Tota
l
Agr
icul
tura
l sci
ence
s an
d na
tura
l res
ourc
es
Bio
logi
cal a
nd b
iom
edic
al s
cien
ces
Hea
lth s
cien
ces
Tota
l
Che
mis
try
Geo
scie
nces
, atm
osph
eric
, and
oce
an s
cien
ces
Phys
ics
and
astr
onom
y
Tota
l
Com
pute
r and
info
rmat
ion
scie
nces
Mat
hem
atic
s an
d st
atis
tics
Tota
l
Psyc
holo
gy
Ant
hrop
olog
y
Econ
omic
s
Polit
ical
sci
ence
and
gov
ernm
ent
Soci
olog
y
Oth
er s
ocia
l sci
ence
s

Table 7. Doctorate-granting institutions, by state or location and major science and engineering fields of study: 2016
State or location and institution
Science Engineering
Life sciencesPhysical sciences and earth sciences
Mathematics and computer
sciences Psychology and social sciences
U. Texas Pan American 9 0 0 0 0 0 0 0 0 0 0 0 0 0 0 0 0 0 0 0 0 0 0 0 0 0 0 0 0
U. Texas Southwestern Medical Center 86 74 0 74 0 1 1 0 0 0 0 0 10 10 0 0 0 0 0 1 0 1 0 0 0 0 0 0 0
U. Texas, Arlington 187 15 1 9 5 23 10 4 9 25 15 10 17 8 0 0 0 0 9 66 7 5 0 6 19 3 7 6 13
U. Texas, Austin 849 95 1 70 24 114 34 39 41 61 34 27 131 39 11 9 14 17 41 227 13 11 31 25 56 0 13 26 52
U. Texas, Dallas 174 13 0 12 1 22 7 5 10 20 14 6 26 4 0 4 4 0 14 54 0 8 0 0 31 0 7 1 7
U. Texas, El Paso 65 10 1 8 1 9 5 3 1 3 2 1 4 3 0 0 0 0 1 20 1 0 0 3 3 0 6 1 6
U. Texas, San Antonio 102 12 0 10 2 15 5 1 9 11 11 0 16 5 0 0 0 0 11 19 0 2 0 2 7 0 0 2 6
West Texas A&M U. 4 4 4 0 0 0 0 0 0 0 0 0 0 0 0 0 0 0 0 0 0 0 0 0 0 0 0 0 0
Utah 537 127 8 91 28 59 33 16 10 32 18 14 92 59 5 9 4 5 10 119 0 30 18 10 14 0 4 18 25
All
field
s
Tota
l
Aer
ospa
ce, a
eron
autic
al, a
nd a
stro
naut
ical
Bio
engi
neer
ing
and
biom
edic
al
Che
mic
al
Civ
il
Elec
tric
al, e
lect
roni
cs, a
nd c
omm
unic
atio
ns
Indu
stria
l and
man
ufac
turin
g
Mat
eria
ls s
cien
ce
Mec
hani
cal
Oth
er e
ngin
eerin
g
Tota
l
Agr
icul
tura
l sci
ence
s an
d na
tura
l res
ourc
es
Bio
logi
cal a
nd b
iom
edic
al s
cien
ces
Hea
lth s
cien
ces
Tota
l
Che
mis
try
Geo
scie
nces
, atm
osph
eric
, and
oce
an s
cien
ces
Phys
ics
and
astr
onom
y
Tota
l
Com
pute
r and
info
rmat
ion
scie
nces
Mat
hem
atic
s an
d st
atis
tics
Tota
l
Psyc
holo
gy
Ant
hrop
olog
y
Econ
omic
s
Polit
ical
sci
ence
and
gov
ernm
ent
Soci
olog
y
Oth
er s
ocia
l sci
ence
s

Table 7. Doctorate-granting institutions, by state or location and major science and engineering fields of study: 2016
State or location and institution
Science Engineering
Life sciencesPhysical sciences and earth sciences
Mathematics and computer
sciences Psychology and social sciences
Brigham Young U., Provo 109 16 1 14 1 15 10 4 1 5 3 2 34 33 0 0 0 0 1 20 0 2 3 1 5 0 0 8 1
U. Utah 317 87 0 61 26 34 20 6 8 18 10 8 39 11 5 7 4 4 8 72 0 22 15 4 5 0 4 6 16
Utah State U., Logan 111 24 7 16 1 10 3 6 1 9 5 4 19 15 0 2 0 1 1 27 0 6 0 5 4 0 0 4 8
Vermont 75 39 13 25 1 9 6 2 1 0 0 0 10 8 0 1 0 0 1 8 0 2 0 0 2 0 2 1 1
Middlebury C. 8 0 0 0 0 0 0 0 0 0 0 0 1 0 0 0 0 0 1 0 0 0 0 0 0 0 0 0 0
U. Vermont 67 39 13 25 1 9 6 2 1 0 0 0 9 8 0 1 0 0 0 8 0 2 0 0 2 0 2 1 1
Virginia 1,526 283 49 179 55 133 44 25 64 123 75 48 265 104 8 30 22 14 87 281 19 27 12 15 53 9 14 43 89
C. of William and Mary 54 2 1 1 0 14 0 4 10 12 12 0 4 0 1 0 0 0 3 1 0 0 0 0 0 0 1 0 0
George Mason U. 290 38 7 26 5 23 1 9 13 38 26 12 108 24 2 16 8 4 54 17 0 1 0 1 8 0 0 1 6
Hampton U. 16 0 0 0 0 3 0 1 2 0 0 0 0 0 0 0 0 0 0 0 0 0 0 0 0 0 0 0 0
James Madison U. 9 1 0 0 1 0 0 0 0 0 0 0 0 0 0 0 0 0 0 0 0 0 0 0 0 0 0 0 0
All
field
s
Tota
l
Aer
ospa
ce, a
eron
autic
al, a
nd a
stro
naut
ical
Bio
engi
neer
ing
and
biom
edic
al
Che
mic
al
Civ
il
Elec
tric
al, e
lect
roni
cs, a
nd c
omm
unic
atio
ns
Indu
stria
l and
man
ufac
turin
g
Mat
eria
ls s
cien
ce
Mec
hani
cal
Oth
er e
ngin
eerin
g
Tota
l
Agr
icul
tura
l sci
ence
s an
d na
tura
l res
ourc
es
Bio
logi
cal a
nd b
iom
edic
al s
cien
ces
Hea
lth s
cien
ces
Tota
l
Che
mis
try
Geo
scie
nces
, atm
osph
eric
, and
oce
an s
cien
ces
Phys
ics
and
astr
onom
y
Tota
l
Com
pute
r and
info
rmat
ion
scie
nces
Mat
hem
atic
s an
d st
atis
tics
Tota
l
Psyc
holo
gy
Ant
hrop
olog
y
Econ
omic
s
Polit
ical
sci
ence
and
gov
ernm
ent
Soci
olog
y
Oth
er s
ocia
l sci
ence
s

Table 7. Doctorate-granting institutions, by state or location and major science and engineering fields of study: 2016
State or location and institution
Science Engineering
Life sciencesPhysical sciences and earth sciences
Mathematics and computer
sciences Psychology and social sciences
Norfolk State U. 2 0 0 0 0 0 0 0 0 0 0 0 0 0 0 0 0 0 0 0 0 0 0 0 0 0 0 0 0
Old Dominion U. 143 16 2 8 6 9 4 2 3 7 5 2 21 9 0 0 1 0 11 25 4 2 0 0 4 0 1 4 10
Regent U. 73 0 0 0 0 0 0 0 0 0 0 0 6 4 0 0 0 0 2 0 0 0 0 0 0 0 0 0 0
Union Presbyterian Seminary 1 0 0 0 0 0 0 0 0 0 0 0 0 0 0 0 0 0 0 0 0 0 0 0 0 0 0 0 0
U. Virginia, Charlottesville 292 62 2 45 15 27 5 2 20 16 4 12 49 23 3 7 8 5 3 49 3 8 4 0 9 0 5 7 13
Virginia Commonwealth U. 174 70 0 48 22 18 16 0 2 8 6 2 26 23 0 0 1 0 2 18 0 3 3 0 3 0 2 3 4
Virginia Polytechnic Institute and State U. 472 94 37 51 6 39 18 7 14 42 22 20 51 21 2 7 4 5 12 171 12 13 5 14 29 9 5 28 56
Washington 927 272 42 178 52 118 40 47 31 57 28 29 143 40 14 26 14 11 38 153 6 13 25 10 29 3 16 25 26
All
field
s
Tota
l
Aer
ospa
ce, a
eron
autic
al, a
nd a
stro
naut
ical
Bio
engi
neer
ing
and
biom
edic
al
Che
mic
al
Civ
il
Elec
tric
al, e
lect
roni
cs, a
nd c
omm
unic
atio
ns
Indu
stria
l and
man
ufac
turin
g
Mat
eria
ls s
cien
ce
Mec
hani
cal
Oth
er e
ngin
eerin
g
Tota
l
Agr
icul
tura
l sci
ence
s an
d na
tura
l res
ourc
es
Bio
logi
cal a
nd b
iom
edic
al s
cien
ces
Hea
lth s
cien
ces
Tota
l
Che
mis
try
Geo
scie
nces
, atm
osph
eric
, and
oce
an s
cien
ces
Phys
ics
and
astr
onom
y
Tota
l
Com
pute
r and
info
rmat
ion
scie
nces
Mat
hem
atic
s an
d st
atis
tics
Tota
l
Psyc
holo
gy
Ant
hrop
olog
y
Econ
omic
s
Polit
ical
sci
ence
and
gov
ernm
ent
Soci
olog
y
Oth
er s
ocia
l sci
ence
s

Table 7. Doctorate-granting institutions, by state or location and major science and engineering fields of study: 2016
State or location and institution
Science Engineering
Life sciencesPhysical sciences and earth sciences
Mathematics and computer
sciences Psychology and social sciences
Gonzaga U. 9 0 0 0 0 0 0 0 0 0 0 0 4 0 0 0 0 0 4 0 0 0 0 0 0 0 0 0 0
Seattle Pacific U. 24 0 0 0 0 0 0 0 0 0 0 0 8 8 0 0 0 0 0 0 0 0 0 0 0 0 0 0 0
U. Washington, Seattle 615 181 6 139 36 94 22 46 26 47 20 27 84 18 7 14 11 7 27 95 6 12 11 7 24 3 9 13 10
Washington State U. 279 91 36 39 16 24 18 1 5 10 8 2 47 14 7 12 3 4 7 58 0 1 14 3 5 0 7 12 16
West Virginia 243 59 13 31 15 28 10 8 10 7 1 6 43 22 0 10 2 0 9 40 2 2 3 4 5 4 1 10 9
Marshall U. 19 1 0 1 0 0 0 0 0 0 0 0 0 0 0 0 0 0 0 0 0 0 0 0 0 0 0 0 0
West Virginia U. 224 58 13 30 15 28 10 8 10 7 1 6 43 22 0 10 2 0 9 40 2 2 3 4 5 4 1 10 9
Wisconsin 1,106 299 47 199 53 123 66 22 35 86 40 46 157 54 7 32 19 21 24 149 0 29 15 6 30 10 19 17 23
Cardinal Stritch U. 36 0 0 0 0 0 0 0 0 0 0 0 1 0 0 0 0 0 1 0 0 0 0 0 0 0 0 0 0
Marquette U. 76 10 0 4 6 8 8 0 0 3 2 1 11 11 0 0 0 0 0 12 0 5 0 2 3 0 0 0 2
Medical C. Wisconsin 24 24 0 23 1 0 0 0 0 0 0 0 0 0 0 0 0 0 0 0 0 0 0 0 0 0 0 0 0
All
field
s
Tota
l
Aer
ospa
ce, a
eron
autic
al, a
nd a
stro
naut
ical
Bio
engi
neer
ing
and
biom
edic
al
Che
mic
al
Civ
il
Elec
tric
al, e
lect
roni
cs, a
nd c
omm
unic
atio
ns
Indu
stria
l and
man
ufac
turin
g
Mat
eria
ls s
cien
ce
Mec
hani
cal
Oth
er e
ngin
eerin
g
Tota
l
Agr
icul
tura
l sci
ence
s an
d na
tura
l res
ourc
es
Bio
logi
cal a
nd b
iom
edic
al s
cien
ces
Hea
lth s
cien
ces
Tota
l
Che
mis
try
Geo
scie
nces
, atm
osph
eric
, and
oce
an s
cien
ces
Phys
ics
and
astr
onom
y
Tota
l
Com
pute
r and
info
rmat
ion
scie
nces
Mat
hem
atic
s an
d st
atis
tics
Tota
l
Psyc
holo
gy
Ant
hrop
olog
y
Econ
omic
s
Polit
ical
sci
ence
and
gov
ernm
ent
Soci
olog
y
Oth
er s
ocia
l sci
ence
s

Table 7. Doctorate-granting institutions, by state or location and major science and engineering fields of study: 2016
State or location and institution
Science Engineering
Life sciencesPhysical sciences and earth sciences
Mathematics and computer
sciences Psychology and social sciences
U. Wisconsin-Madison 823 246 47 162 37 96 51 17 28 69 33 36 115 29 5 28 16 20 17 122 0 23 15 3 25 9 17 12 18
U. Wisconsin-Milwaukee 147 19 0 10 9 19 7 5 7 14 5 9 30 14 2 4 3 1 6 15 0 1 0 1 2 1 2 5 3
Wyoming 81 21 6 15 0 15 7 5 3 6 1 5 9 8 0 1 0 0 0 12 0 0 5 1 1 0 1 3 1
U. Wyoming 81 21 6 15 0 15 7 5 3 6 1 5 9 8 0 1 0 0 0 12 0 0 5 1 1 0 1 3 1
a Most degrees reported in "biological and biomedical sciences" fields of study for University of Texas, Health Science Center at Houston are awarded jointly with the M. D. Anderson Cancer Center through the University of Texas Graduate School of Biomedical Sciences at Houston.
NOTE: See table A-6 in the technical notes for a listing of major fields and their constituent subfields.
SOURCE: National Science Foundation, National Center for Science and Engineering Statistics, Survey of Earned Doctorates, 2016.
All
field
s
Tota
l
Aer
ospa
ce, a
eron
autic
al, a
nd a
stro
naut
ical
Bio
engi
neer
ing
and
biom
edic
al
Che
mic
al
Civ
il
Elec
tric
al, e
lect
roni
cs, a
nd c
omm
unic
atio
ns
Indu
stria
l and
man
ufac
turin
g
Mat
eria
ls s
cien
ce
Mec
hani
cal
Oth
er e
ngin
eerin
g
Tota
l
Agr
icul
tura
l sci
ence
s an
d na
tura
l res
ourc
es
Bio
logi
cal a
nd b
iom
edic
al s
cien
ces
Hea
lth s
cien
ces
Tota
l
Che
mis
try
Geo
scie
nces
, atm
osph
eric
, and
oce
an s
cien
ces
Phys
ics
and
astr
onom
y
Tota
l
Com
pute
r and
info
rmat
ion
scie
nces
Mat
hem
atic
s an
d st
atis
tics
Tota
l
Psyc
holo
gy
Ant
hrop
olog
y
Econ
omic
s
Polit
ical
sci
ence
and
gov
ernm
ent
Soci
olog
y
Oth
er s
ocia
l sci
ence
s