science 2008–2009 technical report
TRANSCRIPT

New England Common Assessment Program
Science 2008–2009
Technical Report
June 2010
100 Education Way, Dover, NH 03820 (800) 431-8901


Table of Contents i 2008–09 NECAP Science Technical Report
TABLE OF CONTENTS
CHAPTER 1. OVERVIEW................................................................................................................................................1 1.1 Purpose of the New England Common Assessment Program.......................................................................1 1.2 Purpose of This Report .................................................................................................................................1 1.3 Organization of This Report .........................................................................................................................2
CHAPTER 2. TEST DESIGN AND DEVELOPMENT............................................................................................................3 2.1 Test Design and Blueprints...........................................................................................................................3
2.1.1 Overview of Test Design........................................................................................................................................... 3 2.1.2 Item Types ................................................................................................................................................................ 3 2.1.3 Science Test Design .................................................................................................................................................. 4 2.1.4 Science Blueprint ...................................................................................................................................................... 4 2.1.5 Calculator Use........................................................................................................................................................... 5 2.1.6 Test Sessions ............................................................................................................................................................. 5
2.2 Operational Development Process ...............................................................................................................6 2.2.1 Assessment Targets................................................................................................................................................... 6 2.2.2 Inquiry Tasks............................................................................................................................................................. 6 2.2.3 Item Reviews by Measured Progress ........................................................................................................................ 7 2.2.4 Item Reviews by the States ....................................................................................................................................... 8 2.2.5 Bias and Sensitivity Review...................................................................................................................................... 8 2.2.6 Reviewing and Refining............................................................................................................................................ 9 2.2.7 Item Editing............................................................................................................................................................... 9 2.2.8 Item Selection and Test Assembly ............................................................................................................................ 9 2.2.9 Review of Operational Test Forms.......................................................................................................................... 10 2.2.10 Braille and Large-Print Translation......................................................................................................................... 10 2.2.11 Released Items ........................................................................................................................................................ 11
CHAPTER 3. TEST ADMINISTRATION ..........................................................................................................................13 3.1 Responsibility for Administration ...............................................................................................................13 3.2 Administration Procedures .........................................................................................................................13 3.3 Participation Requirements and Documentation........................................................................................13 3.4 Administrator Training ...............................................................................................................................15 3.5 Documentation of Accommodations ...........................................................................................................15 3.6 Test Security................................................................................................................................................16 3.7 Test and Administration Irregularities .......................................................................................................17 3.8 Test Administration Window.......................................................................................................................17 3.9 NECAP Service Center ...............................................................................................................................18
CHAPTER 4. SCORING .................................................................................................................................................19 4.1 Machine Scored Items.................................................................................................................................19 4.2 Hand Scored Items......................................................................................................................................19 4.3 Inquiry Task Scoring...................................................................................................................................20 4.4 Scoring Location and Staff .........................................................................................................................20
4.4.1 Reader Recruitment and Qualifications................................................................................................................... 21 4.4.2 Reader Training....................................................................................................................................................... 21 4.4.3 QAC and SR Training............................................................................................................................................. 23 4.4.4 Benchmarking Meetings ......................................................................................................................................... 23
4.5 Methodology for Scoring Constructed-Response Items..............................................................................24 4.5.1 Monitoring of Scoring Quality Control and Consistency ........................................................................................ 25 4.5.2 Scoring Reports....................................................................................................................................................... 27
CHAPTER 5. CLASSICAL ITEM ANALYSES...................................................................................................................31 5.1 Classical Statistics ......................................................................................................................................31 5.2 Differential Item Functioning .....................................................................................................................33 5.3 Dimensionality Analyses.............................................................................................................................36
CHAPTER 6. SCALING AND EQUATING........................................................................................................................39 6.1 Item Response Theory.................................................................................................................................39 6.2 IRT Results..................................................................................................................................................41 6.3 Equating......................................................................................................................................................42 6.4 Equating Results .........................................................................................................................................43 6.5 Standard Setting..........................................................................................................................................44 6.6 Reported Scaled Scores ..............................................................................................................................44
6.6.2 Calculations............................................................................................................................................................. 46 6.6.3 Distributions............................................................................................................................................................ 47

Table of Contents ii 2008–09 NECAP Science Technical Report
CHAPTER 7. RELIABILITY ...........................................................................................................................................49 7.1 Reliability and Standard Errors of Measurement.......................................................................................50 7.2 Subgroup Reliability ...................................................................................................................................50 7.3 Stratified Coefficient Alpha ........................................................................................................................52 7.4 Reporting Subcategories (Domains) Reliability .........................................................................................53 7.5 Reliability of Achievement Level Categorization........................................................................................54 7.6 Results of Accuracy, Consistency, and Kappa Analyses.............................................................................55
CHAPTER 8. SCORE REPORTING..................................................................................................................................57 8.1 Teaching Year Versus Testing Year Reporting ...........................................................................................57 8.2 Primary Reports..........................................................................................................................................57 8.3 Student Report ............................................................................................................................................57 8.4 Item Analysis Report...................................................................................................................................58 8.5 School and District Results Reports ...........................................................................................................59 8.6 District Summary Reports...........................................................................................................................61 8.7 Decision Rules ............................................................................................................................................61 8.8 Quality Assurance.......................................................................................................................................62
CHAPTER 9. VALIDITY................................................................................................................................................65 9.1 Questionnaire Data.....................................................................................................................................66 9.2 Validity Studies Agenda ..............................................................................................................................68
9.2.1 External Validity ..................................................................................................................................................... 68 9.2.2 Convergent and Discriminant Validity.................................................................................................................... 69 9.2.3 Structural Validity................................................................................................................................................... 70 9.2.4 Procedural Validity ................................................................................................................................................. 70
REFERENCES .................................................................................................................................................................71 APPENDICES...................................................................................................................................................................73 Appendix A Guidelines for the Development of Science Inquiry Tasks Appendix B NECAP Science Committee Members Appendix C Table of Standard Test Accommodations Appendix D Appropriateness of Accommodations Appendix E Double Blind Scoring Interrater Agreement Appendix F IRT Calibration Results Appendix G Delta and Rescore Analysis Results Appendix H Raw to Scaled Score Lookup Tables Appendix I Scaled Score Percentages and Cumulative Percentages Appendix J Decision Accuracy and Consistency Results Appendix K Sample Reports Appendix L Analysis and Reporting Decision Rules Appendix M Student Questionnaire Results

Chapter 1—Overview 1 2008–09 NECAP Science Technical Report
Chapter 1. OVERVIEW
1.1 Purpose of the New England Common Assessment Program
The New England Common Assessment Program (NECAP) is the result of collaboration among New
Hampshire, Rhode Island, and Vermont to build a set of tests for grades 3 through 8 and 11 to meet the
requirements of the No Child Left Behind Act (NCLB). The specific purposes of the NECAP Science tests
are (1) to provide data on student achievement in science at grades 4, 8, and 11 to meet NCLB requirements;
(2) to provide information to support program evaluation and improvement; and (3) to provide information to
parents and the public on the performance of students and schools. The tests are constructed to meet rigorous
technical criteria, to include universal design elements and accommodations so that students can access test
content, and to gather reliable student demographic information for accurate reporting. School improvement is
supported by
providing a transparent test design through the NECAP Science Assessment Targets, distributions
of emphasis, and practice tests;
reporting results by science domain, released items, and subgroups; and
hosting test interpretation workshops to foster understanding of results.
Student level results are provided to schools and families to be used as one piece among all collected
evidence about progress and learning that occurred on the assessment targets for the respective grade span
(K–4, 5–8, 9–11). The results are a status report of a student’s performance against the assessment targets, and
they should be used cautiously in concert with local data.
1.2 Purpose of This Report
The purpose of this report is to document the technical aspects of the 2008–09 NECAP Science tests.
Students in grades 4, 8, and 11 participated in the second operational administration of NECAP Science in
May 2009. This report provides evidence on the technical quality of those tests, including descriptions of the
processes used to develop, administer, and score the tests and of those used to analyze the results. This report
is intended to serve as a guide for replicating and/or improving the procedures in subsequent years.
Though some parts of this technical report may be used by educated laypeople, it is intended for
experts in psychometrics and educational research. The report assumes a working knowledge of measurement
concepts such as reliability and validity and statistical concepts such as correlation and central tendency. In
some chapters, the reader is presumed also to have basic familiarity with advanced topics in measurement and
statistics.

Chapter 1—Overview 2 2008–09 NECAP Science Technical Report
1.3 Organization of This Report
The organization of this report is based on the conceptual flow of a test’s life span. The report begins
with the initial test specifications and addresses all intermediate steps that lead to final score reporting.
Chapters 1 through 4 give a description of NECAP Science by covering the test design and development
process, the administration of the tests, and scoring. Chapters 5 through 7 provide statistical and psychometric
information, including chapters on scaling and equating, item analysis, and reliability. Chapter 8 is devoted to
NECAP Science score reporting and Chapter 9 is devoted to discussions on validity. Finally, the references
cited throughout the report are provided, followed by the report appendices.

Chapter 2—Test Design and Development 3 2008–09 NECAP Science Technical Report
Chapter 2. TEST DESIGN AND DEVELOPMENT
2.1 Test Design and Blueprints
2.1.1 Overview of Test Design
The 2008–09 NECAP Science test consisted of four forms per grade. Each form included common
items, equating items, and embedded field test items. Common items are items that appear on every form of
the test and are used to determine a student’s test score. Each equating item appears on one form only, and
because these items have been on previous tests, they are used by psychometricians to keep the test scores on
the same scale from year to year. This design provides reliable and valid results at the student level (the
common items) and breadth of science coverage for school results (the common plus equating items) while
minimizing testing time.
The NECAP Science test includes an embedded field test. Because the field test is taken by all
students, it provides the sample needed to produce reliable data with which to inform the process of selecting
items for future tests. Each embedded field test item appears on one form only. The field test items are
distributed equally among the forms. Embedding field test items into the operational test ensures that students
take the items seriously, since the students do not know which items count for their test score and which items
are being field tested. The embedded field test yields a pool of replacement items, which are needed due to the
release of approximately 25% of the common items every year.
Each form of the test has three sessions. Physical Science, Earth Space Science, and Life Science are
assessed in Sessions 1 and 2 of the test by standalone items. The equating and field test items are distributed
among the common items in a way that is not evident to test takers. Scientific Inquiry is assessed in Session 3
by an inquiry task. Session 3 contains only common items, as the inquiry task goes through a separate (not
embedded) field test.
2.1.2 Item Types
Since the beginning of the program, the goal of NECAP has been to measure what students know and
are able to do by using a variety of test item types. The item types used and the functions of each are
described below.
Multiple-choice items were administered to provide breadth of coverage of the assessment
targets. Because they require approximately one minute for most students to answer, these items
make efficient use of limited testing time and allow coverage of a wide range of knowledge and
skills. Multiple-choice items were administered in Sessions 1 and 2 of the test in the Physical
Science, Earth Space Science, and Life Science domains.
Short-answer items were administered in the inquiry task (Session 3) to assess students’ skills
and their abilities to work with brief, well structured problems that had one solution or a very

Chapter 2—Test Design and Development 4 2008–09 NECAP Science Technical Report
limited number of solutions. Short-answer items require approximately two to five minutes for
most students to answer. The advantage of this item type is that it requires students to
demonstrate knowledge and skills by generating, rather than merely selecting, an answer.
Constructed-response items typically require students to use higher order thinking skills—
evaluation, analysis, and summarization—in constructing a satisfactory response. Constructed-
response items should take most students approximately 5 to 10 minutes to complete. Four-point
constructed-response items were administered in Sessions 1 and 2 of the test in the Physical
Science, Earth Space Science, and Life Science domains. Three-point constructed-response items
were administered in the Session 3 inquiry task.
2.1.3 Science Test Design
Table 2-1 summarizes the numbers and types of items that were used in the NECAP Science
assessment for 2008–09. In Sessions 1 and 2, each multiple-choice item was worth 1 point, and each
constructed-response item was worth 4 points. In Session 3, each short-answer item was worth 2 points, and
each constructed-response item was worth 3 points.
Table 2-1. 2008–09 NECAP Science: Numbers of Items per Item Type
MC 1 pt
SA 2 pt
CR 3 pt
CR 4 pt
Common 33 6 2 3 Equating 36 6 Embedded field test 36 6 Total per form 51 6 2 6 MC = multiple-choice; SA = short-answer; CR = constructed-response
2.1.4 Science Blueprint
As indicated earlier, the assessment framework for science was based on the NECAP Science
Assessment Targets, and all items on the test were designed to measure a specific assessment target. NECAP
Science items can be broken down into the following science domains: Physical Science, Earth Space
Science, Life Science, and Scientific Inquiry.
The distribution of emphasis for science is shown in Table 2-2.
Table 2-2. 2008–09 NECAP Science: Distribution of Common Items Across Domains
Domain MC 1 pt
SA 2 pt
CR 3 pt
CR 4 pt
Physical Science 11 1 Earth Space Science 11 1
Life Science 11 1 Scientific Inquiry 6 2
Total 33 6 2 3 MC = multiple-choice; SA = short-answer; CR = constructed-response

Chapter 2—Test Design and Development 5 2008–09 NECAP Science Technical Report
Table 2-3 displays the total raw score points that students could earn.
Table 2-3. 2008–09 NECAP Science: Total Raw Score Points
Domain Points Emphasis Physical Science 15 24%
Earth Space Science 15 24% Life Science 15 24%
Scientific Inquiry 18 28% Total 63 100%
Table 2-4 lists the percentage of total score points assigned to each depth of knowledge (DOK) level.
Table 2-4. 2008–09 NECAP Science: DOK Percentages
Grade 4 Grade 8 Grade 11 DOK 1 19% 14% 22% DOK 2 70% 70% 68% DOK 3 11% 16% 10%
2.1.5 Calculator Use
Science specialists from the New Hampshire, Rhode Island, and Vermont Departments of Education
acknowledge that the use of calculators is a necessary and important skill. Calculators can save time and
allow students to solve more sophisticated and intricate problems by reducing errors in calculations. For these
reasons, it was decided that calculators should be permitted in all three sessions of the NECAP Science
assessment. The state science specialists chose to prohibit scientific and graphing calculators in Session 3
because the inquiry task includes a graphing item.
2.1.6 Test Sessions
The NECAP Science tests were administered to grades 4, 8, and 11 from May 11 to 28, 2009. Schools
were able to schedule testing sessions at any time during the three week period, provided they followed the
sequence in the scheduling guidelines detailed in test administration manuals and that all testing classes
within a school were on the same schedule. Schools were asked to provide makeup testing sessions for
students who were absent from initial testing sessions.
The timing and scheduling guidelines for the NECAP tests were based on estimates of the time it
would take an average student to respond to each type of item making up the test:
Multiple-choice—1 minute
Short-answer (2 point)—2 minutes
Constructed-response—10 minutes

Chapter 2—Test Design and Development 6 2008–09 NECAP Science Technical Report
Table 2-5 shows the distribution of items across the test sessions for all three grades.
Table 2-5. 2008–09 NECAP Science: Number of Items per Session
Item type Session 1 Session 2 Session 3 MC 25 26 0 SA2 0 0 6 CR3 0 0 2 CR4 3 3 0 MC = multiple-choice; SA = short-answer; CR = constructed-response; number beside item type indicates point value
Though the guidelines for scheduling are based on the assumption that most students will complete
the test within the time estimated, each test session was scheduled so that additional time was provided for
students who needed it. For Sessions 1 and 2, up to 100% additional time was allocated for each session (e.g.,
a 45 minute session could have up to an additional 45 minutes). For Session 3, additional time was allocated,
though times varied by grade. For grade 4, the test session was designed to be completed in 75 minutes, but
students were allowed extra time, if needed, in each part of the session; therefore, administrators were asked
to schedule 120 minutes for Session 3. This decision was made because Session 3 at grade 4 included a
hands-on experiment. For grades 8 and 11, Session 3 had a time limit of 60 minutes, which included
additional allocated time because, based on field test data, most students were expected to complete the
session in 45 to 50 minutes.
If classroom space was not available for students who required additional time to complete the tests,
schools were allowed to consider using another space for this purpose. Detailed instructions on test
administration and scheduling were provided in the NECAP Test Administrator and Principal/Test
Coordinator Manuals.
2.2 Operational Development Process
2.2.1 Assessment Targets
NECAP Science items are directly aligned to the assessment targets and statements of enduring
knowledge for each science domain, as described in the NECAP Science Assessment Targets. The assessment
targets and statements of enduring knowledge were used by content specialists to help guide the development
of test items. Each item addresses one assessment target. The NECAP Science Assessment Targets fall into
four domains: Physical Science, Earth Space Science, Life Science, and Scientific Inquiry.
2.2.2 Inquiry Tasks
The assessment targets for the Scientific Inquiry domain are known as inquiry constructs. The 13
inquiry constructs are spread across four broad areas of inquiry: formulating questions and hypothesizing;
planning and critiquing investigations; conducting investigations; and developing and evaluating

Chapter 2—Test Design and Development 7 2008–09 NECAP Science Technical Report
explanations. The state science specialists from the departments of education developed a document to aid
inquiry task development, Guidelines for the Development of Science Inquiry Tasks, which is Appendix A of
this report.
The state departments of education wanted Scientific Inquiry on the NECAP science test so that
students could conduct an experiment, analyze data, and draw conclusions based on that data, all of which
require scientific thinking skills. The Partnership for the Assessment of Standards-Based Science (PASS at
WestEd) was contracted to work with the state science specialists and Measured Progress to develop the
inquiry tasks.
For the 2008–09 operational tests, PASS at WestEd developed three inquiry tasks at grade 4, two
inquiry tasks at grade 8, and three inquiry tasks at grade 11. The original plan was to put two fully developed
tasks per grade through the external item review process by collecting feedback from the item review
committees and then field testing all the inquiry tasks in non-NECAP states. However, in 2007 PASS at
WestEd worked with the state science specialists to develop and field test one inquiry task at grade 4, two
inquiry tasks at grade 8, and one inquiry task at grade 11. Therefore, in 2008–09 PASS at WestEd developed
and field tested an additional inquiry task at grades 4 and 11 to fulfill contractual requirements. PASS at
WestEd conducted the field testing of the eight inquiry tasks in the fall of 2008 in classrooms throughout
northern California and a high school in Maine. The selected schools had varying demographics and
population sizes, and each of the eight inquiry tasks was administered to approximately 100 students. PASS at
WestEd submitted its Inquiry Task Field Test Report to the state science specialists and Measured Progress in
December 2008. Based on their review of the Inquiry Task Field Test Report, the state science specialists
selected one inquiry task at each grade for the May 2009 operational test, and the other inquiry tasks were
banked for use on future NECAP Science tests.
The Inquiry Task Field Test Report is not included as an appendix due to space limitations, but it can
be obtained from any of the three NECAP states as a standalone document.
2.2.3 Item Reviews by Measured Progress
Measured Progress conducted two reviews of the multiple-choice and constructed-response items as
well as a review of the inquiry tasks. These reviews, performed by science test developers, focused on three
major areas.
Item alignment to the assessment target: The reviewers considered whether the item measured the content as outlined in the assessment target and whether the content was grade appropriate. The reviewers also checked the DOK level of the item.
Correctness of science content: The reviewers considered whether the information in the item was scientifically correct. For multiple-choice items, the keyed answer had to be the only correct answer. For constructed-response items, the scoring guide had to reflect correct science content and grade level appropriate responses.
Universal design: The reviewers considered item structure, clarity, possible ambiguity, and the appropriateness and relevance of graphics. For constructed-response items, the reviewers

Chapter 2—Test Design and Development 8 2008–09 NECAP Science Technical Report
considered whether the item adequately prompted an examinee to give a response similar to the one in the scoring guide.
2.2.4 Item Reviews by the States
The state science specialists reviewed the items. Measured Progress revised the items based on edits
requested by the specialists.
Item review committees (IRCs), composed of state teachers and curriculum supervisors, were formed
in order to conduct another evaluation of the items. A list of the 2008–09 NECAP IRC participants for
science in grades 4, 8, and 11 and their affiliations is included as Appendix B. The IRCs met in Providence,
Rhode Island, in August 2008. Their primary role was to evaluate and provide feedback on potential field test
items. For each grade level, the committee members reviewed potential multiple-choice and constructed-
response field test items as well as potential inquiry tasks. During the meeting, committee members were
asked to evaluate the items for the following criteria:
Assessment target alignment - Is the test item aligned to the identified assessment target?
Depth of knowledge - Are the items coded to the appropriate DOK level?
Scientific correctness - Are the items and distracters correct with respect to content and grade level
appropriateness? - Are the scoring guides consistent with the item and do they provide grade level
appropriate responses?
Universal design - Is the item language clear and grade appropriate? - Is the item language accurate (syntax, grammar, conventions)? - Is there an appropriate use of simplified language (is language that interferes with the
assessment target avoided)? - Are charts, tables, and diagrams easy to read and understandable? - Are charts, tables, and diagrams necessary to the item? - Are instructions easy to follow? - Is the item amenable to accommodations—read aloud, signed, or Braille?
2.2.5 Bias and Sensitivity Review
Bias review is an essential component of the development process. During the bias review process,
NECAP Science items were reviewed by a committee of general education teachers, English language learner
(ELL) specialists, special education teachers, and other educators and members of major constituency groups
who represent the interests of legally protected and/or educationally disadvantaged groups. A list of bias and
sensitivity review committee participants and affiliations is included in Appendix B. Items were examined for
issues that might offend or dismay students, teachers, or parents. Including such groups in the development of

Chapter 2—Test Design and Development 9 2008–09 NECAP Science Technical Report
assessment items and materials can avoid many unduly controversial issues, and unfounded concerns can be
allayed before the test forms are produced.
2.2.6 Reviewing and Refining
After the IRC and bias and sensitivity review committee meetings, Measured Progress and the state
science specialists met to review the committees’ feedback. The specialists decided what edits should be
made to the items.
2.2.7 Item Editing
Measured Progress editors then reviewed and edited the items to ensure uniform style (based on The
Chicago Manual of Style, 15th edition) and adherence to sound testing principles. These principles included
the stipulation that items were
correct with regard to grammar, punctuation, usage, and spelling;
written in a clear, concise style;
written at a reading level that allows the student to demonstrate his or her knowledge of science,
regardless of reading ability;
written in a way that did not cue the correct answer (for multiple-choice options); and
free of potentially sensitive content.
2.2.8 Item Selection and Test Assembly
In preparation for the face to face meeting with the state science specialists for item selection, test
developers and psychometricians at Measured Progress considered the following when selecting sets of items
to propose for the common (including items for release) and the embedded field tests:
Content coverage/match to test design. The test design stipulates a specific number of multiple-
choice and constructed-response items from each content area. Item selection for the embedded
field test was based on the number of items in the existing pool of items eligible for the common.
Item difficulty and complexity. Item statistics drawn from the data analysis of previously tested
items were used to ensure similar levels of difficulty and complexity from year to year as well as
quality psychometric characteristics.
“Cueing” items. Items were reviewed for any information that might “cue,” or provide
information that would help to answer, another item.
At the face to face meeting, the state specialists reviewed the proposed sets of items and made the
final selection of items for the common, including which items would be released after the test was

Chapter 2—Test Design and Development 10 2008–09 NECAP Science Technical Report
administered. The state specialists also made the final selection of items for the embedded field test and
approved the final wording of these items.
During assembly of the test forms, the following criteria were considered:
Option balance. Items were balanced among the forms so that each form contained a fairly equal
distribution of keys (correct answers).
Key patterns. The sequence of keys was reviewed to ensure that their order appeared random.
Page fit. Item placement was modified to ensure the best fit and arrangement of items on any
given page.
Facing page issues. For multiple items associated with a single stimulus (inquiry task) and
multiple-choice items with large graphics, consideration was given to whether those items needed
to begin on a left or right hand page and to the nature and amount of material that needed to be
placed on facing pages. These considerations serve to minimize the amount of page flipping
required of students.
Relationship between forms. Although equating and field test items differ across forms, these
items must take up the same number of pages in each form so that sessions begin on the same
page in every form. Therefore, the number of pages needed for the longest form often determines
the layout of each form.
Visual appeal. The visual accessibility of each page of the form was always taken into
consideration, including such aspects as the amount of white space, the density of the text, and
the number of graphics.
2.2.9 Review of Operational Test Forms
After the forms were laid out as they would appear in the final test booklets, they were again
thoroughly reviewed by Measured Progress editors and test developers to ensure that the items appeared
exactly as the state science specialists had requested. Finally, all the forms were reviewed by the state science
specialists for their final approval.
2.2.10 Braille and Large-Print Translation
Common items for grades 4, 8, and 11 were translated into Braille by a subcontractor that specializes
in test materials for students who are blind or visually impaired. In addition, Form 1 for each grade was also
adapted into a large-print version.

Chapter 2—Test Design and Development 11 2008–09 NECAP Science Technical Report
2.2.11 Released Items
Approximately 25% of the common NECAP items in Sessions 1 and 2, as well as the entire inquiry
task at each grade, were released to the public in September, 2009. The released NECAP items are posted on
a Web site hosted by Measured Progress and on the state departments of education Web sites. Schools are
encouraged to incorporate the use of released items in their instructional activities so that students will be
familiar with them.

Chapter 3—Test Administration 13 2008–09 NECAP Science Technical Report
Chapter 3. TEST ADMINISTRATION
3.1 Responsibility for Administration
The 2008–09 NECAP Science Principal/Test Coordinator Manual indicated that principals and/or
their designated NECAP test coordinators were responsible for the proper administration of NECAP Science.
The Test Administrator Manual, which contained explicit directions and read-aloud scripts, was used in order
to ensure the uniformity of administration procedures from school to school.
3.2 Administration Procedures
Principals and/or their schools’ designated NECAP coordinators were instructed to read the
Principal/Test Coordinator Manual before testing and to be familiar with the instructions provided in the Test
Administrator Manual. The Principal/Test Coordinator Manual provided each school with checklists to help
them to prepare for testing. The checklists outlined tasks to be performed by school staff before, during, and
after test administration. Besides these checklists, the Principal/Test Coordinator Manual described the
testing material being sent to each school and how to inventory the material, track it during administration,
and return it after testing was complete. The Test Administrator Manual included checklists for the
administrators to ready themselves, their classrooms, and the students for the administration of the test. It also
contained sections detailing the procedures to be followed for each test session and instructions for preparing
the material before its return to Measured Progress.
3.3 Participation Requirements and Documentation
The intent of NCLB legislation is for all students in grades 4, 8, and 11 to participate in the NECAP
Science test through standard administration, administration with accommodations, or alternate assessment.
Furthermore, any student who is absent during any session of the NECAP Science test is expected to make up
the missed sessions within the three week testing window.
Schools were required to return a student answer booklet for every enrolled student in the grade level.
On those occasions when it was deemed impossible to test a particular student, school personnel were
required to inform their state department of education. The states included a grid on the student answer
booklets that listed the approved reasons why a student answer booklet could be returned blank for one or
more sessions of the science test.
Student withdrew from school after May 11, 2009 - If a student withdrew after May 11, 2009, but before completing all of the test
sessions, school personnel were instructed to code this reason on the student’s answer booklet.
Chapter 3—Test Administration 14 2008–09 NECAP Science Technical Report
Student enrolled in school after May 11, 2009 - If a student enrolled after May 11, 2009, and was unable to complete all of the test
sessions before the end of the testing administration window, school personnel were instructed to code this reason on the student’s answer booklet.
State approved special consideration - Each state department of education had a process for documenting and approving
circumstances that made it impossible or not advisable for a student to participate in testing. Schools were required to obtain state approval before beginning testing.
Student was enrolled on May 11, 2009, and did not complete test for reasons other than those listed above
- If a student was not tested for a different reason, school personnel were instructed to code this reason on the student’s answer booklet. These “other” categories were considered not state approved.
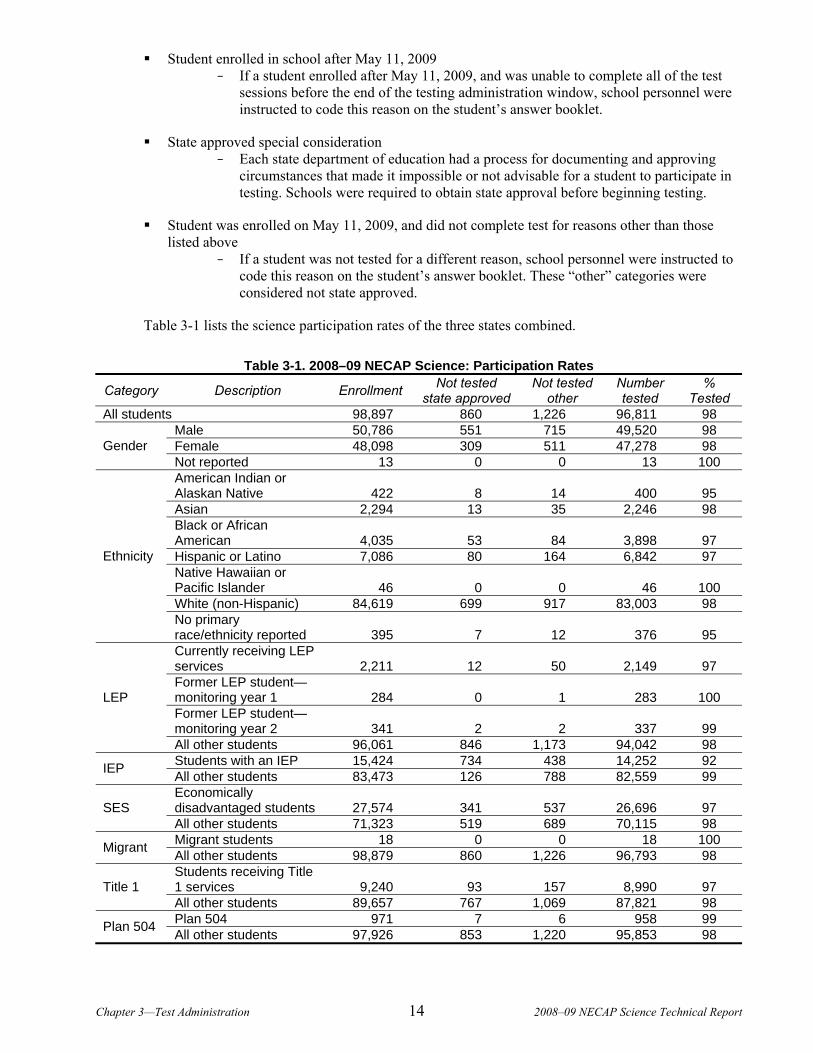
Table 3-1 lists the science participation rates of the three states combined.
Table 3-1. 2008–09 NECAP Science: Participation Rates
Category Description Enrollment Not tested state approved
Not tested other
Number tested
% Tested
All students 98,897 860 1,226 96,811 98 Male 50,786 551 715 49,520 98 Female 48,098 309 511 47,278 98 Gender Not reported 13 0 0 13 100 American Indian or Alaskan Native 422 8 14 400 95 Asian 2,294 13 35 2,246 98 Black or African American 4,035 53 84 3,898 97 Hispanic or Latino 7,086 80 164 6,842 97 Native Hawaiian or Pacific Islander 46 0 0 46 100 White (non-Hispanic) 84,619 699 917 83,003 98
Ethnicity
No primary race/ethnicity reported 395 7 12 376 95 Currently receiving LEP services 2,211 12 50 2,149 97 Former LEP student— monitoring year 1 284 0 1 283 100 Former LEP student— monitoring year 2 341 2 2 337 99
LEP
All other students 96,061 846 1,173 94,042 98 Students with an IEP 15,424 734 438 14,252 92 IEP All other students 83,473 126 788 82,559 99 Economically disadvantaged students 27,574 341 537 26,696 97 SES All other students 71,323 519 689 70,115 98 Migrant students 18 0 0 18 100 Migrant All other students 98,879 860 1,226 96,793 98 Students receiving Title 1 services 9,240 93 157 8,990 97 Title 1 All other students 89,657 767 1,069 87,821 98 Plan 504 971 7 6 958 99 Plan 504 All other students 97,926 853 1,220 95,853 98

Chapter 3—Test Administration 15 2008–09 NECAP Science Technical Report
3.4 Administrator Training
In addition to distributing the Principal/Test Coordinator and Test Administrator Manuals, the New
Hampshire, Rhode Island, and Vermont Departments of Education, along with Measured Progress, conducted
test administration workshops in multiple locations in each state to inform school personnel about the NECAP
Science test and to provide training on the policies and procedures regarding administration.
3.5 Documentation of Accommodations
Though every effort was made to provide a test that would be as accessible as possible, a need still
remained to allow some students to take the test with accommodations. An operating principle employed
during the development of the accommodations protocols and policy development was to allow only
accommodations that would not change the construct of what was being measured by the item.
The Principal/Test Coordinator and Test Administrator Manuals provided directions for coding the
information related to accommodations and modifications on page 2 of the student answer booklet. All
accommodations used during any test session were required to be coded by authorized school personnel—not
students—after testing was completed.
The training guide Accommodations, Guidelines, and Procedures also provides detailed information
on planning and implementing accommodations. This guide can be located on each state’s department of
education Web site. The states collectively made the decision that accommodations be made available to all
students based on individual need, regardless of disability status. Decisions regarding accommodations were
to be made by the students’ educational teams on an individual basis and were to be consistent with those
used during the students’ regular classroom instruction. Making accommodations decisions on an entire group
basis rather than on an individual basis was not permitted. If the decision made by a student’s educational
team required an accommodation not listed in the state approved Table of Standard Test Accommodations,
schools were instructed to contact their department of education in advance of testing for specific instructions
for coding the “Other Accommodations (E)” and/or “Modifications (F)” sections.
Table 3-2 shows the accommodations observed for the May 2009 NECAP Science administration.
The accommodation codes are defined in the Table of Standard Test Accommodations, found in Appendix C.
The appropriateness and impact of accommodations are discussed in Appendix D.

Chapter 3—Test Administration 16 2008–09 NECAP Science Technical Report
.
Table 3-2. 2008–09 NECAP Science: Accommodation Frequencies
Accommodation Grade 4
Grade 8
Grade 11
A01 800 394 304 A02 4,077 3,393 2,483 A03 1,339 507 362 A04 225 203 59 A05 24 5 1 A06 11 11 2 A07 1,395 1,246 1,002 A08 1,302 465 295 A09 9 3 193 B01 214 131 43 B02 2,166 1,317 539 B03 2,713 1,739b 1,001 C01 4 0 6 C02 38 25 11 C03 19 14 12 C04 3,693 1,402 567 C05 483 74 10 C06 53 26 44 C07 555 272 86 C08 13 4 0 C09 124 12 7 C10 4 1 0 C11 34 17 2
Accommodation Grade 4
Grade 8
Grade 11
C12 44 94 34 C13 0 0 0 D01 37 111 59 D02 68 36 17 D03 3 3 3 D04 155 32 31 D05 1,297 216 68 D06 55 11 5 D07 1 0 524 E01 0 4 3 E02 0 0 0 F01 16 42 79 F02 0 0 0 F03 0 2 1 N01 0 0 437 N02 0 0 653 N03 0 0 70 N04 0 0 277 N05 0 0 132 N06 0 0 79 N07 0 0 100 N08 0 0 237
3.6 Test Security
Maintaining test security is critical to the success of NECAP and the continued partnership among the
three states. The Principal/Test Coordinator and Test Administrator Manuals explain in detail all test security
measures and test administration procedures. School personnel were informed that any concerns about
breaches in test security were to be reported to the test coordinator and principal immediately. The test
coordinator and/or principal were responsible for immediately reporting the concern to the district
superintendent and the state director of testing at the department of education. Test security was strongly
emphasized at the test administration workshops conducted in all three states. The states required the principal
of each school that participated in testing to log on to a secure Web site to complete the Principal’s
Certification of Proper Test Administration form for each grade level tested. The principal was required to
provide the number of secure tests received from Measured Progress, the number of tests administered to
students, and the number of secure test materials being returned to Measured Progress. The principal was then
required to enter his or her name in the online form as an electronic signature. By signing the form, the
principal was certifying that the tests were administered according to the procedures outlined in the
Principal/Test Coordinator and Test Administrator Manuals, that he or she maintained the security of the test
materials, that no secure material was duplicated or in any way retained in the school, and that all test
materials had been accounted for and scheduled for return to Measured Progress.

Chapter 3—Test Administration 17 2008–09 NECAP Science Technical Report
3.7 Test and Administration Irregularities
Several irregularities in the test forms and ancillary materials necessitated changes in scoring
procedures. At grade 4, the Session 3 test items did not appear in the Braille version of the test. The 18 raw
score points in Session 3 were removed from scaling and scoring calculations for the two grade 4 students
who took the test with a Braille version.
The grade 11 Braille reference sheets were mislabeled by the vendor as grade 8, and the grade 8
Braille reference sheets were mislabeled by the vendor as grade 11. Four grade 11 students took the test with
a Braille test booklet and reference sheet. There were five grade 11 common items that asked the student to
use the reference sheet to answer the item. These five items (composing 8 raw score points) were removed
from scaling and scoring calculations for the four affected students. No grade 8 students took the test with a
Braille version.
At grade 11, Session 3 contained a data table with incorrect data. In one of the Session 3 test items,
students were asked to graph the data from that data table. It was determined that the incorrect data in the
table did not affect students’ ability to construct an appropriate graph and earn full credit on the item. This 3
point item was scored with a modified rubric so that students who either identified the error in the data table
or worked around it would still receive full credit for identifying the trend in the data the item was attempting
to elicit.
3.8 Test Administration Window
The test administration window was May 11 to 28, 2009.

Chapter 3—Test Administration 18 2008–09 NECAP Science Technical Report
3.9 NECAP Service Center
To provide additional support to schools before, during, and after testing, Measured Progress
established the NECAP Service Center. The additional support that the service center provided was an
essential element to the successful administration of any statewide test program. Individuals in the field could
call the centralized location using a toll free number and ask questions or report any problems they were
experiencing.
The service center was staffed based on call volume and was available from 8:00 a.m. to 4:00 p.m.
beginning two weeks before the start of testing and ending two weeks after testing. The representatives were
responsible for receiving, responding to, and tracking calls and then routing issues to the appropriate
person(s) for resolution.

Chapter 4—Scoring 19 2008–09 NECAP Science Technical Report
Chapter 4. SCORING Upon receipt of used NECAP Science answer booklets following testing, Measured Progress scanned
all student responses, along with student identification and demographic information. Imaged data for
multiple-choice items were machine scored. Images of constructed-response items were processed and
organized by iScore, a secure server-to-server electronic scoring software designed by Measured Progress, for
hand scoring.
Student responses that could not be physically scanned (e.g., answer documents damaged during
shipping) were physically reviewed and scored on an individual basis by trained, qualified readers. These
scores were linked to the student’s demographic data and merged with the student’s scoring file by Measured
Progress’s data processing department.
4.1 Machine Scored Items
Multiple-choice responses were compared to scoring keys using item analysis software. Correct
answers were assigned a score of 1 point; incorrect answers were assigned a score of 0 points. Student
responses with multiple marks or blank responses were also assigned 0 points.
The hardware elements of the scanners monitored themselves continuously for correct read, and the
software driving these scanners monitored the correct data reads. Standard checks included recognition of a
sheet that did not belong, was upside down, or was backward; identification of missing critical data, including
a student ID number or test form that was out of range or missing; and identification of page/document
sequence errors. When a problem was detected, the scanner stopped and displayed an error message directing
the operator to investigate and correct the situation.
4.2 Hand Scored Items
The images of student responses to constructed-response items were hand scored through the iScore
system. Using iScore minimized the need for readers to physically handle actual answer booklets and related
scoring materials. Student confidentiality was easily maintained, as all NECAP Science scoring was “blind”
(i.e., district, school, and student names were not visible to readers). The iScore system maintained the link
between the student response images and their associated test booklet numbers.
Through iScore, qualified readers accessed electronically scanned images of student responses at
computer terminals. The readers evaluated each response and recorded each student’s score via keypad or
mouse entry through the iScore system. When a reader finished one response, the next response immediately
appeared on the computer screen.
Imaged responses from all answer booklets were sorted into item specific groups for scoring
purposes. Readers reviewed responses from only one item at a time; however, when necessary, imaged

Chapter 4—Scoring 20 2008–09 NECAP Science Technical Report
responses from a student’s entire booklet were available for viewing, and the physical booklet was also
available to the onsite chief reader.
The use of iScore also helped ensure that access to student response images was limited to only those
who were scoring or who were working for Measured Progress in a scoring management capacity.
4.3 Inquiry Task Scoring
Of special interest during this cycle of scoring 2008–09 NECAP Science was implementing the
scoring requirements associated with inquiry task items. These items were unique in that students conducted a
single scientific experiment and then answered approximately eight questions about that experiment. The
questions were designed to stand alone, meaning that each one could be scored separately instead of as part of
a set of eight combined questions. This maximized the number of readers that could be assigned to score
responses for each student.
4.4 Scoring Location and Staff
Scoring Location
The iScore database, its operation, and its administrative controls are all based in Dover, New
Hampshire; in addition, all 2008–09 NECAP Science responses were scored in Dover.
The iScore system monitored accuracy, reliability, and consistency across the scoring site. Constant
daily communication and coordination were accomplished through e-mail, telephone, and secure Web sites, to
ensure that critical information and scoring modifications were shared and implemented throughout the
scoring site.
Staff Positions
The following staff members were involved with scoring the 2008–09 NECAP Science responses:
The NECAP Science scoring project manager, an employee of Measured Progress based in
Dover, New Hampshire, oversaw the communication and coordination of scoring constructed-
response items.
The iScore operational manager and iScore administrators, employees of Measured Progress
based in Dover, New Hampshire, coordinated technical communication pertaining to the scoring
of constructed-response items.
A chief reader in science ensured the consistency of scoring across the scoring site for all grades
tested. The chief reader, an employee of Measured Progress, also provided read behind activities
for quality assurance coordinators.
Numerous quality assurance coordinators (QACs), selected from a pool of experienced senior
readers for their ability to score accurately and their ability to instruct and train readers,
Chapter 4—Scoring 21 2008–09 NECAP Science Technical Report
participated in benchmarking activities for each grade. QACs provided read behind activities for
senior readers. The ratio of QACs and senior readers to readers was approximately 1 to 11.
Numerous senior readers (SRs), selected from a pool of skilled and experienced readers, provided
read behind activities for the readers at their scoring tables (2 to 12 readers at each table).
Readers at the scoring site scored the 2008–09 NECAP Science operational and field test student
responses.
4.4.1 Reader Recruitment and Qualifications
For scoring of the 2008–09 NECAP Science test, Measured Progress actively sought a diverse scoring
pool that was representative of the population of the three participating NECAP states. The broad range of
readers included scientists, editors, business professionals, authors, teachers, graduate school students, and
retired educators. Demographic information for readers (e.g., gender, race, educational background) was
electronically captured and reported.
Although a four year college degree or higher was preferred for all readers, readers of the responses
of grade 4, 8, and 11 students were required to have successfully completed at least two years of college and
to have demonstrated knowledge of science. This permitted the recruitment of readers who were currently
enrolled in a college program, a sector of the population that had relatively recent exposure to classroom
practices and current trends in their field of study. In all cases, potential readers submitted documentation
(e.g., resume and/or transcripts) of their qualifications.
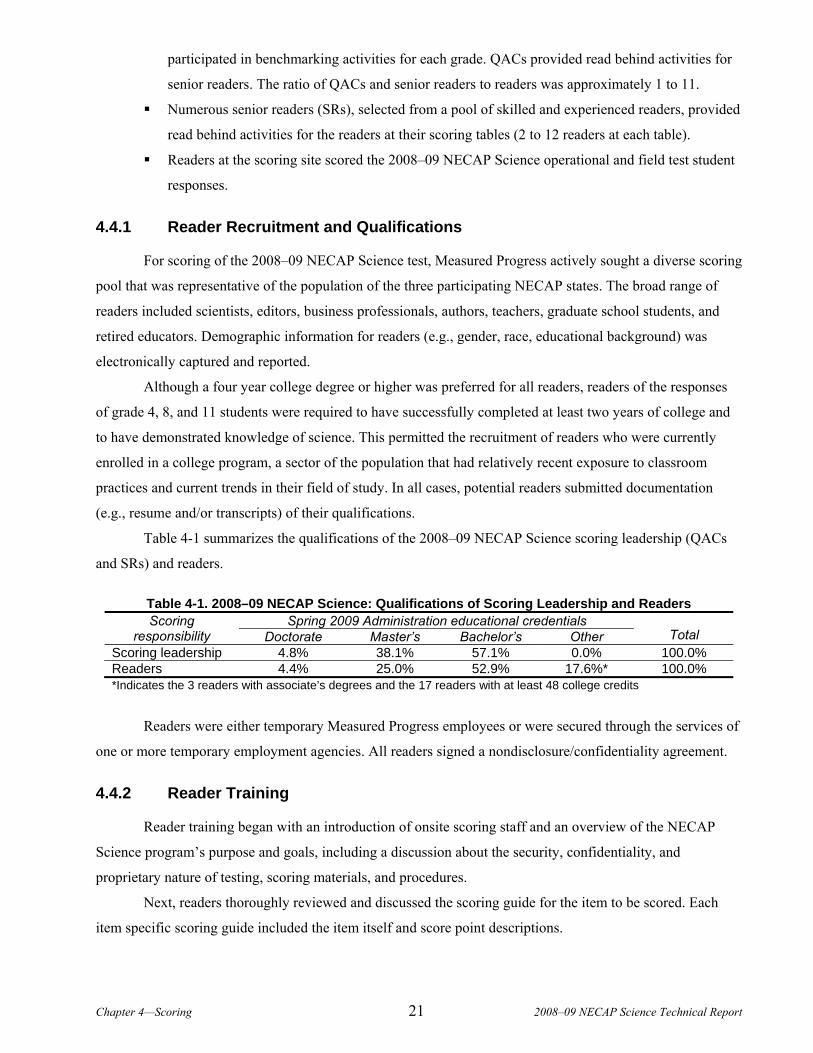
Table 4-1 summarizes the qualifications of the 2008–09 NECAP Science scoring leadership (QACs
and SRs) and readers.
Table 4-1. 2008–09 NECAP Science: Qualifications of Scoring Leadership and Readers Spring 2009 Administration educational credentials Scoring
responsibility Doctorate Master’s Bachelor’s Other Total Scoring leadership 4.8% 38.1% 57.1% 0.0% 100.0% Readers 4.4% 25.0% 52.9% 17.6%* 100.0% *Indicates the 3 readers with associate’s degrees and the 17 readers with at least 48 college credits
Readers were either temporary Measured Progress employees or were secured through the services of
one or more temporary employment agencies. All readers signed a nondisclosure/confidentiality agreement.
4.4.2 Reader Training
Reader training began with an introduction of onsite scoring staff and an overview of the NECAP
Science program’s purpose and goals, including a discussion about the security, confidentiality, and
proprietary nature of testing, scoring materials, and procedures.
Next, readers thoroughly reviewed and discussed the scoring guide for the item to be scored. Each
item specific scoring guide included the item itself and score point descriptions.

Chapter 4—Scoring 22 2008–09 NECAP Science Technical Report
Following review of the item specific scoring guide for any constructed-response item, readers began
reviewing or scoring response sets organized for specific training purposes:
Anchor set
Training set
Qualifying set
During training, readers were able to highlight or mark hard copies of the anchor and training sets,
even if all or part of the sets was also presented online via computer.
4.4.2.1 Anchor Set
Readers first reviewed an anchor set of exemplary responses, approved by the state science specialists
representing the three participating departments of education, for the item to be scored. Responses in anchor
sets were typical, rather than unusual or uncommon; solid, rather than controversial or borderline; and true,
meaning that they had scores that could not be changed by anyone other than the NECAP client and Measured
Progress test development staff.
For constructed-response items, each item specific anchor set contained, for each respective score
point, a client approved sample response that was to be considered a midrange example of its respective score
point. When necessary, a second sample response was included to illustrate an alternate way to achieve that
score point.
Responses were read aloud to the room of readers and presented in descending score order. Trainers
then announced the true score of each anchor response and facilitated a group discussion of the response in
relation to the score point descriptions to allow readers to internalize typical characteristics of each score
point.
This anchor set served as a reference for readers as they continued with calibration, scoring, and
recalibration activities for that item.
4.4.2.2 Training Set
Next, readers practiced applying the scoring guide and anchors to responses in the training set. The
training set typically included 10 to 15 student responses designed to help establish the score point range and
the range of responses within each score point. The training set often represented unusual responses that were
less clear or solid (e.g., were shorter than normal, employed atypical approaches, contained both very low and
very high attributes, or included difficult handwriting). Responses in the training set were presented in
randomized score point order.
After readers had independently read and scored a training set response, trainers polled readers or
used online training system reports to record the initial range of scores. Then they led a group discussion of
one or two responses, directing reader attention to scoring issues that were particularly relevant to the specific

Chapter 4—Scoring 23 2008–09 NECAP Science Technical Report
scoring group, such as the line between two score points. Trainers modeled for readers how to discuss scores
by referring to the anchor set and scoring guides.
4.4.2.3 Qualifying Set
After the training set had been completed, readers were required to measurably demonstrate their
ability to accurately and reliably score all items, according to the appropriate anchor set in concert with its
scoring rubric, by scoring the qualifying set. The qualifying set consisted of 10 responses selected from an
array of responses that clearly illustrated the range of score points for that item. The set was chosen in
accordance with the responses reviewed and approved by the state specialists.
To be eligible to score operational 2008–09 NECAP Science responses, readers were required to
demonstrate scoring accuracy rates of at least 80% exact agreement and at least 90% exact or adjacent
agreement across all items. In other words, exact scores were required on at least eight of the qualifying set
responses and either exact or adjacent scores were required on at least nine. Readers were allowed one
discrepant score as long as they had at least eight exact scores.
4.4.2.4 Retraining
Readers who did not pass the first qualifying set were retrained as a group by reviewing their
performance with scoring leadership and then scored a second qualifying set of responses. If they achieved a
minimum scoring accuracy rate of 80% exact and 90% exact or adjacent agreement on this second set, they
were allowed to score operational responses.
If readers did not achieve the required scoring accuracy rates on the second qualifying set, they were
not allowed to score responses for that item. Instead, they were either trained on a different item or dismissed
from scoring.
4.4.3 QAC and SR Training
QACs and select SRs were trained in a separate training session that occurred immediately prior to
reader training. In addition to discussing the items and their responses, QAC and SR training included
emphasis on the states' rationale behind the score points. This rationale was discussed in greater detail with
QACs and SRs then with regular readers to better equip leadership to handle questions from the readers.
4.4.4 Benchmarking Meetings
In preparation for implementing NECAP Science guidelines for the scoring of field test responses,
Measured Progress scoring staff prepared and facilitated benchmarking meetings held with the NECAP state
science specialists. The purpose of the meetings was to establish item specific guidelines for scoring each
NECAP Science item for the current field test scoring session and for future operational scoring sessions.
Chapter 4—Scoring 24 2008–09 NECAP Science Technical Report
Prior to these meetings, scoring staff collected a set of several dozen student responses that chief
readers identified as being illustrative midrange examples of their respective score points. The chief readers
and science specialists worked collaboratively during benchmarking meetings to finalize an authoritative set
of score point exemplars for each field test item. As a matter of practice, each of these authoritative sets is
included as part of the scoring training materials and used to train readers each time that item is scored—both
as a field test item and as part of a future NECAP Science administration.
This repeated use of approved sets of midrange score point exemplars helps ensure that each time a
particular NECAP Science item is scored readers follow the guidelines established by the state science
specialists.
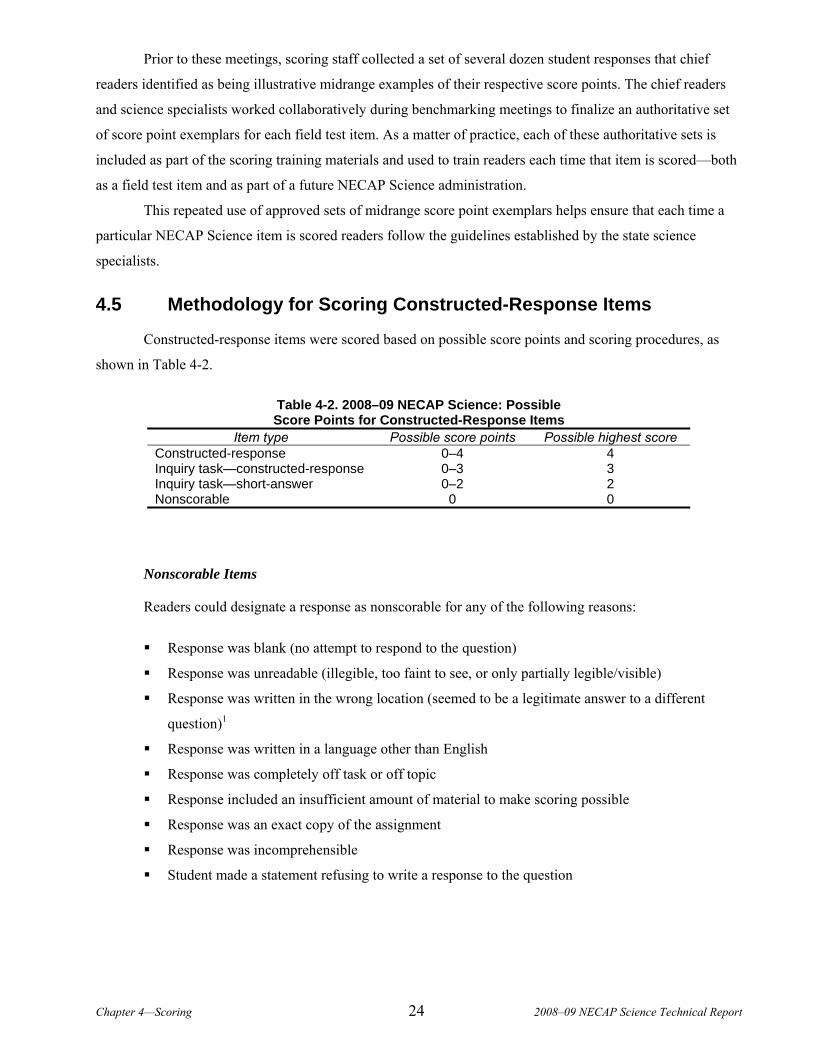
4.5 Methodology for Scoring Constructed-Response Items
Constructed-response items were scored based on possible score points and scoring procedures, as
shown in Table 4-2.
Table 4-2. 2008–09 NECAP Science: Possible Score Points for Constructed-Response Items
Item type Possible score points Possible highest score Constructed-response 0–4 4 Inquiry task—constructed-response 0–3 3 Inquiry task—short-answer 0–2 2 Nonscorable 0 0
Nonscorable Items
Readers could designate a response as nonscorable for any of the following reasons:
Response was blank (no attempt to respond to the question)
Response was unreadable (illegible, too faint to see, or only partially legible/visible)
Response was written in the wrong location (seemed to be a legitimate answer to a different
question)1
Response was written in a language other than English
Response was completely off task or off topic
Response included an insufficient amount of material to make scoring possible
Response was an exact copy of the assignment
Response was incomprehensible
Student made a statement refusing to write a response to the question

Chapter 4—Scoring 25 2008–09 NECAP Science Technical Report
Unreadable and wrong location responses were eventually resolved, whenever possible, by
researching the actual answer document (electronic copy or hard copy, as needed) to identify the
correct location or to more closely examine the response and then assign a score.
Scoring Procedures
Scoring procedures for constructed-response items included both single scoring and double scoring.
Single scored items were scored by one reader. Double scored items were scored independently by two
readers, whose scores were tracked for agreement (known as interrater agreement). For further discussion of
double scoring and interrater agreement, see subsection 4.5.1.3 and Appendix E.
Table 4-3 shows by which method(s) common and equating constructed-response items for each
operational test were scored.
Table 4-3. 2008–09 NECAP Science: Methods of Scoring Common and Equating Constructed-Response Items by Grade and Test
Grade Test/Field test name
Responses single scored
(per grade and test/field test)
Responses double scored (per grade and test/field test)
4 Science 100% 2% randomly 8 Science 100% 2% randomly
11 Science 100% 2% randomly All Unreadable responses 100% 100% All Blank responses 100% 100%
For each field test item, 1,500 student responses were scored.
4.5.1 Monitoring of Scoring Quality Control and Consistency
Readers were monitored for continued accuracy rates and scoring consistency throughout the scoring
process, using the following methods and tools:
Embedded committee reviewed responses (CRRs)
Read behind procedures
Double blind scoring
Scoring reports
If readers met or exceeded the expected accuracy rate, they continued scoring operational responses.
Any reader who fell below the expected accuracy rate for the particular item and monitoring method was
retrained on that item and, upon approval by the QAC or chief reader as appropriate, was allowed to resume
scoring.
It is important to note the difference between the accuracy rate each reader must have achieved to
qualify for scoring live responses and the accuracy rate each reader must have maintained to continue scoring

Chapter 4—Scoring 26 2008–09 NECAP Science Technical Report
live responses. Specifically, the qualification accuracy rate was stricter than the live scoring accuracy rate.
The reason for this difference is that an “exact score” in double blind statistics requires that two readers both
identify the same score for a response; an exact score during qualification requires that an individual reader
match the score predefined by leadership. Thus, the latter is dependent on matching an expert, not a peer.
During live scoring, reader accuracy rates are monitored using an array of techniques, thereby
providing a more complete picture of a reader’s performance than would be the case by relying on just one
technique. These techniques are described in the next subsections.
4.5.1.1 Embedded CRRs
Previously scored CRRs were selected and loaded into iScore for blind distribution to readers as a
way to monitor accuracy. Embedded CRRs, either chosen before scoring had begun or selected by leadership
during scoring, were inserted into the scoring queue so as to be indistinguishable from all other live student
responses.
Between 5 and 30 embedded CRRs were distributed at random points throughout the first full day of
scoring an item to ensure that readers were sufficiently calibrated at the beginning of the scoring period.
Individual readers often received up to 20 embedded CRRs within the first 100 responses scored, and up to 10
CRRs within the next 100 responses scored on that first day of scoring that item.
If any reader fell below the required live scoring accuracy rate, he or she was retrained before being
allowed by the QAC to continue. Once the reader was allowed to resume scoring, leadership carefully
monitored him or her by increasing the number of read behinds.
4.5.1.2 Read Behind Procedures
Read behind scoring refers to the practice of scoring leadership, usually an SR, scoring a response
after a reader has already scored it.
Responses to be placed into the read behind queue were randomly selected by scoring leadership;
readers were not made aware as to which of their responses would be reviewed by their SR. The iScore
system allowed one, two, or three responses per reader to be placed into the read behind queue at a time.
The SR entered his or her score into iScore before being allowed to see the score assigned by the
reader for whom the read behind was being performed. The SR then compared the two scores, and the
ultimate reported score was determined as follows.
If there was exact agreement between the scores, no action was taken; the regular reader’s score
remained.
If the scores were adjacent (i.e., the difference was not greater than 1), the SR’s score became the
score of record. If there were a significant number of adjacent scores for this reader across items,

Chapter 4—Scoring 27 2008–09 NECAP Science Technical Report
an individual scoring consultation was held with the reader, and the QAC determined whether or
when the reader could resume scoring.
If there was a discrepant difference between the scores (greater than 1 point), the SR’s score
became the score of record. An individual consultation was held with the reader, with the QAC
determining whether or when the reader could resume scoring.
These three scenarios are illustrated in Table 4-4.
Table 4-4. 2008–09 NECAP Science: Examples of Read Behind
Scoring Resolutions
Reader QAC/SR resolution Final*
4 4 4 4 3 3 4 2 2
* QAC/SR score is score of record.
Approximately 3.3% of all student responses were reviewed by QACs and SRs as read behinds. In
cases where a reader’s scoring rate fell below the required accuracy percentage, QACs and SRs conducted
additional read behinds for that reader.
In addition to the daily read behinds, scoring leadership could choose to read behind any reader at any
point during the scoring process and thereby take an immediate, real-time “snapshot” of a reader’s accuracy.
4.5.1.3 Double Blind Scoring
Double blind scoring refers to the practice of two readers independently scoring a response, each
without knowing the response had already been or soon would be scored by another reader as well. Table 4-3
provides information about the proportion of responses that were double scored. Appendix E presents the
percentages of double blind agreement for each grade level test.
If there was a discrepancy (a difference greater than 1) between scores, the response was placed in an
arbitration queue. Arbitration responses were reviewed by scoring leadership (SR or QAC) without any
background knowledge of the scores assigned by the two previous readers.
Scoring leadership consulted individually with any reader whose scoring rates on the different
monitoring methods fell below the required accuracy percentage, and the QAC determined whether or when
the reader could resume scoring. Once the reader was allowed to resume scoring, leadership carefully
monitored him or her by increasing the frequency of read behinds.
4.5.2 Scoring Reports
Measured Progress’s electronic scoring software, iScore, generated multiple reports that were used by
scoring leadership to measure and monitor readers for scoring accuracy, consistency, and productivity.

Chapter 4—Scoring 28 2008–09 NECAP Science Technical Report
Reports Generated During Scoring
Because the 2008–09 NECAP Science administration was complex, computer generated reports were
necessary to ensure all of the following:
overall group level accuracy, consistency, and reliability of scoring
immediate, real-time individual reader data availability for early reader intervention when
necessary
scoring schedule maintenance
The following reports were produced by iScore:
The Read Behind Summary showed the total number of read behind responses for each reader,
and noted the numbers and percentages of scores that were exact, adjacent, and discrepant
between that reader and the SR or QAC. Scoring leadership could choose to generate this report
by selecting options such as “Today,” “Past Week,” or “Cumulative” from a pull down menu.
The report could also be filtered to display data for a particular item or across all items. This
report was used in conjunction with other reports to determine whether a reader’s scores would be
voided (i.e., sent back out to the floor to be rescored by other readers). The benefit of this report
is that it measures the degree to which individual readers agree with their QAC or SR on how to
best score live responses.
The Double-Blind Summary showed the total number of double score responses scored by each
reader, and noted the numbers and percentages of scores that were exact, adjacent, and discrepant
between that reader and the second reader. This report was used in conjunction with other reports
to determine whether a reader’s scores would be voided. The benefit of this report is that it
reveals the degree to which readers are in agreement with each other about how to best score live
responses.
The Accuracy Summary combined read behind and double score data, showing the total number
of double score and read behind responses scored for each reader, and noting his or her accuracy
percentages and score point distributions.
The Embedded CRR Summary showed, for each reader and for either a particular item or
across all items, the total number of responses scored, the number of embedded CRRs scored, and
the numbers and percentages of scores that were exact, adjacent, and discrepant between the
reader and the chief reader (by virtue of the chief reader’s approval of the prescored embedded
CRRs). This report was used in conjunction with other reports to determine whether a reader’s
scores would be voided. The benefit of this report is that it measures the degree to which
individual readers agree with their chief reader on how to best score live responses—and since

Chapter 4—Scoring 29 2008–09 NECAP Science Technical Report
embedded responses are administered during the first hours of scoring, this report provides an
early indication of agreement between readers and their chief reader.
The Qualification Statistics Report listed all readers by name and ID number, identifying which
qualifying set(s) they did and did not take and, for the ones they did take, whether they passed or
failed. The total number of qualifications passed and failed was noted for each reader, as was the
total number of individuals passing or failing a particular qualifying set. The QAC could use this
report to determine how the readers within his or her specific scoring group performed on a
specific qualifying set.
The Summary Report showed the total number of student responses for an item and identified,
for the time at which the report was generated, (1) the number of single and double scorings that
had been performed, and (2) the number of single and double scorings yet to be performed.


Chapter 5—Classical Item Analyses 31 2008–09 NECAP Science Technical Report
Chapter 5. CLASSICAL ITEM ANALYSES As noted in Brown (1983), “A test is only as good as the items it contains.” A complete evaluation of
a test’s quality must include an evaluation of each question. Both Standards for Educational and
Psychological Testing (American Educational Research Association [AERA], American Psychological
Association, & National Council on Measurement in Education, 1999) and Code of Fair Testing Practices in
Education (Joint Committee on Testing Practices, 1988) include standards for identifying quality questions.
Questions should assess only the knowledge or skills identified as part of the domain being measured and
should avoid assessing irrelevant factors. They should also be unambiguous and free of grammatical errors,
potentially insensitive content or language, and other confounding characteristics. Further, questions must not
unfairly disadvantage test takers from particular racial, ethnic, or gender groups.
Both qualitative and quantitative approaches were taken to ensure that NECAP Science questions met
these standards. Qualitative work was discussed in Chapter 2. The following discussion summarizes several
types of quantitative analyses that were carried out on the 2008–09 NECAP Science items: classical statistics,
differential item functioning (subgroup differences in item performance), dimensionality analyses, and item
response theory analyses.
5.1 Classical Statistics
All 2008–09 NECAP Science items were evaluated in terms of difficulty according to standard
classical test theory (CTT) practice. The expected item difficulty, also known as the p-value, is the main index
of item difficulty under the CTT framework. This index measures an item’s difficulty by averaging the
proportion of points received across all students who took the item. Multiple-choice items were scored
dichotomously (correct versus incorrect), so the difficulty index is simply the proportion of students who
correctly answered the item. To place all item types on the same 0–1 scale, the p-value of a constructed-
response item was computed as the average score on the item divided by its maximum possible score.
Although the p-value is traditionally called a measure of difficulty, it is properly interpreted as an easiness
index, because larger values indicate easier items. An index of 0.0 signifies that no student received credit for
the item. At the opposite extreme, an index of 1.0 signifies that every student received full credit for the item.
Items that are answered correctly by almost all students provide little information about differences in
student ability, but they do indicate knowledge or skills that have been mastered by most students. The
converse is true of items that are incorrectly answered by most students. In general, to provide the most
precise measurement, difficulty indices should range from near chance performance (0.25 for four-option
multiple-choice items, 0.00 for constructed-response items) to 0.90. Experience has indicated that items
conforming to this guideline tend to provide satisfactory statistical information for the bulk of the student
population. However, on a criterion referenced test such as NECAP Science, it may be appropriate to include
some items with difficulty values outside this region in order to measure well, throughout the range, the skills

Chapter 5—Classical Item Analyses 32 2008–09 NECAP Science Technical Report
present at a given grade. Having a range of item difficulties also helps to ensure that the test does not exhibit
an excess of scores at the floor or ceiling of the distribution.
A desirable feature of an item is that higher ability students should perform better than lower ability
students. A commonly used measure of this characteristic is the correlation between total test score (excluding
the item of interest) and student performance on the item. Within CTT, this item-test correlation is referred to
as the item’s discrimination, because it indicates the extent to which successful performance on an item
discriminates between high and low scores on the test. For polytomous items on the 2008–09 NECAP Science
test, the corrected Pearson product-moment correlation was used as the item discrimination index, and the
corrected point-biserial correlation was used for dichotomous items. The theoretical range of these statistics is
-1.0 to 1.0, with a typical range from 0.2 to 0.6.
One can think of a discrimination index as a measure of how closely an item assesses the same
knowledge and skills as other items that contribute to the criterion total score; in other words, the
discrimination index can be interpreted as a measure of construct consistency. In light of this, it is quite
important that an appropriate total score criterion be selected. For 2008–09 NECAP Science, raw score—the
sum of student scores on the common items—was selected. Item-test correlations were computed for each
common item, and the results are summarized below.
Summary statistics of the difficulty and discrimination indices by grade are provided in Tables 5-1
and 5-2. Means and standard deviations of p-values and discriminations are presented by form in Table 5-1
and by item type in Table 5-2. A comparison of indices across grade levels is complicated because the indices
are population dependent. Direct comparisons would require that either the items or students were common
across groups. As that was not the case, it cannot be determined whether differences in item functioning
across grade levels were due to differences in student cohorts’ abilities or differences in item-set difficulties,
or both. Comparing the difficulty indices between item types is also tricky. Multiple-choice items can be
answered correctly by guessing; thus, it is not surprising that the p-values for multiple-choice items were
higher than those for constructed-response items. Similarly, because of partial-credit scoring, the
discrimination indices of constructed-response items tended to be larger than those of multiple-choice items.

Chapter 5—Classical Item Analyses 33 2008–09 NECAP Science Technical Report
Table 5-1. 2008–09 NECAP Science: Classical Item Difficulty and Discrimination Indices by Grade and Test Form
Difficulty Discrimination Grade Form N Items Mean SD Mean SD
Common 44 0.64 0.16 0.36 0.08 01 10 0.68 0.12 0.32 0.06 02 10 0.65 0.18 0.30 0.12 03 10 0.72 0.13 0.34 0.11
4
04 9 0.68 0.13 0.31 0.06 Common 44 0.51 0.15 0.39 0.10
01 10 0.63 0.16 0.38 0.11 02 10 0.58 0.13 0.33 0.11 03 10 0.59 0.14 0.38 0.10
8
04 9 0.63 0.16 0.32 0.07 Common 44 0.52 0.13 0.37 0.13
01 10 0.55 0.19 0.33 0.13 02 10 0.54 0.17 0.33 0.12 03 10 0.54 0.11 0.34 0.12
11
04 9 0.57 0.12 0.34 0.07 SD = standard deviation
Table 5-2. 2008–09 NECAP Science: Classical Item Difficulty and Discrimination Indices by Item Type Across All Test Forms
Grade Statistic All MC CR Difficulty 0.66 (0.15) 0.70 (0.13) 0.49 (0.14) Discrimination 0.34 (0.09) 0.32 (0.07) 0.45 (0.08) 4 N 83 69 14 Difficulty 0.55 (0.16) 0.59 (0.14) 0.39 (0.12) Discrimination 0.37 (0.10 0.34 (0.07) 0.52 (0.09) 8 N 83 69 14 Difficulty 0.53 (0.14) 0.56 (0.13) 0.39 (0.11) Discrimination 0.35 (0.12) 0.31 (0.09) 0.55 (0.08) 11 N 83 69 14
All = MC and CR; MC = multiple-choice; CR = constructed-response
5.2 Differential Item Functioning
Code of Fair Testing Practices in Education (Joint Committee on Testing Practices, 1988) explicitly
states that subgroup differences in performance should be examined when sample sizes permit, and action
should be taken to ensure that differences in performance are due to construct relevant, rather than irrelevant,
factors. Standards for Educational and Psychological Testing (AERA et al., 1999) includes similar
guidelines. As part of the effort to identify such problems, 2008–09 NECAP Science items were evaluated by
means of differential item functioning (DIF) statistics.
DIF procedures are designed to identify items on which the performance by certain subgroups of
interest differs after controlling for construct relevant achievement. For 2008–09 NECAP Science, the
standardization DIF procedure (Dorans & Kulick, 1986) was employed. This procedure calculates the

Chapter 5—Classical Item Analyses 34 2008–09 NECAP Science Technical Report
difference in item performance for two groups of students (at a time) matched for achievement on the total
test. Specifically, average item performance is calculated for students at every total score. An overall average
is then calculated, weighting the total score distribution so that it is the same for the two groups. The criterion
(matching) score for 2008–09 NECAP Science was computed two ways. For common items, total score was
the sum of scores on common items. The total score criterion for matrix items was the sum of item scores on
both common and matrix items (excluding field test items). Based on experience, this dual definition of
criterion scores has worked well in identifying problematic common and matrix items.
Differential performances between groups may or may not be indicative of bias in the test. Group
differences in course taking patterns, interests, or school curricula can lead to DIF. If subgroup differences are
related to construct relevant factors, items should be considered for inclusion on a test.
Computed DIF indices have a theoretical range from -1.00 to 1.00 for multiple-choice items; those for
constructed-response items are adjusted to the same scale. For reporting purposes, items were categorized
according to the DIF index range guidelines suggested by Dorans and Holland (1993). Indices between -0.05
and 0.05 (Type A) can be considered negligible. Most items should fall in this range. DIF indices between -
0.10 and -0.05 or between 0.05 and 0.10 (Type B) can be considered low DIF but should be inspected to
ensure that no possible effect is overlooked. Items with DIF indices outside the -0.10 to 0.10 range (Type C)
can be considered high DIF and should trigger careful examination.
Tables 5-3 through 5-5 present the number of 2008–09 NECAP Science items classified into each
DIF category, broken down by grade, form, and item type. Results are given, respectively, for comparisons
between male and female, White and Black, and White and Hispanic students. In addition to the DIF
categories previously defined, “Type D” in the tables indicates not enough students in the grouping to
perform a reliable DIF analysis (i.e., fewer than 200 in at least one of the subgroups).
Table 5-3. 2008–09 NECAP Science: Items Classified Into DIF Categories by Grade, Test Form, and Item Type—Male Versus Female
Grade Form All A
All B
All C
All D
MC A
MC B
MC C
MC D
CR A
CR B
CR C
CR D
Common 37 7 0 0 26 7 0 0 11 0 0 0 01 9 1 0 0 8 1 0 0 1 0 0 0 02 10 0 0 0 9 0 0 0 1 0 0 0 03 8 1 1 0 7 1 1 0 1 0 0 0
4
04 8 1 0 0 8 1 0 0 0 0 0 0 Common 27 14 3 0 22 10 1 0 5 4 2 0
01 6 4 0 0 6 3 0 0 0 1 0 0 02 6 4 0 0 5 4 0 0 1 0 0 0 03 8 2 0 0 7 2 0 0 1 0 0 0
8
04 5 3 1 0 5 3 1 0 0 0 0 0 Common 34 9 1 0 26 6 1 0 8 3 0 0
01 9 1 0 0 8 1 0 0 1 0 0 0 02 8 2 0 0 7 2 0 0 1 0 0 0 03 7 2 1 0 6 2 1 0 1 0 0 0
11
04 7 1 1 0 7 1 1 0 0 0 0 0 All = MC and CR; MC = multiple-choice; CR = constructed-response; A = negligible DIF; B = low DIF; C = high DIF; D = not enough students to perform reliable DIF analysis

Chapter 5—Classical Item Analyses 35 2008–09 NECAP Science Technical Report
Table 5-4. 2008–09 NECAP Science: Items Classified Into DIF Categories by Grade, Test Form, and Item Type—White Versus Black
Grade Form All A
All B
All C
All D
MC A
MC B
MC C
MC D
CR A
CR B
CR C
CR D
Common 37 6 1 0 26 6 1 0 11 0 0 0 01 9 1 0 0 8 1 0 0 1 0 0 0 02 6 4 0 0 5 4 0 0 1 0 0 0 03 8 2 0 0 7 2 0 0 1 0 0 0
4
04 6 2 1 0 6 2 1 0 0 0 0 0 Common 38 6 0 0 27 6 0 0 11 0 0 0
01 10 0 0 0 9 0 0 0 1 0 0 0 02 9 1 0 0 8 1 0 0 1 0 0 0 03 10 0 0 0 9 0 0 0 1 0 0 0
8
04 8 1 0 0 8 1 0 0 0 0 0 0 Common 42 2 0 0 31 2 0 0 11 0 0 0
01 6 4 0 0 5 4 0 0 1 0 0 0 02 7 3 0 0 6 3 0 0 1 0 0 0 03 8 0 2 0 7 0 2 0 1 0 0 0
11
04 7 2 0 0 7 2 0 0 0 0 0 0 All = MC and CR; MC = multiple-choice; CR = constructed-response; A = negligible DIF; B = low DIF; C = high DIF; D = not enough students to perform reliable DIF analysis
Table 5-5. 2008–09 NECAP Science: Number of Items Classified Into DIF Categories by Grade, Test Form, and Item Type—White Versus Hispanic
Grade Form All A
All B
All C
All D
MC A
MC B
MC C
MC D
CR A
CR B
CR C
CR D
Common 38 6 0 0 27 6 0 0 11 0 0 0 01 10 0 0 0 9 0 0 0 1 0 0 0 02 6 3 1 0 6 2 1 0 0 1 0 0 03 10 0 0 0 9 0 0 0 1 0 0 0
4
04 7 2 0 0 7 2 0 0 0 0 0 0 Common 33 11 0 0 23 10 0 0 10 1 0 0
01 8 2 0 0 7 2 0 0 1 0 0 0 02 9 0 1 0 8 0 1 0 1 0 0 0 03 9 1 0 0 8 1 0 0 1 0 0 0
8
04 8 1 0 0 8 1 0 0 0 0 0 0 Common 42 2 0 0 31 2 0 0 11 0 0 0
01 8 2 0 0 7 2 0 0 1 0 0 0 02 8 2 0 0 7 2 0 0 1 0 0 0 03 6 4 0 0 5 4 0 0 1 0 0 0
11
04 7 2 0 0 7 2 0 0 0 0 0 0 All = MC and CR; MC = multiple-choice; CR = constructed-response; A = negligible DIF; B = low DIF; C = high DIF; D = not enough students to perform reliable DIF analysis
The tables show that the majority of DIF distinctions in the 2008–09 NECAP Science tests were Type
A, or negligible, DIF (Dorans & Holland, 1993). Although there were items with DIF indices in the high
category, this does not necessarily indicate that the items are biased. Both Code of Fair Testing Practices in
Education (Joint Committee on Testing Practices, 1988) and Standards for Educational and Psychological
Testing (AERA et al., 1999) assert that test items must be free from construct irrelevant sources of differential
difficulty. If subgroup differences in performance can be plausibly attributed to construct relevant factors, the

Chapter 5—Classical Item Analyses 36 2008–09 NECAP Science Technical Report
items may be included on a test. Thus, it is important to determine whether the cause of this differential
performance is construct relevant.
Table 5-6 presents the number of items classified into each DIF category by direction, comparing
males and females. For example, the F/A column denotes the total number of items classified as negligible
DIF on which females performed better than males, relative to performance on the test as a whole. The
adjacent M/A column gives the total number of negligible DIF items on which males performed better than
females, relative to performance on the test as a whole. The N/A and P/A columns display the aggregate
number and proportion of negligible DIF items, respectively. To provide a complete summary across items,
both common and matrix items are included in the tally that falls into each category. Results are broken down
by grade and item type.
Table 5-6. 2008–09 NECAP Science: Number and Proportion of Items Classified Into Each DIF Category and Direction by Item Type—Male Versus Female
Grade Item type F/A M/A N/A P/A F/B M/B N/B P/B F/C M/C N/C P/C
MC 29 29 58 0.84 2 8 10 0.14 0 1 1 0.01 4 CR 14 0 14 1.00 0 0 0 0.00 0 0 0 0.00 MC 17 28 45 0.65 4 18 22 0.32 0 2 2 0.03 8 CR 6 1 7 0.50 5 0 5 0.36 2 0 2 0.14 MC 25 29 54 0.78 1 11 12 0.17 0 3 3 0.04 11 CR 9 2 11 0.79 3 0 3 0.21 0 0 0 0.00
F = items on which females performed better than males (controlling for total test score); M = items on which males performed better than females (controlling for total test score); N = number of items; P = proportion of items; A = negligible DIF; B = low DIF; C = high DIF; D = not enough students to perform a reliable DIF analysis; MC = multiple-choice; CR = constructed-response
5.3 Dimensionality Analyses
Because tests are constructed with multiple content area subcategories and their associated knowledge
and skills, the potential exists for a large number of dimensions being invoked beyond the common primary
dimension. Generally, the subcategories are highly correlated with each other; therefore, the primary
dimension they share typically explains an overwhelming majority of variance in test scores. In fact, the
presence of just such a dominant primary dimension is the psychometric assumption that provides the
foundation for the unidimensional item response theory (IRT) models that are used for calibrating, linking,
and scaling the NECAP Science test forms for grades 4, 8, and 11.
The purpose of dimensionality analysis is to investigate whether violation of the assumption of test
unidimensionality is statistically detectable and, if so, (1) the degree to which unidimensionality is violated
and (2) the nature of the multidimensionality. Findings from dimensionality analyses performed on the spring
2009 NECAP Science common items for grades 4, 8, and 11 are reported below. (Note: Only common items
were analyzed since they are used for score reporting.)
The dimensionality analyses were conducted using the nonparametric IRT-based methods DIMTEST
(Stout, 1987; Stout, Froelich, & Gao, 2001) and DETECT (Zhang & Stout, 1999). Both use as their basic

Chapter 5—Classical Item Analyses 37 2008–09 NECAP Science Technical Report
statistical building block the estimated average conditional covariances for item pairs. A conditional
covariance is the covariance between two items conditioned on total score for the rest of the test, and the
average conditional covariance is obtained by averaging over all possible conditioning scores. When a test is
strictly unidimensional, all conditional covariances are expected to take on values within random noise of
zero, indicating statistically independent item responses for examinees with equal expected scores. Nonzero
conditional covariances are essentially violations of the principle of local independence, and such local
dependence implies multidimensionality. Thus, nonrandom patterns of positive and negative conditional
covariances are indicative of multidimensionality.
DIMTEST is a hypothesis testing procedure for detecting violations of local independence. The data
are first randomly divided into a training sample and a crossvalidation sample. An exploratory analysis of the
conditional covariances is conducted on the training sample data to find the cluster of items that displays the
greatest evidence of local dependence. The crossvalidation sample is then used to test whether the conditional
covariances of the selected cluster of items displays local dependence, conditioning on total score on the
nonclustered items. The DIMTEST statistic follows a standard normal distribution under the null hypothesis
of unidimensionality.
DETECT is an effect size measure of multidimensionality. As with DIMTEST, the data are first
randomly divided into a training sample and a crossvalidation sample (these samples are drawn independent
of those used with DIMTEST). The training sample is used to find a set of mutually exclusive and
collectively exhaustive clusters of items that best fit a systematic pattern of positive conditional covariances
for pairs of items from the same cluster and negative conditional covariances from different clusters. Next, the
clusters from the training sample are used with the crossvalidation sample data to average the conditional
covariances. The within cluster conditional covariances are summed, and from this sum the between cluster
conditional covariances are subtracted. The resulting difference is divided by the total number of item pairs,
and this average is multiplied by 100 to yield an index of the average violation of local independence for an
item pair. DETECT values less than 0.2 indicate very weak multidimensionality (or near unidimensionality);
values of 0.2 to 0.4, weak to moderate multidimensionality; values of 0.4 to 1.0, moderate to strong
multidimensionality; and values greater than 1.0, very strong multidimensionality.
DIMTEST and DETECT were applied to the spring 2009 NECAP Science tests for grades 4, 8, and
11. The data for each grade were split into a training sample and a crossvalidation sample. Each grade had at
least 30,000 student examinees. Because DIMTEST was limited to 24,000 students, the training and
crossvalidation samples for the DIMTEST analyses used 12,000 each, randomly sampled from the total
sample. DETECT, on the other hand, had an upper limit of 50,000 students, so every training and
crossvalidation sample used with DETECT had at least 15,000 students. DIMTEST was then applied to each
grade. DETECT was applied to each data set for which the DIMTEST null hypothesis was rejected in order to
estimate the effect size of the multidimensionality.

Chapter 5—Classical Item Analyses 38 2008–09 NECAP Science Technical Report
The results of DIMTEST were that the null hypothesis was strongly rejected for every data set
(p<0.00005 in all three cases). Because strict unidimensionality is an idealization that almost never holds
exactly for a given data set, these DIMTEST results were not surprising. Indeed, because of the very large
sample sizes of NECAP Science, DIMTEST would be expected to be sensitive to even quite small violations
of unidimensionality. Thus, it was important to use DETECT to estimate the effect size of the violations of
local independence found by DIMTEST. Table 5-7 displays the multidimensional effect size estimates from
DETECT.
Table 5-7. 2008–09 NECAP Science: Multidimensionality Effect Sizes
Multidimensionality effect size Grade 2007–08 2008–09
4 0.27 0.18 8 0.13 0.27
11 0.22 0.21
The DETECT values indicated weak multidimensionality for grades 8 and 11 and very weak
multidimensionality for grade 4. Table 5-7 also presents the results from last year’s analysis, which similarly
registered weak or very weak multidimensionality for all three grades. The way in which DETECT divided
the tests into clusters was investigated to see if there were any discernable patterns with respect to item type.
In all three grades there was strong evidence of the multiple-choice items and constructed-response items
tending to cluster separately, with the strongest separation occurring in grade 8 (not surprisingly, since it had
the largest DETECT effect size). The 2007–08 results also showed strong separate clustering of the multiple-
choice and constructed-response items, although the strongest separation occurred for grade 4 (the largest
DETECT effect size that year). None of the DETECT analyses indicated multidimensionality due to
substantive content subcategories. If multidimensionality due to such substantive content was indeed present,
it was small compared to the multidimensionality due to item type. Despite the evidence of
multidimensionality between the multiple-choice and constructed-response items in grades 4 and 11, the
effect sizes are weak and do not warrant changes in test design, scoring, or administration.

Chapter 6—Scaling and Equating 39 2008–09 NECAP Science Technical Report
Chapter 6. SCALING AND EQUATING
6.1 Item Response Theory
All 2008–09 NECAP Science items were calibrated using item response theory (IRT). IRT uses
mathematical models to define a relationship between an unobserved measure of student performance, usually
referred to as theta (θ ), and the probability (p) of getting a dichotomous item correct or of getting a particular
score on a polytomous item. In IRT, it is assumed that all items are independent measures of the same
construct (i.e., of the same θ ). Another way to think of θ is as a mathematical representation of the latent
trait of interest. Several common IRT models are used to specify the relationship between θ and p
(Hambleton & van der Linden, 1997; Hambleton & Swaminathan, 1985). The process of determining the
specific mathematical relationship between θ and p is called item calibration. After items are calibrated, they
are defined by a set of parameters that specify a nonlinear, monotonically increasing relationship between
θ and p. Once the item parameters are known, θ , an estimate of θ for each student, can be calculated. (θ is
considered to be an estimate of the student’s true score or a general representation of student performance. It
has characteristics that may be preferable to those of raw scores for equating purposes.)
For 2008–09 NECAP Science, the three-parameter logistic (3PL) model was used for dichotomous
items (multiple-choice and short-answer), and the graded-response model (GRM) was used for polytomous
items. The 3PL model for dichotomous items can be defined as follows:
( ) ( )( )
( ),
exp1 1
1 expi j i
i j i i ii j i
Da bP c c
Da b
θθ ξ
θ
⎡ ⎤−⎣ ⎦= + −⎡ ⎤+ −⎣ ⎦
where i indexes the items, j indexes students, a represents item discrimination, b represents item difficulty, c is the pseudoguessing parameter, ξi represents the set of item parameters (a, b, and c), and D is a normalizing constant equal to 1.701.
In the GRM for polytomous items, an item is scored in k + 1 graded categories, which can be viewed
as a set of k dichotomies. At each point of dichotomization (i.e., at each threshold), a two-parameter model
can be used. This implies that a polytomous item with k + 1 categories can be characterized by k item
category threshold curves (ICTCs) of the two-parameter logistic form:

Chapter 6—Scaling and Equating 40 2008–09 NECAP Science Technical Report
( ) ( )( )
*,
exp1 , ,
1 expi j i ik
ik j i i iki j i ik
Da b dP a b d
Da b d
θθ
θ
⎡ ⎤− +⎣ ⎦=⎡ ⎤+ − +⎣ ⎦
where i indexes the items, j indexes students, k indexes threshold, a represents item discrimination, b represents item difficulty, d represents threshold, and D is a normalizing constant equal to 1.701.
After computing k ICTCs in the GRM, k + 1 item category characteristic curves (ICCCs) are derived
by subtracting adjacent ICTCs:
* *( 1)(1| ) (1| ) (1| )ik j i k j ik jP P Pθ θ θ−= −
where
ikP represents the probability that the score on item i falls in category k, and *
ikP represents the probability that the score on item i falls above the threshold k
( *0 1iP = and *
( 1) 0i mP + = ).
The GRM is also commonly expressed as
( ) ( )( )
( )( )
1
1
exp exp,
1 exp 1 expi j i k i j i k
ik j ii j i k i j i k
Da b d Da b dP k
Da b d Da b d
θ θθ ξ
θ θ+
+
⎡ ⎤ ⎡ ⎤− + − +⎣ ⎦ ⎣ ⎦= −⎡ ⎤ ⎡ ⎤+ − + + − +⎣ ⎦ ⎣ ⎦
where ξi represents the set of item parameters for item i.
Finally, the item characteristic curve (ICC) for polytomous items is computed as a weighted sum of
ICCCs, where each ICCC is weighted by a score assigned to a corresponding category:
1
(1| ) (1| )m
i j ik ik jk
P w Pθ θ+
=∑
For more information about item calibration and determination, refer to Lord and Novick (1968),
Hambleton and Swaminathan (1985), or Baker and Kim (2004).
Test characteristic curves (TCCs) display the expected (average) raw score associated with each θj
value between -4.0 and 4.0. Mathematically, the TCC is computed by summing the ICCs of all items that
contribute to the raw score. Using the notation introduced above, the expected raw score at a given value of θj
is

Chapter 6—Scaling and Equating 41 2008–09 NECAP Science Technical Report
( )1
( | ) 1 ,n
j i ji
E X Pθ θ=
=∑
where i indexes the items (and n is the number of items contributing to the raw score); j indexes the students (here, jθ runs from -4 to 4); and
( | )θ jE X is the expected raw score for a student of ability jθ .
The expected raw score monotonically increases with jθ , consistent with the notion that students of
high ability tend to earn higher raw scores than students of low ability. Most TCCs are S-shaped—flatter at
the ends of the distribution and steeper in the middle.
The test information function (TIF) displays the amount of statistical information that the test
provides at each value of jθ . There is a direct relationship between the information of a test and its standard
error of measurement (SEM). Information functions depict test precision across the entire latent trait
continuum. For long tests, the SEM at a given jθ is approximately equal to the inverse of the square root of
the statistical information (I) at jθ (Hambleton, Swaminathan, & Rogers, 1991):
1( )( )
jj
SEMI
θθ
=
TIFs are often higher near the middle of the θ distribution, where most students are located and most
items are sensitive by design.
6.2 IRT Results
All 2008–09 NECAP Science items were calibrated using IRT. The results of those analyses are
presented here and in Appendix F. The tables in Appendix F give the IRT item parameters of all common
items on the 2008–09 NECAP Science tests, broken down by grade. Graphs of the corresponding TCCs and
TIFs, defined below, accompany the data tables.
The number of Newton cycles required for convergence for each grade during the IRT analysis can be
found in Table 6-1. The number of cycles required for the solution to converge fell within acceptable ranges
(e.g., below 150 cycles).
Table 6-1. 2008–09 NECAP Science: Number of Newton Cycles Required for Convergence Content area Grade Cycles
4 42 8 47 Science 11 136

Chapter 6—Scaling and Equating 42 2008–09 NECAP Science Technical Report
For some items the guessing parameter was poorly estimated. This is not at all unusual, as difficulty
in estimating the c parameter has been well documented in the psychometric literature. It often happens when
item discrimination is low (e.g., less than 0.50). Careful study of these items found that fixing the lower
asymptote to a value of 0.00, for example, resulted in stable and reasonable estimates for both the a and b
parameters (relative to classical test theory statistics). Additionally, the a parameter is sometimes difficult to
estimate for items that are either very easy or very difficult. In these cases the a parameter was set to the
initial value estimated by PARSCALE from the classical item statistics.
These techniques produced item parameters that resulted in excellent model fit (comparing theoretical
ICCs to observed ICCs). Details of items that required intervention during IRT analysis are presented in Table
6-2. The number of items that required intervention across the grades was very typical.
Table 6-2. 2008–09 NECAP Science: Items Requiring Intervention Grade IREF Reason Action
46525 c parameter c = 0 135360 c parameter c = 0 59919 c parameter c = 0 49861 c parameter c = 0 46276 c parameter c = 0
4
14092 a parameter a set to initial value 50133 c parameter c = 0 8 18096 a parameter a set to initial value 60181 c parameter c = 0 46139 c parameter c = 0 135344 c parameter c = 0 61150 c parameter c = 0 47917 c parameter c = 0
11
46099 a parameter a set to initial value
6.3 Equating
The purpose of equating is to ensure that scores obtained from different forms of a test are equivalent.
Equating may be used when administering multiple forms in the same year or when comparing one year’s
forms to those given in the previous year. Equating ensures that students are not given an unfair advantage or
disadvantage because of the difficulty of the test form they took.
The 2008–09 administration of NECAP Science used a raw score to theta equating procedure in
which test forms are equated every year to the theta scale of the reference test forms. (In the case of NECAP
Science, the reference forms are those from the 2007–08 administration.) This is accomplished through the
chained linking design, in which every new form is equated back to the theta scale of the previous year’s test
form. It can therefore be assumed that the theta scale of every new test form is the same as the theta scale of
the reference form, since this is where the chain originated.
Students who took the equating items on the 2008–09 and 2007–08 NECAP Science tests are not
equivalent groups. IRT is particularly useful for equating scenarios that involve nonequivalent groups (Allen
Chapter 6—Scaling and Equating 43 2008–09 NECAP Science Technical Report
& Yen, 1979). Equating for NECAP Science uses the anchor-test-nonequivalent-groups design described by
Petersen, Kolen, and Hoover (1989). In this equating design, no assumption is made about the equivalence of
the examinee groups taking different test forms; that is, naturally occurring groups are assumed.
Comparability is instead evaluated through utilizing a set of anchor items (also called equating items).
NECAP Science uses an external anchor test design, which means that the equating items are not counted
toward students’ test scores. However, the equating items are designed to mirror the common test in terms of
item types and distribution of emphasis. Subsets of the equating items are distributed across forms.
Item parameter estimates for 2008–09 were placed on the 2007–08 scale by using the Stocking and
Lord (1983) method, which is based on the IRT principle of item parameter invariance. According to this
principle, the equating items for both the 2007–08 and 2008–09 NECAP Science tests should have the same
item parameters. After the item parameters for each 2007–08 NECAP Science test were estimated using
PARSCALE, as described earlier, the Stocking and Lord method was employed to find the linear
transformation (slope and intercept) that adjusted the equating items’ parameter estimates such that the 2008–
09 TCC was as close as possible to that of 2007–08.
6.4 Equating Results
An equating report was submitted to the NECAP state testing directors for their approval prior to
production of student reports. Various elements from the equating report are presented throughout this
technical report and its appendices.
In addition to the equating and scaling activities described in the previous subsection, various quality
control procedures were implemented within the Psychometrics and Research Department at Measured
Progress and reviewed with the NECAP state testing directors and NECAP Technical Advisory Committee
(see Appendix B for committee membership).
Appendix G presents the results from the delta analysis. This procedure was used to evaluate the
adequacy of equating items, and the discard status presented in the appendix indicates whether the item was
used in equating. Also presented in Appendix G are the results from the rescore analysis. For polytomous
equating items, 200 random papers from the previous year were interspersed with the 2008–09 papers to
evaluate scorer consistency from one year to the next. Only items with effect sizes greater than 0.80 were
automatically excluded as equating items.
To compare the presentation of each equating item from year to year, a copy match was performed
and the a and b parameters were plotted. Any items where changes in presentation were noted, or where
outliers were detected during review of the parameter plots, were further scrutinized to determine if they
should be removed from the equating set. Table 6-3 displays all items removed from the equating set, along
with the reason for their removal.

Chapter 6—Scaling and Equating 44 2008–09 NECAP Science Technical Report
Table 6-3. 2008–09 NECAP Science: Items Removed From the Equating Set
Grade IREF Reason Action 4 47624 Delta analysis Removed from equating 11 46099 b/b plot Removed from equating
The transformation constants resulting from the equating process are presented in Table 6-4.
Table 6-4. 2008–09 NECAP Science: Stocking and Lord Transformation Constants
Grade Content area Slope Intercept
4 Science 0.999 -0.040 8 Science 1.015 -0.034 11 Science 0.960 0.035
The next administration of NECAP (2009–10) will be scaled to the 2008–09 administration by the
same equating method.
6.5 Standard Setting
Achievement level cut scores in science were established in August 2008. The standard setting
meetings and results were discussed in the 2007–08 technical report. As alluded to in the previous discussion
of equating, the respective NECAP reporting scales were established during those base years, and the forms
serve as the reference for subsequent equating. The θ metric cut scores that emerged from the standard setting
meetings will remain fixed throughout the assessment program unless standards are reset for any reason.
6.6 Reported Scaled Scores
Description of Scale
Because the theta scale used in the IRT calibrations is not readily understood by most stakeholders,
reporting scales were developed for the NECAP Science tests. The reporting scales, simple linear
transformations of the underlying θ scale, are developed such that they range from x00 through x80 (where x
is grade level). In other words, grade 4 scaled scores range from 400 through 480, grade 8 from 800 through
880, and grade 11 from 1100 through 1180. The lowest scaled score in the Proficient range is fixed at x40 for
each grade level. For example, to be classified in the Proficient achievement level or above, a minimum
scaled score of 440 was required at grade 4, 840 at grade 8, and 1140 at grade 11.
Scaled scores supplement achievement level results by providing information that is more specific
about the position of a student’s results within an achievement level. School and district level scaled scores
are calculated by computing the average of student level scaled scores. Students’ raw scores (i.e., total

Chapter 6—Scaling and Equating 45 2008–09 NECAP Science Technical Report
number of points) on the 2008–09 NECAP Science tests were translated to scaled scores using a data analysis
process called scaling. Scaling simply converts from one scale to another. In the same way that a given
temperature can be expressed on either Fahrenheit or Celsius scales or the same distance can be expressed in
either miles or kilometers, student scores on the 2008–09 NECAP Science tests can be expressed in raw or
scaled scores. In Figure 6-1, two-way arrows depict how raw scores (vertical axis) map through the S-shaped
TCC to corresponding scores on the theta scale, which in turn map directly to scaled scores. (More details on
transforming theta scores to scaled scores are presented in subsection 6.6.2.) Converting from raw scores to
scaled scores does not change students’ achievement level classifications.
Figure 6-1. 2008–09 NECAP Science: Illustration of Raw Score–
Theta–Scaled Score Transformation Using TCC
Given the relative simplicity of raw scores, it is fair to question why scaled scores are reported for
NECAP Science instead of raw scores. Scaled scores make the reporting of results consistent. To illustrate,
standard setting typically results in different raw cut scores across content areas and grades. The raw cut score
between Partially Proficient and Proficient could be, say, 38 in grade 4 and 40 in grade 8, yet both of these
raw scores would be transformed to scaled scores of x40 (i.e., 440 and 840). It is this uniformity across scaled
scores that facilitates the understanding of student performance. The psychometric advantage of scaled scores
over raw scores comes from their being linear transformations of θ . Since the θ scale is used for equating,
scaled scores are comparable from one year to the next. Raw scores are not.

Chapter 6—Scaling and Equating 46 2008–09 NECAP Science Technical Report
6.6.2 Calculations
Scaled scores are obtained by a simple translation of ability estimates (θ ) using the linear
relationship between threshold values on the θ metric and their equivalent values on the scaled score metric.
Students’ ability estimates are based on their raw scores and are found by mapping through the TCC. Scaled
scores are calculated using the linear equation
ˆSS m bθ= +
where m is the slope, and b is the intercept.
A separate linear transformation is used for each grade level test of NECAP Science. The
transformation function is determined by fixing the Partially Proficient/Proficient cut score and the bottom of
the scale—that is, the x40 and the x00 values (e.g., 440 and 400 for grade 4). The x00 location on the θ scale
is beyond (i.e., below) the scaling of all items. To determine this location, a chance score (approximately
equal to a student’s expected performance by guessing) is mapped to a value of -4.0 on the θ scale. A raw
score of 0 is also assigned a scaled score of x00. The maximum possible raw score is assigned a scaled score
of x80 (e.g., 480 in the case of grade 4).
Because only two points within the θ scaled score space are fixed, the scaled score cuts between
Substantially Below Proficient and Partially Proficient and between Proficient and Proficient With Distinction
are free to vary across grades.
Table 6-5 illustrates the scaled score cuts for each grade (i.e., the minimum scaled score for getting
into the next achievement level) and the slope and intercept terms used to calculate the scaled scores. Again,
the values in Table 6-5 do not change from year to year because the cut scores along the θ scale do not
change. In any given year, it may not be possible to attain a particular scaled score, but the scaled score cuts
will remain the same.
Table 6-5. 2008–09 NECAP Science: Reporting Scale Range, Cut Scores, Intercept, and Slope for Each Achievement Level by Grade
Scaled score cuts Grade Minimum Maximum SBP/PP PP/P P/PWD Intercept Slope
4 400 480 427 440 463 9.881 439.5 8 800 880 829 840 855 8.420 833.7
11 1100 1180 1130 1140 1152 8.354 1133.4 SBP = Substantially Below Proficient; PP = Partially Proficient; P = Proficient; PWD = Proficient With Distinction
Table 6-6 shows the cut scores on the θ metric resulting from standard setting (see the 2007–08
NECAP Science Technical Report for a description of the standard setting process). Note that the numbers in
Table 6-6 will not change unless the standards are reset.

Chapter 6—Scaling and Equating 47 2008–09 NECAP Science Technical Report
Table 6-6. 2008–09 NECAP Science: Cut Scores on θ Metric by Grade
θ Cuts Grade SBP/PP PP/P P/PWD
4 -1.222 0.048 2.371 8 -0.612 0.751 2.578
11 -0.432 0.788 2.193 SBP = Substantially Below Proficient; PP = Partially Proficient; P = Proficient; PWD = Proficient With Distinction
Appendix H contains the raw score to scaled score conversion tables for the 2008–09 NECAP
Science tests. These are the actual tables used to determine student scaled scores, error bands, and
achievement levels.
6.6.3 Distributions
Appendix I includes scaled score cumulative density functions. These distributions were calculated
using the sparse data matrix files from the IRT calibrations. For each grade, these distributions show the
cumulative percentage of students scoring at or below a particular scaled score across the entire scaled score
range.


Chapter 7—Reliability 49 2008–09 NECAP Science Technical Report
Chapter 7. RELIABILITY Although an individual item’s performance is an important focus for evaluation, a complete
evaluation of an assessment must also address the way items function together and complement one another.
Tests that function well provide a dependable assessment of the student’s level of ability. Unfortunately, no
test can do this perfectly. A variety of factors can contribute to a given student’s score being either higher or
lower than his or her true ability. For example, a student may misread an item or mistakenly fill in the wrong
bubble when he or she knew the answer. Collectively, extraneous factors that impact a student’s score are
referred to as measurement error. Any assessment includes some amount of measurement error; that is, no
test is perfect. This is true of all academic assessments—some students will receive scores that underestimate
their true ability, and other students will receive scores that overestimate their true ability. When tests have a
high amount of measurement error, student scores are very unstable. Students of high ability may get low
scores, or vice versa. Consequently, one cannot reliably measure a student’s true level of ability with such a
test. Assessments that have less measurement error (i.e., errors are small on average and student scores
consistently represent ability) are described as reliable.
There are a number of ways to estimate an assessment’s reliability. One possible approach is to give
the same test to the same students at two different points in time. If students receive the same scores on each
test, then the extraneous factors affecting performance are small and the test is reliable. A potential problem
with the test-retest reliability approach is that students may remember items from the first administration or
may have gained (or lost) knowledge or skills in the interim between the two administrations. A solution to
the “remembering items” problem is to give a different but parallel test at the second administration. If
student scores on each test correlate highly, the test is considered reliable. The alternate-forms reliability
approach, however, does not address the problem that students may have gained (or lost) knowledge or skills
in the interim. In addition, the practical challenges of developing and administering parallel forms generally
preclude the use of such indices. A way to address these problems is to split the test in half and then correlate
students’ scores on the two half-tests; this in effect treats each half-test as a complete test. In doing so, the
problems associated with an intervening time interval or with creating and administering two parallel forms of
the test are alleviated. This is known as a split-half estimate of reliability. If the two half-test scores correlate
highly, items on the two half-tests must be measuring very similar knowledge or skills. This is evidence that
the items complement one another and function well as a group. This also suggests that measurement error
will be minimal.
The split-half method requires psychometricians to select items that contribute to each half-test score.
This decision may have an impact on the resulting correlation, since each different possible split of the test
halves will result in a different correlation. Another problem with the split-half method is that it
underestimates reliability, because test length is cut in half. All else being equal, a shorter test is less reliable
than a longer test. Cronbach (1951) provided a statistic, alpha (α), which avoids these concerns of the split-

Chapter 7—Reliability 50 2008–09 NECAP Science Technical Report
half method by comparing individual item variances to total test variance. Cronbach’s α was used to assess
the reliability of the 2008–09 NECAP Science tests. The formula for computing alpha is as follows:
2( )
121
1
i
n
Yi
x
nn
σα
σ=
⎡ ⎤⎢ ⎥⎢ ⎥≡ −
− ⎢ ⎥⎢ ⎥⎣ ⎦
∑
where i indexes the item, n is the total number of items, Error! Objects cannot be created from editing field codes. represents individual item variance, and
2σ x represents the total test variance.
7.1 Reliability and Standard Errors of Measurement
Table 7-1 presents descriptive statistics, Cronbach’s α coefficient, and the raw score standard error of
measurement (SEM) for each grade (statistics are based on common items only).
Table 7-1. 2008–09 NECAP Science: Common Item Raw Score Descriptive Statistics, Reliability Coefficients, and SEMs by Grade
Grade N Possible score
Minimum score
Maximum score
Mean score
Score SD
Reliability (α) SEM
4 31,495 63 2 61 37.91 10.00 0.88 3.51 8 33,732 63 0 61 28.88 11.43 0.90 3.64
11 35,265 63 0 62 30.02 11.54 0.89 3.79 SD = standard deviation
7.2 Subgroup Reliability
The reliability coefficients previously discussed were based on the overall population of students who
took the 2008–09 NECAP Science tests. Table 7-2 presents reliabilities for various subgroups of interest.
These reliabilities were computed using the formula for α as defined above but restricted to members of the
subgroup in question.

Chapter 7—Reliability 51 2008–09 NECAP Science Technical Report
Table 7-2. 2008–09 NECAP Science: Reliabilities by Subgroup and Grade
Grade Subgroup N α White 26,589 0.86 Native Hawaiian or Pacific Islander 13 0.81 Hispanic or Latino 2,405 0.87 Black or African American 1,364 0.88 Asian 823 0.87 American Indian or Alaskan Native 131 0.86 LEP 1,419 0.88 IEP 4,737 0.87
4
Low SES 10,279 0.87 White 28,738 0.89 Native Hawaiian or Pacific Islander 16 0.87 Hispanic or Latino 2,541 0.88 Black or African American 1,396 0.88 Asian 768 0.91 American Indian or Alaskan Native 138 0.90 LEP 838 0.86 IEP 5,420 0.87
8
Low SES 9,862 0.88 White 30,851 0.89 Native Hawaiian or Pacific Islander 21 0.89 Hispanic or Latino 2,150 0.87 Black or African American 1,284 0.87 Asian 734 0.90 American Indian or Alaskan Native 141 0.87 LEP 627 0.84 IEP 4,624 0.85
11
Low SES 7,492 0.87
For several reasons, the results of this subsection should be interpreted with caution. First, inherent
differences between grades preclude making valid inferences about the quality of a test based on statistical
comparisons with other tests. Second, reliabilities are dependent not only on the measurement properties of a
test but on the statistical distribution of the studied subgroup. For example, it is readily seen in Table 7-2 that
subgroup sizes vary considerably, which results in natural variation in reliability coefficients. Also, α , which
is a type of correlation coefficient, may be artificially depressed for subgroups with little variability (Draper &
Smith, 1998). Third, there is no industry standard to interpret the strength of a reliability coefficient; this is
particularly true when the population of interest is a single subgroup.

Chapter 7—Reliability 52 2008–09 NECAP Science Technical Report
7.3 Stratified Coefficient Alpha
According to Feldt and Brennan (1989), a prescribed distribution of items over categories (such as
different item types) indicates the presumption that at least a small, but important, degree of unique variance
is associated with the categories. Cronbach’s α coefficient, however, is built on the assumption that there are
no such local or clustered dependencies. A stratified version of coefficient α corrects for this problem by
taking item category into account. The formula for stratified αα is as follows:
2
12
(1 )1 =
−= −
∑ j
k
xj
stratx
σ α
σα
where j indexes the subtests or categories,
2jxσ represents the variance of the k individual subtests or categories,
α is the unstratified Cronbach’s α coefficient, and 2xσ represents the total test variance.
Stratified α based on item type was calculated separately for the common items in each grade. This
information is presented in Table 7-3. This is directly followed by the results of stratification based on form in
Table 7-4.
Table 7-3. 2008–09 NECAP Science: Common Item α and Stratified α by Item Type
MC CR Grade All α α N α N (poss) Stratified α
4 0.88 0.84 33 0.77 11 (30) 0.89 8 0.90 0.85 33 0.82 11 (30) 0.90
11 0.89 0.81 33 0.85 11 (30) 0.90 All = MC and CR; MC = multiple-choice; CR = constructed-response N = number of items; poss = total possible constructed-response points

Chapter 7—Reliability 53 2008–09 NECAP Science Technical Report
Table 7-4. 2008–09 NECAP Science: Reliability Overall and Based on Item Type and Common Versus Matrix, Separate and Stratified, Within Form by Grade
Grade Reliability Form 1 Form 2 Form 3 Form 4 Whole form alpha 0.89 0.89 0.90 0.89 – MC alpha 0.86 0.85 0.86 0.86 – CR alpha 0.77 0.79 0.79 0.76 Common/matrix stratified 0.90 0.90 0.90 0.90 – Common alpha 0.88 0.88 0.88 0.88 – Matrix alpha 0.52 0.51 0.57 0.54
4
Item type stratified 0.89 0.89 0.90 0.89 Whole form alpha 0.91 0.91 0.92 0.91 – MC alpha 0.88 0.87 0.88 0.87 – CR alpha 0.84 0.84 0.84 0.82 Common/matrix stratified 0.92 0.92 0.92 0.91 – Common alpha 0.90 0.90 0.90 0.90 – Matrix alpha 0.61 0.57 0.63 0.53
8
Item type stratified 0.91 0.91 0.92 0.91 Whole form alpha 0.91 0.91 0.91 0.91 – MC alpha 0.84 0.84 0.84 0.85 – CR alpha 0.87 0.86 0.87 0.85 Common/matrix stratified 0.92 0.91 0.92 0.92 – Common alpha 0.89 0.89 0.89 0.89 – Matrix alpha 0.57 0.56 0.57 0.58
11
Item type stratified 0.91 0.91 0.91 0.91 MC = multiple-choice; CR = constructed-response
Not surprisingly, reliabilities were higher on the full test than on subsets of items (i.e., only multiple-
choice or constructed-response).
7.4 Reporting Subcategories (Domains) Reliability
In subsection 7.3, the reliability coefficients were calculated based on form and item type. Item type
represents just one way of breaking an overall test into subtests. Of even more interest are reliabilities for the
reporting subcategories (domains) within NECAP Science described in 2.1.4. Cronbach’s α coefficients for
subcategories were calculated via the same formula defined at the beginning of this chapter, using just the
items of a given subcategory in the computations. Results are presented in Table 7-5. Once again, as expected,
computed subcategory reliabilities were lower (sometimes substantially so) than overall test reliabilities
because they are based on a subset of items rather than the full test, and interpretations should take this into
account.

Chapter 7—Reliability 54 2008–09 NECAP Science Technical Report
Table 7-5. 2008–09 NECAP Science: Common Item α Coefficients by Grade and Reporting Subcategory Grade Reporting subcategory Possible points α
Physical Science 15 0.67 Earth Space Science 15 0.62 Life Science 15 0.68 4
Inquiry Task 18 0.69 Physical Science 15 0.69 Earth Space Science 15 0.67 Life Science 15 0.72 8
Inquiry Task 18 0.79 Physical Science 15 0.64 Earth Space Science 15 0.59 Life Science 15 0.70 11
Inquiry Task 18 0.80
7.5 Reliability of Achievement Level Categorization
All test scores contain measurement error; thus, classifications based on test scores are also subject to
measurement error. After the 2008–09 NECAP Science achievement levels were specified, each student was
classified into one of the following achievement levels: Substantially Below Proficient, Partially Proficient,
Proficient, or Proficient With Distinction. Empirical analyses were conducted to determine the statistical
accuracy and consistency of the classifications. The following explains the methodologies used to assess the
reliability of classification decisions and presents the results.
Accuracy refers to the extent to which decisions based on test scores match decisions that would have
been made if the scores did not contain any measurement error. It must be estimated because errorless test
scores do not exist.
Consistency measures the extent to which classification decisions based on test scores match the
decisions based on scores from a second, parallel form of the same test. It can be evaluated directly from
actual responses to test items if two complete and parallel forms of the test are given to the same group of
students. In operational test programs, however, such a design is usually impractical. Instead, techniques have
been developed to estimate both the accuracy and consistency of classification decisions based on a single
administration of a test. The Livingston and Lewis (1995) technique was used for 2008–09 NECAP Science
because it is easily adaptable to tests of all kinds, including mixed format tests.
The accuracy and consistency estimates reported in Table 7-6 make use of true scores in the classical
test theory sense. A true score is the score that would be obtained if a test had no measurement error. Of
course, true scores cannot be observed and so must be estimated. In the Livingston and Lewis (1995) method,
estimated true scores are used to categorize students into their true achievement levels.
After various technical adjustments (described in Livingston & Lewis, 1995), a four by four
contingency table of accuracy was created for each grade, where cell [i, j] represented the estimated
proportion of students whose true score fell into achievement level i (where i = 1–4) and observed score into

Chapter 7—Reliability 55 2008–09 NECAP Science Technical Report
achievement level j (where j = 1–4). The sum of the diagonal entries (i.e., the proportion of students whose
true and observed achievement levels matched) signified overall accuracy.
For consistency, true scores were used to estimate the joint distribution of classifications on two
independent, parallel test forms. Following statistical adjustments per Livingston and Lewis (1995), a new
four by four contingency table was created for each grade and populated by the proportion of students who
would be classified into each combination of achievement levels according to the two (hypothetical) parallel
test forms. Cell [i, j] of this table represented the estimated proportion of students whose observed score on
the first form would fall into achievement level i (where i = 1–4) and whose observed score on the second
form would fall into achievement level j (where j = 1–4). The sum of the diagonal entries (i.e., the proportion
of students categorized by the two forms into exactly the same achievement level) signified overall
consistency.
Another way to measure consistency is to use Cohen’s (1960) coefficient κ (kappa), which assesses
the proportion of consistent classifications after removing the proportion that would be expected by chance. It
is calculated using the following formula:
. .
. .
(Observed agreement) - (Chance agreement) ,1 - (Chance agreement) 1
ii i i
i i
i i
i
C C C
C Cκ
−= =
−
∑ ∑∑
where Ci. is the proportion of students whose observed achievement level would be level i (where i = 1–4) on the first hypothetical parallel form of the test; C.i is the proportion of students whose observed achievement level would be level i (where i = 1–4) on the second hypothetical parallel form of the test; and Cii is the proportion of students whose observed achievement level would be level i (where i = 1–4) on both hypothetical parallel forms of the test.
Because κ is corrected for chance, its values are lower than other consistency estimates.
7.6 Results of Accuracy, Consistency, and Kappa Analyses
The accuracy and consistency analyses described in the previous subsection are tabulated in
Appendix J. The appendix includes the accuracy and consistency contingency tables and the overall accuracy
and consistency indices, including kappa.
Accuracy and consistency values conditional upon achievement level are also given in Appendix J.
For these calculations, the denominator is the proportion of students associated with a given achievement
level. For example, a conditional accuracy value of 0.76 for the Partially Proficient achievement level would
indicate that among the students whose true scores placed them in Partially Proficient, 76% would be
expected to be in Partially Proficient when categorized according to their observed score. Similarly, a
consistency value of 0.69 would indicate that 69% of students with observed scores in Partially Proficient

Chapter 7—Reliability 56 2008–09 NECAP Science Technical Report
would be expected to score in the Partially Proficient achievement level again if a second, parallel test form
were used.
For some testing situations, the greatest concern may be decisions around level thresholds. For
example, if a college gave credit to students who achieved Advanced Placement test scores of 4 or 5, but not
1, 2, or 3, one might be interested in the accuracy of the dichotomous decision of below 4 versus 4 or above.
Appendix J provides the accuracy and consistency estimates at each cutpoint as well as false positive and
false negative decision rates for 2008–09 NECAP Science. (False positives are the proportion of students
whose observed scores were above the cut and true scores below the cut. False negatives are the proportion of
students whose observed scores were below the cut and true scores above the cut.)
Livingston and Lewis discuss two versions of the accuracy and consistency tables. A standard version
performs calculations for forms parallel to the form taken. An adjusted version adjusts the results of one form
to match the observed score distribution obtained in the data. The tables reported in Appendix J use the
standard version for two reasons: (1) the unadjusted version can be considered a smoothing of the data,
thereby decreasing the variability of the results; and (2) for results dealing with the consistency of two parallel
forms, the unadjusted tables are symmetric, indicating that the two parallel forms have the same statistical
properties. This second reason is consistent with the notion of forms that are parallel; that is, it is more
intuitive and interpretable for two parallel forms to have the same statistical distribution.
Descriptive statistics relating to the decision accuracy and consistency of the 2008–09 NECAP
Science tests can be derived from Appendix J. Table 7-6 summarizes most of the results at a glance. As with
other types of reliability, it is inappropriate when analyzing the decision accuracy and consistency of a given
test to compare results between grades.
Table 7-6. 2008–09 NECAP Science: Summary of Decision Accuracy (and Consistency) Results
Conditional on level Conditional on cutpoint Grade Overall SBP PP P PWD SBP/PP PP/P P/PWD
4 0.83 (0.76) 0.79 (0.69) 0.79 (0.74) 0.87 (0.81) 0.80 (0.50) 0.95 (0.93) 0.89 (0.85) 0.98 (0.98)8 0.84 (0.77) 0.84 (0.79) 0.82 (0.77) 0.85 (0.75) 0.65 (0.23) 0.92 (0.88) 0.92 (0.89) 1.00 (0.99)11 0.83 (0.76) 0.85 (0.80) 0.81 (0.75) 0.83 (0.73) 0.68 (0.31) 0.92 (0.88) 0.92 (0.89) 0.99 (0.99)
SBP = Substantially Below Proficient; PP = Partially Proficient; P = Proficient; PWD = Proficient With Distinction

Chapter 8—Score Reporting 57 2008–09 NECAP Science Technical Report
Chapter 8. SCORE REPORTING
8.1 Teaching Year Versus Testing Year Reporting
The data used for the NECAP Science reports are the results of the spring 2009 administration of the
NECAP Science test. NECAP Science tests are based on the NECAP Science Assessment Targets, which
cover the grade spans K–4, 5–8, and 9–11. For example, the grade 8 NECAP Science test is based on the
assessment targets of grades five through eight. Because the assessment targets cover grade spans, the state
departments of education determined that assessing science in the spring—as opposed to the fall, when
mathematics, reading, and writing are assessed—would allow students and schools adequate time to cover all
assessment targets through the curriculum and would also avoid a testing overload in the fall. All students
who participated in NECAP Science were represented in testing year reports, because the students took the
test in the school where they completed their learning of the assessment targets for their particular grade span.
8.2 Primary Reports
Measured Progress created four primary reports for the 2008–09 NECAP Science test:
Student Report
Item Analysis Report
School and District Results Report
District Summary Report
With the exception of the Student Report, all reports were available for schools and districts to view
or download on a password secure Web site hosted by Measured Progress. Student level data files were also
available for districts to download. Each of these reports is described in the following subsections. Sample
reports are provided in Appendix K.
8.3 Student Report
The NECAP Student Report is a single-page, two-sided report printed on 8.5 by 11 inch paper. The
front side of the report includes informational text about the design and uses of the assessment. It also
describes the three corresponding sections of the reverse side of the report as well as the achievement levels.
The reverse side provides a complete picture of an individual student’s performance on the NECAP Science
test, divided into three sections. The first section provides the student’s overall performance for science. In
addition to giving the student’s achievement level, it presents the scaled score numerically and in a graphic
that places the score, including its standard error of measurement, within the full range of possible scaled
scores demarcated into the four achievement levels.

Chapter 8—Score Reporting 58 2008–09 NECAP Science Technical Report
The second section of the report displays the student’s achievement level in science relative to the
percentage of students at each achievement level across the school, district, and state.
The third section shows the student’s performance compared to school, district, and statewide
performances in each of the four tested science domains: Physical Science, Earth Space Science, Life Science,
and Scientific Inquiry.
Student performance is reported in the context of possible points; average points earned for the
school, district, and state; and average points earned by students who are minimally proficient on the test
(scaled score of 440, 840, or 1140). The average points earned is reported as a range, because it is the average
of all students who are minimally proficient, plus or minus one standard deviation.
To provide a more complete picture of the inquiry task portion of the science test (Session 3), each
report includes a description of the inquiry task that was administered to all students at that grade. The grade 4
inquiry task always contains a hands-on experiment; the grade 8 inquiry task sometimes contains a hands-on
experiment and sometimes contains a paper and pencil data analysis; and the grade 11 inquiry task always
contains a paper and pencil data analysis.
The NECAP Student Report is confidential and should be kept secure within the school and district.
The Family Educational Rights and Privacy Act (FERPA) requires that access to individual student results be
restricted to the student, the student’s parents/guardians, and authorized school personnel.
8.4 Item Analysis Report
The NECAP Item Analysis Report provides a roster of all the students in each school and their
performances on the common items that will be released to the public. For all grades, the student names and
identification numbers are listed as row headers down the left side of the report. The items are listed as
column headers across the top in the order they appear in the released item documents (not the position in
which they appeared on the test). For each item, seven pieces of information are shown: the released item
number, the science domain, the assessment target code, the depth of knowledge code, the item type, the
correct response letter (for multiple-choice items), and the total possible points. For each student, multiple-
choice items are marked either with a plus sign (+), indicating that the student chose the correct response, or a
letter (from A to D), indicating the incorrect response chosen by the student. For constructed-response items,
the number of points that the student attained is shown. All responses to released items are shown in the
report, regardless of the student’s participation status.
The columns on the right side of the report show the total test results broken into several categories.
The Domain Points Earned column displays points earned by the student relative to total points possible. The
Total Points Earned column is a summary of all points earned and total possible points on the science test.
The last two columns show the scaled score and achievement level for each student. For students who are
reported as “Not Tested,” a code appears in the Achievement Level column to indicate the reason why the
student did not test. The descriptions of these codes are in the legend, located after the last page of data in the

Chapter 8—Score Reporting 59 2008–09 NECAP Science Technical Report
report. Not all items used to compute student scores are included in this report; only those items that have
been released are included. At the bottom of the report, the average percentage correct for each multiple-
choice item and average scores for the short-answer and constructed-response items are shown across the
school, district, and state.
The NECAP Item Analysis Report is confidential and should be kept secure within the school and
district. The FERPA requires that access to individual student results be restricted to the student, the student’s
parents/guardians, and authorized school personnel.
8.5 School and District Results Reports
The NECAP School Results Report and the NECAP District Results Report consist of three parts: the
grade level summary report (page 2), the content area results (page 3), and the disaggregated content area
results (page 4).
The grade level summary report provides a summary of participation in the NECAP Science test and
a summary of NECAP Science results. The participation section, on the top half of the page, gives the number
and percentage of students who were enrolled on or after May 12, 2009. The total number of students enrolled
is defined as the number of students tested plus the number of students not tested.
Because students who were not tested did not participate, average school scores were not affected by
nontested students. These students were included in the calculation of the percentage of students participating
but not in the calculation of scores. For students who participated in some but not all sessions of the NECAP
Science test, overall raw and scaled scores were reported. These reporting decisions were made to support the
requirement that all students participate in the NECAP testing program.
Data are provided for the following groups of students, who may not have completed the entire
NECAP Science test:
Alternate assessment—Students in this category completed an alternate assessment for the
2008–09 school year.
Withdrew after May 12—Students withdrawing from a school after May 12, 2009, may have
taken some sessions of the NECAP Science test prior to their withdrawal from the school.
Enrolled after May 12—Students enrolling in a school after May 12, 2009, may not have had
adequate time to participate fully in all sessions of the NECAP Science test.
Special consideration—Schools received state approval for special consideration for an
exemption on all or part of the NECAP Science test for any student whose circumstances were
not described by the previous categories but for whom the school determined that taking the
NECAP Science test would not be possible.
Other—Occasionally, students did not complete the NECAP Science test for reasons other than
those listed. These “other” categories were considered not state approved.

Chapter 8—Score Reporting 60 2008–09 NECAP Science Technical Report
The results section, on the bottom half of the page, shows the number and percentage of students
performing at each achievement level in science across the school, district, and state. In addition, a mean
scaled score is provided across school, district, and state levels. For the district version of this report, the
school information is blank.
The content area results page provides information on performance in the four tested science domains
(Physical Science, Earth Space Science, Life Science, and Scientific Inquiry). The purpose of this section is to
help schools determine the extent to which their curricula are effective in helping students achieve the
particular standards and benchmarks contained in the NECAP Science Assessment Targets. Information about
the content area for school, district, and state includes
the total number of students enrolled, not tested for a state approved reason, not tested for another
reason, and tested;
the total number and percentage of students at each achievement level (based on the number in
the Tested column); and
the mean scaled score.
Information about each science domain includes the following:
The total possible points for that domain. In order to provide as much information as possible for
each domain, the total number of points includes both the common items used to calculate scores
and additional items in each category used for equating the test from year to year.
A graphic display of the percentage of total possible points for the school, state, and district. In
this graphic display, symbols represent school, district, and state performance. In addition, a line
symbolizes the standard error of measurement. This statistic indicates how much a student’s score
could vary if the student were examined repeatedly with the same test (assuming that no learning
were to occur between test administrations).
The disaggregated content area results pages present the relationship between performance and
student reporting variables in science across school, district, and state levels. The report shows the number of
students categorized as enrolled, not tested for a state approved reason, not tested for another reason, and
tested. The report also provides the number and percentage of students within each of the four achievement
levels and the mean scaled score by each reporting category.
The list of student reporting categories is as follows:
All students
Gender
Primary race/ethnicity
Limited English proficiency (LEP) status

Chapter 8—Score Reporting 61 2008–09 NECAP Science Technical Report
Individualized education program (IEP)
Socioeconomic status (SES)
Migrant
Title I
504 plan
The data for achievement levels and mean scaled score are based on the number shown in the Tested
column. Reporting categories data were provided by information coded on the students’ answer booklets by
teachers and/or records linked to the student labels. Because performance is being reported by categories that
can contain relatively low numbers of students, school personnel are advised, under FERPA guidelines, to
treat these pages confidentially.
It should be noted that for New Hampshire and Vermont, no data were reported for the 504 plan. In
addition, for Vermont, no data were reported for Title I.
8.6 District Summary Reports
The NECAP District Summary Report provides details on student performance for all grade levels of
NECAP Science tested in the district. The purpose of the report is to help districts determine the extent to
which their schools and students achieve the particular standards and benchmarks contained in the NECAP
Science Assessment Targets. The NECAP District Summary Report contains no individual school data. The
information provided includes
the total number of students enrolled, not tested for a state approved reason, not tested for another
reason, and tested;
the total number and percentage of students at each achievement level (based on the number in
the Tested column); and
the mean scaled score.
8.7 Decision Rules
To ensure that reported results for the 2008–09 NECAP Science test are accurate relative to collected
data and other pertinent information, a document that delineates analysis and reporting rules was created.
These decision rules were observed in the analyses of test data and in reporting the test results. Moreover,
these rules served as the main reference for quality assurance checks.
The decision rules document used for reporting results of the May 2009 administration of the NECAP
Science test is found in Appendix L.
The first set of rules pertains to general issues in reporting scores. Each issue is described, and
pertinent variables are identified. The actual rules applied are described by the way they impact analyses and

Chapter 8—Score Reporting 62 2008–09 NECAP Science Technical Report
aggregations and their specific impact on each of the reports. The general rules are further grouped into issues
pertaining to test items, school type, student exclusions, and number of students for aggregations.
The second set of rules pertains to reporting student participation. These rules describe which students
were counted and reported for each subgroup in the student participation report.
8.8 Quality Assurance
Quality assurance measures are embedded throughout the entire process of analysis and reporting.
The data processor, data analyst, and psychometrician assigned to work on the NECAP implement quality
control checks of their respective computer programs and intermediate products. Moreover, when data are
handed off to different functions within the Psychometrics and Research and Data Services and Static
Reporting Departments, the sending function verifies that the data are accurate before handoff. When a
function receives a data set, the first step is to verify the data for accuracy.
Another type of quality assurance measure is parallel processing. Students’ scaled scores for science
are assigned by a psychometrician through a process of equating and scaling. The scaled scores are also
computed by a data analyst to verify that scaled scores and corresponding achievement levels are assigned
accurately. Respective scaled scores and achievement levels assigned are compared across all students for
100% agreement. Different exclusions assigned to students that determine whether each student receives
scaled scores and/or is included in different levels of aggregation are also parallel processed. Using the
decision rules document, two data analysts independently write a computer program that assigns students’
exclusions. For each grade, the exclusions assigned by each data analyst are compared across all students.
Only when 100% agreement is achieved can the rest of the data analysis be completed.
The third aspect of quality control involves the procedures implemented by the quality assurance
group to check the veracity and accuracy of reported data. Using a sample of schools and districts, the quality
assurance group verifies that reported information is correct. The step is conducted in two parts: (1) verify
that the computed information was obtained correctly through appropriate application of different decision
rules, and (2) verify that the correct data points populate each cell in the NECAP Science reports. The
selection of sample schools and districts for this purpose is very specific and can affect the success of the
quality control efforts. Two sets of samples are selected, though they may not be mutually exclusive.
The first set includes those that satisfy the following criteria:
One school district
Two school district
Multischool district

Chapter 8—Score Reporting 63 2008–09 NECAP Science Technical Report
The second set of samples includes districts or schools that have unique reporting situations, as
indicated by decision rules. This set is necessary to check that each rule is applied correctly. The second set
includes the following criteria:
Private school
Small school that receives no school report
Small district that receives no district report
District that receives a report but all schools are too small to receive a school report
School with excluded (not tested) students
School with homeschooled students
The quality assurance group uses a checklist to implement its procedures. After the checklist is
completed, sample reports are circulated for psychometric checks and program management review. The
appropriate sample reports are then presented to the client for review and signoff.


Chapter 9—Validity 65 2008–09 NECAP Science Technical Report
Chapter 9. VALIDITY Because the interpretations of test scores are evaluated for validity, and not the test itself, the purpose
of the 2008–09 NECAP Science Technical Report is to describe several technical aspects of the tests in
support of score interpretations (AERA et al., 1999). Each chapter contributes an important component to the
investigation of score validation: test development and design; test administration; scoring, scaling, and
equating; item analyses; reliability; and score reporting.
The NECAP Science tests are based on, and aligned with, the content standards and performance
indicators in the NECAP Science Assessment Targets. Achievement inferences are meant to be useful for
program and instructional improvement, and as a component of school accountability.
Standards for Educational and Psychological Testing (AERA et al., 1999) provides a framework for
describing sources of evidence that should be considered when evaluating validity. These sources include
evidence on the following five general areas: test content, response processes, internal structure,
consequences of testing, and relationship to other variables. Although each of these sources may speak to a
different aspect of validity, they are not distinct types of validity. Instead, each contributes to a body of
evidence about the comprehensive validity of score interpretations.
A measure of test content validity is to determine how well the test tasks represent the curriculum and
standards for each grade level. This is informed by the item development process, including how test
blueprints and test items align with the curriculum and standards. Validation through the content lens was
extensively described in Chapter 2. Item alignment with content standards; item bias; sensitivity and content
appropriateness review processes; adherence to the test blueprint; use of multiple item types; use of
standardized administration procedures, with accommodated options for participation; and appropriate test
administration training are all components of validity evidence based on test content.
All NECAP Science test questions were aligned by educators with specific content standards and
underwent several rounds of review for content fidelity and appropriateness. Items were presented to students
in multiple formats (multiple-choice, short-answer, and constructed-response). Finally, tests were
administered according to mandated standardized procedures, with allowable accommodations, and all test
coordinators and administrators were required to familiarize themselves with and adhere to all of the
procedures outlined in the NECAP Principal/Test Coordinator and Test Administrator Manuals.
The scoring information in Chapter 4 described both the steps taken to train and monitor hand scorers
and the quality control procedures related to scanning and machine scoring. Additional studies might be
helpful for evidence on student response processes. For example, think-aloud protocols could be used to
investigate students’ cognitive processes when confronting test items.
Evidence on internal structure was extensively detailed in the discussions of item analyses, scaling,
and reliability in Chapters 5, 6, and 7. Technical characteristics of the internal structure of the tests were
presented in terms of classical item statistics (item difficulty and item-test correlation), differential item

Chapter 9—Validity 66 2008–09 NECAP Science Technical Report
functioning (DIF) analyses, a variety of reliability coefficients, standard errors of measurement (SEMs),
multidimensionality hypothesis testing and effect size estimation, and item response theory (IRT) parameters
and procedures. In general, item difficulty indices were within acceptable and expected ranges; very few
items were answered correctly at near chance or near perfect rates. Similarly, the positive discrimination
indices indicated that students who performed well on individual items tended to perform well overall.
Evidence on the consequences of testing was addressed in the information on scaled scores and
reporting in Chapters 6 and 8 and in the Guide to Using the 2009 NECAP Science Reports, which is a separate
document. Each of these speaks to efforts undertaken to provide the public with accurate and clear test score
information. Scaled scores simplify results reporting across content areas, grade levels, and successive years.
Achievement levels give reference points for mastery at each grade level—another useful and simple way to
interpret scores. Several different standard reports were provided to stakeholders. Evidence on the
consequences of testing could be supplemented with broader research on the NECAP Science test’s impact on
student learning.
9.1 Questionnaire Data
A measure of external validity was provided by comparing student performance with answers to a
questionnaire administered at the end of the test. The number of questions to which students responded was
12, 16, and 19, respectively, in grades 4, 8, and 11. Most of the questions were designed to gather information
about students and their study habits; however, a subset could be utilized in the test of external validity. Two
questions were expected to correlate most highly with student performance on the NECAP Science tests. To
the extent that the answers to those questions did correlate with student performance in the anticipated
manner, the external validity of score interpretations was confirmed.
With minor variations by grade, Question No. 8 in grade 4, Question No. 9 in grade 8, and Question
No. 8 in grade 11 read as follows:
How often do you do science experiments or inquiry tasks in your class like the one that you did on
this science test?
A. one or more times each week
B. once/a few times a month
C. a few times a year
D. never or almost never
It might be anticipated that students who did such activities more often would have higher average
scaled scores and achievement level designations than students who did them less often. As can be seen in
Table 9-1, with the exception of the students who responded “A,” there was a very slight decreasing trend in

Chapter 9—Validity 67 2008–09 NECAP Science Technical Report
scores of students across responses. Overall, the relationship between responses to the question and
performance on the science test is too weak to draw meaningful inferences about validity.
Table 9-1. 2008–09 NECAP Science: Average Scaled Scores, and Counts and Percentages Within Performance Levels, of Responses to Science Inquiry Item* on Student Questionnaire
Grade Response Number
of responses
% of responses
Avg SS
N SBP
% SBP
N PP
% PP
N P
% P
N PWD
% PWD
(Blank) 3,519 12 438 491 14 1,418 40 1,589 45 21 1 A 9,253 30 439 1,247 13 3,537 38 4,432 48 37 0 B 8,583 28 440 905 11 3,202 37 4,432 52 44 1 C 6,434 21 439 792 12 2,526 39 3,094 48 22 0
4
D 2,696 9 438 357 13 1,147 43 1,186 44 6 0 (Blank) 3,692 11 830 1,515 41 1,528 41 631 17 18 0
A 8,382 25 833 2,381 28 4,152 50 1,809 22 40 0 B 15,932 47 834 3,793 24 8,304 52 3,773 24 62 0 C 3,792 11 833 1,106 29 1,838 48 823 22 25 1
8
D 1,934 6 829 868 45 846 44 218 11 2 0 (Blank) 4,584 14 1130 2,050 45 1,734 38 780 17 20 0
A 2,650 8 1133 916 35 1,106 42 608 23 20 1 B 7,656 23 1135 1,767 23 3,649 48 2,175 28 65 1 C 8,089 25 1134 2,046 25 4,042 50 1,940 24 61 1
11
D 9,617 30 1133 3,323 35 4,418 46 1,811 19 65 1 *Question: How often do you do science experiments or inquiry tasks in your class like the one that you did on this science test? Answer options: A. one or more times each week; B. once/a few times a month; C. a few times a year; D. never or almost never SS = scaled score; SBP = Substantially Below Proficient; PP = Partially Proficient; P = Proficient; PWD = Proficient With Distinction
With minor variations by grade, Question No. 11 in grade 4, Question No. 13 in grade 8, and
Question No. 15 in grade 11 read as follows:
How often do you do have science homework?
A. every day B. a few times a week C. a few times a month D. I usually don’t have homework in science E. I am not taking science this year (grade 11 only)
In this case, there is a discernable trend for grade 11, where students who reported having more
science homework performed better on the test. For grades 4 and 8, however, there is little or no consistent
relationship between responses to the question and performance on the test, as can be seen in Table 9-2.

Chapter 9—Validity 68 2008–09 NECAP Science Technical Report
Table 9-2. 2008–09 NECAP Science: Average Scaled Scores, and Counts and Percentages Within Performance Levels, of Responses to Science Homework Item* on Student Questionnaire
Grade Response Number
of responses
% of responses
Avg SS
N SBP
% SBP
N PP
% PP
N P
% P
N PWD
% PWD
(Blank) 3,767 12 438 540 14 1,535 41 1,671 44 21 1 A 550 2 433 181 33 207 38 160 29 2 0 B 3,340 11 437 562 17 1,380 41 1,390 42 8 0 C 5,695 19 440 578 10 2,144 38 2,943 52 30 1
4
D 17,133 56 440 1,931 11 6,564 38 8,569 50 69 0 (Blank) 3,733 11 830 1,546 41 1,541 41 627 17 19 1
A 5,325 16 833 1,518 29 2,693 51 1,088 20 26 0 B 16,699 50 834 4,160 25 8,576 51 3,890 23 73 0 C 4,686 14 834 1,194 25 2,333 50 1,138 24 21 0
8
D 3,289 10 830 1,245 38 1,525 46 511 16 8 0 (Blank) 4,038 12 1130 1,855 46 1,478 37 685 17 20 0
A 6,083 19 1136 1,119 18 2,826 46 2,057 34 81 1 B 12,854 39 1135 2,832 22 6,449 50 3,466 27 107 1 C 3,292 10 1133 1,117 34 1,507 46 651 20 17 1 D 2,707 8 1130 1,300 48 1,140 42 262 10 5 0
11
E 3,622 11 1129 1,879 52 1,549 43 193 5 1 0 *Question: How often do you have science homework? Answer options: A. every day; B. a few times a week; C. a few times a month; D. I usually don't have homework in science; E. I am not taking science this year SS = scaled score; SBP = Substantially Below Proficient; PP = Partially Proficient; P = Proficient; PWD = Proficient With Distinction
See Appendix M for a copy of the questionnaire and complete data comparing questionnaire items
and test performance.
9.2 Validity Studies Agenda
The remaining part of this chapter describes further studies of validity that could enhance the
investigations that have already been performed. The proposed areas of validity to be examined fall into four
categories: external validity, convergent and discriminant validity, structural validity, and procedural validity.
9.2.1 External Validity
In the future, investigations of external validity could involve targeted examination of the variables
that correlate with NECAP Science results. For example, data could be collected on the grades of each student
who took the NECAP Science tests. As with the analysis of student questionnaire data, crosstabulations of
NECAP achievement levels and assigned grades could be created. The average NECAP scaled score could
also be computed for each possible assigned grade (A, B, C, etc.). NECAP scores could also be correlated
with other appropriate classroom tests in addition to final grades.
Further evidence of external validity might come from correlating NECAP Science scores with scores
on another standardized test, such as the Iowa Test of Basic Skills.

Chapter 9—Validity 69 2008–09 NECAP Science Technical Report
9.2.2 Convergent and Discriminant Validity
The concepts of convergent and discriminant validity were defined by Campbell and Fiske (1959) as
specific types of validity that fall under the umbrella of construct validity. Convergent validity is the notion
that measures or variables that are intended to align should actually be aligned in practice. Discriminant
validity, on the other hand, is the idea that measures or variables that are intended to differ should not be too
highly correlated. Evidence for validity comes from examining whether the correlations among variables are
as expected in direction and magnitude.
Campbell and Fiske (1959) introduced the study of different traits and methods as the means of
assessing convergent and discriminant validity. Traits refer to the constructs that are being measured (e.g.,
mathematical ability), and methods are the instruments of measuring them (e.g., a mathematics test or grade).
To utilize the framework of Campbell and Fiske, it is necessary that more than one trait and more than one
method be examined. Analysis is performed through the multitrait/multimethod matrix, which gives all
possible correlations of the different combinations of traits and methods. Campbell and Fiske defined four
properties of the multitrait/multimethod matrix that serve as evidence of convergent and discriminant validity:
The correlation among different methods of measuring the same trait should be sufficiently
different from zero. For example, scores on a science test and grades in a science class should be
positively correlated.
The correlation among different methods of measuring the same trait should be higher than that
of different methods of measuring different traits. For example, scores on a science test and
grades in a science class should be more highly correlated than scores on a science test and grades
in a reading class.
The correlation among different methods of measuring the same trait should be higher than the
same method of measuring different traits. For example, scores on a science test and grades in a
science class should be more highly correlated than scores on a science test and scores on an
analogous reading test.
The pattern of correlations should be similar across comparisons of different traits and methods.
For example, if the correlation between test scores in science and mathematics is higher than the
correlation between test scores in science and writing, it is expected that the correlation between
grades in science and mathematics would also be higher than the correlation between grades in
science and writing.
For NECAP Science, convergent and discriminant validity could be examined by constructing a
multitrait/multimethod matrix and analyzing these four pieces of evidence. The traits examined would be
science versus mathematics, reading, and writing; different methods would include respective NECAP scores
and such variables as grades, teacher judgments, and scores on another standardized test.

Chapter 9—Validity 70 2008–09 NECAP Science Technical Report
9.2.3 Structural Validity
Though the previous types of validity examine the concurrence between different measures of the
same content area, structural validity focuses on the relationship between strands within a content area, thus
supporting content validity. Standardized tests are carefully designed to ensure that all appropriate strands of a
content area are adequately covered in the test, and structural validity is the degree to which these different
strands are correlated in the intended manner. For instance, it is desired that performance on different strands
of a content area be positively correlated; however, as these strands are designed to measure distinct
components of the content area, it is reasonable to expect that each strand would contribute a unique
component to the test. Additionally, it is desired that the correlation between different item types (multiple-
choice, short-answer, and constructed-response) of the same content area be positive.
As an example, an analysis of NECAP Science structural validity would investigate the correlation of
performance in Physical Science with that in Earth Space Science and Life Science. The concordance
between performance on multiple-choice items and constructed-response items would also be examined. Such
a study would address the consistency of NECAP Science tests within each grade. In particular, the
dimensionality analyses of Chapter 5 could be expanded to include confirmatory analyses addressing these
concerns.
9.2.4 Procedural Validity
As mentioned earlier, the NECAP Principal/Test Coordinator and Test Administrator Manuals
delineated the procedures to which all NECAP Science test coordinators and administrators were required to
adhere. A study of procedural validity would provide a comprehensive documentation of the procedures that
were followed throughout the NECAP Science administration. The results of the documentation would then
be compared to the manuals, and procedural validity would be confirmed to the extent that the two were in
alignment. Evidence of procedural validity is important because it verifies that the actual administration
practices were in accord with the intentions of the design.
Possible instances where discrepancies can exist between design and implementation include the
following: a teacher spirals test forms incorrectly within a classroom; cheating among students occurs; or
answer documents are scanned incorrectly. These are examples of administration error. A study of procedural
validity involves capturing any administration errors and presenting them within a cohesive document for
review.

References 71 2008–09 NECAP Science Technical Report
REFERENCES Allen, Mary J. & Yen, Wendy M. (1979). Introduction to Measurement Theory. Belmont, CA: Wadsworth,
Inc.
American Educational Research Association, American Psychological Association, & National Council on Measurement in Education. (1999). Standards for educational and psychological testing. Washington, DC: American Educational Research Association.
Baker, F.B., & Kim, S-H.(2004). Item Response Theory: parameter estimation techniques (2nd ed.). New York: Marcel Dekker, Inc.
Brown, F. G. (1983). Principles of educational and psychological testing (3rd ed.). Fort Worth, TX: Holt, Rinehart and Winston.
Campbell, D. T., & Fiske, D. W. (1959). Convergent and discriminant validation by the multitrait-multimethod matrix. Psychological Bulletin, 56, 81–105.
Cohen, J. (1960). A coefficient of agreement for nominal scales. Educational and Psychological Measurement, 20, 37–46.
Cronbach, L. J. (1951). Coefficient alpha and the internal structure of tests. Psychometrika, 16, 297–334.
Dorans, N. J., & Holland, P. W. (1993). DIF detection and description. In P. W. Holland & H. Wainer (Eds.) Differential item functioning (pp. 35–66). Hillsdale, NJ: Lawrence Erlbaum Associates.
Dorans, N. J., & Kulick, E. (1986). Demonstrating the utility of the standardization approach to assessing unexpected differential item performance on the Scholastic Aptitude Test. Journal of Educational Measurement, 23, 355–368.
Draper, N. R., & Smith, H. (1998). Applied regression analysis (3rd ed.). New York: John Wiley & Sons.
Feldt, L. S., & Brennan, R. L. (1989). Reliability. In R. L. Linn (Ed.) Educational measurement (3rd ed.) (pp. 105–146). New York: Macmillan.
Hambleton, R. K., & Swaminathan, H. (1985). Item response theory: Principles and applications. Boston, MA: Kluwer Academic Publishers.
Hambleton, R. K., Swaminathan, H., & Rogers, H. J. (1991). Fundamentals of item response theory. Newbury Park, CA: Sage Publications.
Hambleton, R. K., & van der Linden, W. J. (1997). Handbook of modern item response theory. New York: Springer-Verlag.
Joint Committee on Testing Practices. (1988). Code of fair testing practices in education. Washington, DC: National Council on Measurement in Education.
Livingston, S. A., & Lewis, C. (1995). Estimating the consistency and accuracy of classifications based on test scores. Journal of Educational Measurement, 32, 179–197.
Lord, F. M., & Novick, M. R. (1968). Statistical theories of mental test scores. Reading, MA: Addison-Wesley.

References 72 2008–09 NECAP Science Technical Report
Muraki, E., & Bock, R. D. (2003). PARSCALE 4.1. Lincolnwood, IL: Scientific Software International.
Petersen, N.S., Kolen, M.J., & Hoover, H.D. (1989). Scaling, norming, and equating. In R.L. Linn (Ed.), Educational measurement (3rd ed., pp. 221-262).
Stocking, M. L., & Lord, F. M. (1983). Developing a common metric in item response theory. Applied Psychological Measurement, 7, 201-210
Stout, W. F. (1987). A nonparametric approach for assessing latent trait dimensionality. Psychometrika, 52, 589–617.
Stout, W. F., Froelich, A. G., & Gao, F. (2001). Using resampling methods to produce an improved DIMTEST procedure. In A. Boomsma, M. A. J. van Duign, & T. A. B. Snijders (Eds.) Essays on item response theory (pp. 357–375). New York: Springer–Verlag.
Zhang, J., & Stout, W. F. (1999). The theoretical DETECT index of dimensionality and its application to approximate simple structure. Psychometrika, 64, 213–249.

Appendices 73 2008–09 NECAP Science Technical Report
APPENDICES

Appendix A—Guidelines for the Development of Science Inquiry Tasks 1 2008–09 NECAP Science Technical Report
Appendix A—GUIDELINES FOR THE DEVELOPMENT OF SCIENCE INQUIRY TASKS

Appendix A—Guidelines for the Development of Science Inquiry Tasks 3 2008–09 NECAP Science Technical Report
Created in Partnership by the New Hampshire, Rhode Island, and Vermont Departments of
Education
NECAP Science Assessment
Guidelines for the
Development of Science Inquiry Tasks
February 2008

Appendix A—Guidelines for the Development of Science Inquiry Tasks 4 2008–09 NECAP Science Technical Report
Introduction: Inquiry in the NECAP Science Assessment Defining the NECAP Science Assessment Inquiry Task Focus – The Science Inquiry Task at every grade level should be rich and engaging. The task may be an experimental question or observational question – it is the quality of the task that is most important. Regardless of the type of task, all Four Broad Areas of Inquiry as defined in the NECAP Schema for Assessing Scientific Inquiry (see column headings in the table on page 6), will be assessed. The task should flow from beginning to end in a purposeful way that allows students to make connections, express their ideas, and provide evidence of scientific thinking. Design – Inquiry Tasks should be rooted in one or more NECAP Science Assessment Targets (one of which should have INQ code) and over time should address a variety of content domains. For every task at grades four and eight there must be scoreable components from each of the Four Broad Areas of Inquiry. At grade 11, while the focus of the task may be on constructs in the Area of Developing and Evaluating Explanations (column 4), scoreable items from each of the other three Broad Areas of Inquiry should also be included. Task development will be guided by Guidelines for the Development of Science Inquiry Tasks (GDIT). For each item within a Science Inquiry Task, the developer must identify the Depth of Knowledge (DOK), the Inquiry Construct number, score points, and key elements (scoring notes). Over time, all Inquiry Constructs should be addressed at each grade level. See the Appendix for additional information about the Inquiry Task development process. Goal – Science Inquiry Tasks will engage students in a range of Depth of Knowledge experiences up to and including strategic thinking (DOK 3). Individual tasks may look different, but each should focus on providing insight into how students engage in scientific thinking. The goal is to encourage the meaningful inclusion of inquiry in classrooms at all levels. Applying the Guidelines of the Science NECAP Assessment Task in the Classroom Background – The first version of Guidelines for Development of Science Inquiry Tasks was originally created by the Science Specialists from the New Hampshire, Rhode Island, and Vermont Departments of Education to facilitate and refine the development of Inquiry Tasks for the NECAP Science Assessment. It became clear that such a tool would be useful to teachers and local science specialists to guide them in the development of similar tasks for classroom use at all levels. The State Science Specialists have collaborated on this version of GDIT to help educators understand and employ the constructs of the Four Broad Areas of Inquiry as they design or evaluate inquiry tasks for classroom instruction and assessment. Focus - Classroom inquiry tasks should be relevant, engaging and meaningful learning experiences for students. The classroom inquiry tasks included on the state Department of Education website are examples of the kinds of tasks found in the NECAP Science Assessment. In the classroom any inquiry activity should provide regular opportunities for students to experience the science process as defined in the NECAP Schema for Assessing Scientific Inquiry (see page 4). Analysis of student performance on classroom inquiry tasks can inform instruction by providing data on student proficiencies within the constructs across the Four Broad Areas of Inquiry. Classroom inquiry tasks might be used as a component of local assessment or as a classroom summative assessment for a specific unit.

Appendix A—Guidelines for the Development of Science Inquiry Tasks 5 2008–09 NECAP Science Technical Report
Design - While there are many ways to design inquiry experiences and an assessment for the classroom, GDIT provides a framework for the development of rich performance assessments that are aligned with this component of the NECAP Science Assessment. GDIT offers the necessary details for teachers to develop classroom inquiry tasks that are similar in structure to the NECAP Science Inquiry Tasks. Each classroom inquiry task will include elements from each of the Four Broad Areas of Inquiry, and address specific constructs within each Broad Area. Classroom inquiry tasks can span a class period, a few days or the length of a unit. Classroom inquiry tasks related to units of study provide opportunities for students to become familiar with the format of the NECAP Science Inquiry Tasks and will help to prepare them for the state assessment Goals - The main goals of Guidelines for Development of Science Inquiry Tasks are to help educators:
• encourage the inclusion of engaging and relevant inquiry experiences in classrooms that contribute to increasing the science literacy of the citizens of New Hampshire, Rhode Island and Vermont;
• develop, evaluate and implement rich science tasks that allow students to gain skills across the
Four Broad Areas of Inquiry;
• understand the process and parameters used in the development of Inquiry Tasks for the NECAP Science Assessment;
• provide opportunities for students to become familiar with the format and requirements of the
NECAP Science Inquiry Tasks.

Appendix A—Guidelines for the Development of Science Inquiry Tasks 6 2008–09 NECAP Science Technical Report
NECAP Science Inquiry Constructs for all Grade Levels
NECAP Science Schema for Assessing Scientific Inquiry (with DOK levels for constructs)
Broad Areas of Inquiry to be
Assessed
Formulating Questions & Hypothesizing
Planning and Critiquing of Investigations
Conducting Investigations
Developing and Evaluating Explanations
Constructs for each Broad
Area of Inquiry (including
intended DOK Ceiling Levels, based on Webb
Depth of Knowledge Levels for
Science – see also Section II)
Inquiry Constructs answer the
question: What is it about the broad area of
Inquiry that we want students to know and be
able to do?
1. Analyze information from observations, research, or experimental data for the purpose of formulating a question, hypothesis, or prediction: (DOK 3) 1a. Appropriate for answering with scientific investigation 1b. For answering using scientific knowledge 2. Construct coherent argument in support of a question, hypothesis, prediction (DOK 2 or 3 depending on complexity of argument) 3. Make and describe observations in order to ask questions, hypothesize, make predictions related to topic (DOK 2)
4. Identify information/evidence that needs to be collected in order to answer the question, hypothesis, prediction (DOK 2 – routine; DOK 3 non-routine/ more than one dependant variable) 5. Develop an organized and logical approach to investigating the question, including controlling variables (DOK 2 – routine; DOK 3 non-routine) 6. Provide reasoning for appropriateness of materials, tools, procedures, and scale used in the investigation (DOK 2)
7. Follow procedures for collecting and recording qualitative or quantitative data, using equipment or measurement devices accurately (DOK 1 – use tools; routine procedure; DOK 2 – follow multi-step procedures; make observations) 8. Use accepted methods for organizing, representing, and manipulating data (DOK 2 – compare data; display data) 9. Collect sufficient data to study question, hypothesis, or relationships (DOK 2 – part of following procedures) 10. Summarize results based on data (DOK 2)
11. Analyze data, including determining if data are relevant, artifact, irrelevant, or anomalous (DOK 2 – specify relationships between facts; ordering, classifying data) 12. Use evidence to support and justify interpretations and conclusions or explain how the evidence refutes the hypothesis (DOK 3) 13. Communicate how scientific knowledge applies to explain results, propose further investigations, or construct and analyze alternative explanations (DOK 3)

Appendix A—Guidelines for the Development of Science Inquiry Tasks 7 2008–09 NECAP Science Technical Report
NECAP Science Assessment Inquiry Task Flow Administration of each Science Inquiry Performance Task (Grades 4 and 8) should follow the sequence below:
Prior to start of Session 3:
• Set up materials • Group students
Standard Flow of NECAP Science Inquiry Performance Tasks: (Grades 4 and 8)
1. Directions read aloud by Test Administrator (basic info) 2. Scenario read aloud by Test Administrator (context) 3. Description of the materials and/or model explained by Test Administrator. Students make a
prediction individually 4. Students conduct investigation with partner 5. Students clean up kits/experiment with partner 6. Students return to desks with their own Task Booklet to work individually 7. Test Administrator distributes Student Answer Booklets to students 8. Students copy data from Task Booklet to Student Answer Booklet (non-scored) 9. Students answer eight (8) scored questions in Student Answer Booklet
A. For analyzing the prediction, there will be Yes/No check boxes with space for the narrative below. B. At grades 4 and 8, the question where students must graph data will have a hard-coded grid (1/2- inch squares) in the answer box with lines for x and y axis labels as well as a title. At grade 11, use 1/4- inch squares. .
Standard Flow of NECAP Science Inquiry Data Analysis Tasks: (Grades 8 and 11)
1. Test Administrator distributes Student Answer Booklets to students
2. Directions read aloud by Test Administrator (basic info)
3. Scenario read aloud by Test Administrator (task context)
4. Students answer questions related to the scenario and complete data analysis in the Student Answer Booklet.
5. Items will require high school students to consider the Inquiry Constructs in relation to a selected data set.
6. Upon completion of the task students sit quietly and read until dismissal.
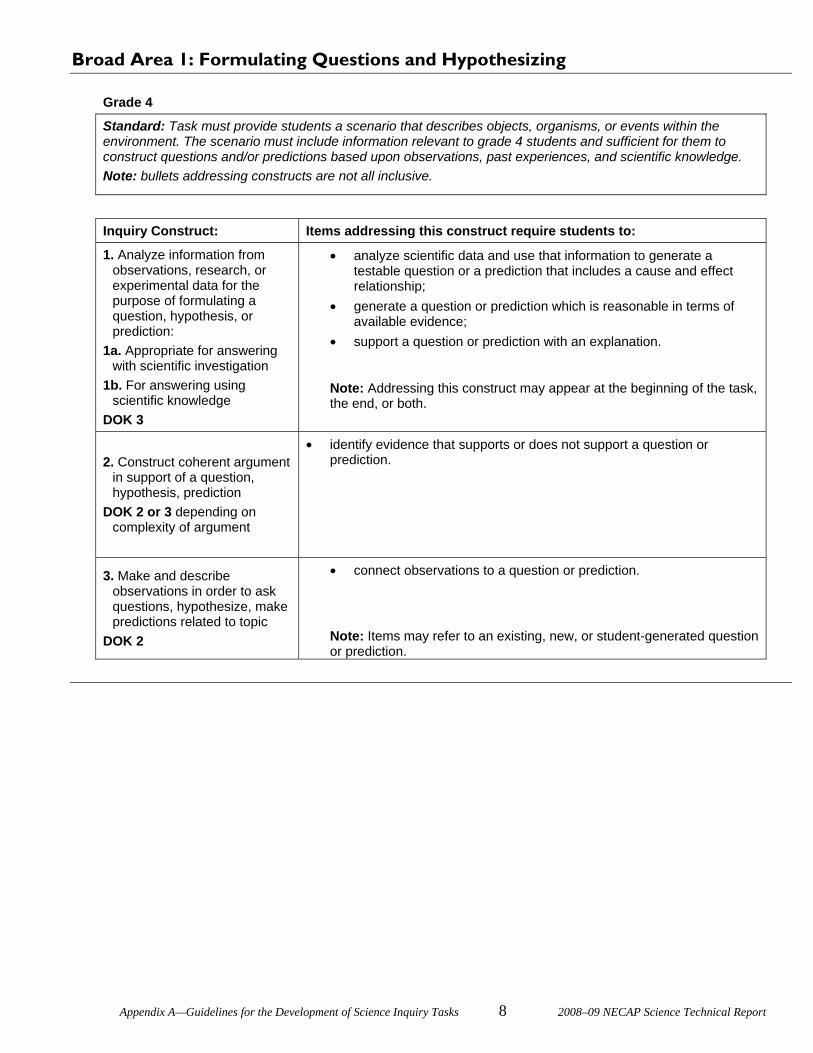
Appendix A—Guidelines for the Development of Science Inquiry Tasks 8 2008–09 NECAP Science Technical Report
Broad Area 1: Formulating Questions and Hypothesizing
Grade 4
Standard: Task must provide students a scenario that describes objects, organisms, or events within the environment. The scenario must include information relevant to grade 4 students and sufficient for them to construct questions and/or predictions based upon observations, past experiences, and scientific knowledge. Note: bullets addressing constructs are not all inclusive.
Inquiry Construct: Items addressing this construct require students to:
1. Analyze information from observations, research, or experimental data for the purpose of formulating a question, hypothesis, or prediction:
1a. Appropriate for answering with scientific investigation
1b. For answering using scientific knowledge
DOK 3
• analyze scientific data and use that information to generate a testable question or a prediction that includes a cause and effect relationship;
• generate a question or prediction which is reasonable in terms of available evidence;
• support a question or prediction with an explanation.
Note: Addressing this construct may appear at the beginning of the task, the end, or both.
2. Construct coherent argument in support of a question, hypothesis, prediction
DOK 2 or 3 depending on complexity of argument
• identify evidence that supports or does not support a question or prediction.
3. Make and describe observations in order to ask questions, hypothesize, make predictions related to topic
DOK 2
• connect observations to a question or prediction.
Note: Items may refer to an existing, new, or student-generated question or prediction.

Appendix A—Guidelines for the Development of Science Inquiry Tasks 9 2008–09 NECAP Science Technical Report
Broad Area 2: Planning and Critiquing of Investigations
Grade 4
Standard: Task requires students to plan or analyze a simple experiment based upon questions or predictions derived from the scenario. The experiment and related items should emphasize fairness in its design. Note: The words “procedure” and “plan” are synonymous.
Inquiry Construct: Items addressing this construct require students to:
4. Identify information and/or evidence that needs to be collected in order to answer the question, hypothesis, prediction
DOK 2 (routine) DOK 3 (non-routine or more
than one dependant variable)
• identify the types of evidence that should be gathered to answer the question;
• design an appropriate format, such as data tables or charts, for recording data.
Note: These items could appear at the end of the task.
5. Develop an organized and logical approach to investigating the question, including controlling variables
DOK 2 (routine) DOK 3 (non-routine)
• develop a procedure to gather sufficient evidence (including multiple trials) to answer the question or test the prediction;
• develop a procedure that lists steps logically and sequentially; • develop a procedure that changes one variable at a time. Note: These items could appear at the end of the task. Use of the term “variable” should not appear in the item stem.
6. Provide reasoning for appropriateness of materials, tools, procedures, and scale used in the investigation
DOK 2
• explain why the materials, tools, or procedure for the task are or are not appropriate for the investigation.

Appendix A—Guidelines for the Development of Science Inquiry Tasks 10 2008–09 NECAP Science Technical Report
Broad Area 3: Conducting Investigations
Grade 4
Standard: The procedure requires the student to demonstrate simple skills (observing, measuring, basic skills involving fine motor movement). The investigation requires the student to use simple scientific equipment (rulers, scales, thermometers) to extend their senses. The procedure provides the student with an opportunity to collect sufficient data to investigate the question, prediction, or relationships. Student is required to organize and represent qualitative or quantitative data using blank graph/chart templates. Student is required to summarize data. Note: Metric measurements are used for Grade 4, except for those pertaining to weather. Note: Multiple trials mean repeating the experiment to collect multiple sets of data.
Inquiry Construct Items addressing this construct require students to:
7. Follow procedures for collecting and recording qualitative or quantitative data, using equipment or measurement devices accurately
DOK 1: use tools; routine procedure;
DOK 2: follow multi-step procedures; make observations
• record precise data and observations that are consistent with the procedure of the investigation;
• include appropriate units of all measurements; • use appropriate measurement tools correctly to collect data; • record and label relevant details within a scientific drawing or diagram.
8. Use accepted methods for organizing, representing, and manipulating data
DOK 2: compare data; display data
• represent data accurately in a graph/table/chart; • include titles , labels, keys or symbols as needed; • select a scale appropriate for the range of data to be plotted; • use common terminology to label representations; • identify relationships among variables based upon evidence.
9. Collect sufficient data to study question, hypothesis, or relationships
DOK 2 part of following procedures
• show understanding of the value of multiple trials; • relate data to original question and prediction; determine if the quantity of data is sufficient to answer the question or
support or refute the prediction.
10. Summarize results based on data
DOK 2
• consider all data when developing an explanation and/or conclusion; • identify patterns and trends in data.

Appendix A—Guidelines for the Development of Science Inquiry Tasks 11 2008–09 NECAP Science Technical Report
Broad Area 4: Developing and Evaluating Explanations
Grade 4
Standard: Task must provide the opportunity for students to use data to construct an explanation based on their science knowledge and evidence from experimentation or investigation.
Inquiry Construct Items addressing this construct require students to:
11. Analyze data, including determining if data are relevant, artifact, irrelevant, or anomalous
DOK 2 - specify relationships between facts; ordering, classifying data
• identify data relevant to the task or question ; • identify factors that may affect experimental results (e.g. variables,
experimental error, environmental conditions); • classify data into meaningful categories.
12. Use evidence to support and justify interpretations and conclusions or explain how the evidence refutes the hypothesis
DOK 3
• identify data that seem inconsistent ; • use evidence to support or refute a prediction; • use evidence to justify an interpretation of data or trends; • identify and explain differences or similarities between prediction and
experimental data; • provide a reasonable explanation that accurately reflects data; • use mathematical reasoning to determine or support conclusions.
13. Communicate how scientific knowledge applies to explain results, propose further investigations, or construct and analyze alternative explanations
DOK 3
• explain how experimental results compare to accepted scientific understanding;
• suggest ways to modify the procedure in order to collect sufficient data;
• identify additional data that would strengthen an investigation; • connect the investigation or model to a real world example; • propose new questions, predictions, next steps or technology for
further investigations; • design an investigation to further test a prediction.

Appendix A—Guidelines for the Development of Science Inquiry Tasks 12 2008–09 NECAP Science Technical Report
Broad Area 1: Formulating Questions and Hypothesizing
Grade 8
Standard: Task must provide students a scenario that describes objects, organisms, or events to which the student will respond. The task will provide the student with the opportunity to develop their own testable questions or predictions based upon their experimental data, observations, and scientific knowledge. The task could include opportunities for the student to refine and refocus questions or hypotheses related to the scenario using their scientific knowledge and information
Inquiry Construct Items addressing this construct require students to:
1. Analyze information from observations, research, or experimental data for the purpose of formulating a question, hypothesis, or prediction:
(DOK 3) 1a. Appropriate for
answering with scientific investigation
1b. For answering using scientific knowledge
• analyze scientific data and use that information to generate a testable question or a prediction that includes a cause and effect relationship;
• generate a question or a prediction which is reasonable in terms of available evidence;
• support their question or prediction with a scientific explanation; • refine or refocus a question or hypothesis using experimental data,
research, or scientific knowledge. Note: Addressing this construct may appear at the beginning of the task, the end, or both.
2. Construct coherent argument in support of a question, hypothesis, prediction
DOK 2 or 3 depending on complexity of argument
• identify evidence that supports or does not support a question, hypothesis or prediction;
• explain the cause and effect relationship within the hypothesis or prediction;
• use a logical argument to explain how the hypothesis or prediction is connected to a scientific concept, or observation.
3. Make and describe
observations in order to ask questions, hypothesize, make predictions related to topic
DOK 2
• connect observations to a question or prediction.
Note: Items may refer to an existing, new, or student-generated question or prediction.

Appendix A—Guidelines for the Development of Science Inquiry Tasks 13 2008–09 NECAP Science Technical Report
Broad Area 2: Planning and Critiquing of Investigations
Grade 8
Standard: The task will require students to plan or analyze an experiment or investigation based upon questions, hypothesis, or predictions derived from the scenario. An experiment must provide students with the opportunity to identify and control variables. The task will provide opportunities for students to think critically about experiments and investigations and may ask students to propose alternatives.
Note: Scale refers to proportionality between the model and what it represents or the frequency with which data are collected.
Inquiry Construct Items addressing this construct require students to:
4. Identify information/evidence that needs to be collected in order to answer the question, hypothesis, prediction
DOK 2: routine; DOK 3: non-routine/ more
than one dependant variable
• identify the types of evidence that should be gathered to answer the question, or support or refute the prediction ;
• identify the variables that may affect the outcome of the experiment or investigation;
• design an appropriate format for recording data; • evaluate multiple data sets to determine which data are relevant to the
question, hypothesis or prediction. Note: These items could appear at the end of the task
5. Develop an organized and logical approach to investigating the question, including controlling variables
DOK 2: routine (replicates existing procedure);
DOK 3: non-routine (extends, refines, or improves existing procedure)
• develop a procedure to gather sufficient evidence (including multiple trials) to answer the question, or test the hypothesis, or prediction;
• develop a procedure that lists steps sequentially and logically; • explain which variable will be manipulated or changed (independent)
and which variable will be affected by those changes (dependent); • identify variables that will be kept constant throughout the
investigation; • use scientific terminology that supports the identified procedures; • evaluate the organization and logical approach of a given procedure
including variables, controls, materials, and tools; • evaluate investigation design, including opportunities to collect
appropriate and sufficient data. Note: These items could appear at the beginning or the end of the task.
6. Provide reasoning for appropriateness of materials, tools, procedures, and scale used in the investigation
DOK 2
• explain why the materials, tools, procedure, or scale for a task are appropriate or are inappropriate for the investigation.
• evaluate the investigation for the safe and ethical considerations of the materials, tools, and procedures.

Appendix A—Guidelines for the Development of Science Inquiry Tasks 14 2008–09 NECAP Science Technical Report
Broad Area 3: Conducting Investigations
Grade 8
Standard: The procedure requires the student to demonstrate skills (observing, measuring, basic skills involving fine motor movement) and mathematical understanding. The materials involved in the investigation are authentic to the task required. The procedure provides the student with an opportunity to collect sufficient data to investigate the question, prediction/hypothesis, or relationships. Student is required to organize and represent qualitative or quantitative data. Student is required to summarize data to form a logical argument. Note: Metric units are used for all Grade 8 measurements. Note: Multiple trials means repeating the experiment to collect multiple sets of data.
Inquiry Construct Items addressing this construct require students to:
7. Follow procedures for collecting and recording qualitative or quantitative data, using equipment or measurement devices accurately
DOK 1: use tools; routine procedure;
DOK 2: follow multi-step procedures; make observations
• record precise data and observations that are consistent with the procedure of the investigation;
• include appropriate units of all measurements; • use appropriate measurement tools correctly to collect data; • record and label relevant details within a scientific drawing.
8. Use accepted methods for organizing, representing, and manipulating data
DOK 2: compare data; display data
• represent data accurately in an appropriate graph/table/chart; • include titles, labels, keys or symbols as needed; • select a scale appropriate for the range of data to be plotted; • use scientific terminology to label representations; • identify relationships among variables based upon evidence. Note: The standard practice of graphing in science is to represent the independent on the x-axis and the dependent variable on the y- axis.
9. Collect sufficient data to study question, hypothesis, or relationships
DOK 2: part of following procedures
• show understanding of the value of multiple trials; • relate data to original question, hypothesis or prediction; • determine if the quantity of data is sufficient to answer the question
or support or refute the hypothesis or prediction.
10. Summarize results based on data
DOK 2
• consider all data when developing an explanation/conclusion; • identify patterns and trends in data.

Appendix A—Guidelines for the Development of Science Inquiry Tasks 15 2008–09 NECAP Science Technical Report
Broad Area 4: Developing and Evaluating Explanations
Grade 8
Standard Task must provide the opportunity for students to use data to construct an explanation based on their science knowledge and evidence from experimentation or investigation. The task requires students to use qualitative and quantitative data to communicate conclusions and support/refute prediction/hypothesis.
Inquiry Construct Items addressing this construct require students to:
11. Analyze data, including determining if data are relevant, artifact, irrelevant, or anomalous
DOK 2: specify relationships between facts; ordering, classifying data
• identify data relevant to the task or question; • identify factors that may affect experimental results (e.g. variables,
experimental error, environmental conditions); • classify data into meaningful categories; • compare experimental data to accepted scientific data provided as
part of the task; • use mathematical and statistical techniques to analyze data; • provide a reasonable explanation that accurately reflects data; • use content understanding to question data that might seem
inaccurate; • evaluate the significance of experimental data.
12. Use evidence to support and justify interpretations and conclusions or explain how the evidence refutes the hypothesis
DOK 3
• identify and explain data, interpretations or conclusions that seem inaccurate;
• use evidence to support or refute question or hypothesis; • use evidence to justify an interpretation of data or trends; • identify and explain differences or similarities between predictions and
experimental data; • provide a reasonable explanation that accurately reflects data; • use mathematical computations to determine or support conclusions.
13. Communicate how scientific knowledge applies to explain results, propose further investigations, or construct and analyze alternative explanations
DOK 3
• explain how experimental results compare to accepted scientific understanding;
• recommend changes to procedures to produce data that would provide sufficient data and more accurate analysis;
• identify and justify additional data that would strengthen an investigation;
• connect the investigation or model to an authentic situation; • propose and evaluate new questions, predictions, next steps or
technology for further investigations or alternative explanations; • account for limitations and/or sources of error within the experimental
design; • apply experimental results to a new problem or situation.

Appendix A—Guidelines for the Development of Science Inquiry Tasks 16 2008–09 NECAP Science Technical Report
Broad Area 1: Formulating Questions and Hypothesizing
Grade 11
Standard: Task must provide students a scenario with information and detail sufficient for the student to create a testable prediction or hypothesis. Students will draw upon their science knowledge base to advance a prediction or hypothesis using appropriate procedures and controls; this may include an experimental design.
Inquiry Construct Items addressing this construct require students to:
1. Analyze information from observations, research, or experimental data for the purpose of formulating a question, hypothesis, or prediction.
1a. Appropriate for answering with scientific investigation
1b. For answering using scientific knowledge
DOK 3
• analyze scientific data and use that information to generate a testable question, hypothesis, or prediction that includes a cause and effect relationship;
• generate a question, hypothesis or a prediction which is reasonable in terms of available evidence;
• show connections between hypothesis or prediction and scientific knowledge, observations, or research;
• support their question, hypothesis, or prediction with a scientific explanation;
• refine or refocus a question or hypothesis using experimental data, research, or scientific knowledge.
Note: Addressing this construct may appear at the beginning of the task, the end, or both.
2. Construct coherent argument in support of a question, hypothesis, prediction.
DOK 2 or 3: depends on complexity of argument
• identify evidence that supports or does not support a question, hypothesis or prediction
• explain the cause and effect relationship within the hypothesis or prediction;
• use a logical argument to support the hypothesis or prediction using scientific concepts, principles, or observations.
3. Make and describe
observations in order to ask questions, hypothesize, make predictions related to topic.
DOK 2
• connect observations and data to a question, hypothesis, or prediction.
Note: Items may refer to an existing, new, or student-generated question, hypothesis, or prediction.

Appendix A—Guidelines for the Development of Science Inquiry Tasks 17 2008–09 NECAP Science Technical Report
Broad Area 2: Planning and Critiquing of Investigations
Grade 11
Standard: The task will require students to plan or analyze an experiment or investigation based upon questions, hypothesis, or predictions derived from the scenario. An experiment must provide students with the opportunity to identify and control variables. The task will provide opportunities for students to think critically and construct an argument about experiments and investigations and may ask students to propose alternatives. Task will require the student to identify and justify the appropriate use of tools, equipment, materials, and procedures involved in the experiment. Note: Scale refers to proportionality between the model and what it represents or the frequency with which data are collected.
Inquiry Construct Items addressing this construct require students to:
4. Identify information/evidence that needs to be collected in order to answer the question, hypothesis, prediction
DOK 2: routine; DOK 3: non-routine; more than
one dependent variable
• identify the types of evidence that should be gathered to answer the question, or support or refute the hypothesis or prediction;
• identify the variables that may affect the outcome of the experiment or investigation;
• design an appropriate format for recording data and include relevant technology;
• evaluate multiple data sets to determine which data are relevant to the question, hypothesis or prediction.
Note: These items could appear at the end of the task. 5. Develop an organized and
logical approach to investigating the question, including controlling variables
DOK 2: routine (replicates existing procedure);
DOK 3: non-routine (extends, refines, or improves existing procedure)
• develop a procedure to gather sufficient evidence (including multiple trials) to answer the question, or test the hypothesis, or prediction;
• develop a procedure that lists steps sequentially and logically and incorporates the use of appropriate technology;
• explain which variable will be manipulated or changed (independent) and which variable will be affected by those changes (dependent);
• identify variables that will be kept constant throughout the investigation;
• distinguish between the control group and the experimental group in an investigation;
• use scientific terminology that supports the identified procedures; • evaluate the organization and logical approach of a given procedure
including variables, controls, materials, and tools. • evaluate investigation design, including opportunities to collect
appropriate and sufficient data. Note: These items could appear at the beginning or the end of the task.
Inquiry Construct Items addressing this construct require students to:
6. Provide reasoning for appropriateness of materials, tools, procedures, and scale used in the investigation
DOK 2
• explain why the materials, tools, procedure, or scale for a task are appropriate or inappropriate for the investigation.
• evaluate the investigation for the safe and ethical considerations of the materials, tools, and procedures.

Appendix A—Guidelines for the Development of Science Inquiry Tasks 18 2008–09 NECAP Science Technical Report
Broad Area 3: Conducting Investigations
Grade 11
Standard: The procedure requires the student to collect data through observation, inference, and prior scientific knowledge. Mathematics is required for the student to determine and report data. The task scenario is authentic to the realm of the student. The task requires the student to collect sufficient data to investigate the question, prediction/hypothesis, or relationships. Student is required to organize and represent qualitative or quantitative data. Student is required to summarize data to form a logical argument. Note: Metric units are used for all Grade 11 measurements Note: Multiple trials mean repeating the experiment to collect multiple sets of data.
Inquiry Construct Items addressing this construct require students to:
7. Follow procedures for collecting and recording qualitative or quantitative data, using equipment or measurement devices accurately
DOK 1: use tools; routine procedure;
DOK 2: follow multi-step procedures; make observations
• record precise data and observations that are consistent with the procedure of the investigation;
• include appropriate units of all measurements; • use appropriate measurement tools correctly to collect data;
record and label relevant details within a scientific drawing.
8. Use accepted methods for organizing, representing, and manipulating data
DOK 2 : compare data; display data
• represent data accurately in an appropriate graph/table/chart; • include titles, labels, keys or symbols as needed; • select a scale appropriate for the range of data to be plotted; • use scientific terminology to label representations; • identify relationships among variables based upon evidence. Note: The standard practice of graphing in science is to represent the independent on the x-axis and the dependent variable on the y- axis.
9. Collect sufficient data to study question, hypothesis, or relationships
DOK 2 : part of following procedures
• show understanding of the value of multiple trials • relate data to original question, hypothesis or prediction; • determine if the quantity of data is sufficient to answer the
question or support or refute the hypothesis or prediction.
10. Summarize results based on data
DOK 2
• consider all data when developing an explanation/conclusion; • identify patterns and trends in data.

Appendix A—Guidelines for the Development of Science Inquiry Tasks 19 2008–09 NECAP Science Technical Report
Broad Area 4: Developing and Evaluating Explanations
Grade 11
Standard: Task must provide the opportunity for students to use data to construct an explanation based on their science knowledge and evidence from experiment or investigation. The task requires students to use qualitative and quantitative data to communicate conclusions and support/refute prediction/hypothesis. The task provides students the opportunity to recognize and analyze alternative methods and models to evaluate other plausible explanations.
Note: The complexity of the scenario and associated data sets distinguishes this task from an 8th Grade task.
Inquiry Construct Items addressing this construct require students to:
11. Analyze data, including determining if data are relevant, artifact, irrelevant, or anomalous
DOK 2: specify relationships between facts; ordering, classifying data
• identify data relevant to the task or question; • identify factors that may affect experimental results (e.g.
variables, experimental error, environmental conditions); • analyze data and sort into meaningful categories; • compare experimental data to accepted scientific data provided
as part of the task; • use mathematical and statistical techniques to analyze data; • provide a reasonable explanation that accurately reflects data;
use content understanding to question data that might seem inaccurate
• evaluate the significance of experimental data.
12. Use evidence to support and justify interpretations and conclusions or explain how the evidence refutes the hypothesis
DOK 3
• identify and explain data, interpretations or conclusions that seem inaccurate;
• use evidence to support or refute question or hypothesis;
• use evidence to justify an interpretation of data or trend;
• identify and explain differences or similarities between hypothesis and predictions and experimental data;
• use evidence to justify a conclusion or explanation based on experimental data;
• use mathematical computations to determine or support conclusions;
• evaluate potential bias in the interpretation of evidence.
continued

Appendix A—Guidelines for the Development of Science Inquiry Tasks 20 2008–09 NECAP Science Technical Report
Inquiry Construct Items addressing this construct require students to:
13. Communicate how scientific knowledge applies to explain results, propose further investigations, or construct and analyze alternative explanations
DOK 3
• explain how experimental results compare to accepted scientific understanding;
• recommend changes to procedures to produce data that would provide sufficient data and more accurate analysis;
• identify and justify additional data that would strengthen an investigation;
• connect the investigation or model to an authentic situation; • propose and evaluate new questions, predictions, next steps or
technology for further investigations or alternative explanations; • account for limitations and/or sources of error within the
experimental design;
• apply experimental results to a new problem or situation;
• consider the impact (safety, ethical, social, civic, economic, environmental) of additional investigations.

Appendix A—Guidelines for the Development of Science Inquiry Tasks 21 2008–09 NECAP Science Technical Report
APPENDIX
NECAP Science Inquiry Task Development Process
Initial Steps for the Development of an Inquiry Task 1. Identify the NECAP Assessment TARGET to be addressed within the major idea for the task. 2. Refer to the Guidelines for the Development of Science Inquiry Tasks (GDIT). Brainstorm constructs
that would be addressed under each broad area within the major idea for the task.
Formulating Questions and Hypothesizing
Planning and Critiquing of Investigations
Conducting Investigations
Developing and Evaluating Explanation
3. Develop a draft SCENARIO aligned to the major idea of the task that could generate testable questions.*
4. Identify an authentic Data Set (Grades 8 & 11) that applies to the TARGET and relates to the SCENARIO *
OR
Provide opportunity for Collection of Data (Grade 4 & 8) that applies to the TARGET and relates to the SCENARIO *
* Note: The previous steps are interdependent. The construction of the draft SCENARIO and the identification of a data set, will inform one another. Either may necessitate modifications for alignment, as the task items are being developed.
Components of the Final Inquiry Task Each Inquiry Task must include:
• A cohesive series of scoreable items, totaling 16-18 points, that assess student understanding in each of the four broad areas of inquiry, as described in the GDIT.
• Scoreable items that have sufficient complexity for students to demonstrate scientific thinking related
to inquiry. • An identified DOK level for each scoreable item. • A scoring rubric for each scoreable item.


Appendix B—NECAP Science Committee Members 1 2008–09 NECAP Science Technical Report
Appendix B—NECAP SCIENCE COMMITTEE MEMBERS


Appendix B—NECAP Science Committee Members 3 2008–09 NECAP Science Technical Report
NECAP Technical Advisory Committee Members
New Hampshire
Name Affiliation Richard Hill Board of trustees chair, Center for Assessment Scott Marion Associate director, Center for Assessment Charles Pugh Assessment coordinator, Moultonborough District Rachel Quenemoen Senior research fellow, University of Minnesota Stanley Rabinowitz Assessment and Standards Development Services director, WestEd Christine Rath Superintendent of schools, Concord Steve Sireci Professor, University of Massachusetts Carina Wong Consultant
Rhode Island
Name Affiliation Sylvia Blanda Westerly School Department Bill Erpenbach WJE Consulting Richard Hill Board of trustees chair, Center for Assessment Jon Mickelson Providence School Department Joe Ryan Consultant Lauress Wise President, HumRRO
Vermont
Name Affiliation Dale Carlson NAEP coach, NAEO-Westat Lizanne DeStefano Bureau of Educational Research Jonathan Dings Boulder (Colorado) School District Brian Gong Executive director, Center for Assessment Bill Mathis Superintendent of schools, Rutland Northeast Supervisory Union Bob McNamara Superintendent of schools, Washington West Supervisory Union
Bob Stanton Assistant superintendent of schools, Lamoille South Supervisory Union
Phoebe Winter Consultant

Appendix B—NECAP Science Committee Members 4 2008–09 NECAP Science Technical Report
Item Review Committee Members August 11 and 12, 2008
New Hampshire
First name Last name School/association affiliation Position Annette Leel Appleton Elementary School Grade 3 teacher Cynthia Dunn Pinkerton Academy Science teacher Debra Almeida Milford Middle School Grade 8 science teacher Jenny Deenik Souhegan High School Grade 10 biology teacher Joseph Yahna Bartlett Elementary School Grade 7–8 teacher Kelly Marcotte Richards SAU 43 Grade 4 teacher Patricia Sukduang Spaulding High School Science department chair Robert Schroeder Swasey Central School Classroom teacher Sandra Kent Science consultant Sandra Tomellini Hilltop Elementary School Child specific coach Stacy Egan Great Brook School Grade 8 science teacher Vincent Tom Souhegan High School Science teacher
Item Review Committee Members
August 11 and 12, 2008
Rhode Island First name Last name School/association affiliation Position Alan Bostock Hugh Bain Middle School Science department head Diana Siliezar-Sheilds Barrington High School Science department head Eva Merolla Charles E. Shea High School Secondary science teacher
Jeff Schoonover Portsmouth High School Physics teacher/department chair
Jennifer TRUE Smithfield High School Chemistry teacher Jennifer Polacek Globe Park Elementary School Classroom teacher Kathy Tancrelle Old County Road School Teacher Lori Randall Davisville Middle School Grade 8 science teacher Maria Clarey Tiverton Middle School Science teacher Stephen Cormier Chariho Middle School Science teacher Susan Tardio Woodridge School Classroom teacher
Wendy Lapuc Elizabeth Baldwin Elementary School Special education teacher

Appendix B—NECAP Science Committee Members 5 2008–09 NECAP Science Technical Report
Item Review Committee Members August 11 and 12, 2008
Vermont
First name Last name School/association affiliation Position Brian Crane Fairhaven Grade School Science teacher Cherrie Torrey Dothan Brook School Classroom teacher Graham Clarke Camels Hump Middle School Assistant principal Greg Renner Oxbow High School Science teacher
Jim Daly Missisquoi Valley Union High School Science department leader/teacher
Katie Sullivan Warren School Grade 3–4 teacher Maureen Maidrand Springfield High School Network leader Nathan Reutter Mount Anthony Union High School Science teacher Travis H. Redman Jr. Rutland Town School Grade 6–8 teacher
Bias and Sensitivity Committee Members
August 11 and 12, 2008
New Hampshire First name Last name School/association affiliation Position Alexander Markowsky Franklin and Hill School District School psychologist Enchi Chen Farmington High School ESL teacher Karen Dow Southwick School Reading specialist Mary Sohm Londonderry High School Special education teacher, scienceMary-Jo Bourque Memorial High School Assistant principal Maureen Richardson Manchester School District ELL coordinator

Appendix B—NECAP Science Committee Members 6 2008–09 NECAP Science Technical Report
Rhode Island First name Last name School/association affiliation Position Amy Simoes Dr. Harry Halliwell School Classroom teacher Heather Taylor Westerly Middle School Science teacher Lisa Fillippelli Thornton School Inclusion teacher/grade 1–2 Paula Fillon Emma G. Whiteknact School Special education teacher Sandra Farone Winsor Hill School Classroom teacher Soraya Santana Lillian Feinstein Elementary School Bilingual Spanish teacher
Vermont
First name Last name School/association affiliation Position Ani Lutz Warren Elementary School Speech-language pathologist Brenda Seitz Vermont Center for the Deaf Director of special education Darlene Petke Central Elementary School Intensive needs special educator Linda Hutchins Addison Central School Grade K–6 special educator Sharon Hunt Gilman Middle School Grade 5–8 special educator

Appendix C—Table of Standard Test Accommodations 1 2008–09 NECAP Science Technical Report
Appendix C—TABLE OF STANDARD TEST ACCOMMODATIONS


Appendix C—Table of Standard Test Accommodations 3 2008–09 NECAP Science Technical Report
Table of Standard Test Accommodations Any accommodation(s) utilized for the assessment of individual students shall be the result of a formal or informal team decision made at the local level. Accommodations are available to all students on the basis of individual need regardless of disability status. A. Alternative Settings A-1 Administer the test individually in a separate
location A-2 Administer the test to a small group in a
separate location A-3 Administer the test in locations with minimal
distractions (e.g., study carrel or different room from rest of class)
A-4 Preferential seating (e.g., front of room) A-5 Provide special acoustics A-6 Provide special lighting or furniture A-7 Administer the test with special education
personnel A-8 Administer the test with other school personnel
known to the student A-9 Administer the test with school personnel at a
non-school setting B. Scheduling and Timing B-1 Administer the test at the time of day that takes
into account the student’s medical needs or learning style
B-2 Allow short supervised breaks during testing B-3 Allow extended time, beyond recommended
until in the administrator’s judgment the student can no longer sustain the activity
C. Presentation Formats C-1 Braille C-2 Large-print version C-3 Sign directions to student C-4 Test and directions read aloud to student (Math,
Science, and Writing only) 1
C-5 Student reads test and directions aloud to self C-6 Translate directions into other language C-7 Underlining key information in directions C-8 Visual magnification devices C-9 Reduction of visual print by blocking or other
techniques C-10 Acetate shield C-11 Auditory amplification device or noise buffers C-12 Word-to-word translation dictionary, non-
electronic with no definitions (For ELL students in Math, Science, and Writing only)
C-13 Abacus use for student with severe visual impairment or blindness (Mathematics and Science—any session)
D. Response Formats D-1 Student writes using word processor, typewriter,
computer 2 (School personnel transcribes student responses exactly as written into the Student Answer Booklet.)
D-2 Student hand writes responses on separate paper. (School personnel transcribes student responses exactly as written into the Student Answer Booklet.)
D-3 Student writes using brailler (School personnel transcribes student responses exactly as written into the Student Answer Booklet.)
D-4 Student indicates responses to multiple-choice items. (School personnel records student responses into the Student Answer Booklet.)
D-5 Student dictates constructed responses (Reading, Math, and Science only) or observations (during the Science Inquiry Task) to school personnel. (School personnel scribes student responses exactly as dictated into the Student Answer Booklet.)
D-6 Student dictates constructed responses (Reading, Math, and Science only) or observations (during the Science Inquiry Task) using assistive technology. (School personnel transcribes student response exactly as written into the Student Answer Booklet.)
D-7 Not available at this time If an accommodation is needed for a student that is not listed above, please contact the state personnel for accommodations to discuss it. E. Other Accommodations 3 E-1 Accommodations team requested other
accommodation not on list and DOE approved as comparable
E-2 Scribing the Writing Test (only for students requiring special consideration)
F. Modifications 4 F-1 Using calculator and/or manipulatives on Session
1 of the Mathematics test or using a scientific or graphing calculator on Session 3 of the Science test.
F-2 Reading the Reading test F-3 Other
1. Reading the reading test to the student invalidates all reading sessions. 2. Spell and grammar checks must be turned off. This accommodation is intended for unique individual needs, not an
entire class 3. Test coordinators must obtain approval for the accommodation from the Department of Education prior to test
administration. 4. All affected sessions using these modifications are counted as incorrect.


Appendix D—Appropriateness of Accommodations 1 2008–09 NECAP Science Technical Report
Appendix D—APPROPRIATENESS OF THE ACCOMMODATIONS ALLOWED IN
NECAP GENERAL ASSESSMENT AND THEIR IMPACT ON STUDENT RESULTS


Appendix D—Appropriateness of Accommodations 3 2008–09 NECAP Science Technical Report
Appropriateness of the Accommodations Allowed in NECAP General Assessment and Their Impact on Student Results
1) Overview and Purpose
To meet federal peer review requirements for approval of state assessment systems, in the spring of 2006 New Hampshire, Rhode Island, and Vermont submitted extensive documentation to the United States Department of Education on the design, implementation, and technical adequacy of the New England Common Assessment Program (NECAP), a state level achievement testing program developed through a collaborative effort of the three states. In response to peer review finding, the states were required to submit additional documentation for a second round of peer review, including information on the use, appropriateness, and impact of NECAP accommodations. This report was prepared in response to the questions posed by the peer reviewers, and has been included in the 2008–09 NECAP Science Technical Report for other groups or individuals who may be interested in NECAP accommodation policies and procedures, and how well they have been working.
2) Report on the Appropriateness and Comparability of Accommodations allowed in statewide
NECAP General Assessment A. Who may use accommodations in NECAP assessment?
NECAP test accommodations are available to all students, regardless of whether or not a disability has been identified. Accommodations allowed are not group specific. For example, students in Title I reading programs, though not formally identified as “disabled” may still need extra time on assessments. Students with limited English proficiency sometimes break their arms and need to dictate multiple choice responses. Other students may need low vision accommodations even though they are not considered to be “blind”. Before they are members of any subgroup, each student is first an individual with unique learning needs. NECAP assessment accommodations policy treats students in this way. The decision to allow all students to use accommodations, as needed, is consistent with prior research on best practice in the provision of accommodations (c.f., Elbaum, Aguelles, Campbell, & Saleh, 2004):
“…the challenge of assigning the most effective and appropriate testing accommodations for students
with disabilities, like that of designing the most effective and appropriate instructional programs for
these students, is unlikely to be successfully addressed by disability. Instead, much more attention
will need to be paid to individual student’s characteristics and responses to accommodations in
relation to particular types of testing and testing situations.” (pp. 71-87)
The New England Common Assessment Program New Hampshire + Rhode Island + Vermont

Appendix D—Appropriateness of Accommodations 4 2008–09 NECAP Science Technical Report
The NECAP management team believes strongly that a fair and valid path of access to a universally designed test should not require that a student carry a label of disability. Rather, much like differentiated instruction, accommodated conditions of test participation that preserve the essential construct of the standard being assessed should be supported for any student who has been shown to need these differentiated test conditions. This philosophy is consistent with the NECAP team’s commitment to building a universally accessible test that provides an accurate measure of what each student knows in reading, mathematics writing, and science content.
The following critical variables drive the process of providing NECAP accommodations:
1. The decision to use an accommodation for an individual student must be made using a valid and
carefully structured team process consistent with daily instructional practice, and
2. The accommodated test condition must preserve the essential construct being assessed, resulting
in a criterion-referenced measure of competency considered to be comparable to that produced under standard test conditions.
B. Are NECAP Accommodations Consistent with Accepted Best Practice?
NECAP provides a Table of Standard Test Accommodations that was assembled from the experience and long assessment histories of the three partner states. The NECAP Table of Standard Test Accommodations was created by establishing a three state cross-disciplinary consensus reached with key expert groups: special educators, ELL specialists, and reading, mathematics, writing, and science content specialists from each of the partner states. In addition, the work of various stakeholder and research groups with special instructional expertise was also considered. These sources included: • Meetings with state advocacy groups for students with severe visual impairment or blindness, • Meetings with state advocacy groups for students with deafness or hearing impairment, and
consultations with other research-based groups like: • The American Printing House for the Blind, Accessible Tests Division, • The National Center on Educational Outcomes (NCEO), and • The New England Compact Group, who conducted federally-funded enhanced assessment research
on accommodations, in partnership with Boston College (inTASC group) and the Center for Applied Special Technologies (CAST).
The NECAP cross-disciplinary team, consulting with these other specialists, chose accommodations that were commonly accepted as standard, well established on a national basis, and that were consistent with assessment practice across all the NECAP states. Each identified standard accommodation was chosen to support best educational practice as it is currently understood.
Examples of the impact on accommodations design resulting from consultation with the American Printing House for the Blind experts in accessible test development included the addition to our standard accommodations of the use of an abacus in place of scrap paper for students with severe visual impairment. Recent research from the American Printing House for the Blind also indicated that 20 pt. font was producing better outcomes for students using large print accommodations (Personal communication, October, 2004). Based on this input, the NECAP team decided to provide a minimum of 20 pt. instead of 18 point font for large print editions of the NECAP assessment. This, in turn, led to improved production and type setting for large print NECAP tests. Consultation with advocacy groups for the deaf and hard of hearing led to improved item design, in particular helping item developers avoid the unnecessary use of rhyming words and homophones, supporting a decreased need for sign language accommodations with this group.

Appendix D—Appropriateness of Accommodations 5 2008–09 NECAP Science Technical Report
Impact of WIDA Partnership on development of Accommodations for LEP students. An important relationship exists between NECAP assessment and the NECAP partner states’ active membership in WIDA/ACCESS for ELL’s Assessment Consortium. New understandings in the area of accommodations policy and practice are beginning to emerge. For example, we have learned that word-to-word dictionary accommodations are most effective when used by LEP students at an intermediate level of proficiency and are not advised for beginning LEP students. The NECAP Accommodations Manual reflects this. Community learning opportunities created through the WIDA partnership have set a strong and supportive context for long term benefit and mutual growth potential. A wise investment has been made by the NECAP group in this effort.
During the last 2 years, assessment leaders from all three NECAP states, as active partners in the WIDA consortium developing the new ACCESS for ELLs Test of English Language Proficiency, have collaborated in a cross-disciplinary team process to establish accommodations policy for this English language proficiency assessment. The ACCESS for ELLs accommodations team was composed of ESOL teachers, special educators, measurement specialists, and SEA assessment leaders. All three NECAP states took an active role and learned much from this process. This joint development effort opened dialog across ELL and special education accommodation groups and continues to support the ongoing review and improvement of both ACCESS and NECAP accommodations. The states are learning from each other, and with each new development cycle, are improving the accommodations system. The community of professional practice in this area is growing. Best practice understandings are expanding with our increasing experience and communication about the needs of LEP student groups. Specifically, we are learning about the importance of academic language to English Language Learners who are attempting to take the state-level general content assessments. Accommodations specific to this academic language support issue are being explored and considered. We are finding that vocabulary lists, practice tests, computer-based read-alouds and other supports and accommodations are eliciting positive responses from our LEP students who take the state content assessments. This will be addressed in more detail in a later section.
C. How are NECAP Accommodations Structured?
Standard Accommodations: NECAP sorts standard accommodations into 4 categories (labeled A-D), which include: A) Alternative Settings, B) Scheduling and Timing, C) Presentation Formats, and D) Response Formats. School teams may choose any combination of standard (A-D) accommodations to use with any student so long as proper accommodation selection and usage procedure is followed and properly documented (see following subsection). Students who use standard accommodations on NECAP tests receive full performance credit as earned for the test items taken under these standard conditions. NECAP standard accommodations are treated as fully comparable to test conditions where no accommodation is used.
In addition, NECAP lists 2 additional categories of altered test conditions which require formal state level review and approval on a student by student basis. These special test conditions are: E) Other Accommodations and F) Modifications. (See: NECAP Accommodations, Guidelines and Procedures Training Manual, (2005), p 5, Available on state websites listed following references.)
Non-Standard Test Conditions – Review, Monitoring and Documentation of Preservation of the Intended Construct: “Other (E type) Accommodations” are accommodations without long or wide history of use that are not listed under the standard (A-D) categories. If schools wish to use accommodations that are not listed in A-D as standard, then they must send a formal written Request for Use of Other Accommodations to the State Department for review and approval for usage with an individual student. This request documents the team decision and describes fully the procedure to be used. Upon receipt by the SEA, these requests are thoroughly reviewed by state assessment content specialists together with special educators to determine if the accommodation proposed will allow

Appendix D—Appropriateness of Accommodations 6 2008–09 NECAP Science Technical Report
performance of the essential constructs intended by the impacted test items. If the requested “other” accommodation is found to allow performance that will not alter the intended construct or criterion referenced standard to be assessed, then the school is issued a written receipt giving permission for use of this other accommodation as a standard accommodation for one test cycle. Schools are instructed on how to document the use of this approved “E) Other Accommodation” and the SEA monitors the process, ensuring that both school test booklets and state records accurately reflect the final test data. All “E) Other Accommodations” are approved in this way by the Department and, if approved, are treated as standard accommodations. Item responses completed under approved “E) Other” test conditions receive full credit as earned by the student.
If a requested “other” accommodation is found by the state review team to NOT preserve the intended construct, then the review team sends the school a receipt and notice that the requested change in test condition will be considered to be a test modification “F) Modification”. All items completed under these test conditions will NOT receive performance credit. An example of a non-credited “F) Modification” would be any test condition where reading test passages, items, or response options are read to a student. State reading content specialists have determined that this change in a reading test condition does, in fact, alter the decoding construct being tested in all reading items. Therefore, reading items completed under this test condition would not be credited.
Use and approval of “E) Other Accommodations” are carefully monitored by the state. If any school claims use of an “E) Other Accommodation” that has not received prior state review and documented approval, then the test data documentation is similarly flagged to reflect that an F) Modification was instead provided. This flagged situation is treated as a non-credited test modification and the items impacted are invalidated. Further, any sections of the test completed under “F) Modification” conditions are later documented in student reports as not credited due to the non-standard and non-comparable test administration conditions used.
D. How does the NECAP Structure Guide Appropriate Use of Accommodations by Schools?
In 2005, New Hampshire, Rhode Island, and Vermont collaborated on the NECAP Accommodations Guidelines and Procedures Training Manual. The guide was disseminated through a series of regional test coordinator’s workshops, as well as additional professional development opportunities provided by the individual states, and was also posted on each states website. This tool was designed to provide schools with a structured and valid process for decision making regarding the selection and use of accommodations for students on statewide assessment. Prior studies have outlined assessment guidelines that maximize the participation of students with disabilities in large-scale assessment. The National Center on Educational Outcomes (NCEO), in Synthesis Report 25 (1996), presented a set of criteria that states should meet in providing guidelines to schools for using accommodations (pp. 13-14, and 25). The NCEO recommendations figured prominently in preparation of the NECAP accommodations guide.
The NECAP Accommodations Guidelines and Procedures Training Manual (2005) meets all seven of the criteria established by NCEO as follows:
1. The decision about accommodations is made by a team of educators who know the student’s
instructional needs. NECAP goes beyond this recommendation and requires that the student’s parent or guardian also be part of this decision team, (NECAP Accommodations Manual, pp. 2-3, and 20-22).
2. The decision about accommodations is based on the student’s current level of functioning and learning characteristics. (Manual, pp. 20-22).
3. A form is used that lists the variables to consider in making the accommodations decisions, and that documents for each student the decision and reasons for it. (Manual, pp. 20-22).

Appendix D—Appropriateness of Accommodations 7 2008–09 NECAP Science Technical Report
4. Accommodation guidelines require alignment of instructional accommodations and assessment accommodations. (Manual, pp. 2 and 20-22).
5. Decisions about accommodations are not based on program setting, category of disability, percent time in the mainstream classroom (Manual, pp.15 and 20-22).
6. Decisions about accommodations are documented on the student’s IEP or on an additional form that is attached to the IEP. (Manual, pp. 2, 15, and 20-22).
7. Parents are informed about accommodation options and about the implications for their child (1) not being allowed to use the needed accommodations, or (2) being excluded from the accountability system when certain accommodations are used, (Manual pp. 3 and 20-22).
As described above, NECAP states use a highly structured process for the review, approval, and monitoring of requests by schools for the use of other (non-standard) accommodations for individual students. As described in section B, above, the NECAP Accommodations Manual provides a Table of Standard Accommodations each year. The manual provides two structured decision making worksheets (pp. 20-22) to guide the decision process of educational teams. One worksheet guides the selection of standard accommodations; the second provides guidance on the selection of other accommodations. The manual contains information on the entire decision making process. In addition, the manual provides detailed descriptions and research-based information on many specific accommodations.
Ongoing Teacher Training and Support: Throughout each academic year, several teacher workshops on planning and implementing accommodations are offered at multiple locations regionally in each of the three states to teams of educators. In the spring of 2005, prior to the launch of the first NECAP assessment, a series of introductory statewide 2-hour workshops in accommodations administration was offered in multiple locations. Each year thereafter, in late summer prior to the administration of the NECAP tests, a series of accommodations usage updates is offered as part of the NECAP Test Administration Workshop series; five regional workshops are offered in each state. Additionally, each state’s Department of Education has consultants who are available to provide individualized support and problem solving, as well as small and large group in-service for schools. Finally, the DOE assessment consultants work directly with a variety of statewide groups and organizations to promote the use of effective accommodations, and to gather feedback on the efficacy of the NECAP accommodation policies and procedures. These include University-based Disability Centers, statewide parent advocacy organizations, organizations representing individuals with vision and hearing disabilities. Finally, each state has systems in place to provide schools with individualized support and consultation: New Hampshire employs two distinguished special field educators who, by appointment and free of charge, provide onsite training and support in alternate assessment and accommodations strategies. Rhode Island has an IEP Network that provides on-site consultation with schools on a variety of special services topics including planning and implementing assessment accommodations. Vermont has a cadre of district-level alternate assessment mentors who provide a point of contact for disseminating information, and who are also available in schools and school districts for intensive consultation related to the assessment needs of individual students.
Monitoring of the Use of Accommodations in the Field: Each year during the NECAP test window, the DOE content specialists schedule a limited number of on-site visitations to observe test administration as it is occurring in the schools. State capacity to provide such direct monitoring during the test window is limited, but such monitoring is conducted during each test window and observers report observations directly to the state assessment team. Additional on-site accommodations monitoring is provided by district special education directors and the NECAP test coordinators. Both of these groups also receive training each year. Throughout each school year, program review teams from the DOEs’ special education divisions conduct on-site focused monitoring of all special education programs. These comprehensive visits include on-site monitoring of the use of accommodations for students who have Individualized Educational Programs (IEPs).

Appendix D—Appropriateness of Accommodations 8 2008–09 NECAP Science Technical Report
E. Are NECAP Accommodations Consistent with Recent Research Findings?
The NECAP development team has attempted to learn from the research on accommodations, but this has not been a simple matter. In 2002, Thompson, Johnstone, and Thurlow concluded in their report on universal design in large scale assessments that research validating the use of standard and non-standard accommodations has yet to provide conclusive evidence about the influence of many accommodations on test scores. In 2006, Johnstone, Altman, Thurlow, & Thompson published an updated review of 49 research studies conducted between 2002 and 2004 on the use of accommodations and again found accommodations research to be inconclusive. They noted the similarity to past findings from NCEO summaries of research (Thompson, Blount & Thurlow, 2002). The authors of the 2006 review state:
“Although accommodations research has been part of educational research for
decades, it appears that it is still in its nascence. There is still much scientific disagreement on the effects, validity, and decision-making surrounding accommodations.” (p. 12)
However, a frequently cited research review by Sireci, Li, & Scarpati, (2005) documented evidence of support for the accommodation of providing extended time. This accommodation is one of the most frequently used standard NECAP accommodations. Extended time accommodations appeared to hold up best under the interaction hypothesis for judging the validity of an accommodation. In a 2006 presentation addressing lessons learned from the research on assessment accommodations to date, Sireci and Pitoniak, (2006), concluded that, in general, “accommodations being used are sensible and defensible.” They replicated their prior finding that the extended time accommodation seems to be a valid accommodation and noted that many other accommodations have produced less convincing results. They noted that oral or read-aloud accommodation for math appears to be valid, but that a similar read-aloud accommodation for reading involves consideration of specific construct changes which threaten score comparability. These findings are also consistent with and support the NECAP accommodation policy of allowing the read-aloud accommodation for mathematics, but not allowing this accommodation for reading tests. Despite the inconclusive and conflicting current state of accommodations research, findings seem to be emerging that do, in fact, provide validation for some of the most frequently used NECAP accommodations: the extended time and mathematics read-aloud accommodations. Accommodations for English language learners. In a presentation on the validity and effectiveness of accommodations for English language learners with disabilities, Abedi (2006) reported that students who use an English or bilingual dictionary accommodation (word meanings allowed) may be advantaged over those without access to dictionaries and that this may jeopardize the validity of the assessment. Abedi argues persuasively that linguistic accommodations for English language learners should not be allowed to alter the construct being tested. He also argues that the language of assessment should be the same language as that used in instruction in the classroom – otherwise student performance is hindered. NECAP assessment policy is consistent with both of these findings: ELL students may use word-to-word translations as linguistic accommodation support, but may not use dictionaries with definitions provided. Abedi’s research supports this decision. Also NECAP assessment items are not translated into primary languages for ELL students. This, too, is consistent with classroom practice in the NECAP states and is supported by the current literature. At the same conference referenced just above, Frances (2006), presented findings from a meta-analysis in which he compared the results of eleven studies of the use of linguistic accommodations provided for ELL students in large scale assessments. In his presentation, given at the LEP Partnership Meeting in Washington, DC, he noted that no significant differences in student performance were observed for 7 of the 8 most commonly provided linguistic accommodations. Although Frances was not recommending its use, the only linguistic accommodation that showed any significant positive effect on the performance of ELL students was an accommodation allowing the use of an English dictionary or glossary during statewide assessment. This is the very same accommodation that Abedi (2006) recommends against using because it violates intended test constructs. As noted above, in NECAP assessment, the use of word-to-word translations is an allowed standard linguistic accommodation. However, the use of an

Appendix D—Appropriateness of Accommodations 9 2008–09 NECAP Science Technical Report
English dictionary with glossary meanings is not an allowable standard accommodation. It is the position of the NECAP reading content team that allowing any student to use a dictionary with definitions or a glossary of meanings violates the vocabulary and comprehension constructs intended in the NECAP reading test and would invalidate test results. For this reason, NECAP does not allow this linguistic accommodation. As reported by Frances, analysis of the remaining 7 linguistic accommodations typically allowed for ELL students showed no significant positive effect on test performance. These included: bilingual dictionary use, dual language booklets, dual language questions and read-aloud in Spanish, extra time to test, simplified English, and offering a Spanish version of a test. Despite the lack of positive effects observed for these other linguistic accommodations to date, NECAP does provide a number of linguistic supports for ELL students. One of these linguistic supports includes: employing the universal design technique of simplifying the English in all test items. Review and editing of test items for language simplicity and clarity has been a formal part of the annual process of test item development and review since the inception of the NECAP. In addition to word-to-word translations, a number of other standard linguistic accommodations are allowed in NECAP testing to provide a path of access for ELL students to show what they know and can do in reading and mathematics. Standard linguistic accommodations permitted by NECAP include: allowing mathematics test items to be read aloud to the student, allowing students to read aloud to themselves (if bundled with an individual test setting), translation of test directions into primary language, underlining key information in written directions and dictation/ scribing of reading and math test responses. NECAP assessments provide linguistic access for students who are English language learners. As noted earlier, a number of studies have shown some positive effect of the use of the extended time and read-aloud accommodations for students in general. As ELL students continue to gain proficiency in English, they may also increasingly benefit from these accommodations. More research is needed to clarify how states can most appropriately support ELL students to show us what they know and can do. NECAP Supported Research Studies: Through the New England Compact Enhanced Assessment Project (2007), the NECAP states have completed a number of accommodations and universal design research studies. These studies have shed additional light on the appropriateness of existing standard accommodations and have helped to inform the development of new accommodations and improved universal design of assessment. Under the Enhanced Assessment Grant, in joint partnership with: the inTASC group of Boston College, the Center for Applied Special Technologies (CAST), the state of Maine, and the Educational Development Center, Inc., the NECAP states supported research studies on accommodations and universal design in four distinct areas. These studies, summarized below, are described more fully in the appendix to this report:
Use of computer-based read-aloud tools. NECAP supported a study of 274 students in New Hampshire high schools. This study, Miranda, H., Russell, M., Seeley, K., Hoffman, T., (2004), provided evidence that computer–based read aloud accommodations led to improved content access and performance of students with disabilities when taking mathematics tests.
As direct result of this study, New Hampshire was able to build and pilot a new computer-based read aloud tool that is now under development for use with NECAP assessments for all three NECAP states. Following this New Hampshire pilot of the new computer-based read aloud tool on the state high school assessment, the New Hampshire Department of Education conducted a focus group study with participating students from Nashua North High School. The results of this focus group (May 17, 2006) are available from the New Hampshire Department of Education. One of the primary findings from this focus group was the strong impact of having experienced the read-aloud in practice test format prior to actual testing. Experience with this tool prior to testing appeared to be very important for student performance. High school students indicated a very strong preference for computer-based read aloud over the same accommodation provided by a person. Both groups of students, those with

Appendix D—Appropriateness of Accommodations 10 2008–09 NECAP Science Technical Report
limited English proficiency and those with disabilities consistently reported that they were able to focus much more clearly on the math content (not just the words) than in prior math tests they had taken without this accommodation. Based on student report, use of this read-aloud seemed to improve content access for these students. The ability to benefit from the individual work of each of the three NECAP states is a major benefit of the tri-state partnership.
Use of computers to improve student writing performance on tests. Another research study
conducted by Higgins, J., Russell, M., & Hoffmann, T., (2004), studied 1000 students from the three states to examine how the use of computers for writing tests affected student performance. The study found that minority girls tended to perform about the same whether using a computer or pencil-and-paper to provide written responses. However, all other groups, on average, tended to perform better when using a computer to produce written responses. A minimum degree of keyboarding skill correlated with improved performance. Lack of keyboarding skill produced results that did not significantly differ from pencil-and–paper responding and therefore, appeared to ‘do no harm’. As a result, NECAP states entered into talks to determine how a computer based response might be more fully supported in future versions of the assessment. The study suggested that a minimum number of words typed accurately per minute of 18-20 was the recommended threshold to obtain benefit from this accommodation. This finding has been incorporated into NECAP training and support activities. At the present time, NECAP allows use of a word processor to produce written test responses as a standard accommodation on all NECAP content tests. The research supports this practice.
Use of Computers for Reading Tests. A third study conducted by Miranda, H., Russell, M., & Hoffmann, T., (2004), examined how the presentation of reading passages via computer screen impacted the test performance of 219 fourth grade students from eight schools in Vermont. This study found no significant differences in reading comprehension scores across the 3 (silent) presentation modes studied: 1. Standard presentation on paper, 2. On computer screen with use of a scrolling feature, and 3. On computer with passages divided into sections presented as whole pages without the scrolling feature. Results from this study were not conclusive, but some trend data suggested that the scrolling presentation feature may disadvantage many students, especially those with weaker computer skills. The majority of students indicated an overall preference for computer-based presentation over pencil-and-paper. As other research studies, previously cited, continue to show that read-aloud accommodations are generally effective, it can be expected that pressure to offer computer-based read-alouds involving text presentation will increase. Additional research in this area may help shed important light on the most effective ways to provide this useful accommodation. (See also: Higgins, J., Russell, M., & Hoffmann, T., (2004).)
Use of Computer-Based Speak-Aloud Responses to Short Answer Items. The states’ enhanced
assessment grant also supported a study by Miranda, H., Russell, M., Seeley, K., Hoffman, T., (2004) that looked at the feasibility and effectiveness of using a computer to transcribe spoken responses into written text in response to short answer test items. This was considered as a possible linguistic accommodation for use with English language learners in reading and mathematics tests. Unfortunately, this study found that it is not yet feasible to use computers to record student’s verbal responses to short-answer items. A variety of technical problems occurred and students were not comfortable in speaking to the computer. The researchers concluded that, with existing technology limitations, use of this kind of computer based accommodation may not be feasible for some years.
F. What evidence has the state gathered on the impact and comparability of accommodations
allowed on NECAP test scores?
Direct and Immediate Score Impact. First, as a matter of policy, there is a direct and immediate impact on NECAP test scores for students when standard accommodations (accepted and credited as comparable) vs. non-standard accommodations (not accepted and not credited as comparable) are used during test administration. The student performance score is significantly reduced for each subtest where
Appendix D—Appropriateness of Accommodations 11 2008–09 NECAP Science Technical Report
test items and the constructs they were designed to measure have been modified by use of a non-standard accommodation. Sessions with modified items receive no credit in the student total score for that content area. If the entire reading test is read to a student, the student will earn 0 points in that content area. If only certain sessions of the reading test are read to the student, then only the score of those sessions will be impacted, but this will result in a lower overall reading content score.
Empirical bases for Comparability of NECAP Test Scores Obtained from Accommodated vs. Non-Accommodated Test Conditions: During the NECAP Pilot Test in 2004, differential item functioning (DIF) analyses were conducted on the use of accommodations by various student subgroups. In December 2006, the NECAP Technical Advisory Committee (TAC) reviewed the use of these DIF analyses and discussed long range planning for ongoing review of the use of accommodations in NECAP assessment. There was consensus among TAC members that the current use of DIF analyses for evaluation of accommodation use allows very limited inferences to be made therefore is of minimal practical value to the states. Other general methods of organizing and reviewing accommodations data and performance outcomes should be developed for states to employ. A NECAP TAC subgroup was formed to consider and respond to the following question: What should NECAP states be doing at this stage in our development to review use, appropriateness, design, etc, of the NECAP Accommodations and related policy & guidelines? What information and processes will help us learn, clarify & communicate how, why, and when to use what accommodations? The results of this December 2006 TAC accommodations workgroup are available on each of the three states’ websites. In summary, the TAC workgroup recommended 5 categories of activity for the NECAP states: 1. Given what states have learned from initial implementation and recent research, they should review, revise, describe and more fully document NECAP Accommodations Policies and Guidelines. This should be part of an ongoing review process. 2. Explore available research on questionable or controversial accommodations. Document this review and revise where indicated. 3. Transparency of reporting should be examined. There was group consensus that the use of accommodations during assessment should be fully disclosed, and thereby made transparent in the reporting process. NECAP states should work to sort out this aspect of reporting policy and determine where and how to report what aspects of accommodation usage to parents and to the public at large. 4. States need to further address monitoring of accommodation usage. Find ways to improve the quality of district/school choices in the selection and use of accommodations for students. Strategies that take limited state resource capacity into account must be considered. The issue is fundamentally one of putting improved quality control processes in place in the most efficient, cost effective ways. Several resources currently under development may assist the states in this effort. One of these resources in already being developed in the OSEP funded General Supervision Grant to one of the NECAP states. This grant will develop digitized video clips illustrating proper ways to provide certain accommodations, especially for students with severe disabilities. Creation of this video tool may enhance state capacity to provide and distribute effective training to districts and improved local monitoring of day to day use of accommodations for both instruction and assessment. 5. Available data needs to be mined and organized on the current use of accommodations in NECAP testing. Usage and outcomes for various subgroups should be examined. DIF analyses may not be as useful in this regard as other types of carefully planned descriptive comparisons. Some research concerns were also identified. How do states differentiate between an access issue for a student – where the student has skills they cannot show as opposed to a lack of opportunity to learn or lack of skill development? This issue appears repeatedly in a number of research studies reviewed. It is not a simple matter to differentiate between these situations. One indicates a need for an assessment

Appendix D—Appropriateness of Accommodations 12 2008–09 NECAP Science Technical Report
design change. The other indicates a need for instructional change. Research to help sort this out should be supported.
Test Access Fairness as One Kind of Evidence for Comparability: NECAP states have made a commitment to work with stakeholders representing various groups of students who typically use accommodations or who may benefit from improved universal assessment design. The feedback received from these stakeholder groups is a valuable source of information and ideas for continued improvement of our assessment program.
NECAP consults regularly with experts in accessible test design at the American Printing House for the Blind in Lexington, KY (Allman (2004), and Personal Communications: (October 2004), (September 2006)). This group has informed NECAP management about the recent research in the use of larger print fonts and the abacus as standard accommodations for students with severe visual impairments. This consultation has directly impacted test development and has resulted in positive feedback from the stakeholders who represent students with visual impairment in our states. In addition, all three states work closely with stakeholders representing students with hearing impairment and deafness to help inform test item development and improved access to test items for students with vision or hearing impairments. An example of this commitment is contained in two focus group reports prepared by the New Hampshire Department of Education; a February 2006 focus group report from NH Teachers of the Visually Impaired (TVI) on NECAP Test Accessibility for Students with Severe Visual Impairment and a May 2006 report on the performance of English language learners and students with disabilities for the on the Grade 10 New Hampshire Educational Improvement & Assessment Program (NHEIAP). The latter of these two reports addressed computer-based read aloud accommodation for mathematics assessment. (Both Focus Group Reports are available from the New Hampshire Department of Education).
NECAP states are also pursuing other grant–funded research to support and explore development of new comparable accommodations that might provide meaningful access to general assessment at grade level for students who currently take only alternate assessments based on alternate achievement standards.
G. Summary of the Evidence - Are NECAP Accommodations Appropriate and Do They Yield
Reasonably Comparable Results?
• Yes, it is clear from the evidence cited in sections 2 A, B, C and D above, that NECAP accommodations are highly consistent with established best practice.
• For accommodations with a consistent research basis available, research evidence suggests that
continued use of the following accommodations in NECAP testing is valid: • Extended time accommodation • Mathematics Read-Aloud Accommodation • Word-to-word translation for ELL students • Use of Computer-Based Read-Aloud Tools ( for mathematics) • Use of Computers to write extended test item responses (NECAP accommodation -D1)
• Preliminary research evidence from The New England Compact Enhanced Assessment Project, presented above (2004), does not appear to support improved student performance with NECAP accommodation D6- Using assistive technology (specifically speech-to-text technology) to dictate open responses via computer. However, if consistently used in classroom settings for students with severe access limitations, sufficient familiarity may be gained to make this a viable accommodation for certain students. Further review of this accommodation by the NECAP management team is recommended.

Appendix D—Appropriateness of Accommodations 13 2008–09 NECAP Science Technical Report
• Early focus group results (NHDOE, May 17, 2006) and trial experience with computer-based read
aloud testing is very promising and merits further research. • NECAP Focus group responses (NHDOE, February 22, 2006) from Teachers of the Visually
Impaired support existing NECAP accommodations and are helping inform improvement in other aspects of universal design of items, test booklets and materials.
• Structured DIF analysis of the performance of NECAP accommodations is in an early and
inconclusive phase. Currently, development of other increasingly useful accommodations data analysis designs is going forward and is supported by all NECAP states. The NECAP Technical Advisory Committee (TAC) will continue to explore this line of inquiry in the future.
• As each yearly cycle of large scale NECAP DIF item analysis allows the group to gain insight and to
clarify questions, the design of future DIF data collection may be refined to more fully inform item selection to improve the fairness and accessibility of NECAP assessment items. This exploration is highly valued by the NECAP management group and will continue to be supported. Limitations in this kind of statistical analysis will continue to occur when sample sizes are too small to draw reliable or useful conclusions.
• NECAP states are developing an ongoing review and improvement process for the NECAP
accommodations policy and procedures. Concluding Comment:
NECAP Commitment to Universal Design and Continuous Improvement. The NECAP management group has made a solid commitment to continuously improve and strengthen the universal design of our assessment instruments. As the quality of universal design elements of the NECAP assessment continues to improve, it is conceivable that the number of students who need to use accommodations may decline. In fact, this is a worthy goal. Although this would cause diminishing sample sizes and challenges for accommodations analysis, declining use of accommodations due to improved universal accessibility in overall test design would be viewed as a very positive outcome.
Since its inception in 2003, the NECAP group has supported and funded research and development in accommodations policy and procedures. This is evidenced by the many research activities generated through the multiple Enhanced Assessment Grants of the three participating states referenced earlier in this report.
The NECAP group has shown leadership in obtaining funding and actively supporting accommodations and related research in a number of areas:
1. Describing the performance of students in the assessment gap and exploring alternate ways of assessing students performing below proficient levels (see: New England Compact Enhanced Assessment Project: Task Module Assessment System- Closing the Gap in Assessments),
2. Research in the design and use of accommodations (New England Compact Enhanced Assessment Project: Using Computers to Improve Test Design and Support Students with Disabilities and English-Language Learners),
3. The relationships among and between elements of English language proficiency test scores, academic language competency scores, and performance on NECAP academic content tests (Parker, C. (2007)),
4. Defining and developing technical adequacy in alternate assessments (NHEAI Grant), 5. Developing improved accommodations that will foster increased participation in general assessment
for students currently alternately assessed (Jorgensen & McSheehan, (2006)), and

Appendix D—Appropriateness of Accommodations 14 2008–09 NECAP Science Technical Report
6. All three NECAP states are partners in the ongoing development of the new ACCESS for ELLsTM Test of English Language Proficiency. The Vermont Test Director is a member of the Technical Advisory Committee
The NECAP Development Team has been very busy. These efforts are ongoing and will continue. We are committed to the long-term development of a well validated and highly accessible assessment program that meets the highest possible standards of quality. More importantly, we are committed to the establishment of an assessment system that effectively supports the growth of each and every one of our students.
References
Abedi, J. (2006) Validity, effectiveness and feasibility of accommodations for English language learners with disabilities (ELLWD). Paper presented at the Accommodating Students with Disabilities on State Assessments: What Works Conference, Savannah, GA.
Allman, C.B., (Ed.). (2004) Test Access: Making Tests Accessible for Students with Visual Impairments. Louisville, KY: American Printing House for the Blind, Inc.
American Printing House for the Blind, Inc., Accessible Tests Division Staff, (personal communication, October 2004)
American Printing House for the Blind, Inc., Accessible Tests Division Staff, (personal communication, September 2006)
Dolan, R. (2004) Computer Accommodations Must Begin As Classroom Accommodation: The New England Compact Enhanced Assessment Project: Using Computers to Improve Test Design and Support Students with Disabilities and English-Language Learners. ©1994-2007 by Education Development Center, Inc. All Rights Reserved. www.necompact.org/research.asp
Elbaum, B., Aguelles, M.E., Campbell, Y., & Saleh, M.B. (2004). Effects of a student-reads-aloud accommodation on the performance of students with and without learning disabilities on a test of reading comprehension. Exceptionality, 12(2), 71-87.
Elliott, J., Thurlow, M., & Ysseldyke, J. (1996) Assessment guidelines that maximize the participation of students with disabilities in large-scale assessments: Characteristics and considerations, Synthesis report 25. Minneapolis, MN: University of Minnesota, National Center on Educational Outcomes.
Frances, D.J. (2006). Practical guidelines for the education of English language learners. Paper presented at the 2006 LEP Partnership Meeting. Washington, DC. Presentation retrieved December 21, 2006, from www.centeroninstruction.org.
Higgins, J., Russell, M., & Hoffmann, T., (2004) Examining the Effect of Computer-Based Passage Presentation on Reading Test Performance: Part of the New England Compact Enhanced Assessment Project. Boston, MA, in Technology Assessment Study Collaborative (inTASC), Boston College
Higgins, J., Russell, M., & Hoffmann, T., (2004) Examining the Effect of Text Editor and Robust Word Processor on Student Writing Test Performance: Part of the New England Compact Enhanced Assessment Project. Boston, MA, in Technology Assessment Study Collaborative (inTASC), Boston College (http://www.bc.edu/research/intasc/publications.shtml)
Johnstone, C.J, Altman, J., Thurlow, M.L., & Thompson, S.J. (2006): A summary of research on the effects of test accommodations: 2002-2004: Synthesis Report 45. Minneapolis, MN: University of Minnesota, National Center on Educational Outcomes.
Jorgensen, C. & McSheehan, M. (2006) Beyond Access for Assessment Accommodations, General Supervision Enhancement Grant Research (in progress) supported by the US Education Department, Office of Special Education Research, Washington, DC.

Appendix D—Appropriateness of Accommodations 15 2008–09 NECAP Science Technical Report
Miranda, H., Russell, M., & Hoffmann, T., (2004) Examining the Feasibility and Effect of a Computer-Based Read-Aloud Accommodation on Mathematics Test Performance: Part of the New England Compact Enhanced Assessment Project. Boston, MA, in Technology Assessment Study Collaborative (inTASC), Boston College (http://www.bc.edu/research/intasc/publications.shtml)
Miranda, H., Russell, M., Seeley, K., Hoffman, T., (2004) Examining the Feasibility and Effect of Computer-Based Verbal Response to Open-Ended Reading Comprehension Test Items: Part of the New England Compact Enhanced Assessment Project. •Boston, MA, in Technology Assessment Study Collaborative (inTASC), Boston College (http://www.bc.edu/research/intasc/publications.shtml)
Parker, C. Deepening Analysis of Large-Scale Assessment Data: Understanding the results for English language learners, Study in progress (2007). Project funded by the U.S. Department of Education, Office of Educational Research and Improvement. www.relnei.org
Quenemoen, R. (2007). New Hampshire Enhanced Assessment Initiative (NHEAI): Knowing What Students with Severe Cognitive Disabilities Know... Research (in progress) supported by the US Education Department, Office of Elementary and Secondary Education, Washington, DC.
Sireci, S.G., Li, S., & Scarpati, S. (2005). Test accommodations for students with disabilities: An analysis of the interaction hypothesis. Review of Educational Research, 75 (4), 457-490.
Sireci, S.G. and Pitoniak, M.J. (2006). Assessment accommodations: What have we learned from research? Paper presented at the Accommodating Students with Disabilities on State Assessments: What Works Conference, Savannah, GA.
The New England Compact Enhanced Assessment Project: Using Computers to Improve Test Design and Support Students with Disabilities and English-Language Learners. ©1994-2007 by Education Development Center, Inc. All Rights Reserved. www.necompact.org/research.asp
The New England Compact Enhanced Assessment Project: Task Module Assessment System. ©1994-2007 by Education Development Center, Inc. All Rights Reserved. www.necompact.org/research.asp
Thompson, S.J., Blount, A., & Thurlow, M.L. (2002): A summary of research on the effects of test accommodations 1999-2001, Technical Report 34. Minneapolis, MN: University of Minnesota, National Center on Educational Outcomes.
Thompson, S.J., Johnstone, C.J., & Thurlow, M.L. (2002): Universal design applied to large-scale assessments: Synthesis Report 44. Minneapolis, MN: University of Minnesota, National Center on Educational Outcomes.
Additional Resources:
Rhode Island Department of Education, NECAP Assessment Website:
www.ride.ri.gov/assessment/NECAP.aspx
Vermont Department of Education, NECAP Assessment Website: http://education.vermont.gov/new/html/pgm_assessment.html
New Hampshire Department of Education, NECAP Assessment Website: www.ed.state.nh.us/NECAP


Appendix F—IRT Calibration Results 1 2008–09 NECAP Science Technical Report
Appendix F—ITEM RESPONSE THEORY CALIBRATION RESULTS


Appendix F—IRT Calibration Results 3 2008–09 NECAP Science Technical Report
Table F-1. 2008–09 NECAP Science: IRT Item Parameters for Multiple-Choice Items, Grade 4
Parameters Item Number a b c
47997 0.78 -1.71 0.19 60342 0.89 -0.36 0.40 60381 0.58 -0.63 0.20 60292 0.77 -0.68 0.15 61936 0.81 -0.23 0.17 50391 1.26 -0.72 0.27 48013 0.72 0.94 0.22 47614 0.90 -0.32 0.25 60373 0.47 0.21 0.11 49875 0.65 -0.03 0.21 60389 0.61 -0.33 0.18 46525 0.69 -1.95 0.00 59429 0.67 -1.32 0.08 46416 0.67 -0.17 0.21 61931 0.72 -0.95 0.15 46310 0.36 -2.70 0.12 59423 0.64 -1.95 0.13 135360 0.55 -1.85 0.00 59267 0.43 -0.78 0.10 59430 0.44 -0.43 0.09 46274 0.53 -0.60 0.11 46463 0.87 0.38 0.25 51273 0.77 -1.95 0.11 47490 0.64 -0.68 0.16 59919 0.37 -2.47 0.00 47357 0.63 1.54 0.21 49894 0.83 -0.24 0.16 59915 0.82 -0.89 0.14 49861 0.45 -2.28 0.00 47471 0.49 -0.15 0.13 59940 0.82 -0.79 0.19 50449 0.73 0.14 0.21 47346 0.81 0.11 0.14
a = discrimination; b = difficulty; c = guessing
Table F-2. 2008–09 NECAP Science: IRT Item Parameters for Open-Response Items, Grade 4
Parameters Item Number a b D1 D2 D3 D4
60403 0.61 0.12 2.62 0.90 -0.74 -2.78 72768 0.60 -0.82 2.12 1.06 -0.75 -2.43 135358 0.86 -0.36 2.72 0.74 -0.85 -2.61
a = discrimination; b = difficulty; D1 = 1st category step parameter; D2 = 2nd category step parameter; D3 = 3rd category step parameter; D4 = 4th category step parameter

Appendix F—IRT Calibration Results 4 2008–09 NECAP Science Technical Report
Figure F-1 2008–09 NECAP Science: Test Characteristic Curve (TCC), Grade 4
Figure F-2 2008–09 NECAP Science: Test Information Function (TIF), Grade 4

Appendix F—IRT Calibration Results 7 2008–09 NECAP Science Technical Report
Table F-3. 2008–09 NECAP Science: IRT Item Parameters for Multiple-Choice Items, Grade 8
Parameters Item Number a b c
59722 0.66 0.72 0.20 50133 0.47 -1.98 0.00 59952 0.65 1.04 0.21 60320 0.65 -1.24 0.10 47870 0.62 -0.46 0.06 47903 0.97 0.91 0.17 59736 1.24 0.94 0.18 59965 1.08 0.59 0.27 59813 0.93 0.34 0.23 48343 0.74 0.23 0.16 59731 1.07 0.29 0.22 60033 0.67 -0.47 0.23 60114 0.64 -0.78 0.14 50151 1.20 -0.17 0.20 60019 1.11 1.22 0.26 60034 0.80 1.11 0.29 46090 0.41 -0.04 0.11 46045 0.74 0.88 0.12 46085 0.87 -0.55 0.21 60047 0.72 -0.04 0.21 46056 0.67 1.87 0.24 60048 0.98 -0.62 0.18 58385 1.23 -0.82 0.26 48269 0.91 0.65 0.28 58402 0.84 -0.04 0.21 58357 0.82 -0.23 0.13 58347 0.87 0.67 0.14 58373 0.88 0.58 0.21 58375 1.30 -0.19 0.20 58392 0.66 1.78 0.26 58316 1.69 0.13 0.23 58374 0.58 -0.52 0.13 48317 0.96 1.09 0.17
a = discrimination; b = difficulty; c = guessing
Table F-4. 2008–09 NECAP Science: IRT Item Parameters for Open-Response Items, Grade 8
Parameters Item Number a b D1 D2 D3 D4
135348 0.97 0.74 0.95 0.16 -0.27 -0.84 60009 0.81 0.77 2.18 0.67 -0.82 -2.02 48319 0.93 0.86 1.61 0.53 -0.45 -1.69
a = discrimination; b = difficulty; D1 = 1st category step parameter; D2 = 2nd category step parameter; D3 = 3rd category step parameter; D4 = 4th category step parameter

Appendix F—IRT Calibration Results 8 2008–09 NECAP Science Technical Report
Figure F-3 2008–09 NECAP Science: Test Characteristic Curve (TCC), Grade 8
Figure F-4 2008–09 NECAP Science: Test Information Function (TIF), Grade 8

Appendix F—IRT Calibration Results 10 2008–09 NECAP Science Technical Report
Table F-5. 2008–09 NECAP Science: IRT Item Parameters for Multiple-Choice Items, Grade 11
Parameters Item Number a b c
49914 1.04 -1.01 0.16 60181 0.25 -1.31 0.00 60116 0.94 0.39 0.23 60199 0.31 0.60 0.16 60135 1.54 0.47 0.27 47937 0.54 1.69 0.31 61807 0.48 0.56 0.20 48911 1.73 0.69 0.31 48002 0.58 -0.17 0.20 67694 0.84 -0.12 0.23 49916 1.27 1.09 0.24
146733 0.64 0.18 0.18 59666 1.01 1.75 0.30 46161 0.49 0.09 0.11 46139 0.45 -1.32 0.00 46040 0.80 1.25 0.32 46173 0.82 0.62 0.18 46187 0.58 0.98 0.23 59605 0.70 -1.29 0.14
135344 0.21 -0.84 0.00 61836 0.59 0.08 0.21 59662 1.02 0.83 0.19 48409 0.82 0.19 0.27 48147 0.56 0.13 0.15 49908 0.61 0.50 0.15 48425 0.48 1.25 0.16 61126 1.46 -0.67 0.23 59038 0.68 0.97 0.24 62083 1.11 0.09 0.23 60696 0.64 0.37 0.18 48406 1.46 0.87 0.31 61150 0.67 -0.93 0.00
135357 0.94 0.35 0.18 a = discrimination; b = difficulty; c = guessing
Table F-6. 2008–09 NECAP Science: IRT Item Parameters for Open-Response Items, Grade 11
Parameters Item Number a b D1 D2 D3 D4
47986 0.98 -0.16 2.08 0.79 -0.68 -2.19 59987 1.08 0.75 1.14 0.42 -0.27 -1.29 135340 0.99 1.38 2.05 0.69 -0.72 -2.02
a = discrimination; b = difficulty; D1 = 1st category step parameter; D2 = 2nd category step parameter; D3 = 3rd category step parameter; D4 = 4th category step parameter

Appendix F—IRT Calibration Results 11 2008–09 NECAP Science Technical Report
Figure F-5 2008–09 NECAP Science: Test Characteristic Curve (TCC) Grade 11
Figure F-6 2008–09 NECAP Science: Test Information Function (TIF), Grade 11

Appendix G—Delta and Rescore Analyses Results 2008–09 NECAP Science Technical Report 1
Appendix G—DELTA AND RESCORE ANALYSES RESULTS

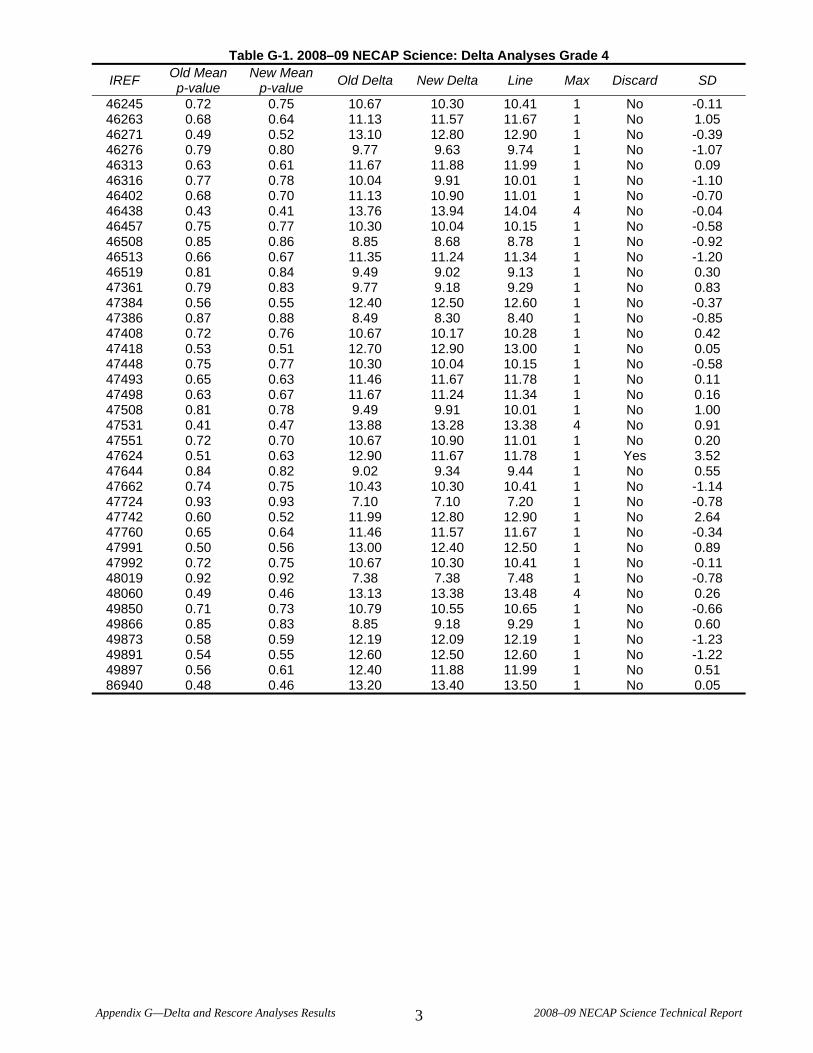
Appendix G—Delta and Rescore Analyses Results 2008–09 NECAP Science Technical Report 3
Table G-1. 2008–09 NECAP Science: Delta Analyses Grade 4
IREF Old Mean p-value
New Mean p-value Old Delta New Delta Line Max Discard SD
46245 0.72 0.75 10.67 10.30 10.41 1 No -0.11 46263 0.68 0.64 11.13 11.57 11.67 1 No 1.05 46271 0.49 0.52 13.10 12.80 12.90 1 No -0.39 46276 0.79 0.80 9.77 9.63 9.74 1 No -1.07 46313 0.63 0.61 11.67 11.88 11.99 1 No 0.09 46316 0.77 0.78 10.04 9.91 10.01 1 No -1.10 46402 0.68 0.70 11.13 10.90 11.01 1 No -0.70 46438 0.43 0.41 13.76 13.94 14.04 4 No -0.04 46457 0.75 0.77 10.30 10.04 10.15 1 No -0.58 46508 0.85 0.86 8.85 8.68 8.78 1 No -0.92 46513 0.66 0.67 11.35 11.24 11.34 1 No -1.20 46519 0.81 0.84 9.49 9.02 9.13 1 No 0.30 47361 0.79 0.83 9.77 9.18 9.29 1 No 0.83 47384 0.56 0.55 12.40 12.50 12.60 1 No -0.37 47386 0.87 0.88 8.49 8.30 8.40 1 No -0.85 47408 0.72 0.76 10.67 10.17 10.28 1 No 0.42 47418 0.53 0.51 12.70 12.90 13.00 1 No 0.05 47448 0.75 0.77 10.30 10.04 10.15 1 No -0.58 47493 0.65 0.63 11.46 11.67 11.78 1 No 0.11 47498 0.63 0.67 11.67 11.24 11.34 1 No 0.16 47508 0.81 0.78 9.49 9.91 10.01 1 No 1.00 47531 0.41 0.47 13.88 13.28 13.38 4 No 0.91 47551 0.72 0.70 10.67 10.90 11.01 1 No 0.20 47624 0.51 0.63 12.90 11.67 11.78 1 Yes 3.52 47644 0.84 0.82 9.02 9.34 9.44 1 No 0.55 47662 0.74 0.75 10.43 10.30 10.41 1 No -1.14 47724 0.93 0.93 7.10 7.10 7.20 1 No -0.78 47742 0.60 0.52 11.99 12.80 12.90 1 No 2.64 47760 0.65 0.64 11.46 11.57 11.67 1 No -0.34 47991 0.50 0.56 13.00 12.40 12.50 1 No 0.89 47992 0.72 0.75 10.67 10.30 10.41 1 No -0.11 48019 0.92 0.92 7.38 7.38 7.48 1 No -0.78 48060 0.49 0.46 13.13 13.38 13.48 4 No 0.26 49850 0.71 0.73 10.79 10.55 10.65 1 No -0.66 49866 0.85 0.83 8.85 9.18 9.29 1 No 0.60 49873 0.58 0.59 12.19 12.09 12.19 1 No -1.23 49891 0.54 0.55 12.60 12.50 12.60 1 No -1.22 49897 0.56 0.61 12.40 11.88 11.99 1 No 0.51 86940 0.48 0.46 13.20 13.40 13.50 1 No 0.05

Appendix G—Delta and Rescore Analyses Results 2008–09 NECAP Science Technical Report 4
Table G-2. 2008–09 NECAP Science: Delta Analyses Grade 8
IREF Old Mean p-value
New Mean p-value Old Delta New Delta Line Max Discard SD
46016 0.70 0.68 10.90 11.13 11.22 1 No 0.83 46026 0.70 0.70 10.90 10.90 11.00 1 No -0.55 46039 0.45 0.45 13.55 13.55 13.58 4 No -0.97 46041 0.46 0.46 13.40 13.40 13.43 1 No -0.94 46046 0.70 0.70 10.90 10.90 11.00 1 No -0.55 46070 0.47 0.45 13.30 13.50 13.53 1 No 0.30 46072 0.65 0.71 11.46 10.79 10.89 1 No 2.43 46074 0.59 0.58 12.09 12.19 12.26 1 No -0.11 46082 0.57 0.59 12.29 12.09 12.16 1 No -0.28 46089 0.69 0.68 11.02 11.13 11.22 1 No 0.12 46106 0.51 0.51 12.90 12.90 12.95 1 No -0.86 46109 0.39 0.40 14.12 14.01 14.03 1 No -0.61 47790 0.81 0.81 9.49 9.49 9.62 1 No -0.32 48184 0.68 0.70 11.13 10.90 11.00 1 No -0.33 48228 0.64 0.66 11.57 11.35 11.44 1 No -0.33 48245 0.73 0.74 10.55 10.43 10.54 1 No -1.06 48267 0.62 0.65 11.78 11.46 11.54 1 No 0.33 48268 0.60 0.59 11.99 12.09 12.16 1 No -0.09 48276 0.42 0.37 13.78 14.35 14.36 4 No 2.48 48297 0.48 0.52 13.20 12.80 12.85 1 No 1.06 48421 0.53 0.55 12.70 12.50 12.55 1 No -0.24 48445 0.48 0.48 13.20 13.20 13.24 1 No -0.91 48456 0.40 0.42 14.01 13.81 13.83 1 No 0.00 48472 0.83 0.84 9.18 9.02 9.17 1 No -1.04 48563 0.69 0.72 11.02 10.67 10.77 1 No 0.39 49988 0.82 0.82 9.34 9.34 9.47 1 No -0.30 49990 0.50 0.52 13.00 12.80 12.85 1 No -0.20 50012 0.66 0.64 11.35 11.57 11.65 1 No 0.70 50016 0.83 0.84 9.18 9.02 9.17 1 No -1.04 50026 0.67 0.62 11.24 11.78 11.85 1 No 2.67 50120 0.49 0.48 13.10 13.20 13.24 1 No -0.28 50138 0.80 0.81 9.63 9.49 9.62 1 No -1.07 50145 0.67 0.69 11.24 11.02 11.11 1 No -0.33 50511 0.80 0.83 9.63 9.18 9.32 1 No 0.79 76623 0.48 0.49 13.20 13.10 13.14 1 No -0.77 76626 0.64 0.66 11.57 11.35 11.44 1 No -0.33 86817 0.28 0.28 15.33 15.33 15.32 1 No -1.05 90278 0.37 0.42 14.35 13.83 13.86 4 No 1.97 90304 0.58 0.56 12.19 12.40 12.45 1 No 0.49

Appendix G—Delta and Rescore Analyses Results 2008–09 NECAP Science Technical Report 5
Table G-3. 2008–09 NECAP Science: Delta Analyses Grade 11
IREF Old Mean p-value
New Mean p-value Old Delta New Delta Line Max Discard SD
46019 0.41 0.46 13.91 13.40 13.52 1 No 1.00 46094 0.53 0.50 12.70 13.00 13.10 1 No 1.10 46096 0.53 0.50 12.70 13.00 13.10 1 No 1.10 46099 0.29 0.35 15.21 14.60 14.76 4 No 1.38 46121 0.79 0.81 9.77 9.49 9.46 1 No 0.58 46148 0.58 0.61 12.19 11.88 11.94 1 No 0.17 46154 0.70 0.69 10.90 11.02 11.04 1 No -0.47 46166 0.54 0.55 12.60 12.50 12.58 1 No -1.22 46167 0.36 0.39 14.43 14.12 14.27 1 No -0.31 46179 0.65 0.66 11.46 11.35 11.39 1 No -0.91 47792 0.70 0.71 10.90 10.79 10.81 1 No -0.73 47829 0.40 0.39 14.01 14.12 14.27 1 No 0.19 47884 0.70 0.65 10.90 11.46 11.50 1 No 2.26 47896 0.57 0.58 12.29 12.19 12.27 1 No -1.14 47901 0.24 0.25 15.83 15.67 15.87 4 No -1.02 47917 0.51 0.52 12.90 12.80 12.90 1 No -1.29 47930 0.37 0.37 14.33 14.33 14.48 1 No -0.38 48005 0.51 0.55 12.90 12.50 12.58 1 No 0.58 48071 0.60 0.58 11.99 12.19 12.27 1 No 0.35 48156 0.79 0.77 9.77 10.04 10.03 1 No 0.24 48175 0.73 0.72 10.55 10.67 10.68 1 No -0.51 48216 0.46 0.48 13.40 13.20 13.31 1 No -0.78 48357 0.36 0.35 14.43 14.54 14.71 1 No 0.31 48372 0.31 0.36 14.98 14.43 14.59 1 No 1.01 48415 0.30 0.30 15.10 15.10 15.28 1 No -0.21 48416 0.73 0.73 10.55 10.55 10.56 1 No -1.26 48543 0.48 0.50 13.20 13.00 13.10 1 No -0.74 48908 0.61 0.58 11.88 12.19 12.27 1 No 0.97 48921 0.56 0.57 12.40 12.29 12.37 1 No -1.17 49902 0.45 0.46 13.50 13.40 13.52 1 No -1.20 49903 0.65 0.64 11.46 11.57 11.62 1 No -0.38 49922 0.59 0.62 12.09 11.78 11.84 1 No 0.20 49925 0.59 0.61 12.09 11.88 11.94 1 No -0.44 49930 0.31 0.28 14.98 15.33 15.53 1 No 1.92 49931 0.66 0.70 11.35 10.90 10.93 1 No 1.21 49934 0.83 0.83 9.18 9.18 9.14 1 No -1.05 49935 0.65 0.65 11.46 11.46 11.50 1 No -1.05 89507 0.39 0.45 14.17 13.50 13.63 4 No 1.92 89654 0.65 0.67 11.46 11.24 11.28 1 No -0.23

Appendix G—Delta and Rescore Analyses Results 2008–09 NECAP Science Technical Report 6
Table G-4. 2008–09 NECAP Science: Rescore Analyses, Grade 4
IREF
Maximum number of points
Old mean p-value
New mean p-value Old SD New SD
Effect size Discard
48060 4 2.12 2.08 1.20 1.20 -0.04 No 46438 4 1.70 1.60 1.22 1.29 -0.08 No 47531 4 1.96 1.95 1.16 1.15 -0.01 No
SD = standard deviation
Table G-5. 2008–09 NECAP Science: Rescore Analyses, Grade 8
IREF
Maximum number of
points Old mean p-value
New mean p-value Old SD New SD
Effect size Discard
90278 4 1.38 1.37 1.42 1.42 -0.01 No 46039 4 1.76 1.69 1.01 1.05 -0.07 No 48276 4 1.58 1.43 1.15 1.14 -0.13 No
SD = standard deviation
Table G-6. 2008–09 NECAP Science: Rescore Analyses, Grade 11
IREF
Maximum number of
points Old mean p-value
New mean p-value Old SD New SD Effect size Discard
47901 4 1.19 1.14 1.13 1.07 -0.05 No 46099 4 1.22 1.07 0.82 0.78 -0.18 No 89507 4 1.72 1.89 1.03 1.02 0.17 No
SD = standard deviation

Appendix H—Raw to Scaled Score Lookup Tables 1 2008–09 NECAP Science Technical Report
Appendix H—RAW TO SCALED SCORE LOOKUP TABLES


Appendix H—Raw to Scaled Score Lookup Tables 3 2008–09 NECAP Science Technical Report
Table H-1. 2008–09 NECAP Science: Scaled Score Lookup, Grade 4 Error band Raw
score θ Scaled score Lower
bound Upper bound
Achievement level
0 -6.98 400 400 410 1 1 -6.56 400 400 410 1 2 -6.13 400 400 410 1 3 -5.71 400 400 410 1 4 -5.29 400 400 410 1 5 -4.87 400 400 410 1 6 -4.45 400 400 408 1 7 -4.03 400 400 407 1 8 -3.52 400 405 411 1 9 -3.14 403 408 413 1 10 -2.83 407 412 417 1 11 -2.57 409 414 419 1 12 -2.34 412 416 420 1 13 -2.13 414 418 422 1 14 -1.94 416 420 424 1 15 -1.77 418 422 426 1 16 -1.60 420 424 428 1 17 -1.45 421 425 429 1 18 -1.30 423 426 430 1 19 -1.16 425 428 431 2 20 -1.02 426 429 432 2 21 -0.89 428 431 434 2 22 -0.75 429 432 435 2 23 -0.62 430 433 436 2 24 -0.49 432 435 438 2 25 -0.36 433 436 439 2 26 -0.23 434 437 440 2 27 -0.09 436 439 442 2 28 0.05 436 439 442 2 29 0.19 438 441 444 3 30 0.34 440 443 446 3 31 0.50 442 445 448 3 32 0.68 443 446 450 3 33 0.87 444 448 452 3 34 1.07 446 450 454 3 35 1.31 448 452 456 3 36 1.57 451 455 459 3 37 1.89 454 458 463 3 38 2.28 457 462 467 3 39 2.79 462 467 473 4 40 3.59 468 475 480 4 41 4.00 472 480 480 4

Appendix H—Raw to Scaled Score Lookup Tables 4 2008–09 NECAP Science Technical Report
Table H-2. 2008–09 NECAP Science: Scaled Score Lookup, Grade 8 Error band Raw
score θ Scaled score Lower
bound Upper bound
Achievement level
0 -10.06 800 800 810 1 1 -9.18 800 800 810 1 2 -8.31 800 800 810 1 3 -7.43 800 800 810 1 4 -6.56 800 800 810 1 5 -5.69 800 800 810 1 6 -4.81 800 800 810 1 7 -3.90 800 801 811 1 8 -3.04 801 808 815 1 9 -2.57 806 812 818 1 10 -2.24 810 815 820 1 11 -1.98 813 817 821 1 12 -1.77 815 819 823 1 13 -1.59 816 820 824 1 14 -1.43 819 822 826 1 15 -1.28 820 823 826 1 16 -1.15 821 824 827 1 17 -1.03 822 825 828 1 18 -0.92 823 826 829 1 19 -0.81 824 827 830 1 20 -0.71 825 828 831 1 21 -0.62 825 828 831 1 22 -0.53 827 829 832 2 23 -0.44 828 830 833 2 24 -0.35 829 831 833 2 25 -0.27 829 831 833 2 26 -0.19 830 832 834 2 27 -0.11 831 833 835 2 28 -0.03 831 833 835 2 29 0.05 832 834 836 2 30 0.12 833 835 837 2 31 0.20 833 835 837 2 32 0.27 834 836 838 2 33 0.35 835 837 839 2 34 0.42 835 837 839 2 35 0.50 836 838 840 2 36 0.57 836 838 840 2 37 0.65 837 839 841 2 38 0.72 837 839 841 2 39 0.80 838 840 842 3 40 0.88 839 841 843 3 41 0.96 840 842 844 3 42 1.04 840 842 844 3 43 1.12 841 843 845 3 44 1.21 842 844 846 3 45 1.30 843 845 847 3 46 1.39 843 845 847 3
continued

Appendix H—Raw to Scaled Score Lookup Tables 5 2008–09 NECAP Science Technical Report
Error band Raw score θ Scaled
score Lower bound
Upper bound
Achievement level
47 1.48 844 846 849 3 48 1.58 845 847 850 3 49 1.68 845 848 851 3 50 1.79 846 849 852 3 51 1.90 847 850 853 3 52 2.02 848 851 854 3 53 2.15 849 852 855 3 54 2.29 850 853 856 3 55 2.45 851 854 857 3 56 2.61 853 856 860 4 57 2.80 853 857 861 4 58 3.02 855 859 863 4 59 3.28 857 861 865 4 60 3.60 859 864 869 4 61 4.00 861 867 873 4 62 4.00 861 867 873 4 63 4.00 874 880 880 4

Appendix H—Raw to Scaled Score Lookup Tables 6 2008–09 NECAP Science Technical Report
Table H-3. 2008–09 NECAP Science: Scaled Score Lookup, Grade 11 Error band Raw
score θ Scaled score Lower
bound Upper bound
Achievement level
0 -10.69 1100 1100 1110 1 1 -9.64 1100 1100 1110 1 2 -8.59 1100 1100 1110 1 3 -7.55 1100 1100 1110 1 4 -6.50 1100 1100 1110 1 5 -5.46 1100 1100 1110 1 6 -4.41 1100 1100 1110 1 7 -3.27 1100 1106 1114 1 8 -2.64 1105 1111 1117 1 9 -2.24 1110 1115 1120 1 10 -1.95 1113 1117 1121 1 11 -1.71 1115 1119 1123 1 12 -1.51 1118 1121 1125 1 13 -1.34 1119 1122 1125 1 14 -1.18 1121 1124 1127 1 15 -1.04 1122 1125 1128 1 16 -0.91 1123 1126 1129 1 17 -0.79 1124 1127 1130 1 18 -0.68 1126 1128 1131 1 19 -0.57 1127 1129 1132 1 20 -0.47 1127 1129 1131 1 21 -0.37 1128 1130 1132 2 22 -0.27 1129 1131 1133 2 23 -0.18 1130 1132 1134 2 24 -0.09 1131 1133 1135 2 25 0.00 1131 1133 1135 2 26 0.09 1132 1134 1136 2 27 0.17 1133 1135 1137 2 28 0.26 1134 1136 1138 2 29 0.34 1134 1136 1138 2 30 0.42 1135 1137 1139 2 31 0.51 1136 1138 1140 2 32 0.59 1136 1138 1140 2 33 0.67 1137 1139 1141 2 34 0.75 1137 1139 1141 2 35 0.83 1138 1140 1142 3 36 0.92 1139 1141 1143 3 37 1.00 1140 1142 1144 3 38 1.09 1141 1143 1145 3 39 1.18 1141 1143 1145 3 40 1.28 1142 1144 1146 3 41 1.37 1143 1145 1147 3 42 1.47 1144 1146 1148 3 43 1.58 1145 1147 1149 3 44 1.69 1146 1148 1150 3 45 1.81 1147 1149 1152 3 46 1.94 1147 1150 1153 3
continued
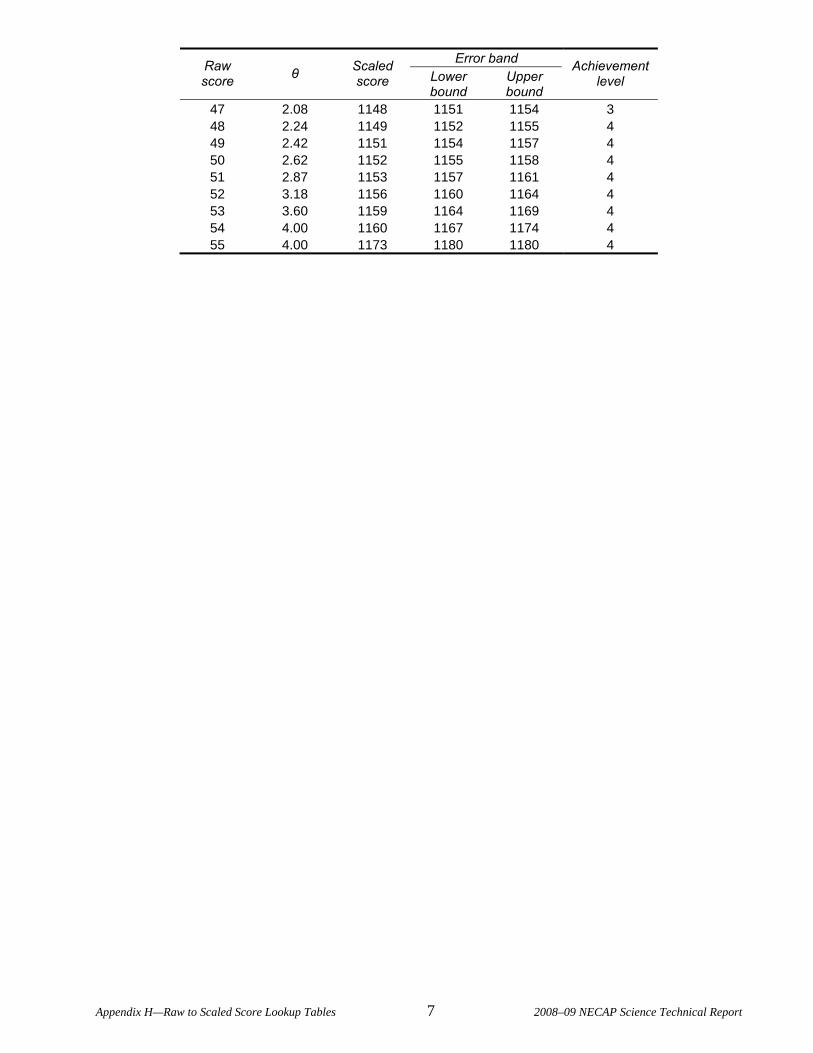
Appendix H—Raw to Scaled Score Lookup Tables 7 2008–09 NECAP Science Technical Report
Error band Raw score θ Scaled
score Lower bound
Upper bound
Achievement level
47 2.08 1148 1151 1154 3 48 2.24 1149 1152 1155 4 49 2.42 1151 1154 1157 4 50 2.62 1152 1155 1158 4 51 2.87 1153 1157 1161 4 52 3.18 1156 1160 1164 4 53 3.60 1159 1164 1169 4 54 4.00 1160 1167 1174 4 55 4.00 1173 1180 1180 4


Appendix I—Scaled Score Percentages and Cumulative Percentages 1 2008–09 NECAP Science Technical Report
Appendix I—SCALED SCORE PERCENTAGES AND
CUMULATIVE PERCENTAGES


Appendix I—Scaled Score Percentages and Cumulative Percentages 3 2008–09 NECAP Science Technical Report
Table I-1. 2008–09 NECAP Science: Scaled Score Percentages and Cumulative Percentages—Grade 4
Scaled score Percent Cumulative
percent 400 0.2 0.2 401 0.1 0.4 404 0.2 0.6 407 0.2 0.7 409 0.3 1.0 411 0.3 1.3 413 0.4 1.8 414 0.5 2.2 416 0.5 2.7 417 0.6 3.3 419 0.7 4.1 420 0.9 4.9 421 1.0 5.9 422 1.0 7.0 423 1.2 8.2 425 1.2 9.4 426 3.0 12.4 428 1.7 14.2 429 1.9 16.1 430 4.5 20.6 431 2.4 23.0 432 2.5 25.6 433 2.6 28.2 434 2.8 31.0 435 3.1 34.1 436 3.2 37.3 437 3.3 40.6 438 3.5 44.2 439 7.1 51.2 441 3.9 55.1 442 3.9 59.1 443 3.9 63.0 444 4.1 67.1 445 3.9 71.0 446 3.9 74.9 447 3.6 78.5 448 3.6 82.1 449 3.3 85.3 450 0.0 85.3 451 3.0 88.4 452 2.7 91.0 453 2.4 93.4 455 2.0 95.4 457 1.7 97.1 458 1.2 98.3 460 0.8 99.0 462 0.5 99.6 465 0.3 99.8 468 0.1 99.9 471 0.0 100.0 475 0.0 100.0 479 0.0 100.0

Appendix I—Scaled Score Percentages and Cumulative Percentages 4 2008–09 NECAP Science Technical Report
Table I-2. 2008–09 NECAP Science: Scaled Score Percentages and Cumulative Percentages—Grade 8
Scaled score Percent Cumulative
percent 800 0.9 0.9 801 0.7 1.6 808 0.9 2.5 812 1.1 3.6 815 1.4 5.0 817 1.5 6.5 819 1.7 8.2 820 1.8 10.0 822 2.0 12.0 823 2.1 14.1 824 2.1 16.2 825 2.3 18.5 826 2.3 20.9 827 2.5 23.3 828 5.3 28.6 829 2.8 31.4 830 2.9 34.4 831 5.7 40.0 832 3.0 43.0 833 5.9 48.9 834 3.1 52.0 835 6.2 58.2 836 2.9 61.2 837 6.1 67.3 838 5.6 72.9 839 5.2 78.1 840 2.3 80.3 841 2.3 82.6 842 4.2 86.8 843 1.8 88.7 844 1.7 90.4 845 3.0 93.4 846 1.2 94.6 847 1.1 95.7 848 0.9 96.6 849 0.8 97.4 850 0.7 98.0 851 0.5 98.6 852 0.4 99.0 853 0.3 99.3 854 0.2 99.6 856 0.2 99.7 857 0.1 99.9 859 0.1 99.9 861 0.0 100.0 864 0.0 100.0 867 0.0 100.0

Appendix I—Scaled Score Percentages and Cumulative Percentages 5 2008–09 NECAP Science Technical Report
Table I-3. 2008–09 NECAP Science: Scaled Score Percentages and Cumulative Percentages—Grade 11
Scaled score Percent Cumulative
percent 1100 1.1 1.1 1106 0.7 1.9 1111 1.0 2.9 1114 1.2 4.0 1116 1.4 5.4 1118 1.5 6.9 1120 1.6 8.5 1121 2.0 10.5 1123 1.8 12.3 1124 2.0 14.4 1125 2.1 16.5 1126 2.2 18.7 1127 4.8 23.5 1128 2.4 25.9 1129 5.1 31.0 1130 2.7 33.7 1131 2.8 36.5 1132 5.6 42.1 1133 2.9 45.1 1134 5.8 50.8 1135 3.0 53.9 1136 5.8 59.7 1137 5.9 65.6 1138 3.0 68.6 1139 8.3 76.9 1140 2.5 79.4 1141 2.5 81.9 1142 4.5 86.4 1143 3.8 90.2 1144 1.7 91.9 1145 1.6 93.5 1146 2.4 95.9 1147 1.0 96.9 1148 0.7 97.7 1149 0.7 98.4 1150 0.5 98.9 1151 0.4 99.3 1152 0.3 99.5 1153 0.2 99.8 1155 0.1 99.9 1156 0.1 99.9 1158 0.0 100.0 1161 0.0 100.0 1164 0.0 100.0 1167 0.0 100.0


Appendix J—Decision Accuracy and Consistency Results 1 2008–09 NECAP Science Technical Report
Appendix J—DECISION ACCURACY AND CONSISTENCY RESULTS


Appendix J—Decision Accuracy and Consistency Results 2 2008–09 NECAP Science Technical Report
Table J-1. 2008–09 NECAP Science: Decision Accuracy— Crosstabulation of True and Observed achievement level Proportions, Grade 4
True achievement level Observed achievement
level SBP PP P PWD Total
SBP 0.084 0.022 0.000 0.000 0.106 PP 0.028 0.349 0.062 0.000 0.439 P 0.000 0.044 0.386 0.013 0.443
PWD 0.000 0.000 0.002 0.009 0.012 Total 0.112 0.414 0.451 0.022 1.000
SBP = Substantially Below Proficient; PP = Partially Proficient; P = Proficient; PWD = Proficient With Distinction
Table J-2. 2008–09 NECAP Science: Decision Consistency—Crosstabulation of Observed achievement level Proportions for Two Parallel Forms, Grade 4
Form 1 achievement level Form 2 achievement
level SBP PP P PWD Total SBP 0.077 0.035 0.000 0.000 0.112 PP 0.035 0.306 0.073 0.000 0.414 P 0.000 0.073 0.367 0.011 0.451
PWD 0.000 0.000 0.011 0.011 0.022 Total 0.112 0.414 0.451 0.022 1.000
SBP = Substantially Below Proficient; PP = Partially Proficient; P = Proficient; PWD = Proficient With Distinction
Table J-3. 2008–09 NECAP Science: Summary of Overall Accuracy and Consistency Indices—Grade 4
Accuracy 0.828 Consistency 0.761 Kappa (k) 0.609
Table J-4. 2008–09 NECAP Science: Indices Conditional on achievement level—Grade 4
Achievement level Accuracy Consistency SBP 0.793 0.686 PP 0.794 0.738 P 0.872 0.813
PWD 0.796 0.505 SBP = Substantially Below Proficient; PP = Partially Proficient; P = Proficient; PWD = Proficient With Distinction
Table J-5. 2008–09 NECAP Science: Accuracy and Consistency Indices at Cutpoints—Grade 4
Cutpoint Accuracy False positive
False negative Consistency
SBP/PP 0.950 0.022 0.028 0.930 PP/P 0.894 0.062 0.044 0.853
P/PWD 0.985 0.013 0.002 0.978 SBP = Substantially Below Proficient; PP = Partially Proficient; P = Proficient; PWD = Proficient With Distinction False positive = proportion of students with observed score above cutpoint and true score below cutpoint False negative = proportion of students with observed score below cutpoint and true score above cutpoint

Appendix J—Decision Accuracy and Consistency Results 3 2008–09 NECAP Science Technical Report
Table J-6. 2008–09 NECAP Science: Decision Accuracy— Crosstabulation of True and Observed achievement level Proportions—Grade 8
True achievement level Observed achievement
level SBP PP P PWD Total
SBP 0.233 0.043 0.000 0.000 0.276 PP 0.040 0.423 0.050 0.000 0.513 P 0.000 0.027 0.179 0.004 0.211
PWD 0.000 0.000 0.000 0.000 0.000 Total 0.273 0.494 0.230 0.004 1.000
SBP = Substantially Below Proficient; PP = Partially Proficient; P = Proficient; PWD = Proficient With Distinction
Table J-7. 2008–09 NECAP Science: Decision Consistency—Crosstabulation of Observed achievement level Proportions for Two Parallel Forms—Grade 8
Form 1 achievement level Form 2 achievement
level SBP PP P PWD Total SBP 0.215 0.058 0.000 0.000 0.273 PP 0.058 0.382 0.054 0.000 0.494 P 0.000 0.054 0.172 0.003 0.230
PWD 0.000 0.000 0.003 0.001 0.004 Total 0.273 0.494 0.230 0.004 1.000
SBP = Substantially Below Proficient; PP = Partially Proficient; P = Proficient; PWD = Proficient With Distinction
Table J-8. 2008–09 NECAP Science: Summary of Overall Accuracy and Consistency Indices—Grade 8
Accuracy 0.836 Consistency 0.770 Kappa (k) 0.634
Table J-9. 2008–09 NECAP Science: Indices Conditional on achievement level—Grade 8
Achievement level Accuracy Consistency SBP 0.844 0.787 PP 0.825 0.774 P 0.851 0.751
PWD 0.649 0.233 SBP = Substantially Below Proficient; PP = Partially Proficient; P = Proficient; PWD = Proficient With Distinction
Table J-10. 2008–09 NECAP Science: Accuracy and Consistency Indices at Cutpoints—Grade 8
Cutpoint Accuracy False positive
False negative Consistency
SBP/PP 0.917 0.043 0.040 0.884 PP/P 0.923 0.050 0.027 0.892
P/PWD 0.996 0.004 0.000 0.994 SBP = Substantially Below Proficient; PP = Partially Proficient; P = Proficient; PWD = Proficient With Distinction False positive = proportion of students with observed score above cutpoint and true score below cutpoint False negative = proportion of students with observed score below cutpoint and true score above cutpoint

Appendix J—Decision Accuracy and Consistency Results 4 2008–09 NECAP Science Technical Report
Table J-11. 2008–09 NECAP Science: Decision Accuracy— Crosstabulation of True and Observed achievement level Proportions—Grade 11
True achievement level Observed achievement
level SBP PP P PWD Total
SBP 0.251 0.044 0.000 0.000 0.295 PP 0.040 0.396 0.053 0.000 0.489 P 0.000 0.029 0.178 0.008 0.214
PWD 0.000 0.000 0.001 0.001 0.002 Total 0.291 0.469 0.231 0.009 1.000
SBP = Substantially Below Proficient; PP = Partially Proficient; P = Proficient; PWD = Proficient With Distinction
Table J-12. 2008–09 NECAP Science: Decision Consistency—Crosstabulation of Observed achievement level Proportions for Two Parallel Forms—Grade 11
Form 1 achievement level Form 2 achievement
level SBP PP P PWD Total SBP 0.232 0.059 0.000 0.000 0.291 PP 0.059 0.354 0.056 0.000 0.469 P 0.000 0.056 0.168 0.006 0.231
PWD 0.000 0.000 0.006 0.003 0.009 Total 0.291 0.469 0.231 0.009 1.000
SBP = Substantially Below Proficient; PP = Partially Proficient; P = Proficient; PWD = Proficient With Distinction
Table J-13. 2008–09 NECAP Science: Summary of Overall Accuracy and Consistency Indices—Grade 11
Accuracy 0.826 Consistency 0.757 Kappa (k) 0.622
Table J-14. 2008–09 NECAP Science: Indices Conditional on achievement level—Grade 11
Achievement level Accuracy Consistency SBP 0.851 0.798 PP 0.810 0.755 P 0.831 0.729
PWD 0.680 0.312 SBP = Substantially Below Proficient; PP = Partially Proficient; P = Proficient; PWD = Proficient With Distinction
Table J-15. 2008–09 NECAP Science: Accuracy and Consistency Indices at Cutpoints—Grade 11
Cutpoint Accuracy False positive
False negative Consistency
SBP/PP 0.916 0.044 0.040 0.882 PP/P 0.919 0.053 0.029 0.887
P/PWD 0.992 0.008 0.001 0.988 SBP = Substantially Below Proficient; PP = Partially Proficient; P = Proficient; PWD = Proficient With Distinction False positive = proportion of students with observed score above cutpoint and true score below cutpoint False negative = proportion of students with observed score below cutpoint and true score above cutpoint

Appendix K—Sample Reports 1 2008–09 NECAP Science Technical Report
Appendix K—SAMPLE REPORTS


Appendix K—Sample Reports 3 2008–09 NECAP Science Technical Report

Appendix K—Sample Reports 4 2008–09 NECAP Science Technical Report

Appendix K—Sample Reports 5 2008–09 NECAP Science Technical Report

Appendix K—Sample Reports 6 2008–09 NECAP Science Technical Report

Appendix K—Sample Reports 7 2008–09 NECAP Science Technical Report

Appendix K—Sample Reports 8 2008–09 NECAP Science Technical Report

Appendix K—Sample Reports 9 2008–09 NECAP Science Technical Report

Appendix K—Sample Reports 10 2008–09 NECAP Science Technical Report

Appendix K—Sample Reports 11 2008–09 NECAP Science Technical Report

Appendix K—Sample Reports 12 2008–09 NECAP Science Technical Report

Appendix K—Sample Reports 13 2008–09 NECAP Science Technical Report

Appendix K—Sample Reports 14 2008–09 NECAP Science Technical Report

Appendix K—Sample Reports 15 2008–09 NECAP Science Technical Report

Appendix K—Sample Reports 16 2008–09 NECAP Science Technical Report

Appendix K—Sample Reports 17 2008–09 NECAP Science Technical Report

Appendix K—Sample Reports 18 2008–09 NECAP Science Technical Report

Appendix K—Sample Reports 19 2008–09 NECAP Science Technical Report


Appendix L—Analysis and Reporting Decision Rules 1 2008–09 NECAP Science Technical Report
Appendix L—ANALYSIS AND REPORTING DECISION RULES


Appendix L—Analysis and Reporting Decision Rules 3 2008–09 NECAP Science Technical Report
Analysis and Reporting Decision Rules NECAP Spring 08-09 Administration
This document details rules for analysis and reporting. The final student level data set used for analysis and reporting is described in the “Data Processing Specifications.” This document is considered a draft until the NECAP State Departments of Education (DOE) signs off. If there are rules that need to be added or modified after said sign-off, DOE sign off will be obtained for each rule. Details of these additions and modifications will be in the Addendum section.
I. General Information
NECAP is administered in the fall and spring. This document incorporates fall and spring rules so that changes are carried to future administrations. In the fall, students are reported based on the current year fall school /district (referred to as testing school/district) and prior year spring school/district (referred to as teaching school/district). In the spring, students are reported based on the spring school/district (referred to as testing school/district). In the spring, students are not reported based on the teaching school. Rules pertaining to the teaching school/district can be ignored for spring administrations. For more information regarding discode, schcode, sprdiscode, sprschcode, senddiscode, and sprsenddiscode, please refer to the data processing specifications and demographic data specification.
This document is the official rules for the current reporting administration.
A. Fall Tests Administered:
Grade Subject Test items used for Scaling
IREF Reporting Categories (Subtopic and Subcategory IREF Source)
03 Reading Common Cat2 03 Math Common Cat1 04 Reading Common Cat2 04 Math Common Cat1 05 Reading Common Cat2 05 Math Common Cat1 05 Writing Common type 06 Reading Common Cat2 06 Math Common Cat1 07 Reading Common Cat2 07 Math Common Cat1 08 Reading Common Cat2 08 Math Common Cat1 08 Writing Common type 11 Reading Common Cat2 11 Math Common Cat1 11 Writing Common itemnumber
B. Spring Tests Administered
Grade Subject Test items used for Scaling
Item Reporting Categories (Subtopic and Subcategory Source)
04 Science Common Cat3 08 Science Common Cat3 11 Science Common Cat3
C. Reports Produced:
1. Student Report
a. Testing School District

Appendix L—Analysis and Reporting Decision Rules 4 2008–09 NECAP Science Technical Report
2. School Item Analysis Report by Grade and Subject
a. Testing School District
b. Teaching School District (Fall Only)
3. Grade Level School/District/State Results
a. Testing School District
b. Teaching School District – District and School Levels only (Fall Only)
4. School/District/State Summary (School Level is produced in the Fall Only)
a. Testing School District
b. Teaching School District – District and School Levels only (Fall Only)
D. Files Produced:
1. Preliminary State Results
2. State Student Released Item Data
3. State Student Raw Data
4. State Student Scored Data
5. District Student Data
6. Common Item Information
7. Grade Level Results Report Disaggregated and Historical Data
8. Grade Level Results Report Participation Category Data
9. Grade Level Results Report Subtopic Data
10. Summary Results Data
11. Released Item Percent Responses Data
12. Invalidated Students Original Score
13. Student Questionnaire Summary
14. TCTA Questionnaire Raw Data
15. TCTA Questionnaire Frequency Distribution
16. Scaled Score Lookup
17. Subtopic Average Points Earned (For Program Management)
18. Item Stats for Inquiry Task Items (For Program Management)
19. Memo Shipping files (For Program Management)
20. Report Shipment Table (Measured Progress Use Only)
E. School Type:
Testing School Type: SchType Teaching School Type: sprSchType (Fall Only)
Source: ICORE SubTypeID
Description
PUB 1,12,13 Public School PRI 3 Private School OOD 4 Out-of-District Private Providers OUT 8 Out Placement CHA 11 Charter School INS 7 Institution OTH 9 Other

Appendix L—Analysis and Reporting Decision Rules 5 2008–09 NECAP Science Technical Report
School Type Impact on Data Analysis and Reporting
Testing Teaching (Fall Only) Level
Impact on Analysis
Impact on Reporting Impact on Analysis
Impact on Reporting
Student n/a Report students based on testing discode and schcode.
District data will be blank for students tested at PRI, OOD, OUT, INS, or OTH schools.
Always print tested year state data.
n/a n/a
School Do not exclude any students based on school type using testing school code for aggregations
Generate a report for each school with at least one student enrolled using the tested school aggregate denominator.
District data will be blank for PRI, OOD, OUT, INS, or OTH schools.
Always print tested year state data.
Exclude students who do not have a teaching school code.
Generate a report for each school with at least one student enrolled using the teaching school aggregate denominator.
District data will be blank for PRI, OOD, OUT, INS, or OTH schools.
Always print tested year state data.
District For OUT and OOD schools, aggregate using the sending district.
If OUT or OOD student does not have a sending district, do not include in aggregations.
Do not include students tested at PRI, INS, or OTH schools
Generate a report for each district with at least one student enrolled using the tested district aggregate denominator.
Always report tested year state data.
For OUT and OOD teaching schools, aggregate using the spring sending district.
If OUT or OOD teaching school student does not have a teaching sending district, do not include in aggregations.
Do not include students taught at PRI, INS, or OTH schools
Generate a report for each district with at least one student enrolled using the teaching district aggregate denominator.
Always report tested year state data.
State Do not include students tested at PRI schools for NH and RI. Include all students for VT.
Always report testing year state data.
n/a n/a

Appendix L—Analysis and Reporting Decision Rules 6 2008–09 NECAP Science Technical Report
F. Student Status
StuStatus Description
1 Homeschooled 2 Privately Funded 3 Exchange Student 0 Publically Funded
StuStatus impact on Data Analysis and Reporting
Level Impact on Analysis Impact on Reporting
Student n/a School and District data will be blank for students with a StuStatus value of 1,2 or 3.
Always print tested year state data.
For StuStatus values of 1,2 and 3 print the description from the table above for the school and district names.
School Exclude all students with a StuStatus value of 1,2 or 3.
Students with a StuStatus value of 1,2 or 3 are not listed on the item analysis report.
District Exclude all students with a StuStatus value of 1,2 or 3.
n/a
State Exclude all students with a StuStatus value of 1,2 or 3.
n/a.
G. Requirements To Report Aggregate Data(Minimum N)
Calculation Description Rule
Number and Percent at each achievement level, mean score by disaggregated category and aggregate level
If the number of tested students included in the denominator is less than 10, then do not report.
Content Area Subcategories Average Points Earned based on common items only by aggregate level
If the number of tested students included in the denominator is less than 10, then do not report.
Aggregate data on Item Analysis report No required minimum number of students
Number and Percent of students in a participation category by aggregate level
No required minimum number of students
Content Area Subtopic Percent of Total Possible Points and Standard Error Bar and Grade 11 Writing Distribution of Score Points Across Prompts
If any item was not administered to at least one tested student included in the denominator or the number of tested students included in the denominator is less than 10, then do not report
Content Area Cumulative Total Enrollment, Not tested, Tested, Number and Percent at each achievement level, mean score
Suppress all cumulative total data if at least one reported year has fewer than 10 tested students.
Fall: For grade 11, the reported years are 0708 and 0809. For grades 03-08, the reported years are 0607, 0708, and 0809.
Spring: The reported years are 0708 and 0809

Appendix L—Analysis and Reporting Decision Rules 7 2008–09 NECAP Science Technical Report
H. Special Forms:
1. Form 00 is created for students whose matrix scores will be ignored for analysis. Such students include Braille or administration issues resolved by program management.
I. Other Information
1. Off grade testing is not allowed; however, Grade 12 students are allowed to participate in the NECAP Grade 11 test under the following circumstances: RI students trying to improve prior NECAP score, and NH, RI, and VT students taking the NECAP Grade 11 test for the first time.
- RI students trying to improve are identified as StuGrade=12 and Grade=11. They only receive a student report. They are not listed on a roster or included in any aggregations. Do not print tested school and district aggregate data on the student report.
- For students taking NECAP for the first time the StuGrade in the student demographics file will be 11 and the remaining decision rules apply.
2. Plan504 data not available for NH and VT; therefore 504 Plan section will be suppressed for NH and VT.
3. To calculate Title1 data for writing using Title1rea variable.
4. Title 1 data are not available for VT; therefore Title 1 section will be suppressed for VT.
5. Title 1 Science data are not available for NH; therefore, Title 1 section will be suppressed for NH on Science specific reports. Title 1 Reading and Math data are available for NH and should not be suppressed.
6. Testing level is defined by the variables discode and schcode. Teaching level is defined by the variables sprdiscode and sprschcode. Every student will have testing district and school codes. In the fall, some students will have a teaching school code and some students will have a teaching district code. In the spring, no students will have a teaching school/district.
7. A non-public district code is a district code associated with a school that is type 'PRI','OOD','OUT','INS', or 'OTH'.
8. Only students with a testing school type of OUT or OOD are allowed to have a testing sending district code. Non-public testing sending district codes will be ignored. For example: For RI, senddiscode of 88 and 67 is ignored. For NH, senddiscode of 000 is ignored.
9. Only students with a teaching school type of OUT or OOD are allowed to have a spring sending district code. Non-public spring sending district codes will be ignored. For example: For RI, senddiscode of 88 and 67 is ignored. For NH, senddiscode of 000 is ignored.
10. If students have a teaching district code and no teaching school, then ignore teaching district codes that are associated with schools that are 'PRI','OOD','OUT','INS', or 'OTH'.
II. Student Participation / Exclusions
A. Test Attempt Rules by content area
1. Grade 11 writing was attempted if the common writing prompt is not scored blank ‘B’. For all other grades and content areas test attempt can be determined as follows. A content area was attempted if any multiple choice item or non-field test open response item has been answered. (Use original item responses – see special circumstances section II.F)
2. A multiple choice item has been answered by a student if the response is A, B, C, D, or * (*=multiple responses)
3. An open response item has been answered if it is not scored blank ‘B’
B. Session Attempt Rules by content area
1. A session was attempted if any multiple choice item or non-field test open response item has been answered in the session. (Use original item responses – see special circumstances section II.F)
2. Because of the test design for grade 11 writing, only determine if session 1 was attempted. Session 2 is ignored.

Appendix L—Analysis and Reporting Decision Rules 8 2008–09 NECAP Science Technical Report
C. Not Tested Reasons by content area
1. Not Tested State Approved Alternate Assessment
a. NH & RI: If the student is identified using “rptstudid” as receiving at least one alternate assessment achievement level regardless of content area and grade reported in alternate assessment reporting, then the student’s not tested reason in the demographic data file will be updated to “Not Tested State Approved Alternate Assessment” for all content areas based on the demographic file grade.
b. All States: If a student is identified as “Not Tested State Approved Alternate Assessment” for at least one content area, the student’s Active status will be set to 1 in the demographic data file and included in reporting.
c. If a student links to the demographic file has content area not tested status of “Not Tested State Approved Alternate Assessment” is identified as “Not Tested State Approved Alternate Assessment” for the content area.
2. Not Tested State Approved First Year LEP (reading and writing only)
a. If a student links to the demographic file has content area not tested status of “Not Tested State Approved First Year LEP” or does not link to the demographic file has content area “First Year LEP blank or partially blank reason” marked, then the student is identified as “Not Tested State Approved First Year LEP”.
3. Not Tested State Approved Special Consideration
- If a student links to the demographic data file has content area “Not Tested State Approved Special Consideration” indicated or does not link to the demographic data file and has content area “Special Consideration blank or partially blank reason” marked, then the student is identified as ”Not Tested State Approved Special Consideration”.
4. Not Tested State Approved Withdrew After
a. If a student links to the demographic data file has content area not tested status of “Not Tested Withdrew After” and at least one content area session was not attempted or does not link to the demographic file has content area “Withdrew After blank or partially blank reason” marked and at least one content area session was not attempted, then the student is identified as “Not Tested State Approved Withdrew After”. For grade 11 writing, only use session 1 attempt status.
5. Not Tested State Approved Enrolled After
- If a student links to the demographic data file has content area not tested status of “Not Tested Enrolled After” and at least one content area session was not attempted or does not link to the demographic file has content area “Enrolled After blank or partially blank reason” marked and at least one content area session was not attempted, then the student is identified as “Not Tested State Approved Enrolled After”. For grade 11 writing, only use session 1 attempt status.
6. Not Tested Other
- If content area test was not attempted, the student is identified as “Not Tested Other”.
D. Not Tested Reasons Hierarchy by content area: if more than one reason for not testing at a content area is identified then select the first category indicated in the order of the list below.
1. Not Tested State Approved Alternate Assessment
2. Not Tested State Approved First Year LEP (reading and writing only)
3. Not Tested State Approved Special Consideration
4. Not Tested State Approved Withdrew After
5. Not Tested State Approved Enrolled After
6. Not Tested Other

Appendix L—Analysis and Reporting Decision Rules 9 2008–09 NECAP Science Technical Report
E. Special Circumstances by content area
1. Item invalidation flags are provided to the DOE during data processing test clean up. The item invalidation flag variables are initially set using the rules below. The final values used for reporting are provided back to Measured Progress by the DOE and used in reporting..
a. If reaaccomF02 or reaaccomF03 is marked, then mark reaInvSes1, reaInvSes2, and reaInvSes3
b. If mataccomF03 is marked, then mark matInvSes1, matInvSes2, and matInvSes03.
c. If mataccomF01 is marked, then mark matInvSes1NC.
d. If wriaccomF03 is marked, then mark wriInvSes1 and wriInvSes2
e. If sciaccomF01 is marked, then mark sciInvSes3.
f. If sciaccomF03 is marked, then mark SciInvSes1, sciInvSes2, and sciInvSes3.
2. A student is identified as content area tested if the student does not have any content area not tested reasons identified. Tested students are categorized in one of the four tested participation statuses: “Tested Damaged SRB”, “Tested with Non-Standard Accommodations”, “Tested Incomplete”, and “Tested”.
a. Students with an item response of ‘X’ are identified as “Tested Damaged SRB”.
b. Students identified as content area tested, are not identified as “Tested Damaged SRB”, and have at least one of the content area invalidation session flags marked will be identified as “Tested with Non-Standard Accommodations”. Grade 11 writing use only session 1 invalidation flag.
c. Students identified as content area tested, are not identified as “Tested Damaged SRB”, and not identified as “Tested with Non-Standard Accommodations” and did not attempt all sessions in the test are considered to be “Tested Incomplete.”
d. All other tested students are identified as “Tested”.
3. For students identified as “Tested Damaged SRB”, the content area subcategories with at least one damaged item will not be reported. The school, district and state averages will be suppressed for the impacted subcategories on the student report. These students are excluded from all raw score aggregations (item, subcategory, and total raw score). They are included in participation, achievement level, and scaled score aggregations.
4. For students identified as “Tested with Non-Standard Accommodations” the content area sessions item responses which are marked for invalidation will be treated as a non-response
5. Students identified as tested in a content area will receive released item scores, scaled score, scale score bounds, achievement level, raw total score, subcategory scores, and writing annotations (where applicable).
6. Students identified as not tested in a content area will not receive a scaled score, scaled score bounds, achievement level, writing annotations (where applicable). They will receive released item scores, raw total score, and subcategory scores.
7. Item scores for students with an invalidation flag marked and have a not tested status will be blanked out based on the invalidation flag. For example, if the student is identified as “Not Tested: State Approved Alternate Assessment” and has ReaInvSes1 marked, then all reading session 1 item responses will be reported as a blank.
F. Student Participation Status Hierarchy by content area
1. Not Tested: State Approved Alternate Assessment
2. Not Tested: State Approved First Year LEP (reading and writing only)
3. Not Tested: State Approved Special Consideration
4. Not Tested: State Approved Withdrew After
5. Not Tested: State Approved Enrolled After
6. Not Tested: Other
7. Tested Damaged SRB

Appendix L—Analysis and Reporting Decision Rules 10 2008–09 NECAP Science Technical Report
8. Tested with Non-Standard Accommodations
9. Tested Incomplete
10. Tested
G. Student Participation Summary
Participation Status
Description Raw Score (*)
Scaled Score (&)
Ach. Level
Student Report Ach. Level Text
Roster Ach. Level Text
Z Tested Damaged SRB(**)
Substantially Below Proficient, Partially Proficient, Proficient, or Proficient with Distinction
1,2,3, or 4
A Tested Substantially Below Proficient, Partially Proficient, Proficient, or Proficient with Distinction
1,2,3, or 4
B Tested Incomplete(%) Substantially Below Proficient, Partially Proficient, Proficient, or Proficient with Distinction
1,2,3, or 4
C Tested with Non-Standard Accommodations (%%)
Substantially Below Proficient, Partially Proficient, Proficient, or Proficient with Distinction
1,2,3, or 4
D Not Tested State Approved Alternate Assessment
Alternate Assessment A
E Not Tested State Approved First Year LEP (Reading and Writing only)
First Year LEP L
F Not Tested State Approved Enrolled After
Fall: Enrolled After October 1 Spring: Enrolled After May 11
E
G Not Tested State Approved Withdrew After
Fall: Withdrew After October 1 Spring: Withdrew After May 11
W
H Not Tested State Approved Special Consideration
Special Consideration S
I Not Tested Other Not Tested N
(*) Raw scores are not printed on student report for students with a not tested status.
(**) Raw scores for Tested damaged SRB students will be reported based on the set of non-damaged items. Subcategory scores will not be reported if it includes a damaged item. Items identified as damaged (response of ‘X’) will print as a blank on the item analysis report.
(%) Tested incomplete students will be identified on student and item analysis reports with a footnote.
(%%) Tested with Non-standard accommodations students will be identified on student and item analysis reports. The student report will have a footnote. The invalidated items will be reported with a ‘-‘ on the item analysis report.
(&) Grade 11 writing students do not receive a scaled score. The writing achievement level is determined by the total common writing prompt score.

Appendix L—Analysis and Reporting Decision Rules 11 2008–09 NECAP Science Technical Report
III. Calculations
A. Rounding
1. All percents are rounded to the nearest whole number
2. All mean scaled scores are rounded to the nearest whole number
3. Grade 11 writing mean (raw) score is rounded to the nearest tenth.
4. Content Area Subcategories: Average Points Earned (student report): round to the nearest tenth.
5. Round non-multiple choice average item scores to the nearest tenth.
B. Students included in calculations based on participation status
1. For number and percent of students enrolled, tested, and not tested categories include all students not excluded by other decision rules.
2. For number and percent at each achievement level, average scaled score, subtopic percent of total possible points and standard error, subtopic distribution across writing prompts, subcategories average points earned, percent/correct average score for each released item include all tested students not excluded by other decision rules.
C. Raw scores
1. For all analyses, non-response for an item by a tested student is treated as a score of 0. Items identified as damaged (response of ‘X’) will be excluded for student identified as “Tested Damaged SRB”.
2. Content Area Total Points: Sum the points earned by the student for the common items.
D. Item Scores
1. For all analysis, non-response for an item by a tested student is treated as a score of 0.
2. For multiple choice released item data store a ‘+’ for correct response, or A,B,C,D,* or blank
3. For open response released items, store the student score. If the score is not numeric (‘B’), then store it as blank.
4. For students identified as content area tested with non-standard accommodations, then store the released item score as ‘-‘ for invalidated items.
5. For common writing prompt score, the final score of record is the sum of scorer 1 and scorer 2. If both scorers give the student a B(F), then the final score is B(F). For calculation of grade level summary report subtopic display the mean of common writing prompt score 1 and scorer 2 is used for percent of total possible points. The individual scores of the common prompt for scorer 1 and scorer 2 are used for the subpoic score distribution.
6. For matrix writing prompt score, the final score of record is scorer 1.
E. Scaling
1. Scale Form creation
Scaling is accomplished by defining the unique set of test forms for the grade/subject. This is accomplished as follows:
- Translate each form and position into the unique item number assigned to the form/position.
- Order the items by
I. Type – multiple-choice, short-answer, constructed- response, extended-response, writing prompt.
II. Form – common, then by ascending form number.
III. Position
- If an item number is on a form, then set the value for that item number to ‘1’, otherwise set to ‘.’. Set the Exception field to ‘0’ to indicate this is an original test form.
- If an item number contains an ‘X’ (item is not included in scaling) then set the item number to ‘.’. Set the Exception field to ‘1’ to indicate this is not an original test form.

Appendix L—Analysis and Reporting Decision Rules 12 2008–09 NECAP Science Technical Report
- Compress all of the item numbers together into one field in the order defined in step II to create the test for the student.
- Select the distinct set of tests from the student data and order them by the exception field and the descending test field.
- Check to see if the test has already been assigned a scale form by looking in the tblScaleForm table. If the test exists then assign the existing scale form. Otherwise assign the next available scale form number. All scale form numbering starts at 01 and increments by 1 up to 99.
2. Scaled Score assignment
- Psychometrics provides data analysis with a lookup table for each scale form. The lookup table contains the raw score and the resulting scaled score.
F. SubTopic Item Scores
1. Identify the Subtopic
a. Fall: A file provided by PM outlines the IREF variables and values for identifying the Content Strand, GLE code, Depth of Knowledge code, subtopics, and subcategories. The variable type in IREF is the source for the Item Type, except the writing prompt item type is reported as “ER”.
b. Spring: NECAP science item information is stored in IABS, except for inquiry items.
I. Program management provided Data Analysis with “2008 NECAP Science Inquiry Task Reporting Categories.doc” which contains the item order, domain, assessment target, DOK, item type, and maximum possible points for the inquiry items. Inquiry items are administered in session 3.
II. Program management provided Data Analysis with “IABS Export Codes for NECAP SCI Reporting.doc” which contains the crosswalk between IABS item information and reporting.
III. Data analysis used both documents and IABS data export to create “IREF” data table. Cat3 contains the domain. Cat4 contains the assessment target. Cat5 contains DOK. The domain is used for the reporting category (subtopic) calculations.
IV. Program management provided Data Analysis with “2009 IABS_Released ItemsSCI for Tara.xls” which contains released item order. Inquiry items are listed at the end in the order they are in the test booklet.
2. Student Content Area Subcategories (student report): Subtopic item scores at the student level is the sum of the points earned by the student for the common items in the subtopic. For grade 11 writing, the subtopic score is the final score of record for the common writing prompt.
3. Content Area Subtopic (grade level results report): Subtopic scores are based on all unique common and matrix items. For grade 11 common writing prompt use the average of scorer 1 and scorer 2. The itemnumber identifies each unique item.
a. Percent of Total Possible Points:
I. For each unique common and matrix item calculate the average student score as follows: (sum student item score/number of tested students administered the item).
II. 100 * (Sum the average score for items in the subtopic)/(Total Possible Points for the subtopic) rounded to the nearest whole number.
b. Standard Error Bar: Before multiplying by 100 and rounding the Percent of Total Possible points (ppe) calculate standard error for school,district and state: 100* (square root ( ((ppe)*(1-ppe)/number of tested students)) rounded to the nearest tenth. For the lower bound and upper bound round the Percent of Total Possible Points +/- Rounded Standard Error to the nearest hundredth.
G. Grade 11 Writing: Distribution of Score Points Across Prompts.
1. Each prompt is assigned a subtopic based on information provided by program management.

Appendix L—Analysis and Reporting Decision Rules 13 2008–09 NECAP Science Technical Report
2. The set of items used to calculate the percent at each score point is defined as follows: scorer 1 common prompt score, scorer 2 common prompt score, scorer 1of each matrix prompt. (Note: scores of ‘B’ and ‘F’ are treated as a 0 score for tested students.)
3. Using the set of items do the following to calculate the percent at each score point.
- Step1 A: For each item, calculate the number of students at each score point. Adjust the common item counts by multiplying the common items’ number of students at each score point by 0.5.
- Step 1 B: Calculate the total number of scores by summing up the number of students at each score point across the items in the subtopic
- Step 2: For each score point, sum up the (adjusted) number of students at the score point across the items in the subtopic. Divide the sum by total number of scores for the subtopic. Multiply that by 100 and round to the nearest whole number.
4. Example
Common Prompt
Matrix Prompt 1
Matrix Prompt 2
Matrix Prompt 3
Matrix Prompt 4
Matrix Prompt 5
Item C1 C2 M1 M2 M3 M4 M5 Subtopic 1 1 1 2 2 2 3 Student Student Item Score A 3 4 2 B 4 4 C 2 1 3 D 5 2 4 E 3 2 1 F 0 0 2 G 1 2 1 H 6 5 5 I 2 2 1 J 3 2 2 K 5 4 4
Score Point Step 1 Number at each score point Item C1 C2 M1 M2 M3 M4 M5 Subtopic 1 1 1 2 2 2 3
0 0.5 0.5 0 0 0 0 0 1 0.5 0.5 1 1 0 1 0 2 1 2.5 1 0 1 1 0 3 1.5 0 1 0 0 0 0 4 0.5 1.5 0 1 0 0 1 5 1 0.5 1 0 0 0 0 6 0.5 0 0 0 0 0 0
Total 15 5 1
Score Point Step 2 Percent at each score point Subtopic 1 2 3
0 7 0 0 1 13 40 0 2 30 40 0 3 17 0 0 4 13 20 100 5 17 0 0 6 3 0 0
H. Cumulative Total
1. Include the yearly results where the number tested is greater than or equal to 10
2. Cumulative total N (Enrolled, Not Tested Approved, Not Tested Other, Tested, at each achievement level) is the sum of the yearly results for each category where the number tested is greater than or equal to 10.

Appendix L—Analysis and Reporting Decision Rules 14 2008–09 NECAP Science Technical Report
3. Cumulative percent for each achievement level is 100*(Number of students at the achievement level cumulative total / number of students tested cumulative total) rounded to the nearest whole number.
4. Cumulative mean scaled score is a weighted average. For years where the number tested is greater than or equal to 10, (sum of ( yearly number tested * yearly mean scaled score) ) / (sum of yearly number tested) rounded to the nearest whole number.
I. Average Points Earned Students at Proficient Level (Range)
1. Select all students across the states with Y40 scaled score, where Y=grade. Average the content area subcategories across the students and round to the nearest tenth. Add and subtract one standard error of measurement to get the range.
2. Grade 11 writing Average Points Earned Students at Proficient Level will be reported as ‘7’.
J. Writing Annotations
Students with a writing prompt score of 2-12 receive at least one, but up to five statements based on decision rules for annotations as outlined in Final Statements & Decision Rules for NECAP Writing Annotations.doc. Grade 11 students with the common writing prompt score of F or 0 will also receive annotations of FF and 00 respectively.
IV. Report Specific Rules
A. Student Report
1. Student header Information
a. If “FNAME” or “LNAME” is not missing then print “FNAME MI LNAME”. Otherwise, print “No Name Provided”.
b. Print the student’s tested grade
c. For school and district name do the following.
I. For students with a stustatus value of 0, print the abbreviated tested school and district ICORE name based on school type decision rules.
II. Otherwise, for the school and district names print the “Description” in the StuStatus table
d. Print “NH”,”RI”, or “VT” for state.
2. Test Results by content area
a. For students identified as “Not Tested”, print the not tested reason in the achievement level, leave scaled score and graphic display blank.
b. For students identified as tested for the content area then do the following
I. Print the complete achievement level name the student earned
II. Print the scaled score the student earned
III. Print a vertical black bar for the student scaled score with gray horizontal bounds in the graphic display
IV. For students identified as “Tested with a non-standard accommodation” for a content area, print ‘**’ after the content area earned achievement level and after student points earned for each subcategory.
V. For students identified as “Tested Damaged SRB” do not report student and aggregate data for subcategories that have at least one damaged item.
VI. For students identified as “Tested Incomplete” for a content area, place a section symbol after content area earned scaled score.
3. Grade 11 writing graphic display will not have standard error bars. Also, if a student’s total points earned is 0 for writing, do not print the graphic display.
4. Exclude students based on stugrade=12, student status, school type and participation status decision rules for aggregations.

Appendix L—Analysis and Reporting Decision Rules 15 2008–09 NECAP Science Technical Report
5. Print aggregate data based on stugrade=12, student status, school type and minimum N-size rules.
6. This Student’s Achievement Compared to Other Students by content area
a. For tested students, print a check mark in the appropriate achievement level in the content area student column. For not tested students leave blank
b. For percent of students with achievement level by school, district and state print aggregate data based on student status, school type and minimum N rules
7. This Student’s Performance in Content Area Subcategories by content area
a. Always print total possible points and students at proficient average points earned range.
b. For students identified as not tested then leave student scores blank
c. For students identified as tested do the following
I. For students identified as “Tested Damaged SRB” do not report student and aggregate data for subcategories that have at least one damaged item.
II. Otherwise, always print student subcategory scores
If the student is identified as tested with a non-standard accommodation for the content area then place ‘**” after the student points earned for each subcategory.
8. Writing Annotations
For students with writing prompt score of 2-12 print at least one, but up to five annotation statements. Grade 11 students with the common writing prompt score of F or 0 will also receive annotations of FF and 00 respectively.
B. School Item Analysis Report by Grade and Subject
1. Reports are created for testing school and teaching school (Fall Only) independently.
2. School Header Information
a. Use abbreviated ICORE school and district name based on school type decision rules
b. Print “New Hampshire”, “Rhode Island”, or “Vermont” for State.
c. For NH, the code should print SAU code – district code – school code. For RI and VT, the code should print district code – school code.
3. For multiple choice items, print ‘+’ for correct response, or A,B,C,D,* or blank
4. For open response items, print the student score. If the score is not numeric (‘B’), then leave blank.
5. For students identified as content area tested with non-standard accommodations, print ‘-‘ for invalidated items.
6. All students receive subcategory points earned and total points earned, including grade 11 writing.
7. Leave scaled score blank for not tested students and print the not tested reason in the achievement level column.
8. Exclude students based on stugrade=12, student status, school type and participation status decision rules for aggregations.
9. Always print aggregated data regardless of N-size based on school type decision rules.
10. For students identified as not tested for the content area print a cross symbol next to students’ name.
11. For students identified as tested incomplete for the content area print a section symbol next to the scaled score.
12. Students with StuStatus value of 1,2 or 3 are not listed on the report.
13. Students with StuGrade=12 are not listed on the report.
C. Grade Level School/District/State Results

Appendix L—Analysis and Reporting Decision Rules 16 2008–09 NECAP Science Technical Report
1. Reports are run by testing state, testing district, testing school using the aggregate school and district codes described in the school type table.
2. Fall Only: Reports are also run by teaching district, and teaching school using the aggregate school and district codes described in the school type table.
3. Exclude students based on stugrade=12, student status, school type and participation status decision rules for aggregations.
4. Report Header Information
a. Use abbreviated school and district name from ICORE based on school type decision rules.
b. Print “New Hampshire”, “Rhode Island”, or “Vermont” to reference the state. The state graphic is printed on the first page.
5. Report Section: Participation in NECAP
a. For testing level reports always print number and percent based on school type decision rules.
b. For the teaching level reports leave the section blank.
6. Report Section: NECAP Results by content area
a. For the testing level report always print based on minimum N-size and school type decision rules.
b. For the teaching level report leave Enrolled, NT Approved, and NT Other blank. Print Tested, number and percent at each achievement level, mean scaled score based on minimum N-size and school type decision rules.
7. Report Section: Historical NECAP Results by content area
a. For teaching level report always print current year, prior years, and cumulative total results based on minimum N-size and school type decision rules.
b. For teaching level report leave Enrolled, NT Approved, and NT Other blank. Print Tested, number and percent at each achievement level, mean scaled score based on minimum N-size and school type decision rules.
8. Report Section: Subtopic Results by content area
a. For testing and teaching level reports always print based on minimum N-size and school type decision rules
9. Report Section: Disaggregated Results by content area
a. For testing level report always print based on minimum N-size and school type decision rules.
b. For teaching level report leave Enrolled, NT Approved, and NT Other blank. Print Tested, number and percent at each achievement level, mean scaled score based on minimum N-size and school type decision rules.
D. School/District/State Summary(School Level is run in the Fall Only)
1. Reports are run by testing state, testing district, testing school (Fall Only) using the aggregate school and district codes described in the school type table
2. Fall Only: Reports are also run by teaching district, and teaching school using the aggregate school and district codes described in the school type table.
3. Exclude students based on stugrade=12, student status, school type and participation status decision rules for aggregations.
4. For testing level report print entire aggregate group across grades tested and list grades tested results based on minimum N-size and school type decision rules. Mean scaled score across the grades is not calculated.
5. For the teaching level report leave Enrolled, NT Approved, and NT Other blank. Print Tested, number and percent at each achievement level, mean scaled score based on minimum N-size and school type decision rules. Mean scaled score across the grades is not calculated.

Appendix L—Analysis and Reporting Decision Rules 17 2008–09 NECAP Science Technical Report
V. Data File Rules
In the file names GR refers to the two digit grade (03-08,11) , YYYY refers to the year, DDDDD refers to the district code, and SS refers to two letter state code. Refer to the tables at the end of this section for filenames and layouts. Teaching level data files will be produced in the Fall Only.
A. Preliminary State Results
1. A PDF file will be created for each state containing preliminary state results for each grade and subject and will list historical state data for comparison.
2. The file name will be SSPreliminaryResultsDATE.pdf
B. State Student Released Item Data
1. A CSV file will be created for each state and grade.
2. Exclusion Rules
- NH: If the student has a testing school type of ‘PRI’ or StuStatus is 1,2 or 3, then exclude the student
- RI: If testing school type is PRI and teaching school type is PRI or blank, then exclude the student.
- VT: Do not exclude any students
C. State Student Raw Data
1. A CSV file will be created for each state and grade.
2. Exclusion Rules
- NH: If the student has a testing school type of ‘PRI’ or StuStatus is 1,2 or 3, then exclude the student
- RI: If testing school type is PRI and teaching school type is PRI or blank, then exclude the student.
- VT: Do not exclude any students
D. State Student Scored Data
1. A CSV file will be created for each state and grade.
2. Exclusion Rules
- NH: If the student has a testing school type of ‘PRI’ or StuStatus is 1,2 or 3, then exclude the student
- RI: If testing school type is PRI and teaching school type is PRI or blank, then exclude the student.
- VT: Do not exclude any students
E. District Student Data
1. Testing and teaching CSV files will be created for each state and grade and district.
2. Students with the Discode or SendDiscode will be in the district grade specific CSV file for the testing year.
3. Fall Only: Students with a sprDiscode or sprSendDiscode will be in the district grade specific CSV file for the teaching year.
4. For NH and RI only public school districts will receive district data files. (Districts with at least one school with schoolsubtypeID=1 or 11 in ICORE)
5. Exclusion Rules
- NH & RI: If the student has a StuStatus value of 1,2 or 3, then exclude the student
- VT: If the student has a StuStatus value of 1, then exclude the student.
F. Common Item Information
1. An excel file will be created containing item information for common items: grade, subject, released item number, item analysis heading data, raw data item name, item type, key, and point value.

Appendix L—Analysis and Reporting Decision Rules 18 2008–09 NECAP Science Technical Report
G. Grade Level Results Report Disaggregated and Historical Data
1. Teaching and testing CSV files will be created for each state and grade containing the grade level results disaggregated and historical data.
2. Data will be suppressed based on minimum N-size and report type decision rules.
3. Private schools are excluded from NH & RI files.
H. Grade Level Results Report Participation Category Data
1. Testing CSV file will be created for each state and grade containing the grade level results participation data.
2. Private schools are excluded from NH & RI files.
I. Grade Level Results Report Subtopic Data
1. Teaching and testing CSV files will be created for each state and grade containing the grade level results subtopic.
2. Data will be suppressed based on minimum N-size and report type decision rules.
3. Private schools are excluded from NH & RI files.
J. Summary Results Data
1. Teaching and testing CSV files will be created for each state containing the school, district and state summary data.
2. Data will be suppressed based on minimum N-size and report type decision rules.
3. Private schools are excluded from NH & RI files.
K. Released Item Percent Responses Data
1. The CSV files will only contain state level aggregation for released items.
2. CSV files will be created for each state and grade containing the released item analysis report state data.
L. Invalidated Students Original Score
1. A CSV file will be created for each state and grade
2. Original raw scores for students whose responses were invalidated for reporting will be provided.
3. Exclusion Rules
- NH: If the student has a testing school type of ‘PRI’ or StuStatus is 1,2 or 3, then exclude the student
- RI: If testing school type is PRI and teaching school type is PRI or blank, then exclude the student.
- VT: Do not exclude any students
M. Student Questionnaire Summary
1. One CSV file will be created for each state containing percent of students at each response, percent of students at each achievement level, and average scaled score, by student questionnaire response.
2. Only include students who are included in state level aggregations.
3. Data will be suppressed based on minimum N-size and report type decision rules.
N. TCTA Questionnaire Raw Data
1. One CSV file will be created for each state containing raw TC Questionnaire data.
2. One CSV file will be created for each state containing raw TA Questionnaire data.
O. TCTA Questionnaire Frequency Distribution
1. One CSV file will be created for each state containing the distribution of responses of TC Questionnaire raw data.

Appendix L—Analysis and Reporting Decision Rules 19 2008–09 NECAP Science Technical Report
2. One CSV file will be created for each state containing the distribution of responses of TA Questionnaire raw data.
P. Scaled Score Lookup
1. One CSV file and one excel file will be created containing the scaled score lookup data.
Q. Subtopic Average Points Earned (For Program Management)
1. One excel file will be created containing four worksheets. The first worksheet contains the total possible points for each subtopic as reported on the item analysis report and the range for students who are just proficient. The remaining three worksheets contain state average subtopic scores as reported on the item analysis report.
2. Program management uses this file to create a document which is provided to the schools.
R. Item Stats for Inquiry Task Items (For Program Management)
1. Since Inquiry Task Items are not stored in IABS, one CSV file will be created containing item stats for Inquiry Task items.
2. All three states are included in the calculations.
S. Memo Shipping Files (For Program Management)
1. Provide PM in excel list of schools and districts that tested regardless of grade.
T. Report Shipment Table (Measured Progress Use Only)
1. All shipped products are shipped directly to the schools (ReportFor=1 and BatchID=0)
2. The following products will be included for each school included in reporting
- Student Report – School Copy (black and white)
I. Student reports are class-packed by school and grade
II. GradeNo=03,04,05,06,07,08,11 (for each grade included in reporting)
III. ReportType=01
IV. ContentCode=16 for Spring Reporting, 00 for Fall Reporting
V. Quantity=1
- Student Report – Parent Copy (color)
I. Student reports are class-packed by school and grade
II. GradeNo=03,04,05,06,07,08,11 (for each grade included in reporting)
III. ReportType=02
IV. ContentCode=16 for Spring Reporting, 00 for Fall Reporting
V. Quantity=1

Appendix L—Analysis and Reporting Decision Rules 20 2008–09 NECAP Science Technical Report
U. Fall Table Data File Deliverables
Data File Layout File Name
Preliminary State Results N/A Included in Equating Report
State Student Released Item Data NECAP0809FallDistrictStudentLayout.xls(one worksheet for grade 11 and one worksheet for 03-08)
NECAP0809FallStateStudentReleasedItem[GR].csv
State Student Raw Data NECAP0809FallStateStudentRawLayout.xls (one worksheet for each of the 4 unique test designs)
NECAP0809FallStateStudentRaw[GR].csv
State Student Scored Data NECAP0809FallStateStudentScoredLayout.xls
NECAP0809FallStateStudentScored[GR].csv
District Student Data NECAP0809FallDistrictStudentLayout.xls(one worksheet for grade 11 and one worksheet for 03-08)
NECAP0809FallTestingDistrictSlice[GR]_[District Code].csv
NECAP0809FallTeachingDistrictSlice[GR]_[District Code].csv
Common Item Information NECAP0809FallCommonItemInformationLayout.xls
NECAP0809FallCommonItemInformation.xls
Grade Level Results Report
Disaggregated and Historical Data
NECAP0809FallResultsReport
DisaggregatedandHistoricaLayout.xls
NECAP0809FallResultsReportTesting
DisaggregatedandHistorical[GR].csv
NECAP0809FallResultsReportTeaching
DisaggregatedandHistorical[GR].csv
Grade Level Results Report
Participation Category Data
NECAP0809FallResultsReportParticipationLayout.xls
NECAP0809FallResultsReportTestingParticipation[GR].csv
Grade Level Results Report
Subtopic Data
NECAP0809FallResultsReport
SubtopicLayout.xls
NECAP0809FallResultsReportTestingSubtopic[GR].csv
NECAP0809FallResultsReportTeachingSubtopic[GR].csv
Summary Results Data NECAP0809FallSummaryResultsLayout.xls NECAP0809FallSummaryResultsTesting.csv
NECAP0809FallSummaryResultsTeaching.csv
Released Item Percent Responses Data
NECAP0809FallReleasedItemPercentResponsesLayout.xls
NECAP0809FallReleasedItemPercentResponses.csv
Invalidated Students Original Score NECAP0809FallStateInvalidatedStudent
OriginalScoredLayout.xls
NECAP0809FallStateInvalidatedStudent
OriginalScored[GR].csv
Student Questionnaire Summary NECAP0809FallStudentQuestionnaireSummaryLayout.xls
NECAP0809FallStudentQuestionnaireSummary.csv
TCTA Questionnaire Raw Data NECAP0809FallTCQuestionnaireRawLayout.xls
NECAP0809FallTAQuestionnaireRawLayout.xls
NECAP0809FallTCQuestionnaireRaw.csv
NECAP0809FallTAQuestionnaireRaw.csv
TCTA Questionnaire Frequency Distribution
NECAP0809FallTCTAQuestionnaireFreqLayout.xls
NECAP0809FallTCTAQuestionnaireFreq.csv
Scaled Score Lookup NECAP0809FallScaleScoreLookupLayout.xls
NECAP0809FallScaleScoreLookup.xls
NECAP0809FallScaleScoreLookup.csv
Subtopic Average Points Earned (For Project Management)
N/A NECAP0809FallSubtopicAvgPointsEarned.xls
Memo Shipping Files (For Program Management)
N/A TBD

Appendix L—Analysis and Reporting Decision Rules 21 2008–09 NECAP Science Technical Report
V. Spring Table Data File Deliverables
Data File Layout File Name
Preliminary State Results N/A Included in Equating Report
State Student Released Item Data NECAP0809SpringDistrictStudentLayout.xls NECAP0809SpringStateStudentReleasedItem[GR].csv
State Student Raw Data NECAP0809SpringStateStudentRawLayout.xls NECAP0809SpringStateStudentRaw[GR].csv
State Student Scored Data NECAP0809SpringStateStudentScoredLayout.xls NECAP0809SpringStateStudentScored[GR].csv
District Student Data NECAP0809SpringDistrictStudentLayout.xls NECAP0809SpringDistrictSlice[GR]_[District Code].csv
Common Item Information NECAP0809SpringCommonItemInformationLayout.xls
NECAP0809SpringCommonItemInformation.csv
Grade Level Results Report
Disaggregated and Historical Data
NECAP0809SpringResultsReport
DisaggregatedandHistoricaLayout.xls
NECAP0809SpringResultsReport
DisaggregatedandHistorical[GR].csv
Grade Level Results Report
Participation Category Data
NECAP0809SpringResultsReport
ParticipationLayout.xls
NECAP0809SpringResultsReport
Participation[GR].csv
Grade Level Results Report
Subtopic Data
NECAP0809SpringResultsReport
SubtopicLayout.xls
NECAP0809SpringResultsReport
Subtopic[GR].csv
Summary Results Data NECAP0809SpringSummaryResultsLayout.xls NECAP0809SpringSummaryResults.csv
Released Item Percent Responses Data
NECAP0809SpringReleasedItemPercentResponsesLayout.xls
NECAP0809SpringReleasedItemPercentResponses.csv
Invalidated Students Original Score
NECAP0809SpringStateInvalidatedStudent
OriginalScoredLayout.xls
NECAP0809SpringStateInvalidatedStudent
OriginalScored.csv
Student Questionnaire Summary NECAP0809SpringStudentQuestionnaireSummaryLayout.xls
NECAP0809SpringStudentQuestionnaireSummary.csv
TCTA Questionnaire Raw Data NECAP0809SpringTCQuestionnaireRawLayout.xls
NECAP0809SpringTAQuestionnaireRawLayout.xls
NECAP0809SpringTCQuestionnaireRaw.csv
NECAP0809SpringTAQuestionnaireRaw.csv
TCTA Questionnaire Frequency Distribution
NECAP0809SpringTCTAQuestionnaireFreqLayout.xls
NECAP0809SpringTCTAQuestionnaireFreq.csv
Scaled Score Lookup NECAP0809SpringScaleScoreLookupLayout.xls NECAP0809SpringScaleScoreLookup.xls
NECAP0809SpringScaleScoreLookup.csv
Subtopic Average Points Earned (For Project Management)
N/A NECAP0809SpringSubtopicAvgPointsEarned.xls
Item Stats for Inquiry Task Items (For Program Management)
N/A NECAP0809SpringInquiryItemStats.csv
Memo Shipping Files (For Program Management)
N/A TBD


Appendix M—Student Questionnaire Results 2008–09 NECAP Science Technical Report 1
Appendix M—STUDENT QUESTIONNAIRE RESULTS


Appendix M—Student Questionnaire Results 2008–09 NECAP Science Technical Report 3
Table M-1. 2008–09 NECAP Science: Average Scaled Scores, and Counts and Percentages Within Achievement Levels, of Responses to Student Survey Questions 1–12—Grade 4
Question Resp NResp %Resp AvgSS NSBP NPP NP NPWD %SBP %PP %P %PWD (Blank) 3,360 11 438 462 14 1,351 40 1,526 45 21 1
A 10,608 35 439 1,412 13 4,286 40 4,872 46 38 0 B 13,681 45 440 1,442 11 5,073 37 7,101 52 65 0 1
C 2,836 9 438 476 17 1,120 39 1,234 44 6 0 (Blank) 3,423 11 438 468 14 1,374 40 1,560 46 21 1
A 17,011 56 439 2,081 12 6,642 39 8,224 48 64 0 B 9,572 31 440 1,082 11 3,630 38 4,815 50 45 0 2
C 479 2 432 161 34 184 38 134 28 0 0 (Blank) 3,398 11 438 463 14 1,373 40 1,541 45 21 1
A 17,379 57 441 1,568 9 5,906 34 9,814 56 91 1 B 9,009 30 437 1,468 16 4,246 47 3,277 36 18 0 3
C 699 2 428 293 42 305 44 101 14 0 0 (Blank) 3,420 11 438 469 14 1,376 40 1,554 45 21 1
A 21,026 69 440 2,280 11 8,011 38 10,648 51 87 0 B 4,052 13 438 602 15 1,661 41 1,773 44 16 0 C 1,380 5 436 291 21 550 40 535 39 4 0
4
607 2 435 150 25 232 38 223 37 2 0 (Blank) 3,421 11 438 489 14 1,371 40 1,540 45 21 1
A 18,212 60 440 1,813 10 6,558 36 9,749 54 92 1 B 8,176 27 437 1,254 15 3,615 44 3,290 40 17 0 5
C 676 2 431 236 35 286 42 154 23 0 0 (Blank) 3,380 11 438 462 14 1,368 40 1,529 45 21 1
A 20,472 67 440 2,294 11 7,768 38 10,324 50 86 0 B 5,667 19 439 774 14 2,284 40 2,587 46 22 0 C 811 3 435 195 24 348 43 267 33 1 0
6
D 155 1 429 67 43 62 40 26 17 0 0 (Blank) 3,383 11 438 460 14 1,366 40 1,536 45 21 1
A 17,821 58 440 1,925 11 6,734 38 9,087 51 75 0 B 6,961 23 438 1,015 15 2,834 41 3,087 44 25 0 C 1,647 5 438 264 16 652 40 724 44 7 0
7
D 673 2 437 128 19 244 36 299 44 2 0 (Blank) 3,519 12 438 491 14 1,418 40 1,589 45 21 1
A 9,253 30 439 1,247 13 3,537 38 4,432 48 37 0 B 8,583 28 440 905 11 3,202 37 4,432 52 44 1 C 6,434 21 439 792 12 2,526 39 3,094 48 22 0
8
D 2,696 9 438 357 13 1,147 43 1,186 44 6 0 (Blank) 3,407 11 438 465 14 1,374 40 1,547 45 21 1
A 6,105 20 440 778 13 2,096 34 3,195 52 36 1 B 18,599 61 439 2,103 11 7,439 40 8,986 48 71 0 C 959 3 435 204 21 395 41 360 38 0 0 D 740 2 437 129 17 286 39 324 44 1 0
9
E 675 2 438 113 17 240 36 321 48 1 0 (Blank) 3,432 11 438 475 14 1,382 40 1,554 45 21 1
A 3,904 13 438 575 15 1,588 41 1,728 44 13 0 B 7,939 26 440 870 11 2,854 36 4,170 53 45 1 C 7,240 24 439 987 14 2,886 40 3,342 46 25 0 D 7,590 25 440 791 10 2,958 39 3,816 50 25 0
10
E 380 1 435 94 25 162 43 123 32 1 0 (Blank) 3,767 12 438 540 14 1,535 41 1,671 44 21 1
A 550 2 433 181 33 207 38 160 29 2 0 B 3,340 11 437 562 17 1,380 41 1,390 42 8 0 C 5,695 19 440 578 10 2,144 38 2,943 52 30 1
11
D 17,133 56 440 1,931 11 6,564 38 8,569 50 69 0 (Blank) 3,682 12 438 539 15 1,489 40 1,632 44 22 1
A 16,104 53 439 2,194 14 6,167 38 7,675 48 68 0 12 B 10,699 35 440 1,059 10 4,174 39 5,426 51 40 0
SS = scaled score; SBP = Substantially Below Proficient; PP = Partially Proficient; P = Proficient; PWD = Proficient With Distinction

Appendix M—Student Questionnaire Results 2008–09 NECAP Science Technical Report 4
Table M-2. 2008–09 NECAP Science: Average Scaled Scores, and Counts and Percentages Within Achievement Levels, of Responses to Student Survey Questions 1–15—Grade 8
Question Resp NResp %Resp AvgSS NSBP NPP NP NPWD %SBP %PP %P %PWD (Blank) 3,480 10 830 1,415 41 1,436 41 611 18 18 1
A 17,339 51 832 5,361 31 8,701 50 3,222 19 55 0 B 11,348 34 835 2,501 22 5,850 52 2,933 26 64 1 1
C 1,565 5 835 386 25 681 44 488 31 10 1 (Blank) 3,529 10 830 1,451 41 1,455 41 604 17 19 1
A 10,999 33 833 3,370 31 5,426 49 2,157 20 46 0 B 16,532 49 834 3,707 22 8,620 52 4,128 25 77 0 2
C 2,672 8 830 1,135 42 1,167 44 365 14 5 0 (Blank) 3,566 11 830 1,474 41 1,465 41 609 17 18 1
A 25,145 75 835 5,351 21 13,321 53 6,346 25 127 1 B 4,089 12 827 2,195 54 1,628 40 265 6 1 0 3
C 932 3 823 643 69 254 27 34 4 1 0 (Blank) 3,584 11 830 1,471 41 1,480 41 615 17 18 1
A 26,090 77 834 6,565 25 13,503 52 5,919 23 103 0 B 2,872 9 831 1,048 36 1,268 44 537 19 19 1 C 756 2 829 353 47 273 36 126 17 4 1
4
D 430 1 827 226 53 144 33 57 13 3 1 (Blank) 3,487 10 830 1,411 40 1,442 41 616 18 18 1
A 466 1 827 256 55 158 34 52 11 0 0 B 1,868 6 831 702 38 836 45 324 17 6 0 C 7,278 22 835 1,573 22 3,758 52 1,908 26 39 1 D 1,386 4 830 544 39 639 46 198 14 5 0
5
E 19,247 57 833 5,177 27 9,835 51 4,156 22 79 0 (Blank) 4,277 13 830 1,779 42 1,798 42 681 16 19 0
A 4,351 13 835 791 18 2,216 51 1,313 30 31 1 B 7,699 23 836 1,466 19 3,926 51 2,245 29 62 1 C 8,642 26 832 2,646 31 4,452 52 1,524 18 20 0
6
D 8,763 26 832 2,981 34 4,276 49 1,491 17 15 0 (Blank) 3,716 11 830 1,551 42 1,520 41 626 17 19 1
A 25,244 75 834 5,774 23 13,217 52 6,134 24 119 0 B 3,878 11 829 1,795 46 1,643 42 431 11 9 0 7
C 894 3 825 543 61 288 32 63 7 0 0 (Blank) 3,580 11 830 1,466 41 1,479 41 615 17 20 1
A 24,328 72 833 6,282 26 12,797 53 5,182 21 67 0 B 3,991 12 833 1,272 32 1,746 44 947 24 26 1 C 1,350 4 833 438 32 489 36 395 29 28 2
8
D 483 1 831 205 42 157 33 115 24 6 1 (Blank) 3,692 11 830 1,515 41 1,528 41 631 17 18 0
A 8,382 25 833 2,381 28 4,152 50 1,809 22 40 0 B 15,932 47 834 3,793 24 8,304 52 3,773 24 62 0 C 3,792 11 833 1,106 29 1,838 48 823 22 25 1
9
D 1,934 6 829 868 45 846 44 218 11 2 0 (Blank) 3,542 11 830 1,441 41 1,467 41 616 17 18 1
A 11,641 35 835 2,609 22 5,932 51 3,028 26 72 1 B 16,347 48 833 4,583 28 8,337 51 3,371 21 56 0 C 883 3 826 468 53 359 41 56 6 0 0 D 681 2 830 270 40 306 45 104 15 1 0
10
E 638 2 829 292 46 267 42 79 12 0 0 (Blank) 3,963 12 830 1,610 41 1,669 42 665 17 19 0
A 10,362 31 838 1,135 11 4,697 45 4,409 43 121 1 B 11,104 33 833 2,978 27 6,442 58 1,677 15 7 0 C 5,418 16 829 2,426 45 2,622 48 370 7 0 0
11
D 2,885 9 827 1,514 52 1,238 43 133 5 0 0 continued

Appendix M—Student Questionnaire Results 2008–09 NECAP Science Technical Report 5
Question Resp NResp %Resp AvgSS NSBP NPP NP NPWD %SBP %PP %P %PWD (Blank) 3,579 11 830 1,450 41 1,486 42 625 17 18 1
A 24,325 72 834 6,258 26 12,427 51 5,526 23 114 0 B 4,562 14 833 1,251 27 2,296 50 1,002 22 13 0 C 665 2 827 363 55 248 37 54 8 0 0 D 422 1 827 223 53 157 37 40 9 2 0
12
E 179 1 824 118 66 54 30 7 4 0 0 (Blank) 3,733 11 830 1,546 41 1,541 41 627 17 19 1
A 5,325 16 833 1,518 29 2,693 51 1,088 20 26 0 B 16,699 50 834 4,160 25 8,576 51 3,890 23 73 0 C 4,686 14 834 1,194 25 2,333 50 1,138 24 21 0
13
D 3,289 10 830 1,245 38 1,525 46 511 16 8 0 (Blank) 4,404 13 831 1,643 37 1,919 44 813 18 29 1
A 8,730 26 834 2,185 25 4,541 52 1,981 23 23 0 B 5,373 16 831 2,033 38 2,557 48 772 14 11 0 C 7,175 21 834 1,825 25 3,442 48 1,856 26 52 1 D 3,772 11 833 1,057 28 2,028 54 679 18 8 0
14
E 4,278 13 835 920 22 2,181 51 1,153 27 24 1 (Blank) 4,438 13 830 1,834 41 1,854 42 730 16 20 0
A 12,282 36 833 3,745 30 6,020 49 2,469 20 48 0 15 B 17,012 50 834 4,084 24 8,794 52 4,055 24 79 0
SS = scaled score; SBP = Substantially Below Proficient; PP = Partially Proficient; P = Proficient; PWD = Proficient With Distinction

Appendix M—Student Questionnaire Results 2008–09 NECAP Science Technical Report 6
Table M-3. 2008–09 NECAP Science: Average Scaled Scores, and Counts and Percentages Within Achievement Levels, of Responses to Student Survey Questions 1–19—Grade 11
Question Resp NResp %Resp AvgSS NSBP NPP NP NPWD %SBP %PP %P %PWD (Blank) 4,079 13 1,130 1,892 46 1,462 36 703 17 22 1
A 16,189 50 1,131 6,133 38 7,964 49 2,071 13 21 0 B 8,845 27 1,136 1,677 19 4,411 50 2,699 31 58 1 1
C 3,483 11 1,140 400 11 1,112 32 1,841 53 130 4 (Blank) 4,102 13 1,130 1,923 47 1,481 36 678 17 20 0
A 5,439 17 1,132 2,035 37 2,518 46 873 16 13 0 B 15,817 49 1,135 3,482 22 7,822 49 4,366 28 147 1 2
C 7,238 22 1,132 2,662 37 3,128 43 1,397 19 51 1 (Blank) 4,088 13 1,130 1,930 47 1,464 36 674 16 20 0
A 24,298 75 1,135 5,616 23 12,098 50 6,378 26 206 1 B 2,996 9 1,128 1,698 57 1,092 36 201 7 5 0 3
C 1,214 4 1,125 858 71 295 24 61 5 0 0 (Blank) 4,013 12 1,130 1,857 46 1,458 36 678 17 20 0
A 23,258 71 1,134 6,100 26 11,235 48 5,735 25 188 1 B 3,577 11 1,132 1,273 36 1,639 46 651 18 14 0 C 1,073 3 1,130 487 45 409 38 169 16 8 1
4
D 675 2 1,128 385 57 208 31 81 12 1 0 (Blank) 4,184 13 1,130 1,972 47 1,508 36 684 16 20 0
A 7,362 23 1,136 1,385 19 3,635 49 2,279 31 63 1 B 10,212 31 1,135 2,376 23 5,091 50 2,646 26 99 1 C 6,451 20 1,133 2,188 34 3,059 47 1,173 18 31 0
5
D 4,387 13 1,129 2,181 50 1,656 38 532 12 18 0 (Blank) 3,928 12 1,130 1,812 46 1,424 36 672 17 20 1
A 728 2 1,127 418 57 229 31 80 11 1 0 B 2,856 9 1,133 858 30 1,299 45 676 24 23 1 C 7,280 22 1,137 1,259 17 3,482 48 2,437 33 102 1 D 3,042 9 1,131 1,158 38 1,390 46 484 16 10 0
6
E 14,762 45 1,133 4,597 31 7,125 48 2,965 20 75 1 (Blank) 4,121 13 1,130 1,914 46 1,505 37 682 17 20 0
A 21,183 65 1,135 5,380 25 10,257 48 5,365 25 181 1 B 4,900 15 1,133 1,633 33 2,328 48 915 19 24 0 C 1,629 5 1,130 718 44 640 39 267 16 4 0
7
D 763 2 1,127 457 60 219 29 85 11 2 0 (Blank) 4,584 14 1,130 2,050 45 1,734 38 780 17 20 0
A 2,650 8 1,133 916 35 1,106 42 608 23 20 1 B 7,656 23 1,135 1,767 23 3,649 48 2,175 28 65 1 C 8,089 25 1,134 2,046 25 4,042 50 1,940 24 61 1
8
D 9,617 30 1,133 3,323 35 4,418 46 1,811 19 65 1 (Blank) 4,054 12 1,130 1,847 46 1,496 37 691 17 20 0
A 7,647 23 1,136 1,559 20 3,543 46 2,451 32 94 1 B 16,009 49 1,134 4,106 26 8,006 50 3,790 24 107 1 C 2,755 8 1,128 1,472 53 1,066 39 212 8 5 0 D 799 2 1,129 412 52 313 39 71 9 3 0
9
E 1,332 4 1,128 706 53 525 39 99 7 2 0 (Blank) 4,250 13 1,130 1,870 44 1,565 37 787 19 28 1
A 14,298 44 1,134 3,816 27 7,174 50 3,235 23 73 1 B 5,665 17 1,134 1,672 30 2,488 44 1,439 25 66 1 C 4,483 14 1,134 1,300 29 2,026 45 1,121 25 36 1 D 3,186 10 1,134 927 29 1,524 48 707 22 28 1
10
E 714 2 1,125 517 72 172 24 25 4 0 0 (Blank) 4,491 14 1,130 1,943 43 1,674 37 841 19 33 1
A 17,622 54 1,134 4,412 25 8,969 51 4,142 24 99 1 B 2,289 7 1,130 993 43 1,008 44 286 12 2 0 C 5,810 18 1,135 1,412 24 2,464 42 1,842 32 92 2 D 1,184 4 1,129 617 52 428 36 135 11 4 0
11
E 1,200 4 1,127 725 60 406 34 68 6 1 0 continued
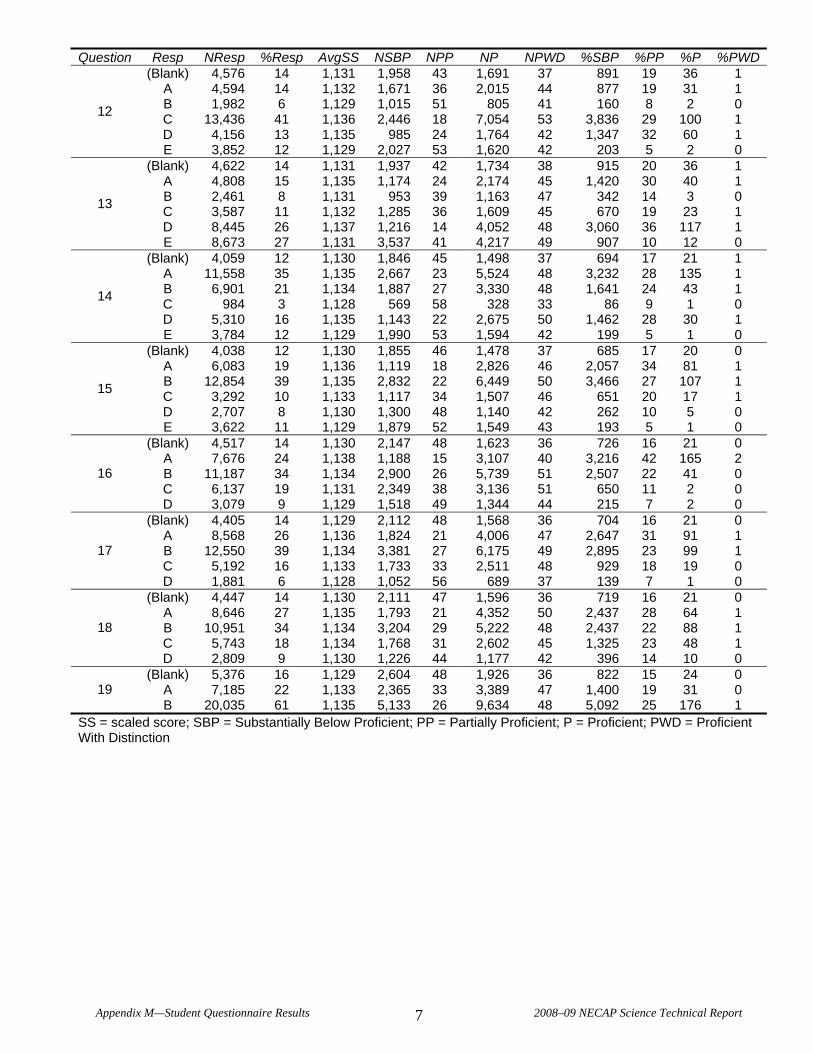
Appendix M—Student Questionnaire Results 2008–09 NECAP Science Technical Report 7
Question Resp NResp %Resp AvgSS NSBP NPP NP NPWD %SBP %PP %P %PWD (Blank) 4,576 14 1,131 1,958 43 1,691 37 891 19 36 1
A 4,594 14 1,132 1,671 36 2,015 44 877 19 31 1 B 1,982 6 1,129 1,015 51 805 41 160 8 2 0 C 13,436 41 1,136 2,446 18 7,054 53 3,836 29 100 1 D 4,156 13 1,135 985 24 1,764 42 1,347 32 60 1
12
E 3,852 12 1,129 2,027 53 1,620 42 203 5 2 0 (Blank) 4,622 14 1,131 1,937 42 1,734 38 915 20 36 1
A 4,808 15 1,135 1,174 24 2,174 45 1,420 30 40 1 B 2,461 8 1,131 953 39 1,163 47 342 14 3 0 C 3,587 11 1,132 1,285 36 1,609 45 670 19 23 1 D 8,445 26 1,137 1,216 14 4,052 48 3,060 36 117 1
13
E 8,673 27 1,131 3,537 41 4,217 49 907 10 12 0 (Blank) 4,059 12 1,130 1,846 45 1,498 37 694 17 21 1
A 11,558 35 1,135 2,667 23 5,524 48 3,232 28 135 1 B 6,901 21 1,134 1,887 27 3,330 48 1,641 24 43 1 C 984 3 1,128 569 58 328 33 86 9 1 0 D 5,310 16 1,135 1,143 22 2,675 50 1,462 28 30 1
14
E 3,784 12 1,129 1,990 53 1,594 42 199 5 1 0 (Blank) 4,038 12 1,130 1,855 46 1,478 37 685 17 20 0
A 6,083 19 1,136 1,119 18 2,826 46 2,057 34 81 1 B 12,854 39 1,135 2,832 22 6,449 50 3,466 27 107 1 C 3,292 10 1,133 1,117 34 1,507 46 651 20 17 1 D 2,707 8 1,130 1,300 48 1,140 42 262 10 5 0
15
E 3,622 11 1,129 1,879 52 1,549 43 193 5 1 0 (Blank) 4,517 14 1,130 2,147 48 1,623 36 726 16 21 0
A 7,676 24 1,138 1,188 15 3,107 40 3,216 42 165 2 B 11,187 34 1,134 2,900 26 5,739 51 2,507 22 41 0 C 6,137 19 1,131 2,349 38 3,136 51 650 11 2 0
16
D 3,079 9 1,129 1,518 49 1,344 44 215 7 2 0 (Blank) 4,405 14 1,129 2,112 48 1,568 36 704 16 21 0
A 8,568 26 1,136 1,824 21 4,006 47 2,647 31 91 1 B 12,550 39 1,134 3,381 27 6,175 49 2,895 23 99 1 C 5,192 16 1,133 1,733 33 2,511 48 929 18 19 0
17
D 1,881 6 1,128 1,052 56 689 37 139 7 1 0 (Blank) 4,447 14 1,130 2,111 47 1,596 36 719 16 21 0
A 8,646 27 1,135 1,793 21 4,352 50 2,437 28 64 1 B 10,951 34 1,134 3,204 29 5,222 48 2,437 22 88 1 C 5,743 18 1,134 1,768 31 2,602 45 1,325 23 48 1
18
D 2,809 9 1,130 1,226 44 1,177 42 396 14 10 0 (Blank) 5,376 16 1,129 2,604 48 1,926 36 822 15 24 0
A 7,185 22 1,133 2,365 33 3,389 47 1,400 19 31 0 19 B 20,035 61 1,135 5,133 26 9,634 48 5,092 25 176 1
SS = scaled score; SBP = Substantially Below Proficient; PP = Partially Proficient; P = Proficient; PWD = Proficient With Distinction

Appendix M—Student Questionnaire Results 2008–09 NECAP Science Technical Report 8

Appendix M—Student Questionnaire Results 2008–09 NECAP Science Technical Report 9

Appendix M—Student Questionnaire Results 2008–09 NECAP Science Technical Report 10

Appendix M—Student Questionnaire Results 2008–09 NECAP Science Technical Report 11
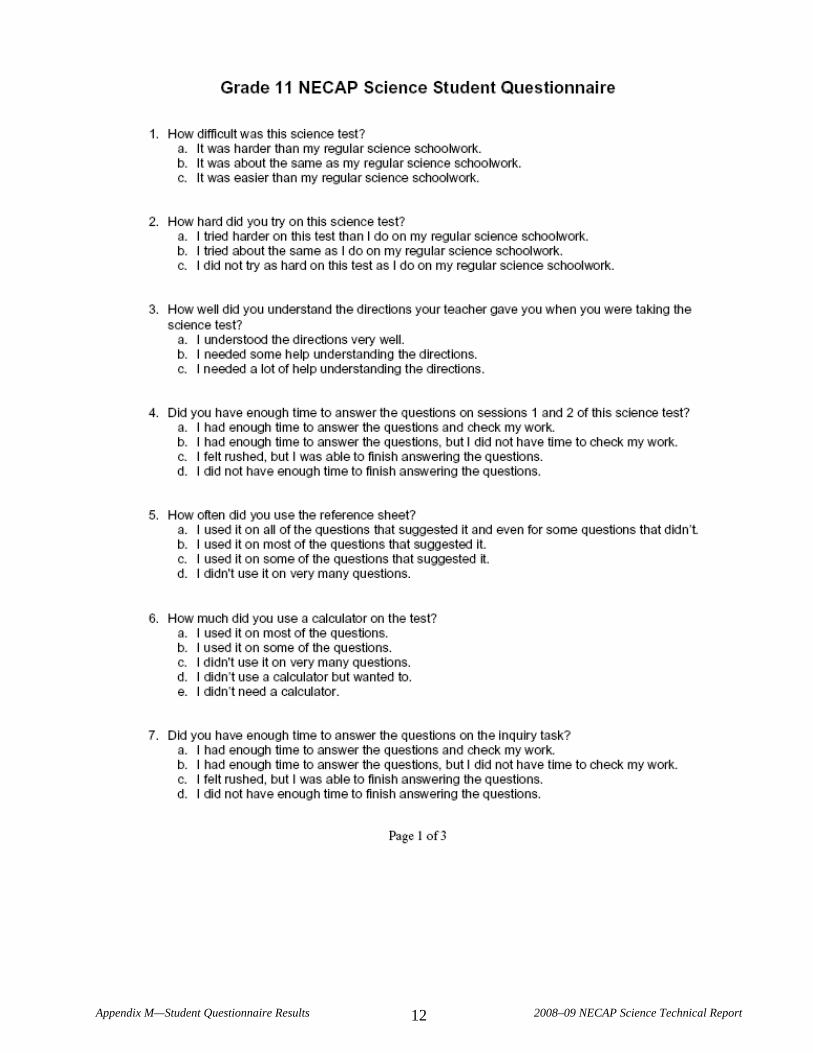
Appendix M—Student Questionnaire Results 2008–09 NECAP Science Technical Report 12

Appendix M—Student Questionnaire Results 2008–09 NECAP Science Technical Report 13

Appendix M—Student Questionnaire Results 2008–09 NECAP Science Technical Report 14