science 10 provincial exam study booklet unit 3 · pdf filescience 10 ! provincial exam study...
TRANSCRIPT

Science 10 !
PROVINCIAL EXAM STUDY BOOKLET
!
Unit 3 !
Physics/Motion !
!!
!Student Instructions !
1. Ensure that you have blank paper and a Data Booklet. !2. Record all answers on a separate piece of paper. !3. Answer keys are provided by your teacher. !4. When you have finished with this Study Booklet please return it to your teacher. !!
Make NO MARKS on this study booklet!

1. Which of the following is an appropriate unit for velocity? A. s B. m C. m/s2 D. km/h !
2. The following distance-time graph shows a 100m race among three friends. !
! What was the outcome of the race?
A. Al won the race. B. Bob won the race. C. Charlie won the race. D. The race was a three-way tie. !
Use the following information to answer the next two questions. The data represents the motion of a girl riding her skateboard along a smooth, pedestrian-free
sidewalk. You may find it useful to graph the data in the table on the grid provided.
! 3. What does the slope of the line represent?
A. the distance the skateboarder travelled B. the average velocity of the skateboarder C. the path taken by the skateboarder, as she is moving up a hill D. the most likely positions of the skateboarder at the times between the recorded data points !
4. How far did the girl move during 3 s? A. 3.0m B. 4.5m C. 6.0m D. 9.0m !!!!!

5. Which of the following statements describe the relationship among displacement, time interval and average velocity for an object travelling in uniform motion? !
!A. I and II only B. I and III only C. II and III only D. I, II and III !
6. The following graph shows the velocity of a taxi as it travels to the airport.
! During which interval of the journey is the taxi stopped?
A. from point A → point B B. from point B → point C C. from point C → point D D. from point D → point E !
Use the following information for a car moving with constant acceleration to answer the next 3 questions.
! 7. The car has negative acceleration.
A. The statement is supported by the information given. B. The statement is refuted by the information given. C. The statement is neither supported nor refuted by the information. !
8. Every second, the velocity of the car increases by 5m/s. A. The statement is supported by the information given. B. The statement is refuted by the information given C. The statement is neither supported nor refuted by the information.
I When Δd gets larger and Δt is constant, the average velocity get larger.II When Δt gets larger and Δd is constant, the average velocity gets smaller.III When vav

9. The velocity of the car at X is 5m/s. A. The statement is supported by the information given. B. The statement is refuted by the information given C. The statement is neither supported nor refuted by the information. !
Use the following information to answer the question. !
! 10. Which of the following statements are supported by the diagram and experiment?
!A. I only B. I and II only C. II and III only D. I, II and III !
11. A Grand Prix race car changes its velocity from 0 km/h to 160 km/h in 2.5 s. Which of the following describes the motion of the car?
A. uniform motion B. zero acceleration C. positive acceleration D. negative acceleration !
12. A car accelerates from rest at a constant 5 m/s2. How long will it take the car to reach 10 m/s?
A. 2 s B. 5 s C. 10 s D. 50 s !13. A motorist travels at 2 m/s and then acclerates at a rate of 6 m/s2 for 3 s. What is the final velocity of the car?
A. 2 m/s B. 6 m/s C. 8 m/s D. 20 m/s !14. Which of the following symbols represents a change in quantity?
A. α B. β C. ϒ D. Δ ! !!!
I The balls fall with the same accelerationII Each ball's velocity increases as it falls.III As they fall, the distance between the balls increases.

Use the following position vs. time graph to answer the next question.
! 15. Which of the following describes the situation shown above? A. Object B has a lower velocity. B. Object B has a higher velocity. C. Both objects travelled the same distance. D. Both objects started at the same location. !
Use the following position vs. time graph to answer the next question. !
! 16. What distance is travelled in the first 15 hours? A. 0 km B. 60 km C. 120 km D. 180 km !
Use the following position vs. time graph to answer question 17. !
! 17. Ray and Mark are running on a track and a sample of their progress is plotted on a graph. Which of the following statements are supported by the graph?
! A. I only B. III only C. I and II only D. I and III only !!!
I Ray is running faster than Mark.II Mark runs farther than Ray during the same time interval.III Ray has a greater displacement during each time interval than Mark.
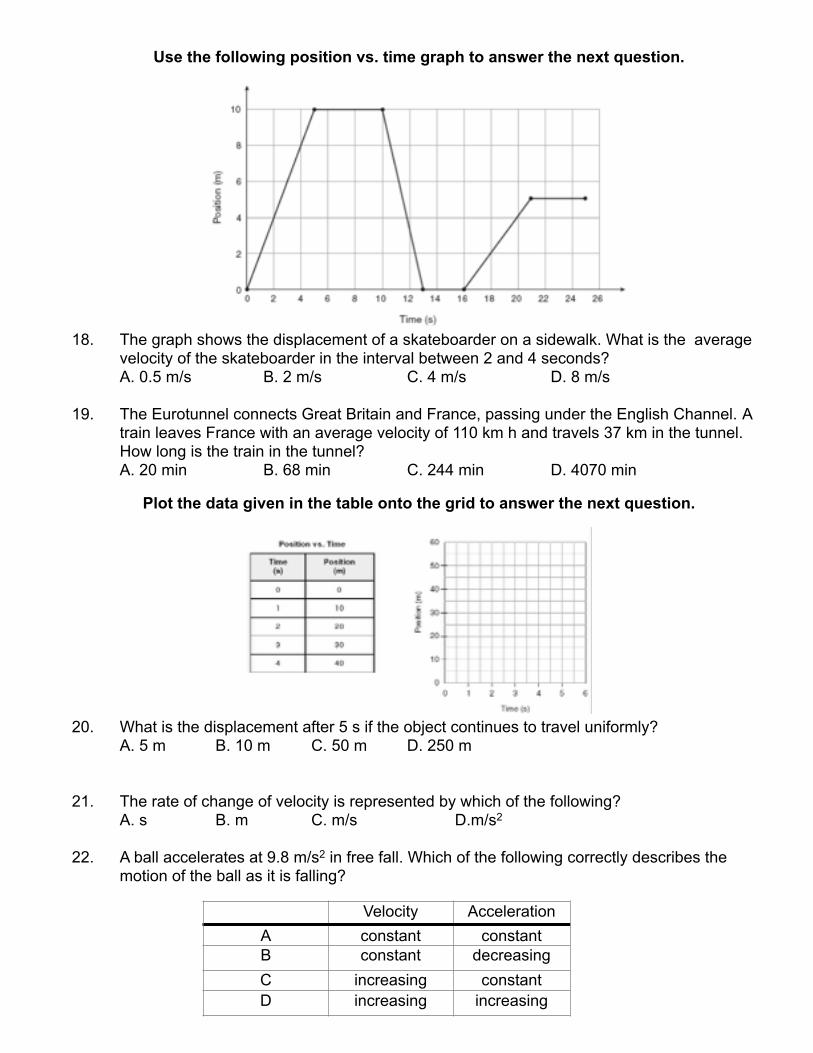
Use the following position vs. time graph to answer the next question. !
! 18. The graph shows the displacement of a skateboarder on a sidewalk. What is the average velocity of the skateboarder in the interval between 2 and 4 seconds? A. 0.5 m/s B. 2 m/s C. 4 m/s D. 8 m/s !19. The Eurotunnel connects Great Britain and France, passing under the English Channel. A train leaves France with an average velocity of 110 km h and travels 37 km in the tunnel. How long is the train in the tunnel? A. 20 min B. 68 min C. 244 min D. 4070 min !
Plot the data given in the table onto the grid to answer the next question. !
! 20. What is the displacement after 5 s if the object continues to travel uniformly? A. 5 m B. 10 m C. 50 m D. 250 m !!21. The rate of change of velocity is represented by which of the following? A. s B. m C. m/s D.m/s2 !22. A ball accelerates at 9.8 m/s2 in free fall. Which of the following correctly describes the motion of the ball as it is falling?
Velocity AccelerationA constant constantB constant decreasingC increasing constantD increasing increasing

Use the following velocity vs. time graph to answer the next question. !
! 23. The graph above shows the motion of a dragster. During which interval does the dragster have the greatest acceleration? A. interval I B. interval II C. interval III D. interval IV !24. A NASA space shuttle accelerates from rest to a velocity of 50 m s in 4 s. What calculation must be used to determine the shuttle’s acceleration?
!Use the data given in the table and the grid provided to answer the next question.
The data represents the motion of a powerboat. Use the grid provided to determine the acceleration of the boat.
!25. What is the acceleration of the boat? A. 1 m/ s2 B. 2 m/ s2 C. 3 m/ s2 D. 4 m/ s2 !!!!
A
B
C
D!
!
!
!
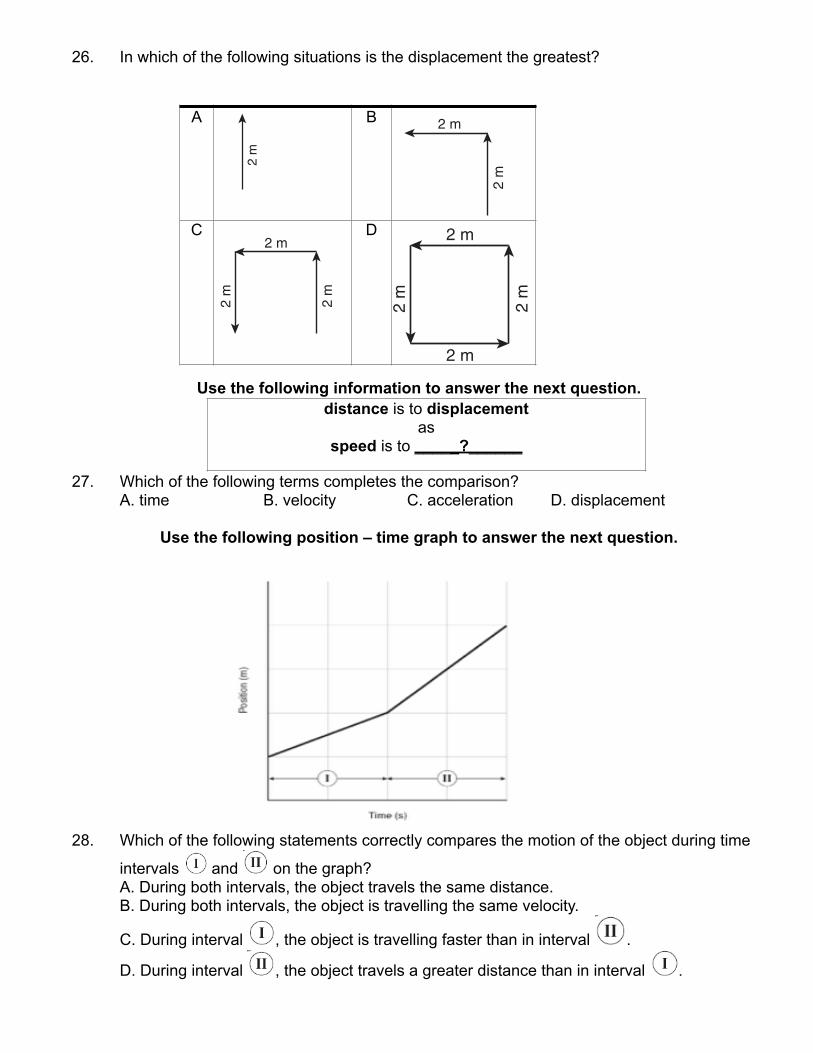
26. In which of the following situations is the displacement the greatest?
Use the following information to answer the next question.
27. Which of the following terms completes the comparison? A. time B. velocity C. acceleration D. displacement !
Use the following position – time graph to answer the next question.
28. Which of the following statements correctly compares the motion of the object during time
intervals ! and ! on the graph? A. During both intervals, the object travels the same distance. B. During both intervals, the object is travelling the same velocity.
C. During interval ! , the object is travelling faster than in interval ! .
D. During interval ! , the object travels a greater distance than in interval ! .
distance is to displacement as
speed is to _____?______
B.
2 m
2 m
2 m
2 m
2 m
2 m
2 m
2 m
2 m
A B
C D
!
2 m

Use the following graphical representation of a swimmer to answer the next question. !!!!!!!!!!!!!!!!29. Which part of the graph shows the swimmer resting for 100 s? A. A B. B C. C D. D !30. A family on vacation drove 200 km in two hours and then travelled only 40 km during the
next hour due to a construction zone. What was the family’s average velocity during the trip? A. 40 km/h B. 70 km/h C. 80 km/h D. 120 km/h !31. Which of the following units is associated with the ! symbol in motion formulae? A. s B. m C. m/s D. m/s2 !32. A mosquito flies at 4 m/s covering a distance of 5m. What calculation determines the time
interval?
33. Light travelling at 300 000 km/s takes 8 minutes to travel from the sun to the earth. What is the distance from the sun to the earth? A. 37 000 km B. 225 000 km C. 2 400 000 km D.144 000 000 km !!!!!!!
A
B
C
D! D. t = 5 m � 4 m s
! B. t = 4 m s
5 m
! C. t = 5 m × 4 m s
! A. t = 5 m
4 m s
Science 10 – 2011/12 Released Form A Page 27
Use the following graphical representation of a swimmer to answer question 55.
1600
1400
1200
1000
800
600
400
200
0 100 200 300
Time (s)
Pos
ition
(m)
A
B
C
D
55. Which part of the graph shows the swimmer resting for 100 s?
A. A
B. B
C. C
D. D
56. A family on vacation drove 200 km in two hours and then travelled only 40 km during
the next hour due to a construction zone. What was the family’s average velocity during the trip?
A. 40 km h
B. 70 km h
C. 80 km h
D. 120 km h
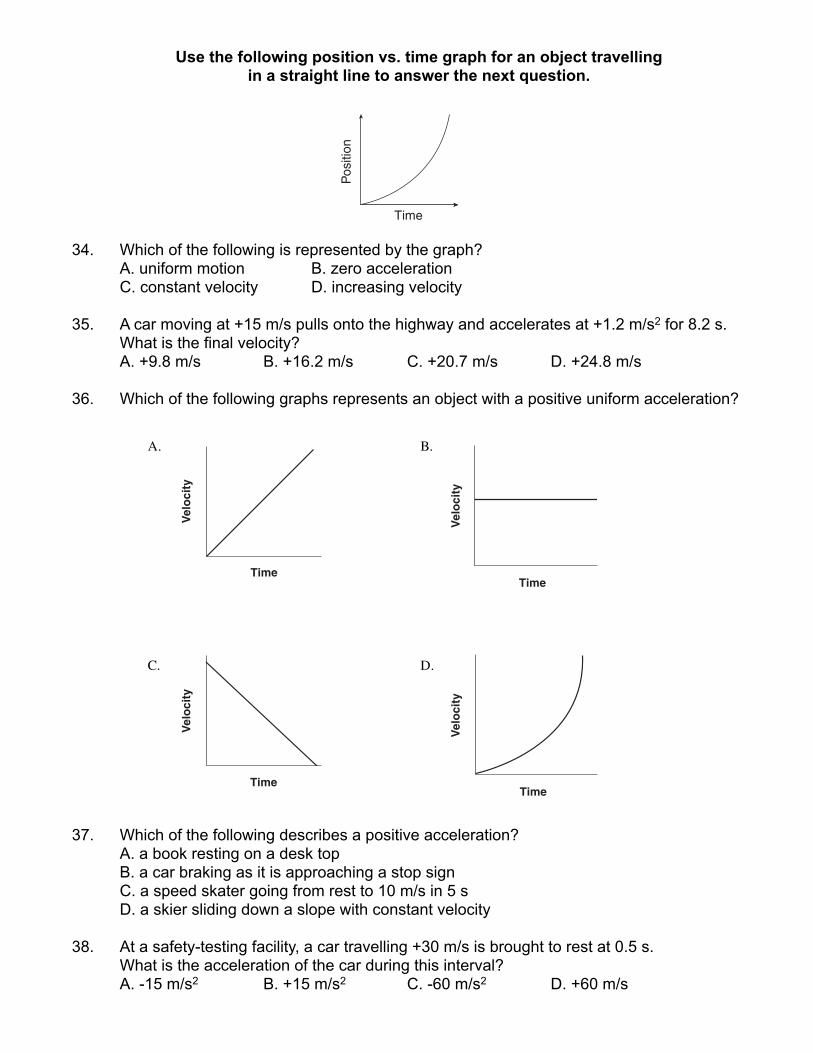
Use the following position vs. time graph for an object travelling in a straight line to answer the next question.
34. Which of the following is represented by the graph? A. uniform motion B. zero acceleration C. constant velocity D. increasing velocity !35. A car moving at +15 m/s pulls onto the highway and accelerates at +1.2 m/s2 for 8.2 s. What is the final velocity? A. +9.8 m/s B. +16.2 m/s C. +20.7 m/s D. +24.8 m/s !36. Which of the following graphs represents an object with a positive uniform acceleration?
37. Which of the following describes a positive acceleration? A. a book resting on a desk top B. a car braking as it is approaching a stop sign C. a speed skater going from rest to 10 m/s in 5 s D. a skier sliding down a slope with constant velocity !38. At a safety-testing facility, a car travelling +30 m/s is brought to rest at 0.5 s. What is the acceleration of the car during this interval? A. -15 m/s2 B. +15 m/s2 C. -60 m/s2 D. +60 m/s Science 10 – 2011/12 Released Form A Page 29
Use the following position vs. time graph for an object travelling in a straight line to answer question 60.
Pos
ition
Time 60. Which of the following conditions is represented by the graph? A. uniform motion B. zero acceleration C. constant velocity D. increasing velocity
61. A car moving at +15 m s pulls onto the highway and accelerates at +1.2 m s2 for 8.2 s.
What is its final velocity? A. +9.8 m s
B. +16.2 m s
C. +20.7 m s
D. +24.8 m s
Page 30 Science 10 – 2011/12 Released Form A
62. Which of the following graphs represents an object with a positive uniform acceleration?
A.
Time
Velo
city
B.
Time
Velo
city
C.
Time
Velo
city
D.
Time
Velo
city
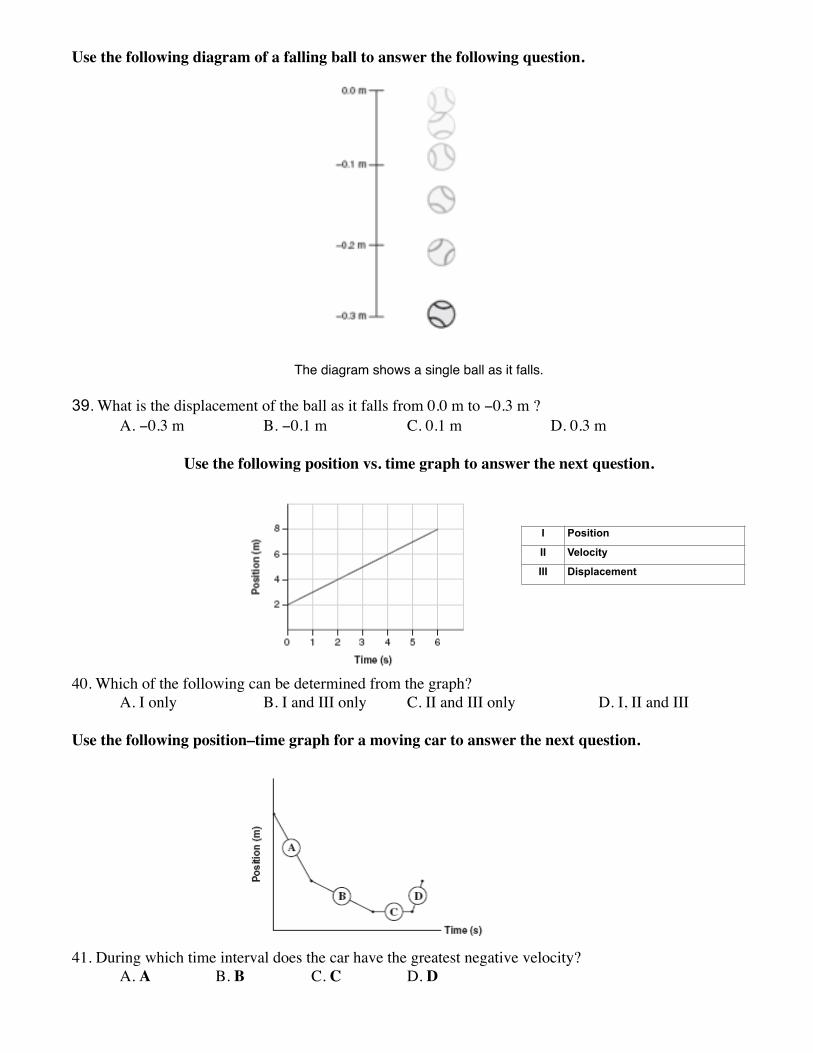
Use the following diagram of a falling ball to answer the following question.!
!The diagram shows a single ball as it falls.!!
39. What is the displacement of the ball as it falls from 0.0 m to −0.3 m ? A. −0.3 m B. −0.1 m C. 0.1 m D. 0.3 m !
Use the following position vs. time graph to answer the next question.
40. Which of the following can be determined from the graph? A. I only B. I and III only C. II and III only D. I, II and III !Use the following position–time graph for a moving car to answer the next question.
41. During which time interval does the car have the greatest negative velocity? A. A B. B C. C D. D
I Position
II Velocity
III Displacement

!Use the following graphic and position–time graph to answer the next 2 questions.
!!!!!!!!!!!!!!!!42. A tightrope walker starts 2 m from the centre of a rope. Which of the following describes the sequence of events that follow? !
! A. I and II only B. I and III only C. II and III only D. I, II and III !43. During which time interval is the tightrope walker moving with a positive velocity? A. 0–2 s B. 2–5 s C. 5–9 s D. 9–10 s !44. In the 2008 Beijing Olympics, Usain Bolt set two world records. He ran the 100 m race in 9.69 s and the 200 m race in 19.30 s. What was his average velocity for each race?
!45. A dragonfly travels 100 m north at 8 m/s, then 50 m north at 10 m/s . What is its average velocity? A. 8.3 m/s north B. 8.6 m/s north C. 16.7 m/s north D. 25.0 m/s north !!
I From 0 to 2 s, the walker moves in a negative direction.II From 2 to 5 s, the walker stands still.III From 5 to 9 s, the walker moves in a positive direction.
Average velocity: 100 m race
Average velocity: 200 m race
A +0.0969 m s +0.0965 m s
B +10.32 m s +10.36 m s
C +10.35 m s +10.35 m s
D +10.41m s +20.82 m s
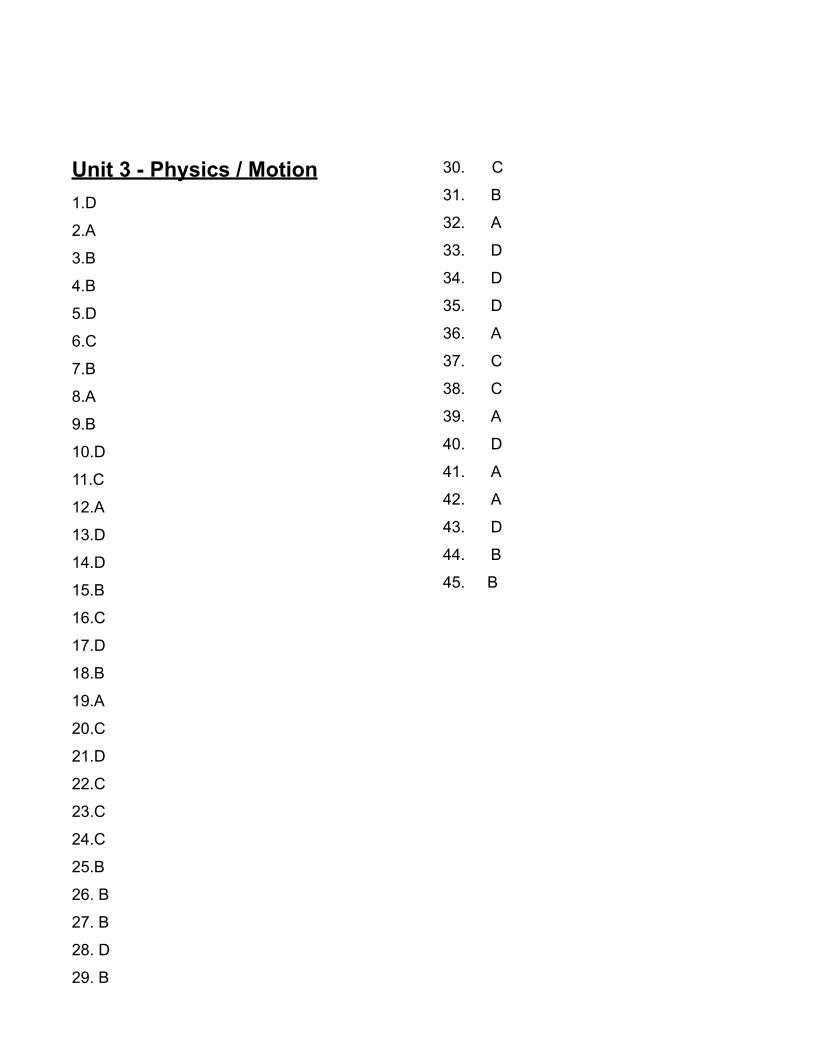
!!!!!!Unit 3 - Physics / Motion
1.D
2.A
3.B
4.B
5.D
6.C
7.B
8.A
9.B
10.D
11.C
12.A
13.D
14.D
15.B
16.C
17.D
18.B
19.A
20.C
21.D
22.C
23.C
24.C
25.B
26. B
27. B
28. D
29. B
30. C
31. B
32. A
33. D
34. D
35. D
36. A
37. C
38. C
39. A
40. D
41. A
42. A
43. D
44. B
45. B
!!