schools for equity in education facilitating achievement across the student lifecycle
TRANSCRIPT

Schools for Equity in Education
Facilitating Achievement Across the Student
Lifecycle
2 SEE January 27, 2012 Meeting
Welcome & Overview
Introduction
Three macro forces influencing P-20 education
Individualizing student learning as a means to improving P-20 student success States’ Progress Minnesota Your district

3 SEE January 27, 2012 Meeting
Naviance, a Hobsons Company
• Naviance, the K-12 division of Hobsons
• Hobsons, a global P-20 education company providing institutions and students with planning, access, and retention solutions
• 600-person business unit of the Daily Mail and General Trust
• Proud of our work with MN schools in K-12 and HE
• 63% (160,000) of ALL Minnesota H.S. students have an active Naviance account
• Just under 30 MN colleges and universities use Hobsons HE enrollment solutions and marketing services
4 SEE January 27, 2012 Meeting
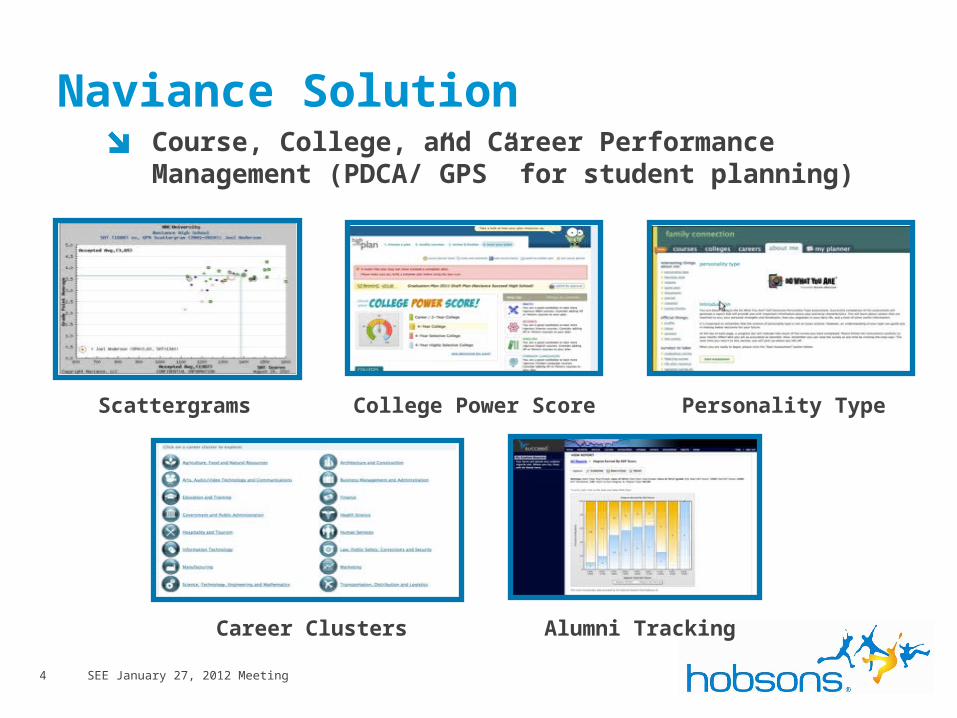
Naviance SolutionCourse, College, and Career Performance Management (PDCA/”GPS” for student planning)
Scattergrams
College Power Score Personality Type
Career Clusters Alumni Tracking

5 SEE January 27, 2012 Meeting
The MN Naviance Class of 2011
• 47,106 students in the MN Naviance graduating class of 2011 (~ 5% of the U.S. Naviance class of 2011):
• Submitted 82,177 college applications (~2.8% of all Naviance
student applications) – 43,197 applications to MN colleges and universities (facilitated electronically through eDocs)
• Submitted 216,009 scholarship applications
• Reported awards of $28.7 million in scholarships
6 SEE January 27, 2012 Meeting
F1: Global Economic Competitiveness“The goal for America’s educational system is clear: Every student should graduate from high school ready for college and a career by 2020. We must lead the world in college completion by 2020” – President Obama
We’re in 16th place and we’ve heard this before…•1983 – A Nation at Risk (standards)
•1994 – Goals 2000 (performance targets)
•2001 – No Child Left Behind (accountability)
•2009 – ARRA/Race to the Top
7 SEE January 27, 2012 Meeting
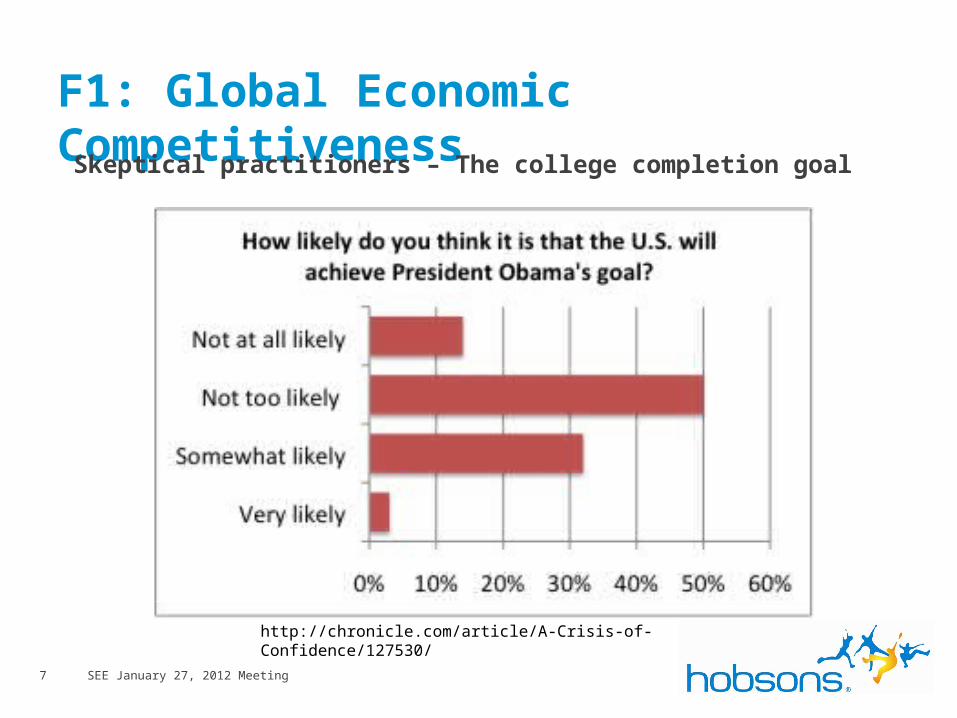
F1: Global Economic CompetitivenessSkeptical practitioners – The college completion goal
http://chronicle.com/article/A-Crisis-of-Confidence/127530/

8 SEE January 27, 2012 Meeting
F1: Global Economic CompetitivenessSupply and demand challenge:
“In 15 years, the U.S. will be 1,000,000 degreed
students short in order to fill U.S. jobs – 1,000,000
good-paying, professional jobs will need to be
“outsourced”. (Bruce Vandal, Director, Postsecondary & Workforce Development Institute, Education Commission of the States, 2010)

9 SEE January 27, 2012 Meeting
F1: Global Economic Competitiveness

10 SEE January 27, 2012 Meeting
F2: Cost of Education – Buyer
Cost for the buyer (student) soars:• Total outstanding student debt = $1 trillion at the end of
2011
• Average debt for 2010 college graduate = $25,250 (5% increase from last year)
• Total U.S. student debt total grows by $2,853.88 each second
Annual Cost MN Schools Average* Technical & Community Colleges $5,173 State Universities $7,323University of Minnesota $13,062 Private Career Colleges $14,042 Private Colleges & Universities $31,862*Published cost: getreadyforcollege.org 2012

11 SEE January 27, 2012 Meeting
F2: Cost of Education – K12 ProviderDeep reductions to K-12 state formula funding since the onset of the recession
•ARRA has expired
•Rainy day funds are exhausted
•States have resisted raising additional taxes
•Pressure on school districts
•New School Year Brings Steep Cuts in State Funding for Schools
(Center on Budget & Policy Priorities, Oct. 6, 2011)

12 SEE January 27, 2012 Meeting
F2: Cost of Education – HE Provider

13 SEE January 27, 2012 Meeting
F3: Consumer-Driven Education
More than ever, education customers (students) have choice and power
Access to K-12 and HE institutional data to determine best SROI
Growth of K-12 school choice (charters) and proliferation of postsecondary options
Increase in college applications per student/HE cost per student enrollment
However, choice is dependent on access and information, which is not afforded to all students…

14 SEE January 27, 2012 Meeting
F3: Consumer-Driven Education
The HE consumer “looks” different today
•17,600,000 undergrads enrolled in US HE today
•37% of these undergrads are enrolled part-time
•32% of undergrads work full time
•36% of students in four-year colleges graduate in four years

15 SEE January 27, 2012 Meeting
F3: Consumer-Driven Education
And the consumer will “look” different in the future…
K-12 student demographics (2010 to 2020) flat for students who are White; Black; increase 25% for students who are Hispanic;increase 36% for students who are Asian/Pacific Islanderincrease 17% for students who are American Indian/Alaska
Native
HE student demographics (2010 to 2020)flat for students who are White; American Indian/Alaska Nativeincrease 25% for students who are Black;increase 46% for students who are Hispanic;increase 25% for students who are Asian/Pacific Islander

16 SEE January 27, 2012 Meeting
F3: Consumer-Driven Education
Demand for anywhere, anytime learning
Distance education, hybrid models that blend online with face-to-face instruction (Rocketship Education)
DIY: iTunesU, DIYu
“Small” colleges – Pepperdine U in Malibu AND Buenos Aires, Florence, Heidelberg, London, Shanghai, Switzerland
17 SEE January 27, 2012 Meeting
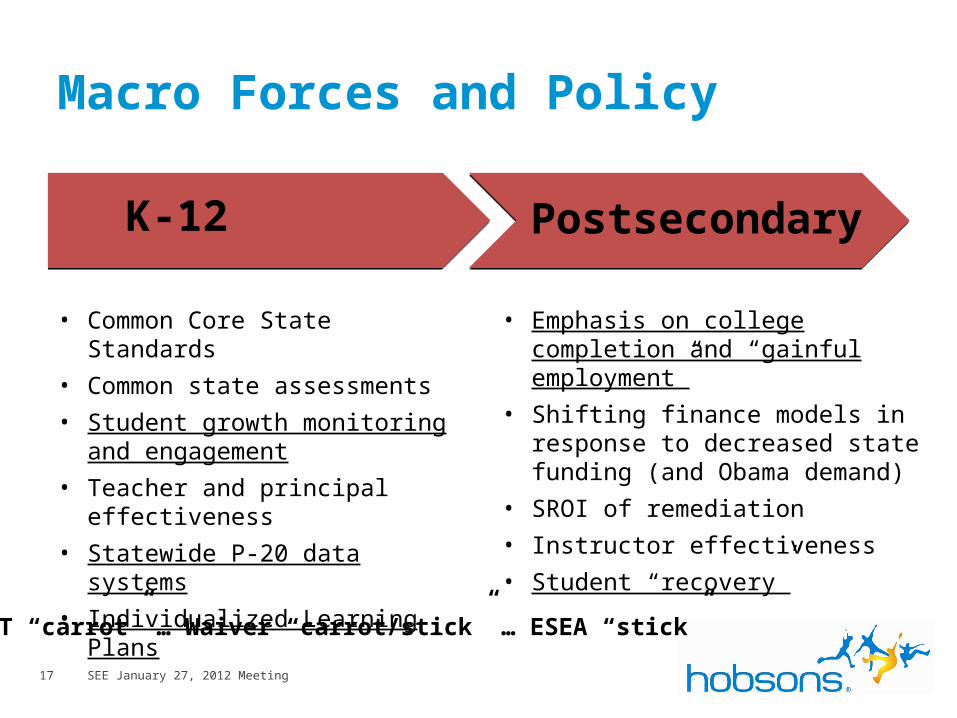
Macro Forces and Policy
K-12 Postsecondary
• Common Core State Standards
• Common state assessments
• Student growth monitoring and engagement
• Teacher and principal effectiveness
• Statewide P-20 data systems
• Individualized Learning Plans
• Emphasis on college completion and “gainful employment”
• Shifting finance models in response to decreased state funding (and Obama demand)
• SROI of remediation
• Instructor effectiveness
• Student “recovery”
RttT “carrot” … Waiver “carrot/stick” … ESEA “stick”
18 SEE January 27, 2012 Meeting
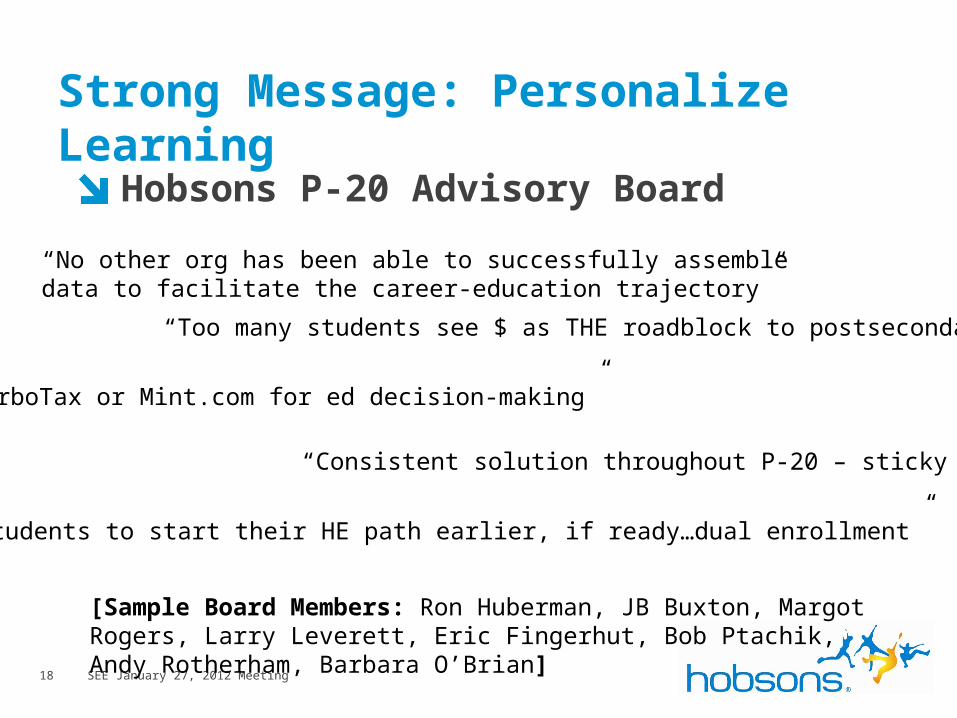
Strong Message: Personalize Learning
Hobsons P-20 Advisory Board
“No other org has been able to successfully assemble data to facilitate the career-education trajectory”
“Too many students see $ as THE roadblock to postsecondary ed”
“TurboTax or Mint.com for ed decision-making”
“Consistent solution throughout P-20 – sticky”
“Enable students to start their HE path earlier, if ready…dual enrollment”
[Sample Board Members: Ron Huberman, JB Buxton, Margot Rogers, Larry Leverett, Eric Fingerhut, Bob Ptachik, Andy Rotherham, Barbara O’Brian]
19 SEE January 27, 2012 Meeting
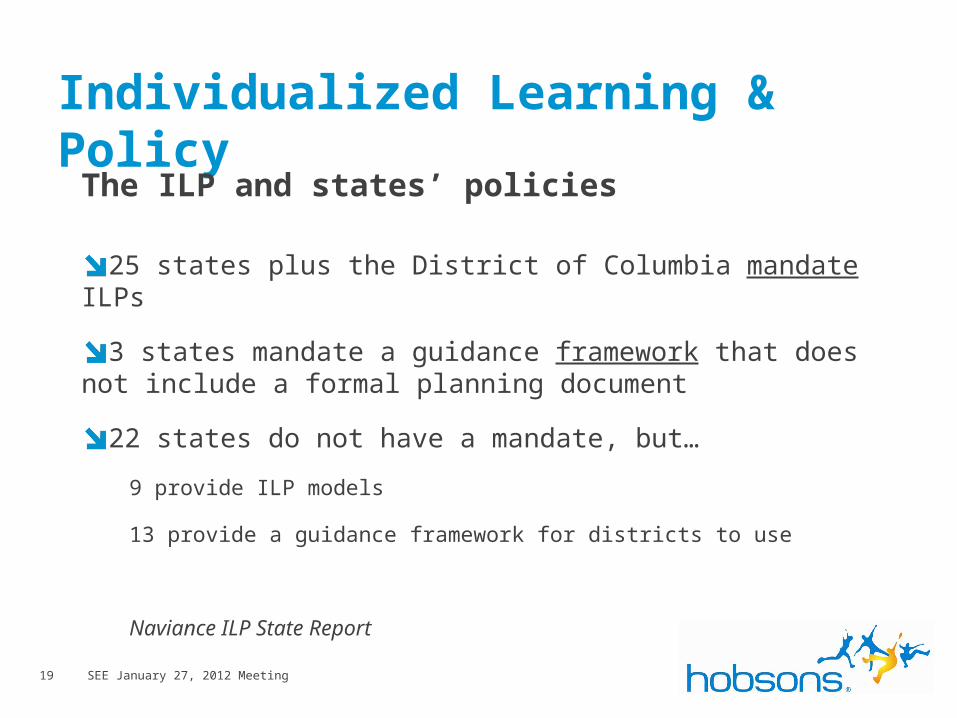
Individualized Learning & Policy
The ILP and states’ policies
25 states plus the District of Columbia mandate ILPs
3 states mandate a guidance framework that does not include a formal planning document
22 states do not have a mandate, but…
9 provide ILP models
13 provide a guidance framework for districts to use
Naviance ILP State Report
20 SEE January 27, 2012 Meeting
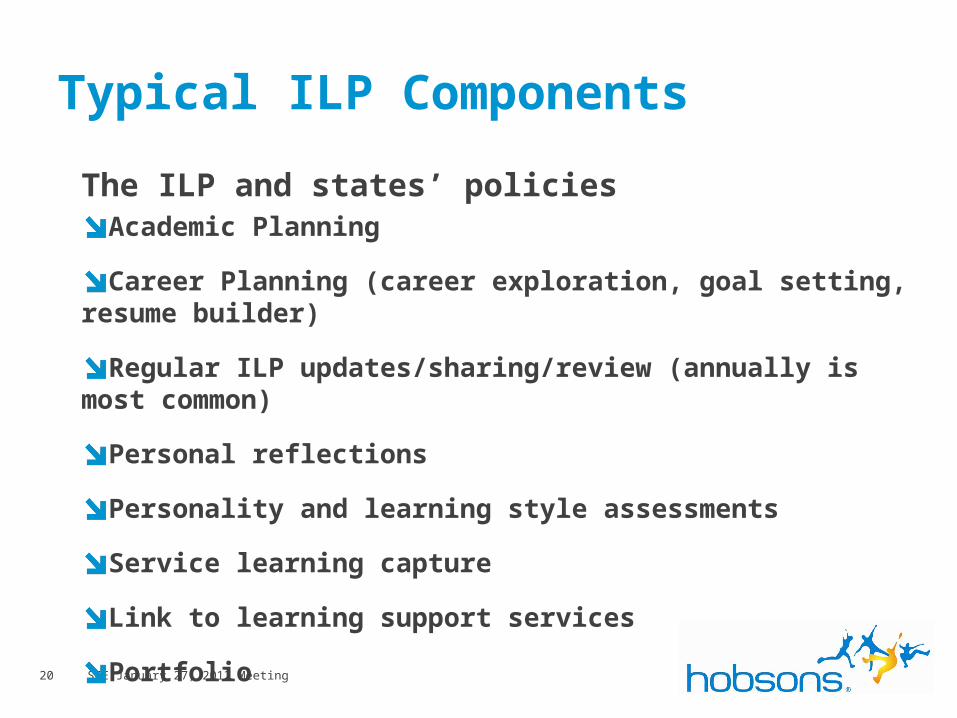
Typical ILP Components
The ILP and states’ policiesAcademic Planning
Career Planning (career exploration, goal setting, resume builder)
Regular ILP updates/sharing/review (annually is most common)
Personal reflections
Personality and learning style assessments
Service learning capture
Link to learning support services
Portfolio

21 SEE January 27, 2012 Meeting
MN and Your DistrictMinnesota and ILPs
Not mandated
Framework offered
Optional
Your District and ILPs?

22 SEE January 27, 2012 Meeting
Pushing the ILP Discussion
What should constitute a college credential – are there more data we could provide to HE? What could HE send back???
How can we move beyond general “college ready” toward ready for “X College”
How can further mitigate the financial gap and increase first generation college students?
What student planning behaviors make a difference in CCR and postsecondary success?
How can we improve the “old school” career planning for all students?

23 SEE January 27, 2012 Meeting
Thank You!Todd BloomChief Academic OfficerHobsons (Minnesota-based)[email protected](952) [email protected]