school report - greater essex county district school board · school report bellewood ps (041947)...
TRANSCRIPT
On behalf of EQAO, I am pleased to provide you with the results of the 2013–2014 Assessments of Reading, Writing and Mathematics for the primary division (Grades 1–3) and junior division (Grades 4–6).
This report includes the 2014 results as well as results for previous years, so you can track progress over time. You’ll also find demographic and attitudinal information, which provides context for interpreting the achievement results.
By assessing all students in our education system at key stages in their schooling, EQAO is able to provide reliable and objective data at the individual student, school and board levels. EQAO results alongside board and classroom assessment data have proven effective for monitoring progress and allowing school communities to make evidence-based decisions in their planning.
At EQAO, we strongly believe that reliable evidence empowers and guides the judgment and actions of professional educators and school communities. We are pleased to continue our partnership with you as we all work toward helping students reach their full potential. I hope you will find this report to be a rich source of information as you turn knowledge into action for the benefit of your students and community.
Sincerely,
Bruce RodriguesChief Executive Officer
Education Quality and Accountability Office
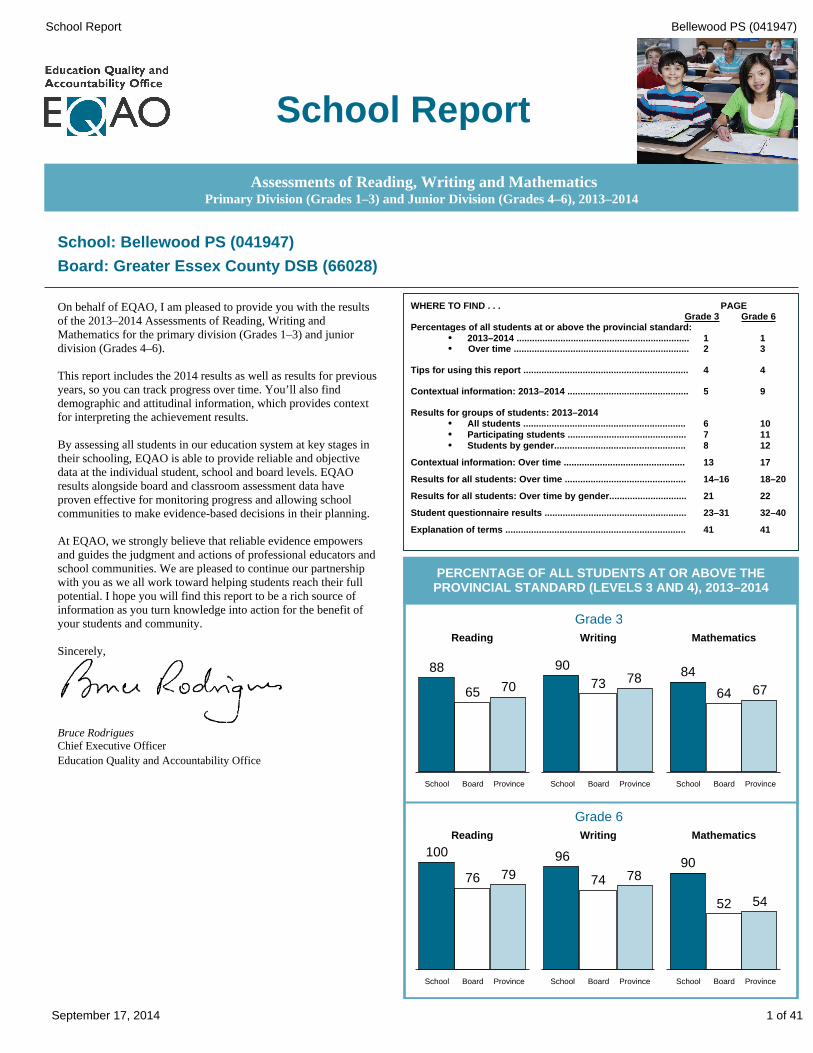
PERCENTAGE OF ALL STUDENTS AT OR ABOVE THEPROVINCIAL STANDARD (LEVELS 3 AND 4), 2013–2014
WHERE TO FIND . . .
PAGEGrade 3 Grade 6
Percentages of all students at or above the provincial standard: · 2013–2014 ...................................................................
1
1· Over time ....................................................................
2
3
Tips for using this report ................................................................
4
4
Contextual information: 2013–2014 ...............................................
5
9
Results for groups of students: 2013–2014· All students ...............................................................
6
10· Participating students ..............................................
7
11· Students by gender...................................................
8
12
Contextual information: Over time ...............................................
13
17
Results for all students: Over time ...............................................
14–16
18–20
Results for all students: Over time by gender.............................. 21
22
Student questionnaire results .......................................................
23–31
32–40
Explanation of terms ......................................................................
41
41
School: Bellewood PS (041947)
Board: Greater Essex County DSB (66028)
Assessments of Reading, Writing and MathematicsPrimary Division (Grades 1–3) and Junior Division (Grades 4–6), 2013–2014
School Report
ProvinceBoardSchoolProvinceBoardSchoolProvinceBoardSchool
88
65 70
90
73 78 84
64 67
Reading Writing Mathematics
Grade 3
ProvinceBoardSchoolProvinceBoardSchoolProvinceBoardSchool
100
76 79
96
74 7890
52 54
Reading Writing Mathematics
Grade 6
Bellewood PS (041947)School Report
1 of 41September 17, 2014

Bellewood PS (041947)School Report
RESULTS FOR ALL STUDENTS AT OR ABOVE THE PROVINCIAL STANDARD (LEVELS 3 AND 4) OVER TIME
Percentage of Students: Grade 3
2009–2010 2010–2011 2011–2012 2012–2013
Reading Writing Mathematics
SCHOOL
BOARD
PROVINCE
2013–2014
127 5052 440
82
2013–2014
127 6452 331
91
2012–2013
126 4552 403
99
2011–2012
124 1172 301
94
2010–2011
127 7892 429
85
2009–2010
ProvinceBoardSchool
Total Number of Grade 3 Students
7587 89 92 88 85 87
92 89 9085 89
8390
84
68 65 64 65 6464 67 70 72 73
58 60 62 64 65
70 73 76 77 78
62 65 66 68 70 71 69 68 67 67
2 of 41September 17, 2014

Bellewood PS (041947)School Report
RESULTS FOR ALL STUDENTS AT OR ABOVE THE PROVINCIAL STANDARD (LEVELS 3 AND 4) OVER TIME
Percentage of Students: Grade 6
2009–2010 2010–2011 2011–2012 2012–2013
Reading Writing Mathematics
SCHOOL
BOARD
PROVINCE
2013–2014
127 2862 384
50
2013–2014
131 5892 476
38
2012–2013
129 4772 494
79
2011–2012
132 3082 473
58
2010–2011
134 2942 550
59
2009–2010
ProvinceBoardSchool
Total Number of Grade 6 Students
92100
91 92100 98 98 96 97 96 97 95 92 92 90
60 58 56 56 52
65 68 70 71 7471 72 73 74 76
70 73 74 76 7872 74 75 77 79
61 58 58 57 54
3 of 41September 17, 2014

Bellewood PS (041947)School Report
ABOUT THIS SCHOOL OR BOARD REPORTTIPS
Each school or board is unique. To appreciate the distinctive character of a school or board, look at the contextual information to understand the features and characteristics of the community it serves.
�
Every assessment captures the performance of students at one point in time each year. Consider the results along with other information about students’ achievement in reading, writing and mathematics.
�
Exercise caution when interpreting results for small schools or boards. Results may vary considerably from year to year, and differences may look exaggerated. For example, in a school of 20 students, a difference of 10% represents only two students.
�
Trends may be difficult to identify or to interpret. This is especially true in small schools or boards, or in schools where there is a high turnover in the student population.
�
EQAO values students’ privacy. Beginning in 2012-2013, results are not reported publicly for schools where fewer than 10 students participated because it might be possible to identify individual students. Prior to 2012-2013, results were not reported publicly for schools where fewer than 15 students participated.
This report shows how well students have met curriculum expectations to the end of the Primary Division and the end of the Junior Division. Students complete a set of test booklets that allow them to show what they have learned in reading, writing and mathematics. The assessments are based on The Ontario Curriculum.
This report includes¨ results for this year
¨ a comparison of results of the current and previous administrations to aid in monitoring improvement
¨ information about the characteristics of the students who participated
¨ summary graphs showing the percentage of students achieving the provincial standard in reading, writing and mathematics
¨ detailed tables and graphs showing results for all levels of achievement, results for gender and participation information
¨ student questionnaire results
¨ an explanation of all terms used in this report.
HOW TO USE THIS REPORT
¨ Examine the contextual information to understand the similarities and differences between the school, the board and the province; the board and the province. Consider the challenges that any differences might present.
¨ Examine the results for reading, writing and mathematics.
· Are these results consistent with what you would expect? · How do the school results compare to the board and the province; the board
results compare to the province?· How do these results compare over time?
· What influence might students’ attitudes have on student performance (refer
to the questionnaire results)?
¨ Speak to school or board staff about the goals for school improvement related to reading, writing and mathematics.
The Education Quality and Accountability Office is an independent agency that gathers information about student achievement through province-wide assessments. Each year, all Grade 3 and Grade 6 students across Ontario take part in these assessments of reading, writing and mathematics. Individual results are reported to students and to parents and guardians. School, board and provincial results are released publicly.
Learn more about us at www.eqao.com.
4 of 41September 17, 2014

Bellewood PS (041947)School Report
Place of Birth
Assessments of Reading, Writing and Mathematics, Primary and Junior Divisions, 2013–2014
Contextual Information: Grade 3*
This information provides a context for interpreting the school’s results.
*
Contextual data pertaining to gender, student status, place of birth, language learned at home and year entered school and board are provided by schools and/or boards through the Student Data Collection process. Some data may be missing because they were not provided by the school or the board.
**
See the Explanation of Terms.
Demographic Information School Board Province
Enrolment
Number of Grade 3 students 82 2 440 127 505
Number of classes with Grade 3 students 5 164 9 631
Number of schools with Grade 3 classes Not applicable 57 3 340
Number Percent Number Percent Number Percent
Gender
Female 47 57% 1 156 47% 61 865 49%
Male 35 43% 1 284 53% 65 640 51%
Gender not specified 0 0% 0 0% 0 0%
Student Status
English language learners**
Students with special education needs (excluding gifted)**
Born outside Canada 10 12% 264 11% 12 693 10%
In Canada less than one year 0 0% 22 1% 703 1%
In Canada one year or more but less than three years 0 0% 50 2% 2 713 2%
In Canada three years or more 10 12% 190 8% 8 350 7%
Language
First language learned at home was other than English 29 35% 524 21% 27 998 22%
Born in Canada 72 88% 2 176 89% 114 546 90%
83% 99 074 78%80% 3 or more years prior to the assessment 66 2 023
4% 132 5% 8 324 7%
11% 129 5% 10 606 8%
Year prior to the assessment 3
2 years prior to the assessment 9
2 years prior to the assessment 69
Year prior to the assessment
14%14%84%
13%15%9%
3 or more years prior to the assessment 0% 59%56%
16 5043647
17 899344
74 9161 3550
Year Student Entered Current School
14%7% Year of the assessment 15% 18 1073756
Data not available 0% <1%<1% 7920
<1% 2 136 2%0% Data not available 0 2
Year Student Entered Current Board
6%6% 7 3655% 154 Year of the assessment 4
0%
17%11%2%
13%3%
21 965
16 40663
269
0
2
5 of 41September 17, 2014

Bellewood PS (041947)School Report
Results in Reading, Writing and Mathematics, 2013–2014Grade 3: All Students††
ProvinceBoardSchool
1211
34
585454
2324
10462120
Percentage of All Grade 3 Students at All Levels: Reading*
NE1 Level 1 Level 2 Level 3 Level 4
%%%#
Province122 018
Board2 438
School82Number of Students
70%
2%
1%
97%
1%
4%
23%
58%
12%
65%
2%
1%
97%
2%
6%
24%
54%
11%
88%
0%
0%
100%
0%
2%
10%
54%
34%
0
82
0
2
8
44
28
0 Exempt
No Data
ParticipatingStudents
NE1**
Level 1
Level 2
Level 3
Level 4
At or AboveProvincial Standard(Levels 3 and 4) †
Grade 3: Reading*
ProvinceBoardSchool
64
17
726973
1823
9121<1<10
Percentage of All Grade 3 Students at All Levels: Writing*
NE1 Level 1 Level 2 Level 3 Level 4
%%%#
Province122 018
Board2 438
School82Number of Students
78%
2%
1%
97%
<1%
1%
18%
72%
6%
73%
2%
1%
97%
<1%
2%
23%
69%
4%
90%
0%
0%
100%
0%
1%
9%
73%
17%
0
82
0
1
7
60
14
0 Exempt
No Data
ParticipatingStudents
NE1**
Level 1
Level 2
Level 3
Level 4
At or AboveProvincial Standard(Levels 3 and 4) †
Grade 3: Writing*
ProvinceBoardSchool
1312
30
545254
2628
15
450<110
Percentage of All Grade 3 Students at All Levels: Mathematics*
NE1 Level 1 Level 2 Level 3 Level 4
%%%#
Province127 504
Board2 440
School82Number of Students
67%
2%
1%
97%
<1%
4%
26%
54%
13%
64%
2%
1%
97%
1%
5%
28%
52%
12%
84%
0%
1%
99%
0%
0%
15%
54%
30%
1
81
0
0
12
44
25
0 Exempt
No Data
ParticipatingStudents
NE1**
Level 1
Level 2
Level 3
Level 4
At or AboveProvincial Standard(Levels 3 and 4) †
Grade 3: Mathematics*
*
Because percentages in tables and graphs are rounded, and because graphs do not show all reporting categories, percentages may not add to 100.**
See the Explanation of Terms.†
These percentages are based on the actual number of students and cannot be calculated simply by adding the rounded percentages of students at Levels 3 and 4.††
Some French Immersion students do not write all components of the assessment in Grade 3; the numbers shown reflect those students who were expected to write each component as determined by the French Immersion participation option selected by boards.
6 of 41September 17, 2014

Bellewood PS (041947)School Report
Results in Reading, Writing and Mathematics, 2013–2014
Grade 3: Participating Students (excludes “no data” and “exempt” categories)
ProvinceBoardSchool
1311
34
595554
2325
10462120
Percentage of Participating Grade 3 Students at All Levels: Reading*
NE1 Level 1 Level 2 Level 3 Level 4
%%%#
4%
23%
59%
13%
6%
25%
55%
2%
10%
54%
2
8
44
Level 1
Level 2
Level 3
72%67%88%
1%2%0%0 NE1**
At or AboveProvincial Standard(Levels 3 and 4) †
Province118 386
Board2 363
School82Number of Students
Grade 3: Reading*
11%34%28 Level 4
ProvinceBoardSchool
64
17
747173
1923
9121<1<10
Percentage of Participating Grade 3 Students at All Levels: Writing*
NE1 Level 1 Level 2 Level 3 Level 4
%%%#
1%
19%
74%
6%
2%
23%
71%
1%
9%
73%
1
7
60
Level 1
Level 2
Level 3
80%75%90%
<1%<1%0%0 NE1**
At or AboveProvincial Standard(Levels 3 and 4) †
Province118 585
Board2 377
School82Number of Students
Grade 3: Writing*
4%17%14 Level 4
ProvinceBoardSchool
1313
31
565354
2728
15
450<110
Percentage of Participating Grade 3 Students at All Levels: Mathematics*
NE1 Level 1 Level 2 Level 3 Level 4
%%%#
4%
27%
56%
13%
5%
28%
53%
0%
15%
54%
0
12
44
Level 1
Level 2
Level 3
69%66%85%
<1%1%0%0 NE1**
At or AboveProvincial Standard(Levels 3 and 4) †
Province124 012
Board2 378
School81Number of Students
Grade 3: Mathematics*
13%31%25 Level 4
* Because percentages in tables and graphs are rounded, percentages may not add to 100.** See the Explanation of Terms.† These percentages are based on the actual number of students and cannot be calculated simply by adding the rounded percentages of students at Levels 3 and 4.
7 of 41September 17, 2014

Bellewood PS (041947)School Report
Results in Reading, Writing and Mathematics, 2013–2014
Grade 3: Gender††
Percentage of All Grade 3 Studentsat or Above Provincial Standard: School†
Reading Writing Mathematics
94
8091 89 85 83
Female Male83%85%89%91%80%94%
60%
17%
0%0%0%0%0%0% Exempt
0%2%0%0%0%0% No Data
100%98%100%100%100%100%Participating
Students
0%0%0%0%0%0% NE1**
0%0%3%0%3%2% Level 1
13%9%9%17%4% Level 2
49%80%68%66%45% Level 3
23%36%9%23%14%49% Level 4
At or AboveProvincial Standard(Levels 3 and 4)†
Male35
Female47
Male35
Female47
Male35
Female47Number of Students
MathematicsWritingReading Grade 3: School*
Percentage of All Grade 3 Studentsat or Above Provincial Standard: Board†
Reading Writing Mathematics
73
58
82
65 66 63
Female Male63%66%65%82%58%73%
50%
29%
2%2%2%2%3%2% Exempt
1%1%1%1%1%1% No Data
97%98%97%98%96%97%Participating
Students
1%<1%<1%<1%3%1% NE1**
4%5%3%<1%7%5% Level 1
25%29%15%29%19% Level 2
54%64%75%51%57% Level 3
12%12%2%6%7%16% Level 4
At or AboveProvincial Standard(Levels 3 and 4)†
Male1 284
Female1 156
Male1 283
Female1 155
Male1 283
Female1 155Number of Students
MathematicsWritingReading Grade 3: Board*
Percentage of All Grade 3 Studentsat or Above Provincial Standard: Province†
Reading Writing Mathematics
7565
84
7267 66
Female Male66%67%72%84%65%75%
53%
26%
3%1%3%2%3%2% Exempt
1%1%1%1%1%1% No Data
97%98%96%98%96%98%Participating
Students
1%<1%<1%<1%1%1% NE1**
4%4%1%1%5%3% Level 1
27%23%13%25%19% Level 2
55%69%75%56%60% Level 3
13%12%4%9%9%15% Level 4
At or AboveProvincial Standard(Levels 3 and 4)†
Male65 640
Female61 864
Male63 255
Female58 763
Male63 255
Female58 763Number of Students
MathematicsWritingReading Grade 3: Province*
*
Because percentages in tables are rounded, percentages may not add to 100.**
See the Explanation of Terms.†
These percentages are based on the actual number of students and cannot be calculated simply by adding the rounded percentages of students at Levels 3 and 4.††
Results include only students for whom gender data were available.
8 of 41September 17, 2014

Bellewood PS (041947)School Report
Place of Birth
Assessments of Reading, Writing and Mathematics, Primary and Junior Divisions, 2013–2014
Contextual Information: Grade 6*
This information provides a context for interpreting the school’s results.
*
Contextual data pertaining to gender, student status, place of birth, language learned at home and year entered school and board are provided by schools and/or boards through the Student Data Collection process. Some data may be missing because they were not provided by the school or the board.
**
See the Explanation of Terms.
Demographic Information School Board Province
Enrolment
Number of Grade 6 students 50 2 384 127 286
Number of classes with Grade 6 students 2 129 8 224
Number of schools with Grade 6 classes Not applicable 57 3 171
Number Percent Number Percent Number Percent
Gender
Female 25 50% 1 141 48% 62 052 49%
Male 25 50% 1 243 52% 65 233 51%
Gender not specified 0 0% 0 0% 1 <1%
Student Status
English language learners**
Students with special education needs (excluding gifted)**
Born outside Canada 7 14% 302 13% 15 828 12%
In Canada less than one year 0 0% 22 1% 619 <1%
In Canada one year or more but less than three years 0 0% 38 2% 2 438 2%
In Canada three years or more 7 14% 241 10% 11 909 9%
Language
First language learned at home was other than English 19 38% 546 23% 28 753 23%
Born in Canada 43 86% 2 082 87% 111 250 87%
86% 104 427 82%96% 3 or more years prior to the assessment 48 2 053
0% 108 5% 7 287 6%
2% 102 4% 5 868 5%
Year prior to the assessment 0
2 years prior to the assessment 1
2 years prior to the assessment 2
Year prior to the assessment
8%12%4%
12%11%6%
3 or more years prior to the assessment 82% 57%64%
14 8842743
10 819283
72 0061 52841
Year Student Entered Current School
23%8% Year of the assessment 12% 29 4992984
Data not available 0% <1%<1% 7810
<1% 3 321 3%0% Data not available 0 1
Year Student Entered Current Board
5%5% 6 3832% 120 Year of the assessment 1
0%
21%16%6%
10%3%
26 445
12 48169
388
0
3
9 of 41September 17, 2014

Bellewood PS (041947)School Report
Results in Reading, Writing and Mathematics, 2013–2014Grade 6: All Students
ProvinceBoardSchool
1212
42
676458
1618
0240<1<10
Percentage of All Grade 6 Students at All Levels: Reading*
NE1 Level 1 Level 2 Level 3 Level 4
%%%#
Province127 261
Board2 382
School50Number of Students
79%
2%
<1%
98%
<1%
2%
16%
67%
12%
76%
2%
<1%
98%
<1%
4%
18%
64%
12%
100%
0%
0%
100%
0%
0%
0%
58%
42%
0
50
0
0
0
29
21
0 Exempt
No Data
ParticipatingStudents
NE1**
Level 1
Level 2
Level 3
Level 4
At or AboveProvincial Standard(Levels 3 and 4) †
Grade 6: Reading*
ProvinceBoardSchool
1210
34
666562
1822
4110<1<10
Percentage of All Grade 6 Students at All Levels: Writing*
NE1 Level 1 Level 2 Level 3 Level 4
%%%#
Province127 207
Board2 382
School50Number of Students
78%
2%
1%
98%
<1%
1%
18%
66%
12%
74%
2%
<1%
98%
<1%
1%
22%
65%
10%
96%
0%
0%
100%
0%
0%
4%
62%
34%
0
50
0
0
2
31
17
0 Exempt
No Data
ParticipatingStudents
NE1**
Level 1
Level 2
Level 3
Level 4
At or AboveProvincial Standard(Levels 3 and 4) †
Grade 6: Writing*
ProvinceBoardSchool
1312
52424038
3031
101315
0<1<10
Percentage of All Grade 6 Students at All Levels: Mathematics*
NE1 Level 1 Level 2 Level 3 Level 4
%%%#
Province127 286
Board2 382
School50Number of Students
54%
2%
1%
98%
<1%
13%
30%
42%
13%
52%
2%
<1%
98%
<1%
15%
31%
40%
12%
90%
0%
0%
100%
0%
0%
10%
38%
52%
0
50
0
0
5
19
26
0 Exempt
No Data
ParticipatingStudents
NE1**
Level 1
Level 2
Level 3
Level 4
At or AboveProvincial Standard(Levels 3 and 4) †
Grade 6: Mathematics*
* Because percentages in tables and graphs are rounded, and because graphs do not show all reporting categories, percentages may not add to 100.** See the Explanation of Terms.† These percentages are based on the actual number of students and cannot be calculated simply by adding the rounded percentages of students at Levels 3 and 4.
10 of 41September 17, 2014

Bellewood PS (041947)School Report
Results in Reading, Writing and Mathematics, 2013–2014
Grade 6: Participating Students (excludes “no data” and “exempt” categories)
ProvinceBoardSchool
1312
42
686558
1719
0240<1<10
Percentage of Participating Grade 6 Students at All Levels: Reading*
NE1 Level 1 Level 2 Level 3 Level 4
%%%#
2%
17%
68%
13%
4%
19%
65%
0%
0%
58%
0
0
29
Level 1
Level 2
Level 3
81%77%100%
<1%<1%0%0 NE1**
At or AboveProvincial Standard(Levels 3 and 4) †
Province124 340
Board2 333
School50Number of Students
Grade 6: Reading*
12%42%21 Level 4
ProvinceBoardSchool
1210
34
686662
1922
4110<1<10
Percentage of Participating Grade 6 Students at All Levels: Writing*
NE1 Level 1 Level 2 Level 3 Level 4
%%%#
1%
19%
68%
12%
1%
22%
66%
0%
4%
62%
0
2
31
Level 1
Level 2
Level 3
80%76%96%
<1%<1%0%0 NE1**
At or AboveProvincial Standard(Levels 3 and 4) †
Province124 338
Board2 339
School50Number of Students
Grade 6: Writing*
10%34%17 Level 4
ProvinceBoardSchool
1312
52434138
3131
101315
0<1<10
Percentage of Participating Grade 6 Students at All Levels: Mathematics*
NE1 Level 1 Level 2 Level 3 Level 4
%%%#
13%
31%
43%
13%
15%
31%
41%
0%
10%
38%
0
5
19
Level 1
Level 2
Level 3
56%53%90%
<1%<1%0%0 NE1**
At or AboveProvincial Standard(Levels 3 and 4) †
Province124 168
Board2 337
School50Number of Students
Grade 6: Mathematics*
12%52%26 Level 4
* Because percentages in tables and graphs are rounded, percentages may not add to 100.** See the Explanation of Terms.† These percentages are based on the actual number of students and cannot be calculated simply by adding the rounded percentages of students at Levels 3 and 4.
11 of 41September 17, 2014

Bellewood PS (041947)School Report
Results in Reading, Writing and Mathematics, 2013–2014
Grade 6: Gender††
Percentage of All Grade 6 Studentsat or Above Provincial Standard: School†
Reading Writing Mathematics
100 100 10092
84
96
Female Male96%84%92%100%100%100%
40%
4%
0%0%0%0%0%0% Exempt
0%0%0%0%0%0% No Data
100%100%100%100%100%100%Participating
Students
0%0%0%0%0%0% NE1**
0%0%0%0%0%0% Level 1
16%8%0%0%0% Level 2
36%68%56%60%56% Level 3
56%48%24%44%40%44% Level 4
At or AboveProvincial Standard(Levels 3 and 4)†
Male25
Female25
Male25
Female25
Male25
Female25Number of Students
MathematicsWritingReading Grade 6: School*
Percentage of All Grade 6 Studentsat or Above Provincial Standard: Board†
Reading Writing Mathematics
82
70
85
6555
50
Female Male50%55%65%85%70%82%
38%
30%
2%1%2%1%2%1% Exempt
<1%<1%<1%<1%<1%<1% No Data
98%99%98%99%97%99%Participating
Students
<1%<1%1%<1%<1%<1% NE1**
17%12%2%<1%5%2% Level 1
32%30%14%22%14% Level 2
43%60%70%62%66% Level 3
12%12%5%15%8%16% Level 4
At or AboveProvincial Standard(Levels 3 and 4)†
Male1 243
Female1 139
Male1 242
Female1 140
Male1 242
Female1 140Number of Students
MathematicsWritingReading Grade 6: Board*
Percentage of All Grade 6 Studentsat or Above Provincial Standard: Province†
Reading Writing Mathematics
8474
87
70
56 52
Female Male52%56%70%87%74%84%
39%
30%
2%1%2%1%2%1% Exempt
1%1%1%<1%<1%<1% No Data
97%98%97%98%97%98%Participating
Students
1%<1%<1%<1%<1%<1% NE1**
14%11%1%<1%3%2% Level 1
30%25%11%20%13% Level 2
44%63%69%66%67% Level 3
13%12%7%18%8%16% Level 4
At or AboveProvincial Standard(Levels 3 and 4)†
Male65 233
Female62 052
Male65 194
Female62 012
Male65 218
Female62 042Number of Students
MathematicsWritingReading Grade 6: Province*
*
Because percentages in tables are rounded, percentages may not add to 100.**
See the Explanation of Terms.†
These percentages are based on the actual number of students and cannot be calculated simply by adding the rounded percentages of students at Levels 3 and 4.††
Results include only students for whom gender data were available.
12 of 41September 17, 2014

Bellewood PS (041947)School Report
3%
In Canada three years or more 25% 21% 17% 16% 12%
Language
Data not available
3 or more years prior to the assessment
2 years prior to the assessment
Year prior to the assessment
Year of the assessment
0%
76%
18%
2%
4%
3%
2013–20142012–20132011–20122010–20112009–2010
This information provides a context for interpreting the school’s results of the current and previous administrations.
Contextual Information over Time: Grade 3*
Assessments of Reading, Writing and Mathematics, Primary and Junior Divisions, 2013–2014
* Contextual data pertaining to gender, student status, place of birth, language learned at home and year entered school are provided by schools and/or boards through the Student Data Collection process. Some data may be missing because they were not provided by the school or the board.
†
Some French Immersion students do not write all components of the assessment in Grade 3; the numbers shown reflect those students who were expected to write each component as determined by the French Immersion participation option selected by boards.
**
See the Explanation of Terms.
Male
In Canada less than one year
Born outside Canada
In Canada one year or more but less than three years
Writing†
Mathematics†
Enrolment
Number of students 85 94 99 91 82
Participation in the Assessment
100% 100% 100% 100% 100%
99% 100% 100% 100% 99%
Gender
Reading† 100% 100% 100% 100% 100%
46% 44% 44% 43% 43%
Female 54% 56% 56% 57% 57%
Student Status
English language learners** 0% 2% 0%
25% 21% 17% 16% 12%
0% 0% 0% 0% 0%
0% 0% 0% 0% 0%
Grade 3
Students with special education needs (excluding gifted)**
5% 3% 2% 2%
Place of Birth
Born in Canada 75% 79% 83% 84% 88%
3% 2% 5% 7%
3% 2% 9%
7% 7% 7% 84%
86% 88% 86% 0%
0% 0% 0% 0%
First language learned at home was other than English 36% 50% 33% 29% 35%
Year Student Entered Current School
0% 0%
13 of 41September 17, 2014

Bellewood PS (041947)School Report
Grade 3: ReadingResults over Time, 2010–2011 to 2013–2014®
· Refer to the EQAO Web site (www.eqao.com) for data from previous years.*
Because percentages in tables and graphs are rounded, and because graphs do not show all reporting categories, percentages may not add to 100.**
See the Explanation of Terms.†
These percentages are based on the actual number of students and cannot be calculated simply by adding the rounded percentages of students at Levels 3 and 4.
Percentage of All Grade 3 Students at All Levels in Reading: School*
NE1 Level 1 Level 2 Level 3 Level 4
1
2010–2011 2011–2012 2012–2013 2013–2014
0 0 04 4 1 2
7 7 7 10
41
53 54 5446
36 3834
88%92%89%87%
0%0%0%0% Exempt
0%0%0%0% No Data
100%100%100%100%Participating X
StudentsX
0%0%0%1% NE1**
2%1%4%4% Level 1
10%7%7%7% Level 2
54%54%53%41% Level 3
34%38%36%46% Level 4
82919994Number of
Students
'13–'14'12–'13'11–'12'10–'11Year
Grade 3 Reading: School*
At or AboveProvincial Standard†
Percentage of All Grade 3 Students at All Levels in Reading: Board*
NE1 Level 1 Level 2 Level 3 Level 4
3
2010–2011 2011–2012 2012–2013 2013–2014
2 2 29 9 8 6
26 24 24 24
52 52 52 54
8 9 11 11
65%64%62%60%
2%2%3%3% Exempt
1%<1%<1%<1% No Data
97%97%96%97%Participating X
StudentsX
2%2%2%3% NE1**
6%8%9%9% Level 1
24%24%24%26% Level 2
54%52%52%52% Level 3
11%11%9%8% Level 4
2 4382 3292 4032 301Number of
Students
'13–'14'12–'13'11–'12'10–'11Year
Grade 3 Reading: Board*
At or AboveProvincial Standard†
Percentage of All Grade 3 Students at All Levels in Reading: Province*
NE1 Level 1 Level 2 Level 3 Level 4
1
2010–2011 2011–2012 2012–2013 2013–2014
1 1 16 6 5 4
24 23 23 23
57 56 55 58
8 10 12 12
70%68%66%65%
2%3%3%3% Exempt
1%1%<1%1% No Data
97%97%97%97%Participating X
StudentsX
1%1%1%1% NE1**
4%5%6%6% Level 1
23%23%23%24% Level 2
58%55%56%57% Level 3
12%12%10%8% Level 4
122 018122 450121 727119 914Number of
Students
'13–'14'12–'13'11–'12'10–'11Year
Grade 3 Reading: Province*
At or AboveProvincial Standard†
14 of 41September 17, 2014

Bellewood PS (041947)School Report
Grade 3: WritingResults over Time, 2010–2011 to 2013–2014®
· Refer to the EQAO Web site (www.eqao.com) for data from previous years.*
Because percentages in tables and graphs are rounded, and because graphs do not show all reporting categories, percentages may not add to 100.**
See the Explanation of Terms.†
These percentages are based on the actual number of students and cannot be calculated simply by adding the rounded percentages of students at Levels 3 and 4.
Percentage of All Grade 3 Students at All Levels in Writing: School*
NE1 Level 1 Level 2 Level 3 Level 4
0
2010–2011 2011–2012 2012–2013 2013–2014
0 0 0 1 0 0 1
128 11 9
70 72 70 73
17 20 19 17
90%89%92%87%
0%0%0%0% Exempt
0%0%0%0% No Data
100%100%100%100%Participating X
StudentsX
0%0%0%0% NE1**
1%0%0%1% Level 1
9%11%8%12% Level 2
73%70%72%70% Level 3
17%19%20%17% Level 4
82919994Number of
Students
'13–'14'12–'13'11–'12'10–'11Year
Grade 3 Writing: School*
At or AboveProvincial Standard†
Percentage of All Grade 3 Students at All Levels in Writing: Board*
NE1 Level 1 Level 2 Level 3 Level 4
<1
2010–2011 2011–2012 2012–2013 2013–2014
<1 <1 <1 <1 <1 1 2
30 27 24 23
64 65 67 69
3 5 5 4
73%72%70%67%
2%2%2%2% Exempt
1%<1%<1%<1% No Data
97%98%97%98%Participating X
StudentsX
<1%<1%<1%<1% NE1**
2%1%<1%<1% Level 1
23%24%27%30% Level 2
69%67%65%64% Level 3
4%5%5%3% Level 4
2 4382 3292 4032 301Number of
Students
'13–'14'12–'13'11–'12'10–'11Year
Grade 3 Writing: Board*
At or AboveProvincial Standard†
Percentage of All Grade 3 Students at All Levels in Writing: Province*
NE1 Level 1 Level 2 Level 3 Level 4
<1
2010–2011 2011–2012 2012–2013 2013–2014
<1 <1 <1 <1 <1 1 1
24 21 19 18
68 69 70 72
5 6 7 6
78%77%76%73%
2%2%2%2% Exempt
1%1%1%1% No Data
97%97%97%97%Participating X
StudentsX
<1%<1%<1%<1% NE1**
1%1%<1%<1% Level 1
18%19%21%24% Level 2
72%70%69%68% Level 3
6%7%6%5% Level 4
122 018122 447121 727119 873Number of
Students
'13–'14'12–'13'11–'12'10–'11Year
Grade 3 Writing: Province*
At or AboveProvincial Standard†
15 of 41September 17, 2014

Bellewood PS (041947)School Report
Grade 3: MathematicsResults over Time, 2010–2011 to 2013–2014®
· Refer to the EQAO Web site (www.eqao.com) for data from previous years.*
Because percentages in tables and graphs are rounded, and because graphs do not show all reporting categories, percentages may not add to 100.**
See the Explanation of Terms.†
These percentages are based on the actual number of students and cannot be calculated simply by adding the rounded percentages of students at Levels 3 and 4.
Percentage of All Grade 3 Students at All Levels in Mathematics: School*
NE1 Level 1 Level 2 Level 3 Level 4
0
2010–2011 2011–2012 2012–2013 2013–2014
0 0 0 0 1 0 0
1116
1015
59 56
68
54
3127
2230
84%90%83%89%
0%0%0%0% Exempt
1%0%0%0% No Data
99%100%100%100%Participating X
StudentsX
0%0%0%0% NE1**
0%0%1%0% Level 1
15%10%16%11% Level 2
54%68%56%59% Level 3
30%22%27%31% Level 4
82919994Number of
Students
'13–'14'12–'13'11–'12'10–'11Year
Grade 3 Mathematics: School*
At or AboveProvincial Standard†
Percentage of All Grade 3 Students at All Levels in Mathematics: Board*
NE1 Level 1 Level 2 Level 3 Level 4
<1
2010–2011 2011–2012 2012–2013 2013–2014
1 <1 1 4 4 5 5
29 28 27 28
54 54 54 52
10 10 12 12
64%65%64%65%
2%2%2%2% Exempt
1%<1%<1%<1% No Data
97%98%97%98%Participating X
StudentsX
1%<1%1%<1% NE1**
5%5%4%4% Level 1
28%27%28%29% Level 2
52%54%54%54% Level 3
12%12%10%10% Level 4
2 4402 3312 4032 301Number of
Students
'13–'14'12–'13'11–'12'10–'11Year
Grade 3 Mathematics: Board*
At or AboveProvincial Standard†
Percentage of All Grade 3 Students at All Levels in Mathematics: Province*
NE1 Level 1 Level 2 Level 3 Level 4
<1
2010–2011 2011–2012 2012–2013 2013–2014
1 <1 <1 3 3 3 4
25 25 27 26
57 56 55 54
12 12 12 13
67%67%68%69%
2%2%2%2% Exempt
1%1%1%1% No Data
97%97%97%97%Participating X
StudentsX
<1%<1%1%<1% NE1**
4%3%3%3% Level 1
26%27%25%25% Level 2
54%55%56%57% Level 3
13%12%12%12% Level 4
127 504127 633126 439124 104Number of
Students
'13–'14'12–'13'11–'12'10–'11Year
Grade 3 Mathematics: Province*
At or AboveProvincial Standard†
16 of 41September 17, 2014

Bellewood PS (041947)School Report
5%
In Canada three years or more 27% 17% 19% 13% 14%
Language
Data not available
3 or more years prior to the assessment
2 years prior to the assessment
Year prior to the assessment
Year of the assessment
0%
88%
3%
5%
3%
2%
2013–20142012–20132011–20122010–20112009–2010
This information provides a context for interpreting the school’s results of the current and previous administrations.
Contextual Information over Time: Grade 6*
Assessments of Reading, Writing and Mathematics, Primary and Junior Divisions, 2013–2014
* Contextual data pertaining to gender, student status, place of birth, language learned at home and year entered school are provided by schools and/or boards through the Student Data Collection process. Some data may be missing because they were not provided by the school or the board.
**
See the Explanation of Terms.
Male
In Canada less than one year
Born outside Canada
In Canada one year or more but less than three years
Writing
Mathematics
Enrolment
Number of students 59 58 79 38 50
Participation in the Assessment
100% 100% 100% 100% 100%
100% 100% 100% 100% 100%
Gender
Reading 100% 100% 96% 100% 100%
46% 41% 38% 47% 50%
Female 54% 59% 62% 53% 50%
Student Status
English language learners** 0% 2% 11%
27% 17% 19% 13% 14%
0% 0% 0% 0% 0%
0% 0% 0% 0% 0%
Grade 6
Students with special education needs (excluding gifted)**
3% 5% 5% 6%
Place of Birth
Born in Canada 73% 83% 81% 87% 86%
7% 1% 0% 8%
4% 0% 6%
2% 4% 8% 4%
90% 91% 92% 82%
0% 0% 0% 0%
First language learned at home was other than English 29% 26% 44% 37% 38%
Year Student Entered Current School
0% 0%
17 of 41September 17, 2014

Bellewood PS (041947)School Report
Grade 6: ReadingResults over Time, 2010–2011 to 2013–2014®
· Refer to the EQAO Web site (www.eqao.com) for data from previous years.*
Because percentages in tables and graphs are rounded, and because graphs do not show all reporting categories, percentages may not add to 100.**
See the Explanation of Terms.†
These percentages are based on the actual number of students and cannot be calculated simply by adding the rounded percentages of students at Levels 3 and 4.
Percentage of All Grade 6 Students at All Levels in Reading: School*
NE1 Level 1 Level 2 Level 3 Level 4
0
2010–2011 2011–2012 2012–2013 2013–2014
0 0 0 0 0 0 0 05 8
0
74
4842
58
26
4350
42
100%92%91%100%
0%0%4%0% Exempt
0%0%0%0% No Data
100%100%96%100%Participating X
StudentsX
0%0%0%0% NE1**
0%0%0%0% Level 1
0%8%5%0% Level 2
58%42%48%74% Level 3
42%50%43%26% Level 4
50387958Number of
Students
'13–'14'12–'13'11–'12'10–'11Year
Grade 6 Reading: School*
At or AboveProvincial Standard†
Percentage of All Grade 6 Students at All Levels in Reading: Board*
NE1 Level 1 Level 2 Level 3 Level 4
<1
2010–2011 2011–2012 2012–2013 2013–2014
<1 <1 <1 4 4 3 4
21 20 21 18
62 59 61 64
1014 12 12
76%74%73%72%
2%2%2%2% Exempt
<1%<1%<1%<1% No Data
98%98%97%98%Participating X
StudentsX
<1%<1%<1%<1% NE1**
4%3%4%4% Level 1
18%21%20%21% Level 2
64%61%59%62% Level 3
12%12%14%10% Level 4
2 3822 4722 4942 473Number of
Students
'13–'14'12–'13'11–'12'10–'11Year
Grade 6 Reading: Board*
At or AboveProvincial Standard†
Percentage of All Grade 6 Students at All Levels in Reading: Province*
NE1 Level 1 Level 2 Level 3 Level 4
<1
2010–2011 2011–2012 2012–2013 2013–2014
<1 <1 <1 4 3 2 2
19 19 18 16
63 62 64 67
11 13 13 12
79%77%75%74%
2%2%2%2% Exempt
<1%<1%1%1% No Data
98%98%97%97%Participating X
StudentsX
<1%<1%<1%<1% NE1**
2%2%3%4% Level 1
16%18%19%19% Level 2
67%64%62%63% Level 3
12%13%13%11% Level 4
127 261131 514129 420132 283Number of
Students
'13–'14'12–'13'11–'12'10–'11Year
Grade 6 Reading: Province*
At or AboveProvincial Standard†
18 of 41September 17, 2014

Bellewood PS (041947)School Report
Grade 6: WritingResults over Time, 2010–2011 to 2013–2014®
· Refer to the EQAO Web site (www.eqao.com) for data from previous years.*
Because percentages in tables and graphs are rounded, and because graphs do not show all reporting categories, percentages may not add to 100.**
See the Explanation of Terms.†
These percentages are based on the actual number of students and cannot be calculated simply by adding the rounded percentages of students at Levels 3 and 4.
Percentage of All Grade 6 Students at All Levels in Writing: School*
NE1 Level 1 Level 2 Level 3 Level 4
0
2010–2011 2011–2012 2012–2013 2013–2014
0 0 0 0 0 0 0 2 4 3 4
69
5155
62
29
4642
34
96%97%96%98%
0%0%0%0% Exempt
0%0%0%0% No Data
100%100%100%100%Participating X
StudentsX
0%0%0%0% NE1**
0%0%0%0% Level 1
4%3%4%2% Level 2
62%55%51%69% Level 3
34%42%46%29% Level 4
50387958Number of
Students
'13–'14'12–'13'11–'12'10–'11Year
Grade 6 Writing: School*
At or AboveProvincial Standard†
Percentage of All Grade 6 Students at All Levels in Writing: Board*
NE1 Level 1 Level 2 Level 3 Level 4
<1
2010–2011 2011–2012 2012–2013 2013–2014
<1 <1 <1 <1 <1 2 1
30 27 25 22
59 58 6065
9 12 11 10
74%71%70%68%
2%2%2%2% Exempt
<1%<1%<1%<1% No Data
98%98%97%98%Participating X
StudentsX
<1%<1%<1%<1% NE1**
1%2%<1%<1% Level 1
22%25%27%30% Level 2
65%60%58%59% Level 3
10%11%12%9% Level 4
2 3822 4722 4942 473Number of
Students
'13–'14'12–'13'11–'12'10–'11Year
Grade 6 Writing: Board*
At or AboveProvincial Standard†
Percentage of All Grade 6 Students at All Levels in Writing: Province*
NE1 Level 1 Level 2 Level 3 Level 4
<1
2010–2011 2011–2012 2012–2013 2013–2014
<1 <1 <1 <1 <1 1 1
24 23 20 18
63 63 64 66
10 12 13 12
78%76%74%73%
2%2%2%2% Exempt
1%<1%1%1% No Data
98%98%97%97%Participating X
StudentsX
<1%<1%<1%<1% NE1**
1%1%<1%<1% Level 1
18%20%23%24% Level 2
66%64%63%63% Level 3
12%13%12%10% Level 4
127 207131 504129 420132 266Number of
Students
'13–'14'12–'13'11–'12'10–'11Year
Grade 6 Writing: Province*
At or AboveProvincial Standard†
19 of 41September 17, 2014

Bellewood PS (041947)School Report
Grade 6: MathematicsResults over Time, 2010–2011 to 2013–2014®
· Refer to the EQAO Web site (www.eqao.com) for data from previous years.*
Because percentages in tables and graphs are rounded, and because graphs do not show all reporting categories, percentages may not add to 100.**
See the Explanation of Terms.†
These percentages are based on the actual number of students and cannot be calculated simply by adding the rounded percentages of students at Levels 3 and 4.
Percentage of All Grade 6 Students at All Levels in Mathematics: School*
NE1 Level 1 Level 2 Level 3 Level 4
0
2010–2011 2011–2012 2012–2013 2013–2014
0 0 0 0 0 3 05 8 5
10
47
35 3238
4857
6152
90%92%92%95%
0%0%0%0% Exempt
0%0%0%0% No Data
100%100%100%100%Participating X
StudentsX
0%0%0%0% NE1**
0%3%0%0% Level 1
10%5%8%5% Level 2
38%32%35%47% Level 3
52%61%57%48% Level 4
50387958Number of
Students
'13–'14'12–'13'11–'12'10–'11Year
Grade 6 Mathematics: School*
At or AboveProvincial Standard†
Percentage of All Grade 6 Students at All Levels in Mathematics: Board*
NE1 Level 1 Level 2 Level 3 Level 4
<1
2010–2011 2011–2012 2012–2013 2013–2014
<1 <1 <1
12 10 12 15
27 30 29 31
45 42 42 40
13 14 14 12
52%56%56%58%
2%2%2%2% Exempt
<1%<1%1%<1% No Data
98%97%97%98%Participating X
StudentsX
<1%<1%<1%<1% NE1**
15%12%10%12% Level 1
31%29%30%27% Level 2
40%42%42%45% Level 3
12%14%14%13% Level 4
2 3822 4762 4942 473Number of
Students
'13–'14'12–'13'11–'12'10–'11Year
Grade 6 Mathematics: Board*
At or AboveProvincial Standard†
Percentage of All Grade 6 Students at All Levels in Mathematics: Province*
NE1 Level 1 Level 2 Level 3 Level 4
<1
2010–2011 2011–2012 2012–2013 2013–2014
<1 <1 <19 10 11 13
29 29 30 30
46 45 43 42
12 13 13 13
54%57%58%58%
2%2%2%2% Exempt
1%1%1%1% No Data
98%97%97%97%Participating X
StudentsX
<1%<1%<1%<1% NE1**
13%11%10%9% Level 1
30%30%29%29% Level 2
42%43%45%46% Level 3
13%13%13%12% Level 4
127 286131 543129 368132 223Number of
Students
'13–'14'12–'13'11–'12'10–'11Year
Grade 6 Mathematics: Province*
At or AboveProvincial Standard†
20 of 41September 17, 2014

Bellewood PS (041947)School Report
READING
WRITING
MATHEMATICS
Female Male
2009–2010
Female Male
46 39 4153
MaleFemale
2010–2011
55 44
Female Male
2011–2012
52 39
Female Male
2012–2013
47 35
Female Male
2013–2014
School
* Includes only students for whom gender data were available.
2009–2010 2010–2011 2011–2012 2012–2013 2013–2014
RESULTS FOR ALL STUDENTS OVER TIME BY GENDER*
Total Number of Grade 3 Students*
Percentage of Students At or Above the Provincial Standard (Levels 3 and 4): Grade 3
74 7785
90 87 91 9095 94
80
85 85 89 8591 93
88 90 91 89
76
9585
95
76
91 8795
85 83
21 of 41September 17, 2014

Bellewood PS (041947)School Report
READING
WRITING
MATHEMATICS
Female Male
2009–2010
Female Male
32 27 2434
MaleFemale
2010–2011
49 30
Female Male
2011–2012
20 18
Female Male
2012–2013
25 25
Female Male
2013–2014
School
* Includes only students for whom gender data were available.
2009–2010 2010–2011 2011–2012 2012–2013 2013–2014
RESULTS FOR ALL STUDENTS OVER TIME BY GENDER*
Total Number of Grade 6 Students*
Percentage of Students At or Above the Provincial Standard (Levels 3 and 4): Grade 6
9489
100 100 100
77
90 94100 100
100 96 100 96 9893 95
100 10092
97 96 94 96 98
8390 94
84
96
22 of 41September 17, 2014

Bellewood PS (041947)School Report
COGNITIVE STRATEGIES USED IN LANGUAGE
STUDENT ENGAGEMENT About writing:
Assessments of Reading, Writing and Mathematics, Primary and Junior Divisions, 2013–2014
STUDENT QUESTIONNAIRE RESULTS FOR SCHOOL: GRADE 3 (# = 80)
I like to read. 37
I am a good reader.51
I am able to understand difficult reading passages. 24
I do my best when I do reading activities in class. 64
I like to write. 53
I am a good writer. 39
I am able to communicate my ideas in writing. 36
I do my best when I do writing activities in class. 62
I make sure I understand what I am reading. 51
I slow down my reading if it is difficult. 41
When I come to a word I do not understand, I look for clues (e.g.,punctuation, word parts, other words in the sentence).
31
*
Percentages may not add to 100, due to rounding or to ambiguous responses or blanks. Where there is no number in a bar, the percentage of responses is smaller than four.
Percentage of Students*Number of students
who answered“most of the time”
STUDENT ENGAGEMENT About reading:
Never Sometimes Most of the time
Before I start to read, I try to predict what the text will be about. 15
I organize my ideas before I start to write. 39
I edit my writing to make it better. 34
I check my writing for spelling and grammar. 31
When I am finished reading, I think about what I have read. 28
51 46
4 32 64
4 66 30
18 80
4 30 66
6 45 49
4 51 45
20 78
20 60 19
35 64
45 51
8 51 39
10 55 35
48 49
6 50 42
8 51 39
23 of 41September 17, 2014

Bellewood PS (041947)School Report
Assessments of Reading, Writing and Mathematics, Primary and Junior Divisions, 2013–2014
2
A computer for writing activities 3
Reading and writing tools (e.g., a dictionary, thesaurus, wordwall, editing checklist)
37
I like mathematics. 47
I do my best when I do mathematics activities in class.66
I read over the mathematics problem first to make sure Iknow what I am supposed to do.
57
I think about the steps I will use to solve the problem. 36
I ask for help if I don’t understand the problem. 44
*
Percentages may not add to 100, due to rounding or to ambiguous responses or blanks. Where there is no number in a bar, the percentage of responses is smaller than four.
Percentage of Students*Number of students who
answered“most of the time”
37I check my work for mistakes.
Most of the timeSometimesNever
STUDENT QUESTIONNAIRE RESULTS FOR SCHOOL: GRADE 3 (# = 80)
I am good at mathematics.
I am able to answer difficult mathematics questions.
44
28
A computer for reading activities
STUDENT ENGAGEMENT About mathematics:
COGNITIVE STRATEGIES USED IN MATHEMATICS When I am working on a mathematics problem,
I check my answer to see if it makes sense.44
INSTRUCTIONAL TOOLS USED IN READING AND WRITING How often do you use the following when you read and write at school?
71 25
21 74 4
6 44 46
14 26 59
8 38 55
12 51 35
16 82
25 71
4 50 45
4 41 55
50 46
41 55
24 of 41September 17, 2014

Bellewood PS (041947)School Report
Assessments of Reading, Writing and Mathematics, Primary and Junior Divisions, 2013–2014
STUDENT QUESTIONNAIRE RESULTS FOR SCHOOL: GRADE 3 (# = 80)
Manipulatives (e.g., base ten blocks, tiles) 32
A calculator 3
A computer to learn mathematics 4
*
Percentages may not add to 100, due to rounding or to ambiguous responses or blanks. Where there is no number in a bar, the percentage of responses is smaller than four.
Percentage of Students*Number of students
who answered“most of the time”
INSTRUCTIONAL TOOLS USED IN MATHEMATICS How often do you use the following during mathematics activities at school?
Never Sometimes Most of the time
8 51 40
30 65 4
82 10 5
25 of 41September 17, 2014

Bellewood PS (041947)School Report
PARENTAL ENGAGEMENT How often do you and a parent, a guardian or another adult who lives with you do the following?
Number of studentswho answered
“every day or almostevery day”
Assessments of Reading, Writing and Mathematics, Primary and Junior Divisions, 2013–2014
STUDENT QUESTIONNAIRE RESULTS FOR SCHOOL: GRADE 3 (# = 80)
I participate in art, music or drama activities. 18
I participate in after-school clubs. 5
We talk about the activities I do in school. 35
We talk about the reading and writing work I do in school. 24
We talk about the mathematics work I do in school. 32
*
Percentages may not add to 100, due to rounding or to ambiguous responses or blanks. Where there is no number in a bar, the percentage of responses is smaller than four.
We read together. 17
We look at my school agenda. 54
Percentage of Students*
Every day or almost everyday
1 to 3 times a week1 or 2 times a monthNever
We use a computer together. 7
I participate in sports or other physical activities. 30
OUT-OF-SCHOOL ACTIVITIES How often do you do the following when you are not at school?
35 19 24 22
51 19 21 6
14 9 38 38
9 25 20 44
9 28 32 30
5 21 31 40
29 26 20 21
11 16 68
48 32 8 9
26 of 41September 17, 2014

Bellewood PS (041947)School Report
SCHOOLS ATTENDED How many schools did you attend before this one?
Percentage of Students* Number of students
LANGUAGES SPOKEN
Assessments of Reading, Writing and Mathematics, Primary and Junior Divisions, 2013–2014
STUDENT QUESTIONNAIRE RESULTS FOR SCHOOL: GRADE 3 (# = 80)
Only this school 18
1 other school 42
2 other schools 11
*
Percentages may not add to 100, due to rounding or to ambiguous responses or blanks. Where there is no number in a bar, the percentage of responses is smaller than four.
3 other schools 4
4 other schools or more 5
Mostly another language (or otherlanguages)/
Only another language (or other languages)
Another language (or other languages)as often as English
Only English/Mostly English
35Languages in which people speak to student at home
Languages student speaks at home 43
Percentage of Students*
Number of studentswho answered
“only English” or“mostly English”
22
52
14
5
6
54 31 15
44 12 42
27 of 41September 17, 2014

Bellewood PS (041947)School Report
39% 34%44%39%50%Reading and writing tools (e.g., a dictionary, thesaurus,
word wall, editing checklist)
A computer for reading activities
A computer for writing activities 4%
I do my best when I do writing activities in class.
0%
0%
I do my best when I do reading activities in class.
7% 20%18%19%15%15%15%
When I am finished reading, I think about what I haveread.
When I come to a word I do not understand, I look forclues (e.g., punctuation, word parts, other words in the
sentence.
I slow down my reading if it is difficult.
I make sure I understand what I am reading.
Before I start to read, I try to predict what the text will beabout.
I am able to communicate my ideas in writing.
I am a good writer.
I like to write.
I am able to understand difficult reading passages.
I am a good reader.
I like to read.
Ma
le*
(# =
35
)
School
Fe
ma
le*
(# =
45
)
All S
tud
en
ts(#
= 8
0)
Ma
le*
(# =
1 2
33
)
Board
Fe
ma
le*
(# =
1 1
18
)
All S
tud
en
ts(#
= 2
35
1)
Ma
le*
(# =
62
94
4)
Province
Fe
ma
le*
(# =
60
21
9)
All S
tud
en
ts(#
= 1
23
16
3)
GRADE 3: STUDENT QUESTIONNAIRE RESULTS FOR SCHOOL, BOARD AND PROVINCE (all students, female, male)
66%76%71%69%77%73%74%80%78%
41%44%42%39%45%42%40%49%45%
43%56%49%42%56%49%34%60%49%
43%59%51%43%61%52%54%76%66%
STUDENT ENGAGEMENT About writing:
69%77%73%70%79%74%77%82%80%
30%27%29%31%28%29%37%24%30%
62%66%64%60%67%63%49%76%64%
41%54%47%36%51%43%29%60%46%
STUDENT ENGAGEMENT About reading:
I check my writing for spelling and grammar.
I edit my writing to make it better.
I organize my ideas before I start to write.
2%
41%49%45%39%50%44%31%44%39%
40%48%44%37%49%43%46%40%42%
37%43%40%35%43%39%37%58%49%
Percentage of students who answered “most of the time”†
Percentage of students who answered “most of the time”†
* Only includes students for whom gender data were available.† Other response options were “never” and “sometimes.”
INSTRUCTIONAL TOOLS USED IN READING AND WRITING
Assessments of Reading, Writing and Mathematics, Primary and Junior Divisions, 2013–2014
14% 14% 15% 14% 13% 16%4%
Percentage of students who answered “most of the time”†
51%46% 44%42%
36%40%38%35%36%35%23%44%35%
33%39%36%34%44%38%34%42%39%
47%55%51%45%54%50%63%42%51%
62%68%65%61%71%66%60%67%64%
20%20%20%18%20%19%11%24%19%
COGNITIVE STRATEGIES USED IN LANGUAGE Percentage of students who answered “most of the time”†
28 of 41September 17, 2014

Bellewood PS (041947)School Report
INSTRUCTIONAL TOOLS USED IN MATHEMATICS
55% 60%59%
Assessments of Reading, Writing and Mathematics, Primary and Junior Divisions, 2013–2014
A computer to learn mathematics
A calculator
Manipulatives (e.g., base ten blocks, tiles)
I check my answers to see if it makes sense.
I check my work for mistakes.
I ask for help if I don’t understand the problem.
I think about the steps I will use to solve the problem.
I read over the mathematics problem first to make sure Iknow what I am supposed to do.
I do my best when I do mathematics activities in class.
I am able to answer difficult mathematics questions.
I am good at mathematics.
I like mathematics.
Ma
le*
(# =
35
)
School
Fe
ma
le*
(# =
45
)
All S
tud
en
ts(#
= 8
0)
Ma
le*
(# =
1 2
33
)
Board
Fe
ma
le*
(# =
1 1
18
)
All S
tud
en
ts(#
= 2
35
1)
Ma
le*
(# =
62
94
4)
Province
Fe
ma
le*
(# =
60
21
9)
All S
tud
en
ts(#
= 1
23
16
3)
GRADE 3: STUDENT QUESTIONNAIRE RESULTS FOR SCHOOL, BOARD AND PROVINCE (all students, female, male)
57%63%58%60%57%53%
49%54%51%49%56%52%46%47%46%
48%58%53%50%58%54%51%58%55%
43%45%44%42%47%44%54%38%45%
64%73%68%66%73%69%66%76%71%
COGNITIVE STRATEGIES USED IN MATHEMATICS When I am working on a mathematics problem,
77%79%78%79%81%80%77%87%82%
44%30%37%39%31%35%37%33%35%
61%48%55%57%49%53%60%51%55%
62%53%57%54%47%51%71%49%59%
STUDENT ENGAGEMENT About mathematics:
Percentage of students who answered “most of the time”†
Percentage of students who answered “most of the time”†
* Only includes students for whom gender data were available.† Other response options were “never” and “sometimes.”
20%20%20%18%17%17%6%4%5%
15%15%15%17%16%16%3%4%4%
27%34%31%28%32%30%43%38%40%
Percentage of students who answered “most of the time”†
29 of 41September 17, 2014

Bellewood PS (041947)School Report
I participate in sports or other physical activities.
6% 2% 11% 12% 13%11% 13% 13% 12%
19%28%23%20%27%24%17%27%22%
15%15%15%17%16%17%9%9%9%
Assessments of Reading, Writing and Mathematics, Primary and Junior Divisions, 2013–2014
We use a computer together.
We look at my school agenda.
We read together.
We talk about the mathematics work I do in school.
We talk about the reading and writing work I do inschool.
We talk about the activities I do in school.
I participate in after-school clubs.
I participate in art, music or drama activities.
Ma
le*
(# =
35
)
School
Fe
ma
le*
(# =
45
)
All S
tud
en
ts(#
= 8
0)
Ma
le*
(# =
1 2
33
)
Board
Fe
ma
le*
(# =
1 1
18
)
All S
tud
en
ts(#
= 2
35
1)
Ma
le*
(# =
62
94
4)
Province
Fe
ma
le*
(# =
60
21
9)
All S
tud
en
ts(#
= 1
23
16
3)
GRADE 3: STUDENT QUESTIONNAIRE RESULTS FOR SCHOOL, BOARD AND PROVINCE (all students, female, male)
55%57%56%59%64%61%74%62%68%
28%33%31%28%32%30%14%27%21%
34%39%36%34%37%35%40%40%40%
27%32%29%26%31%28%26%33%30%
44%53%48%44%54%49%46%42%44%
* Only includes students for whom gender data were available.† Other response options were “never,” “1 or 2 times a month” and “1 to 3 times a week.”
Percentage of students who answered “every day or almost every day”†
38% 31% 46% 44% 43%37% 50% 37% 48%
PARENTAL ENGAGEMENT How often do you and a parent, a guardian or another adult who lives with you do the following?
OUT-OF-SCHOOL ACTIVITIES How often do you do the following when you are not at school?
Percentage of students who answered “every day or almost every day”†
30 of 41September 17, 2014

Bellewood PS (041947)School Report
16%17%17%15%17%16%40%44%42%
Assessments of Reading, Writing and Mathematics, Primary and Junior Divisions, 2013–2014
Mostly another language (or other languages)/ Only another language (or other languages)
Another language (or other languages) as oftenas English
Only English/Mostly English
Mostly another language (or other languages)/ Only another language (or other languages)
Another language (or other languages) as oftenas English
Only English/Mostly English
2 other schools/3 other schools
Only this school/1 other school
Ma
le*
(# =
35
)
School
Fe
ma
le*
(# =
45
)
All S
tud
en
ts(#
= 8
0)
Ma
le*
(# =
1 2
33
)
Board
Fe
ma
le*
(# =
1 1
18
)
All S
tud
en
ts(#
= 2
35
1)
Ma
le*
(# =
62
94
4)
Province
Fe
ma
le*
(# =
60
21
9)
All S
tud
en
ts(#
= 1
23
16
3)
GRADE 3: STUDENT QUESTIONNAIRE RESULTS FOR SCHOOL, BOARD AND PROVINCE (all students, female, male)
14%15%14%11%11%11%9%16%12%
67%65%66%71%69%70%51%38%44%
10%11%10%11%11%11%11%18%15%
16%18%17%14%16%15%31%31%31%
72%70%71%74%71%73%57%51%54%
Percentage of students†
* Only includes students for whom gender data were available.† Percentages may not add to 100, due to rounding or to ambiguous responses or blanks.
Percentage of students†
4% 4% 4%4 other schools or more
LANGUAGES SPOKEN TO STUDENTS AT HOME
SCHOOLS ATTENDED How many schools did you attend before this one?
LANGUAGES STUDENTS SPEAK AT HOME
16% 16%15%
77%78%78%
6%
16%
76%
5%
15%
78%
6%
16%
77%
6%
14%
80%
7%
22%
71%
6%
19%
75%
Percentage of students†
31 of 41September 17, 2014

Bellewood PS (041947)School Report
COGNITIVE STRATEGIES USED IN LANGUAGE
STUDENT ENGAGEMENT About writing:
Assessments of Reading, Writing and Mathematics, Primary and Junior Divisions, 2013–2014
STUDENT QUESTIONNAIRE RESULTS FOR SCHOOL: GRADE 6 (# = 50)
I like to read. 29
I am a good reader.35
I am able to understand difficult reading passages. 20
I do my best when I do reading activities in class. 35
I like to write. 18
I am a good writer. 15
I am able to communicate my ideas in writing. 22
I do my best when I do writing activities in class. 36
I make sure I understand what I am reading. 38
I slow down my reading if it is difficult. 29
When I come to a word I do not understand, I look for clues (e.g.,punctuation, word parts, other words in the sentence).
25
*
Percentages may not add to 100, due to rounding or to ambiguous responses or blanks. Where there is no number in a bar, the percentage of responses is smaller than four.
Percentage of Students*Number of students
who answered“most of the time”
STUDENT ENGAGEMENT About reading:
Never Sometimes Most of the time
Before I start to read, I try to predict what the text will be about. 6
I organize my ideas before I start to write. 15
I edit my writing to make it better. 22
I check my writing for spelling and grammar. 28
When I am finished reading, I think about what I have read. 26
8 34 58
4 26 70
58 40
26 70
4 60 36
68 30
4 50 44
22 72
32 56 12
22 76
4 38 58
14 36 50
10 38 52
14 54 30
6 48 44
4 38 56
32 of 41September 17, 2014

Bellewood PS (041947)School Report
Assessments of Reading, Writing and Mathematics, Primary and Junior Divisions, 2013–2014
6
A computer for writing activities 28
Reading and writing tools (e.g., a dictionary, thesaurus, wordwall, editing checklist)
22
The Internet to find information 35
I am able to answer difficult mathematics questions.26
I do my best when I do mathematics activities in class.39
I read over the mathematics problem first to make sure Iknow what I am supposed to do.
44
I think about the steps I will use to solve the problem. 37
*
Percentages may not add to 100, due to rounding or to ambiguous responses or blanks. Where there is no number in a bar, the percentage of responses is smaller than four.
Percentage of Students*Number of students who
answered“most of the time”
24I ask for help if I don’t understand the problem.
Most of the timeSometimesNever
STUDENT QUESTIONNAIRE RESULTS FOR SCHOOL: GRADE 6 (# = 50)
I like mathematics.
I am good at mathematics.
32
32
A computer for reading activities
STUDENT ENGAGEMENT About mathematics:
COGNITIVE STRATEGIES USED IN MATHEMATICS When I am working on a mathematics problem,
I check my work for mistakes.32
I check my answer to see if it makes sense. 40
INSTRUCTIONAL TOOLS USED IN READING AND WRITING How often do you use the following when you read and write at school?
42 42 12
4 36 56
50 44
26 70
6 28 64
6 28 64
44 52
20 78
12 88
4 22 74
8 44 48
34 64
20 80
33 of 41September 17, 2014

Bellewood PS (041947)School Report
Assessments of Reading, Writing and Mathematics, Primary and Junior Divisions, 2013–2014
STUDENT QUESTIONNAIRE RESULTS FOR SCHOOL: GRADE 6 (# = 50)
Manipulatives (e.g., base ten blocks, tiles) 5
A calculator 23
A computer to learn mathematics 5
The Internet 9
*
Percentages may not add to 100, due to rounding or to ambiguous responses or blanks. Where there is no number in a bar, the percentage of responses is smaller than four.
Percentage of Students*Number of students
who answered“most of the time”
INSTRUCTIONAL TOOLS USED IN MATHEMATICS How often do you use the following during mathematics activities at school?
Never Sometimes Most of the time
44 42 10
4 46 46
44 42 10
38 40 18
34 of 41September 17, 2014

Bellewood PS (041947)School Report
PARENTAL ENGAGEMENT How often do you and a parent, a guardian or another adult who lives with you do the following?
Number of studentswho answered
“every day or almostevery day”
Assessments of Reading, Writing and Mathematics, Primary and Junior Divisions, 2013–2014
STUDENT QUESTIONNAIRE RESULTS FOR SCHOOL: GRADE 6 (# = 50)
I participate in art, music or drama activities. 10
I participate in after-school clubs. 7
We talk about the activities I do in school. 23
We talk about the reading and writing work I do in school. 12
We talk about the mathematics work I do in school. 22
*
Percentages may not add to 100, due to rounding or to ambiguous responses or blanks. Where there is no number in a bar, the percentage of responses is smaller than four.
We read together. 4
We look at my school agenda. 6
Percentage of Students*
Every day or almost everyday
1 to 3 times a week1 or 2 times a monthNever
We use a computer together. 8
I participate in sports or other physical activities. 18
OUT-OF-SCHOOL ACTIVITIES How often do you do the following when you are not at school?
34 8 32 20
22 28 30 14
8 12 38 36
4 8 36 46
4 32 34 24
10 14 26 44
64 16 6 8
42 18 22 12
36 16 26 16
35 of 41September 17, 2014

Bellewood PS (041947)School Report
SCHOOLS ATTENDED How many schools did you attend before this one?
Percentage of Students* Number of students
LANGUAGES SPOKEN
Assessments of Reading, Writing and Mathematics, Primary and Junior Divisions, 2013–2014
STUDENT QUESTIONNAIRE RESULTS FOR SCHOOL: GRADE 6 (# = 50)
Only this school 30
1 other school 10
2 other schools 3
*
Percentages may not add to 100, due to rounding or to ambiguous responses or blanks. Where there is no number in a bar, the percentage of responses is smaller than four.
3 other schools 2
4 other schools or more 3
Mostly another language (or otherlanguages)/
Only another language (or other languages)
Another language (or other languages)as often as English
Only English/Mostly English
21Languages in which people speak to student at home
Languages student speaks at home 27
Percentage of Students*
Number of studentswho answered
“only English” or“mostly English”
60
20
6
4
6
54 24 18
42 14 40
36 of 41September 17, 2014

Bellewood PS (041947)School Report
50%51%51%46%47%
34% 28%38%33%44%
The internet to find information
Reading and writing tools (e.g., a dictionary, thesaurus,word wall, editing checklist)
A computer for reading activities
A computer for writing activities 56%
I do my best when I do writing activities in class.
56%
16%
I do my best when I do reading activities in class.
56% 29%25%27%25%23%24%
When I am finished reading, I think about what I haveread.
When I come to a word I do not understand, I look forclues (e.g., punctuation, word parts, other words in the
sentence.
I slow down my reading if it is difficult.
I make sure I understand what I am reading.
Before I start to read, I try to predict what the text will beabout.
I am able to communicate my ideas in writing.
I am a good writer.
I like to write.
I am able to understand difficult reading passages.
I am a good reader.
I like to read.
Ma
le*
(# =
25
)
School
Fe
ma
le*
(# =
25
)
All S
tud
en
ts(#
= 5
0)
Ma
le*
(# =
1 2
06
)
Board
Fe
ma
le*
(# =
1 1
17
)
All S
tud
en
ts(#
= 2
32
3)
Ma
le*
(# =
62
68
3)
Province
Fe
ma
le*
(# =
60
50
6)
All S
tud
en
ts(#
= 1
23
19
0)
GRADE 6: STUDENT QUESTIONNAIRE RESULTS FOR SCHOOL, BOARD AND PROVINCE (all students, female, male)
63%74%68%61%73%67%64%80%72%
44%53%48%40%50%45%40%48%44%
36%49%42%34%48%41%28%32%30%
30%53%42%27%51%39%20%52%36%
STUDENT ENGAGEMENT About writing:
65%74%69%65%75%70%68%72%70%
42%40%41%38%40%39%52%28%40%
64%70%67%61%68%65%72%68%70%
39%56%47%36%56%45%56%60%58%
STUDENT ENGAGEMENT About reading:
I check my writing for spelling and grammar.
I edit my writing to make it better.
I organize my ideas before I start to write.
12%
46%56%51%42%55%49%48%64%56%
43%56%50%40%55%47%40%48%44%
30%39%34%28%37%32%20%40%30%
Percentage of students who answered “most of the time”†
Percentage of students who answered “most of the time”†
* Only includes students for whom gender data were available.† Other response options were “never” and “sometimes.”
INSTRUCTIONAL TOOLS USED IN READING AND WRITING
Assessments of Reading, Writing and Mathematics, Primary and Junior Divisions, 2013–2014
7% 6% 8% 9% 7% 10%8%
Percentage of students who answered “most of the time”†
70% 76%
48%
64% 46%
44% 39%40%
37%44%40%35%43%39%44%60%52%
37%45%41%35%47%41%44%56%50%
51%63%57%47%61%53%40%76%58%
67%75%71%62%77%69%72%80%76%
16%16%16%15%16%15%4%20%12%
COGNITIVE STRATEGIES USED IN LANGUAGE Percentage of students who answered “most of the time”†
37 of 41September 17, 2014

Bellewood PS (041947)School Report
INSTRUCTIONAL TOOLS USED IN MATHEMATICS
80% 65%65%
The Internet
Assessments of Reading, Writing and Mathematics, Primary and Junior Divisions, 2013–2014
A computer to learn mathematics
A calculator
Manipulatives (e.g., base ten blocks, tiles)
I check my answers to see if it makes sense.
I check my work for mistakes.
I ask for help if I don’t understand the problem.
I think about the steps I will use to solve the problem.
I read over the mathematics problem first to make sure Iknow what I am supposed to do.
I do my best when I do mathematics activities in class.
I am able to answer difficult mathematics questions.
I am good at mathematics.
I like mathematics.
Ma
le*
(# =
25
)
School
Fe
ma
le*
(# =
25
)
All S
tud
en
ts(#
= 5
0)
Ma
le*
(# =
1 2
06
)
Board
Fe
ma
le*
(# =
1 1
17
)
All S
tud
en
ts(#
= 2
32
3)
Ma
le*
(# =
62
68
3)
Province
Fe
ma
le*
(# =
60
50
6)
All S
tud
en
ts(#
= 1
23
19
0)
GRADE 6: STUDENT QUESTIONNAIRE RESULTS FOR SCHOOL, BOARD AND PROVINCE (all students, female, male)
63%67%61%70%64%96%
46%48%47%46%47%46%68%60%64%
56%64%60%54%63%59%48%48%48%
48%50%49%45%49%47%68%80%74%
76%84%80%75%86%80%84%92%88%
COGNITIVE STRATEGIES USED IN MATHEMATICS When I am working on a mathematics problem,
75%75%75%75%74%74%80%76%78%
46%30%38%42%30%36%72%32%52%
59%45%52%56%45%51%80%48%64%
55%41%48%51%39%45%76%52%64%
STUDENT ENGAGEMENT About mathematics:
Percentage of students who answered “most of the time”†
Percentage of students who answered “most of the time”†
* Only includes students for whom gender data were available.† Other response options were “never” and “sometimes.”
15%13%14%14%12%13%24%12%18%
10%9%9%9%8%8%16%4%10%
44%53%48%46%59%52%28%64%46%
15%20%17%13%17%15%12%8%10%
Percentage of students who answered “most of the time”†
38 of 41September 17, 2014

Bellewood PS (041947)School Report
I participate in sports or other physical activities.
14% 16% 12% 10% 10%11% 9% 11% 9%
12%21%16%15%23%19%24%16%20%
9%8%9%10%9%9%12%20%16%
Assessments of Reading, Writing and Mathematics, Primary and Junior Divisions, 2013–2014
We use a computer together.
We look at my school agenda.
We read together.
We talk about the mathematics work I do in school.
We talk about the reading and writing work I do inschool.
We talk about the activities I do in school.
I participate in after-school clubs.
I participate in art, music or drama activities.
Ma
le*
(# =
25
)
School
Fe
ma
le*
(# =
25
)
All S
tud
en
ts(#
= 5
0)
Ma
le*
(# =
1 2
06
)
Board
Fe
ma
le*
(# =
1 1
17
)
All S
tud
en
ts(#
= 2
32
3)
Ma
le*
(# =
62
68
3)
Province
Fe
ma
le*
(# =
60
50
6)
All S
tud
en
ts(#
= 1
23
19
0)
GRADE 6: STUDENT QUESTIONNAIRE RESULTS FOR SCHOOL, BOARD AND PROVINCE (all students, female, male)
33%31%32%35%37%36%12%12%12%
8%7%7%7%8%8%4%12%8%
30%34%32%31%36%34%32%56%44%
19%22%21%18%22%20%28%20%24%
39%46%43%39%46%43%52%40%46%
* Only includes students for whom gender data were available.† Other response options were “never,” “1 or 2 times a month” and “1 to 3 times a week.”
Percentage of students who answered “every day or almost every day”†
36% 28% 44% 45% 43%37% 51% 37% 48%
PARENTAL ENGAGEMENT How often do you and a parent, a guardian or another adult who lives with you do the following?
OUT-OF-SCHOOL ACTIVITIES How often do you do the following when you are not at school?
Percentage of students who answered “every day or almost every day”†
39 of 41September 17, 2014

Bellewood PS (041947)School Report
14%14%14%15%15%15%44%36%40%
Assessments of Reading, Writing and Mathematics, Primary and Junior Divisions, 2013–2014
Mostly another language (or other languages)/ Only another language (or other languages)
Another language (or other languages) as oftenas English
Only English/Mostly English
Mostly another language (or other languages)/ Only another language (or other languages)
Another language (or other languages) as oftenas English
Only English/Mostly English
2 other schools/3 other schools
Only this school/1 other school
Ma
le*
(# =
25
)
School
Fe
ma
le*
(# =
25
)
All S
tud
en
ts(#
= 5
0)
Ma
le*
(# =
1 2
06
)
Board
Fe
ma
le*
(# =
1 1
17
)
All S
tud
en
ts(#
= 2
32
3)
Ma
le*
(# =
62
68
3)
Province
Fe
ma
le*
(# =
60
50
6)
All S
tud
en
ts(#
= 1
23
19
0)
GRADE 6: STUDENT QUESTIONNAIRE RESULTS FOR SCHOOL, BOARD AND PROVINCE (all students, female, male)
13%15%14%11%12%11%16%12%14%
70%69%69%71%71%71%36%48%42%
8%7%8%9%8%9%16%20%18%
15%17%16%13%16%14%28%20%24%
75%74%74%75%75%75%52%56%54%
Percentage of students†
* Only includes students for whom gender data were available.† Percentages may not add to 100, due to rounding or to ambiguous responses or blanks.
Percentage of students†
6% 6% 6%4 other schools or more
LANGUAGES SPOKEN TO STUDENTS AT HOME
SCHOOLS ATTENDED How many schools did you attend before this one?
LANGUAGES STUDENTS SPEAK AT HOME
22% 22%22%
69%70%69%
8%
18%
71%
6%
21%
71%
7%
19%
71%
12%
12%
72%
0%
8%
88%
6%
10%
80%
Percentage of students†
40 of 41September 17, 2014

Bellewood PS (041947)School Report
EXPLANATION OF TERMS
All Students Results are reported for all students in the grade.
Results are reported only for those students who took part in the assessment (excludes "no data" and "exempt" categories).
ParticipatingStudents
The Ministry of Education has set Level 3 as the provincial standard.ProvincialStandard
The student has demonstrated the required knowledge and skills.Achievement surpasses the provincial standard.
Level 4
The student has demonstrated some of the required knowledge and skills.Achievement approaches the provincial standard.
Level 2
The student has demonstrated some of the required knowledge and skills in limited ways.Achievement falls much below the provincial standard.
Level 1
Students who did not have a result due to absence or other reasons.No Data
NE1 "Not enough evidence for Level 1" is used when students did not demonstrate enough evidence of knowledge and understanding to be assigned Level 1.
Students who were formally exempted from participation in one or more components of the assessment.
Exempt
Students who have been identified by the school in accordance with English Language Learners: ESL and ELD Programs and Services: Policies and Procedures for Ontario Elementary and Secondary Schools, Kindergarten to Grade 12 (2007).
English LanguageLearners
The student has demonstrated most of the required knowledge and skills.Achievement is at the provincial standard.
Level 3
Students withSpecial EducationNeeds (excluding
gifted)
Students who have been formally identified by an Identification, Placement and Review Committee, as well as students who have an Individual Education Plan. Students whose sole exceptionality is giftedness are not included.
N/R “Not reported” indicates that the number of students participating (fewer than 10 in a group) or responding to the Student Questionnaire is so small (fewer than six in a group) that identification of individual student results might be possible; therefore, results are not reported.
N/D �No data available� is used to indicate that there were no students in the grade or subject for the group or year specified.
W Results are being withheld by EQAO. For further information, please contact the school principal.
Assessments of Reading, Writing and Mathematics, Primary and Junior Divisions, 2013–2014
41 of 41September 17, 2014