school improvement plan - auburn school district · improved quality and quantity of dok in the...
TRANSCRIPT
2016-2019
School Improvement Plan
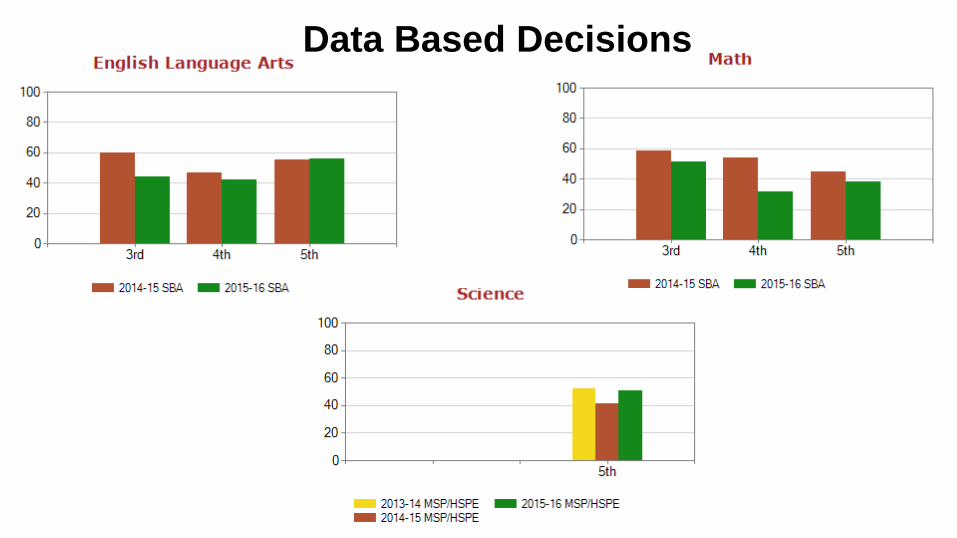
Data Based Decisions

SMART Goals
Attendance Behavior Calendar Total “Intended Hours”
(Absences + (Tardies * .33)Total Enrollment
= Avg # hrs lost/student/year
Total ODR’s / Enrollment *.5
= Avg # hrs lost/student/year
Last full day of school+ PLC’s (1 hr ea)
+ (# of field trips * 4.25)+(# of assemblies * 2 hrs)
= Avg # hrs lost/student/year
(177 Days * 4.25 learning hrs/day) - 5 hrs
(Conferences/Thanksgiving-8.5 hrs (1 day and Last day)
= 738.75 hrs of real intended learning time
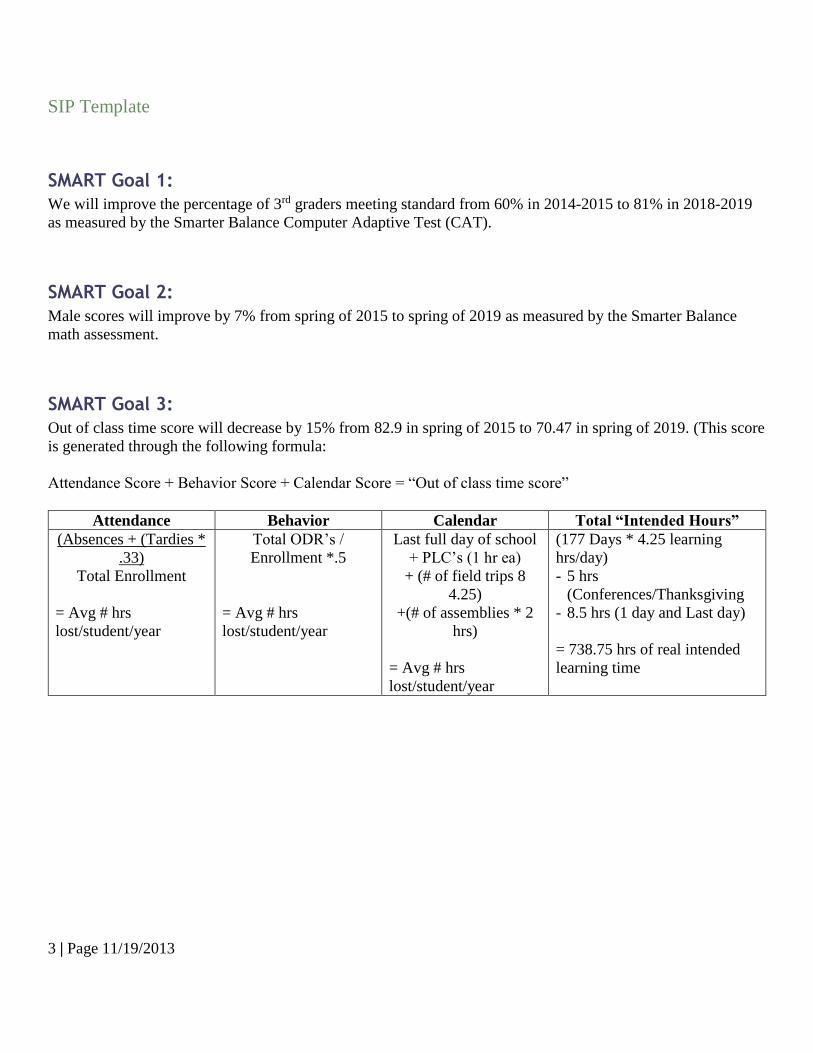
SMART Goal 1:
We will improve the percentage of 3rd graders meeting standard from 60% in 2014-2015 to 81% in 2018-2019 as measured by the Smarter Balance Computer Adaptive Test (CAT). SMART Goal 2:Male scores will improve by 7% from spring of 2015 to spring of 2019 as measured by the Smarter Balance math assessment. SMART Goal 3: Out of class time score will decrease by 15% from 82.9 hours in spring of 2015 to 70.47 hours in spring of 2019. (This score is generated through the following formula: Attendance Score + Behavior Score + Calendar Score = “Out of class time score”)
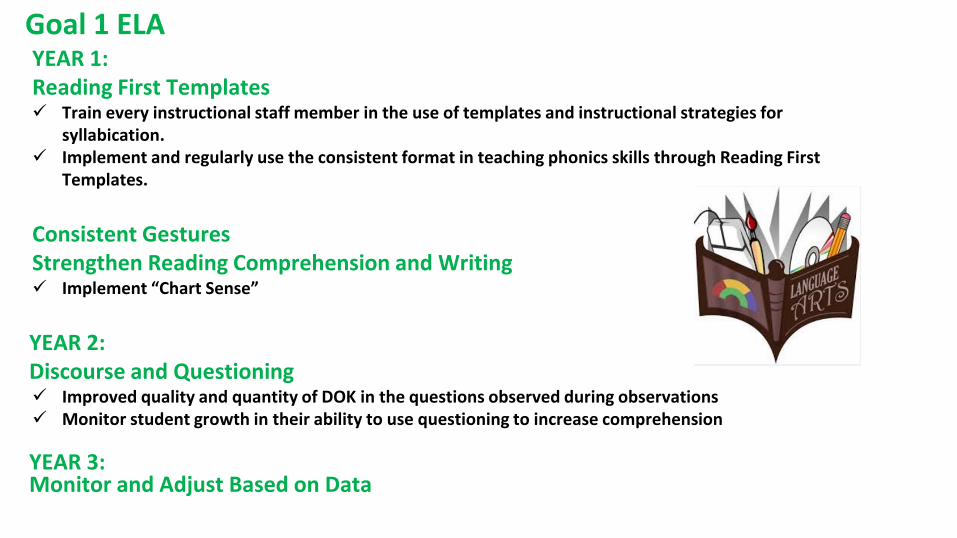
Goal 1 ELAYEAR 1:Reading First Templates Train every instructional staff member in the use of templates and instructional strategies for
syllabication. Implement and regularly use the consistent format in teaching phonics skills through Reading First
Templates.
Consistent GesturesStrengthen Reading Comprehension and Writing Implement “Chart Sense”
YEAR 2:Discourse and Questioning Improved quality and quantity of DOK in the questions observed during observations Monitor student growth in their ability to use questioning to increase comprehension
YEAR 3:Monitor and Adjust Based on Data
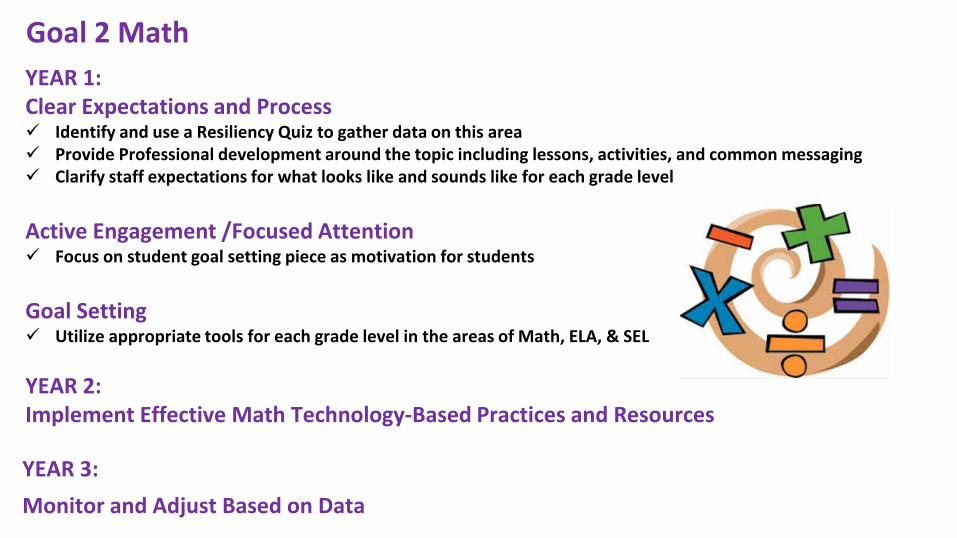
Goal 2 Math
YEAR 1:Clear Expectations and Process Identify and use a Resiliency Quiz to gather data on this area Provide Professional development around the topic including lessons, activities, and common messaging Clarify staff expectations for what looks like and sounds like for each grade level
Active Engagement /Focused Attention Focus on student goal setting piece as motivation for students
Goal Setting Utilize appropriate tools for each grade level in the areas of Math, ELA, & SEL
YEAR 2:Implement Effective Math Technology-Based Practices and Resources
YEAR 3:
Monitor and Adjust Based on Data

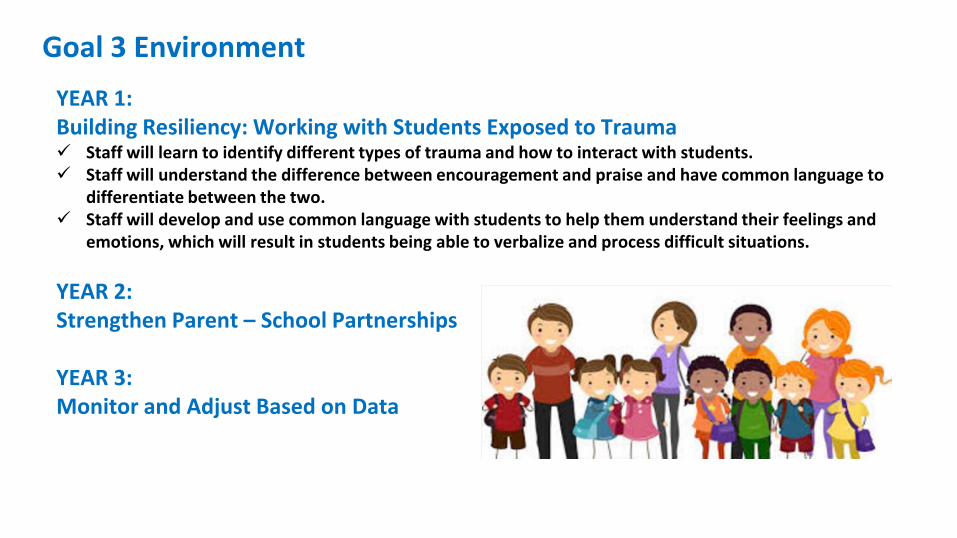
Goal 3 Environment
YEAR 1:Building Resiliency: Working with Students Exposed to Trauma Staff will learn to identify different types of trauma and how to interact with students. Staff will understand the difference between encouragement and praise and have common language to
differentiate between the two. Staff will develop and use common language with students to help them understand their feelings and
emotions, which will result in students being able to verbalize and process difficult situations.
YEAR 2:Strengthen Parent – School Partnerships
YEAR 3:Monitor and Adjust Based on Data


Next Steps
Revise and clarify Mission and Vision
Implementation with fidelity
Staff Led InitiativesGrowth Mindset - Carol DweckGrit - Angela Duckworth Talent Code - Daniel Coyle

SIP Template
1 | Page 11/19/2013
Planning Year 2015-2016
Implementation September 2016-June 2019
Dick Scobee Elementary
School Improvement Plan
Schoolwide Title I
School Improvement Plan Adopted by the Auburn School Board of Directors on insert school board approval date here.

SIP Template
2 | Page 11/19/2013
September 2016-June 2019
Auburn School District Strategic Plan
Aspiration: The Auburn School District aspires to be a world-class education system preparing all students to be globally
competitive for career, for college, and for life in the twenty-first century.
District Goal 1: Student Achievement All staff in the Auburn School District provide support, leadership, and guidance to ensure each student meets
or exceeds state and district standards, graduates on time, and is prepared for career and college.
District Goal 2: Community Engagements All staff in the Auburn School District are accountable for engaging its diverse community as partners to support
and sustain a world-class education system.
District Goal 3: Policies and Resource Management Auburn School District policies and resources are aligned to the strategic plan.
School:
DICK SCOBEE ELEMENTARY
Date of SIP Team District Goal Review:
SIP Team Members:
Adam Couch
Principal
Jennifer Riestra
Instructional
Specialist
ELA Chair
Amanda Brooks
2nd Grade Teacher
Math Chair
Beth Raines
Student Support
Specialist
Environment Chair
Sandra Robinson K Melissa Rude K Stephanie Jensen K
Janine Glenn K Dara Lindberg K Julie Scholzen 1
Veronica Dwyer 1 Sarah Lysene 1 Courtney Tiemann 1
Ashley Eronemo 2 Angela Lavine 3 McKinzie Long 3

SIP Template
3 | Page 11/19/2013
Aimee Wisener 3 Brianna Jensen 4 Amanda Baehr 5
Glenn Jenkins 4 Leann Ringler 5 Mark Ziegler 4
Lindsay Spears 4/5 Tim Pfab Tech
Specialist
Lacey Orr RR
Katie Pomeroy RR Paula Greuling Music David Moynihan
Counselor
Heather Clerget
Reading Specialist
Lynda Meheula ECE Kim Goad PE
Stephanie Long
TOSA
Naila Aliyeva ELL Amy Oliphant 2/3
Laurel McCormick
ECE
Keri Weygint 2 Linda Harmaning
Library
Judy Jones 1
Zach Garner ELL
Ayrion Hawkins
(Parent)
Rheanna Durnbaugh
(Parent)
Kristin Wells (Parent)


SIP Template
6 | Page 11/19/2013
Executive Summary – SWT 1
Comprehensive Needs Assessment
Auburn School District Mission
In a safe environment, all students will achieve high standards of learning in order to become ethically
responsible decision makers and lifelong learners.
Auburn School District Vision
The vision of Auburn School District is to develop in students the skills and attitudes that will maximize their
potential for lifelong learning and ethically responsible decision making.
School Mission
Motto: Only as far as we dream can we go!
At Dick Scobee Elementary School, we empower students to learn – no excuses!
We are committed to our belief statements:
● Students and staff will pursue learning and will meet high standards.
● All students must take an active part in their education.
● Students learn best when students, parents, and staff work together.
● High expectations and hard work lead to success.
● Each and every individual will be held in high regard and treated with respect by students, staff and
community.
● A safe and healthy environment promotes learning.
School Vision
At Dick Scobee Elementary we empower students to learn – no excuses!

SIP Template
7 | Page 11/19/2013
Background Information
WAC 180-16-220
Requirements for School Improvement Plan Each school shall be approved annually by the school board of directors under an approval process determined by the district board
of directors and “At a minimum the annual approval shall require each school to have a school improvement plan that is data driven,
promotes a positive impact on student learning, and includes a continuous improvement process that shall mean the ongoing process
used by a school to monitor, adjust, and update its school improvement plan.” School Improvement plans must include a brief
summary of use of data to establish improvement; acknowledging the use of data which may include DIBELS, MAP, WELPA,
Credit Attainment, Enrollment in Honors/AP Courses, CEE Perceptual Data, SAT/ACT, Discipline, and MSP or HSPE.
Stakeholder Input
Dick Scobee staff members were organized into three sub committees (Reading, Math, and Environment).
These SIP teams met on a monthly basis in sub groups to work on each step of the SIP process. First, historical
schoolwide data was reviewed by each sub group during a staff data carousel/review meeting. Committees
then researched, developed action steps or SMART Goals and an Action Plan was developed. The plan was shared with stakeholders for agreement and approval.
Highly Qualified Staff – SWT 3
Insert Principal Attestation
High Quality, Highly Qualified Teachers – SWT 5
Demographic
Students served by Dick Scobee Elementary school represent some of the greatest challenges in the Auburn School District. Eighty percent of all students qualify for free and reduced lunch; family mobility rate is thirty-eight percent; and over twenty-five percent of our students qualify for ELL (English Language Learners) services. As of October 1st, 2014, Dick Scobee Students were 11.4% Asian/Pacific Islander, 10.1% black, 25.3% Hispanic, 40.4% White, and 12.5% Two or More Races. A large portion of our parents are residents of a King County Housing Authority apartment complex. Many of these families speak little to no English at home creating a greater challenge than our student percentages would indicate. Trends for demographics for the last 5 years are described in the table below:
2011-2012 2012-2013 2013-2014 2014-2015 2015-1016
Free/Reduced Lunch 61.6% 68.3% 73.8% 77.6% 82.3%
ELL 20.4% 24.7% 27.5% 29.4% 25.7%
White 53.5% 49.2% 49% 46.2 40.4%

SIP Template
8 | Page 11/19/2013
Discipline
During the 2013-2014 school year there were 308 office referrals recorded in Skyward. In 2014-2015, there were 1,218 recorded. As of April 25th, 2016 our current office disciple referrals were 523. The SIP team noticed there are many discrepancies within the discipline data. In 2014-2015, our Student Support Specialist was added to our personnel that helped deal with discipline issues, which resulted in a more consistent and effective referral process. This would account for the spike in referrals from 2013-2014 to 2014-2015.
Attendance
During the 2013-2014 school year the absence rate was 6.33%, compared to the tardy rate of 4.01%. This relates to the absence rate of 7.80% and 4.40% tardies throughout the 2014-2015 school year. Our current absence rate is 7.80%, with a tardy rate of 3.8% (as of 2nd trimester for 2015-2016). As our demographics have changed (by looking at our free and reduced lunch rate), our SIP team noticed that our attendance and tardy percentages rise. Even though our building has taken steps to increase attendance rates, this still continues to be a struggle for our building.
DIBELS
At Dick Scobee, we participated in a data carousel around ELA data. We used DIBELS, MSP and SBA scores to analyze the needs of our building. We compared scores from 2011-2012 to 2014-2015. Specifically in DIBELS, we compared the number of intensive and benchmark students in September versus June, and how that growth compared to not only our school but the district as well. When we looked at the state assessment results, we compared the number of students passing between our school, district, and the state. We then looked at the difference between Dick Scobee versus the state and Auburn School District. Our data carousel also included analysis of specific subgroups within our building including: 3rd, 4th, 5th grade students, Special Education, ELL, Hispanic, Male and Female students.
WELPA (ELPA 21)
At Dick Scobee Elementary, our ELL students perform low on the WELPA (ELPA 21) assessment. Our most
recent data shows that we retain a larger number of students on Level 1-3, but do not often move students to
Level 4. This results in low exit numbers and we often have ELL students that we monitor through additional
assessments to see if they need additional ELL support. We have also consistently increased in our total
number of ELL students that are being served each year.
CEE Perceptual Survey
The CEE Perceptual Survey demonstrated significant gains in all areas. In particular, in Parent and Community
Involvement which has historically been an area of struggle. In 2012, this area scored 40%, whereas in 2014
this grew to a total of 60% (a gain of 20%). Areas where we continue to need improvement are Cultural
Responsiveness, Collaboration and Communication and District Support for Improvement.

SIP Template
9 | Page 11/19/2013
Parent Education
Project
Parent Advisory
Board
Family Engagement
EventsPTA
SBA ELA & Math
When we looked at the state assessment results, we compared the number of students passing between our school, district, and the state. We then looked at the difference between our school versus the state, along with our school versus the district. Our data carousel also included analysis of specific subgroups within our building including: 3rd, 4th, 5th grade students, Special Education, ELL, Hispanic, Male and Female students.
Parent Involvement – SWT 6
Dick Scobee Elementary has a four-pronged approach to Parent Involvement:
Parent Education Project
This is a series of classes that parents and guardians are invited to attend. The goal is to create
capacity within our families to be able to successfully support their child in navigating the public
education system. The class topics are described below:
8 Sessions
o Understanding the Public School System

SIP Template
10 | Page 11/19/2013
o Basic Education Rights and School Policy
o Communicating with Your Childs’ School
o School Discipline Process
o Bullying, Intimidation, and Harassment
o Cyber-safety and Social Media
o Attendance and Academics
o Support and Special Services
o Becoming an Academic Partner (advocacy, recruitment, & feedback)
Parent Advisory Board
This is a small group of parents who represent a cross-section of our student demographics. The
purpose of this group is to be a voice for parents, a voice to parents, and to provide authentic input for
decisions made in the school house. These individuals also serve on our School Improvement Plan
Committees.
Family Engagement Events
We host monthly events for our students and families to gather together for a range of purposes.
Some of the events are simply fun and focused on family connection like our Winter Wonderland Craft
Night. Some of the events are planned to support parents in the area of academic resources such as how
to help their child with reading and math at home. Every spring, through a team made up of both staff
and parents, a Multicultural Night is planned. This is an opportunity for our families to share with one
another the unique contributions of their cultures.
PTA
The Parent Teacher Association is created by parents/teachers to raise money and support
student learning, enrichment, and the goals of the school. They support field trips, incentives, movie
nights and much more.
Assessment Decisions – SWT 8
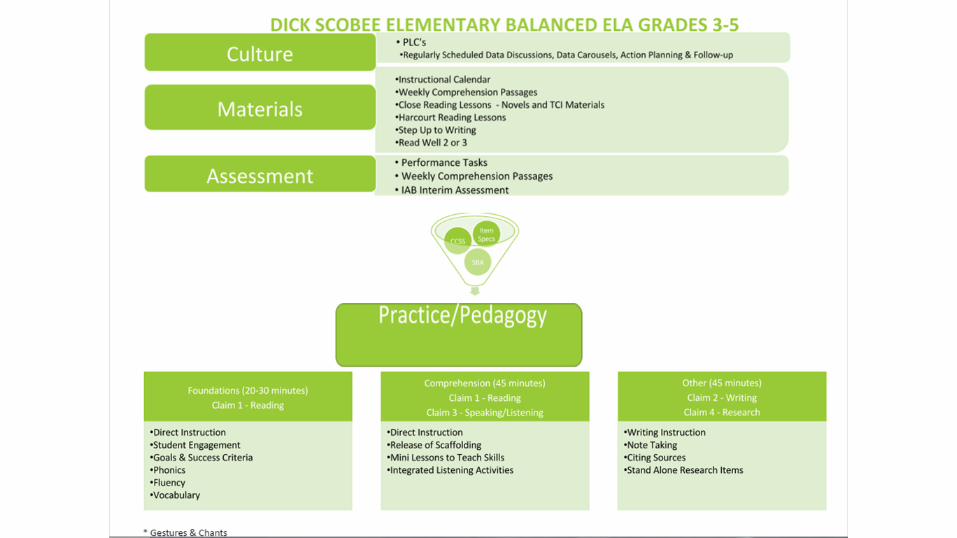
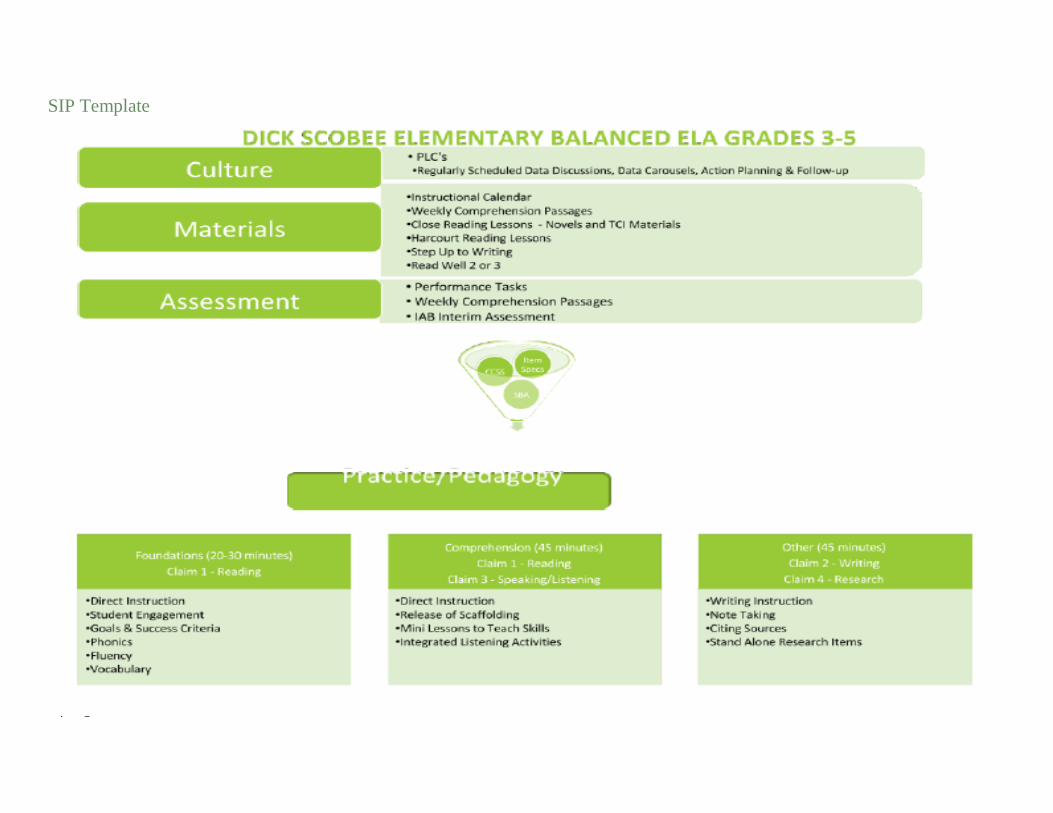
In ELA, DIBELS is our primary filter for establishing leveled reading CORE groups as well as our Tier II leveled reading groups. Both words per minute and accuracy data are analyzed for these decisions. While DIBELS is the primary filter in K-2, additional assessments are also used to drive instruction. Early Reading Intervention (ERI) assessment results are analyzed in Kindergarten, whereas Read Well unit assessment results are discussed in grades 1-2. While DIBELS is also a primary filter in grades 3-5, they also use MAPS and SBA scores for additional information. All grade levels use Common Formative Assessments to make instructional decisions regarding the progress of students and/or need for additional remediation. At various grade levels additional diagnostic assessments are used to target specific deficits for students for the purpose of targeted assistance.

SIP Template
11 | Page 11/19/2013
In Math, Common Formative Assessments, Unit Pre-Assessments, and district provided Engage New York Summative Assessments are used for grades K-5. Additionally, we utilize building wide monthly fact fluency assessments. MAPS and SBA results are also analyzed for grades 3-5 in order to provide information regarding systemic needs and targeted support for students.
Effective, Timely Assistance – SWT 9
Through our routine monitoring of grade level and building wide data, interventions and acceleration is
planned, implemented, and monitored. In both ELA and Math there is weekly data, monthly progress
monitoring, and building wide data meetings three times a year. Our building utilizes instructional coaching
cycles through the use of a building Instruction Specialist, Principal, and Student Support Specialist. There has
been a culture of co-teaching, collaboration and peer observation developed as well.
Please see system maps on subsequent pages:

SIP Template
1 | Page 11/19/2013

SIP Template
2 | Page 11/19/2013

SIP Template
3 | Page 11/19/2013

SIP Template
4 | Page 11/19/2013
SIP Template
5 | Page 11/19/2013

SIP Template
1 | Page 11/19/2013
Prioritized Challenges To provide consistency, all three SIP sub-committees utilized the same strategies to prioritize our challenges for
our building. Each sub-committee met to analyze the data from each area, which also included parent input.
By using the data, each sub-committee compiled a list of strengths and weaknesses. At the conclusion of that
meeting, the sub-committee chairs then organized all of the ideas from team members and looked for
commonalities. As we continued to analyze the results, the sub-committee chairs then produced a document
that listed common strengths and weaknesses to each team. The areas that were consistently recognized by the
team provided the direction to create each SMART goal. The SMART goals were then taken back to each sub-
committee for confirmation and then ideas for action steps were compiled. The sub-committee chairs were then
able to enter the suggestions into an Action Step Prioritization tool, which helped to aid in ranking of highest
need. From that tool, action steps were finalized and then shared back with building staff.
ELA
Our male third grade state assessment scores have declined by 21.7% from 2012-2015.
In 2014-15 3rd grade gained 13% more intensive students from the start of the year to the end of year.
In 2014-2015 the number of benchmark 3rd graders (as measured by DIBELS) fell 22% from start of
year to end of year.
Historically, our 3rd grade students struggle with reaching benchmark in fluency. Research shows that
students who struggle with reading fluency, generally have more difficulty comprehending what is read
because their focus is on decoding all the words instead of understanding what those words mean. As a
building, we need to get our students to read fluently prior to reaching 3rd grade, in order for those
students to spend more time reading to learn and focusing on comprehension strategies.
Math
Male 3rd grade students decreased from 76% passing the math MSP in 2012-2013 to 45% passing in
2014-2015.
In 4th grade, male students are still 9.8% lower than the state average on MSP in 2014-2015.
On average, 5th grade male scores have dropped by over 15% from 2012-2013. There was only a 1%
difference in scores between 2013-2014 and 2014-2015, which accounts for the change in standards and
state test.
On average, the discrepancies between 3rd, 4th, and 5th male and female scores for the state versus the
district, varied between 1-3% over two years. At Dick Scobee, the male scores have continued to drop
and have reached an 11% difference compared to the female scores in math.
SIP Template
2 | Page 11/19/2013
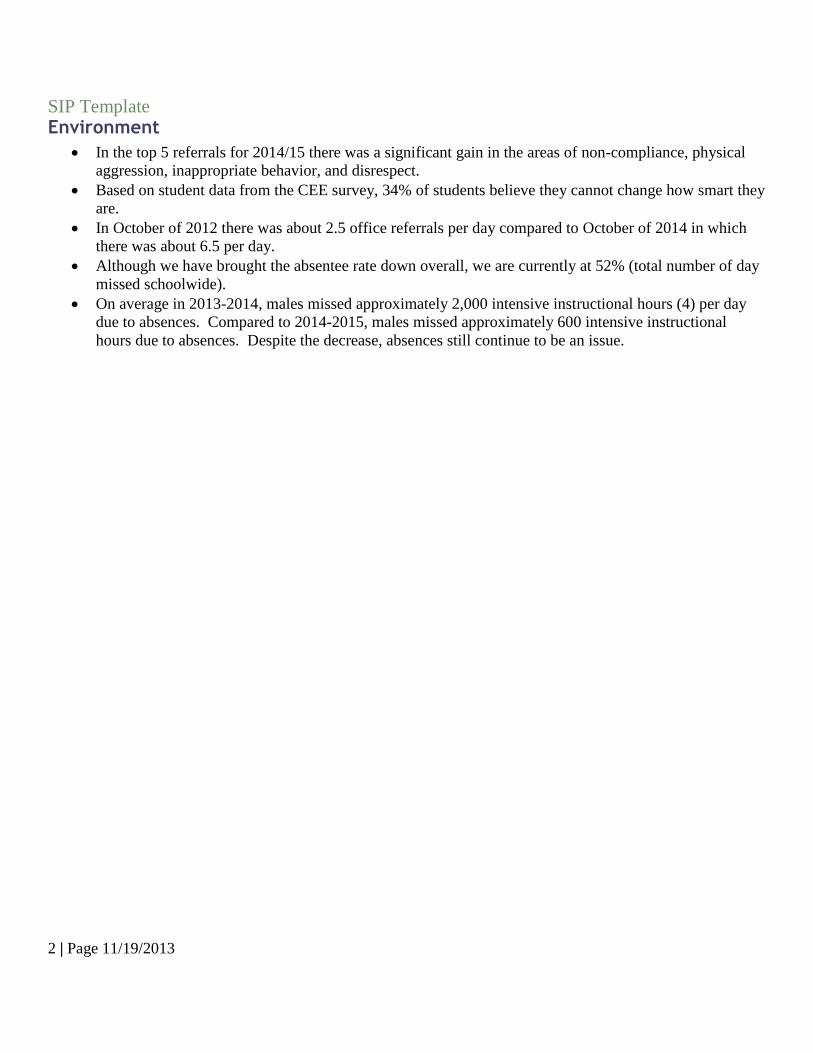
Environment
In the top 5 referrals for 2014/15 there was a significant gain in the areas of non-compliance, physical
aggression, inappropriate behavior, and disrespect.
Based on student data from the CEE survey, 34% of students believe they cannot change how smart they
are.
In October of 2012 there was about 2.5 office referrals per day compared to October of 2014 in which
there was about 6.5 per day.
Although we have brought the absentee rate down overall, we are currently at 52% (total number of day
missed schoolwide).
On average in 2013-2014, males missed approximately 2,000 intensive instructional hours (4) per day
due to absences. Compared to 2014-2015, males missed approximately 600 intensive instructional
hours due to absences. Despite the decrease, absences still continue to be an issue.
SIP Template
3 | Page 11/19/2013
SMART Goal 1:
We will improve the percentage of 3rd graders meeting standard from 60% in 2014-2015 to 81% in 2018-2019
as measured by the Smarter Balance Computer Adaptive Test (CAT).
SMART Goal 2:
Male scores will improve by 7% from spring of 2015 to spring of 2019 as measured by the Smarter Balance
math assessment.
SMART Goal 3:
Out of class time score will decrease by 15% from 82.9 in spring of 2015 to 70.47 in spring of 2019. (This score
is generated through the following formula:
Attendance Score + Behavior Score + Calendar Score = “Out of class time score”
Attendance Behavior Calendar Total “Intended Hours”
(Absences + (Tardies *
.33)
Total Enrollment
= Avg # hrs
lost/student/year
Total ODR’s /
Enrollment *.5
= Avg # hrs
lost/student/year
Last full day of school
+ PLC’s (1 hr ea)
+ (# of field trips 8
4.25)
+(# of assemblies * 2
hrs)
= Avg # hrs
lost/student/year
(177 Days * 4.25 learning
hrs/day)
- 5 hrs
(Conferences/Thanksgiving
- 8.5 hrs (1 day and Last day)
= 738.75 hrs of real intended
learning time

SIP Template
4 | Page 11/19/2013
Needs Assessment Data Documents
o DIBELS
o MAP
o WELPA
o CEE Spider Chart
o Discipline (including Office Discipline Referrals)
o Demographics
o Attendance Data (Skyward)
o SBA
o MSP
o Other data

SIP Template
2 | Page 11/19/2013
SIP Template
1 | Page 11/19/2013
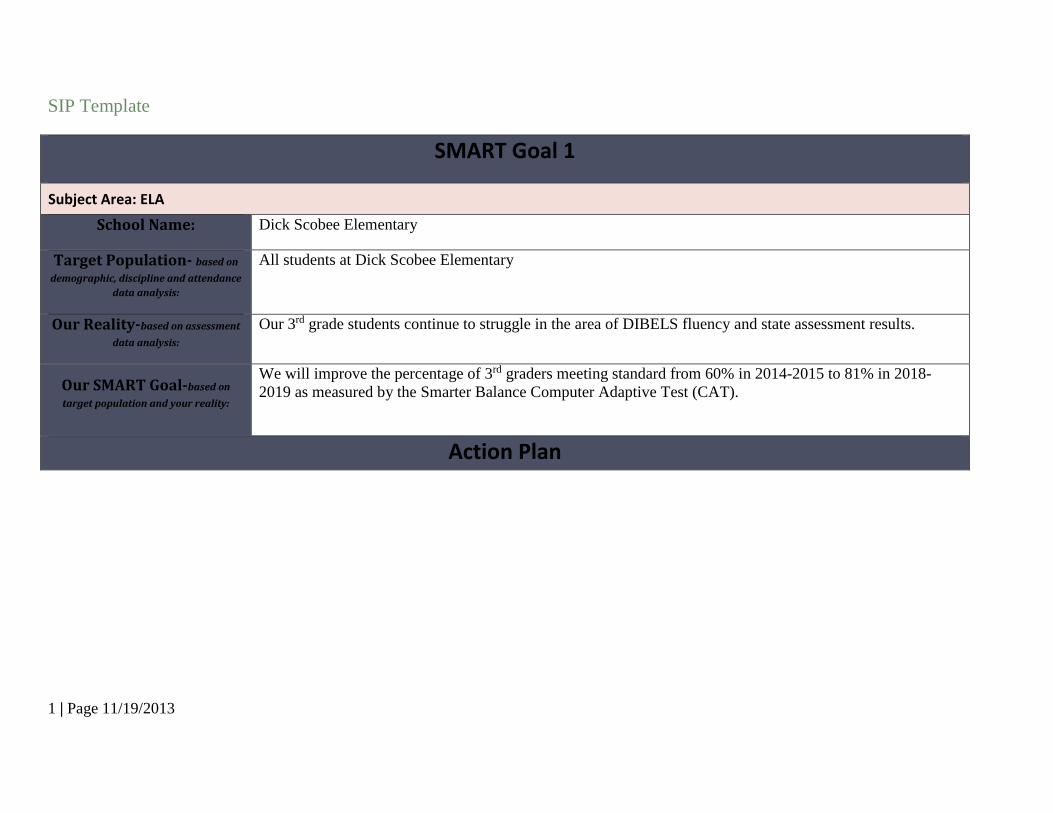
SMART Goal 1
Subject Area: ELA
School Name: Dick Scobee Elementary
Target Population- based on
demographic, discipline and attendance
data analysis:
All students at Dick Scobee Elementary
Our Reality-based on assessment
data analysis: Our 3rd grade students continue to struggle in the area of DIBELS fluency and state assessment results.
Our SMART Goal-based on
target population and your reality:
We will improve the percentage of 3rd graders meeting standard from 60% in 2014-2015 to 81% in 2018-
2019 as measured by the Smarter Balance Computer Adaptive Test (CAT).
Action Plan

SIP Template
2 | Page 11/19/2013
Action Step
SWT 2
Year 1: Develop and use a consistent format for Reading First Templates in teaching phonics
skills.
Evidence of Implementation Evidence of Impact Timeline Resources Responsibility
All ELA instructors will
implement and regularly use
the consistent format in
teaching phonics skills
through Reading First
Templates.
Every instructional staff
member will be trained and
expected to use templates
and instruction of
syllabication (as appropriate
to skill level of students).
Sign-in Sheets
Chart Paper and/or
PowerPoints supporting
templates.
Consistent gestures
PLC sharing of strategies and
successes/challenges
Principal and/or Assistant
Principal and Instructional
Specialist walk throughs
Monitor and analyze
accuracy scores from
Accuracy scores will increase as
measured by DIBELS
Template skills would be
populated based on results from
Decoding Survey
Fall Training on
Reading First
Templates &
Syllabication
Initial
implementation in
September &
October
Starting in October
Observations &
Feedback by
Principal, Assistant
Principal or
Instructional
Specialist
Starting in October
staff will watch
template videos
during staff
meetings every
other month
Evelyn Probert
(district trainer)
PLC time/Building
Hours
August In-Services
Staff Meetings
Instructional
Specialist
Ongoing coaching
and support
Peer Observations
Video
Technology
Coordinator
Implementation:
SIP
BLT
Demonstration:
Principal/Assistant
Principal
Teachers and Para
Educators
Grade Level Teams

SIP Template
3 | Page 11/19/2013
DIBELS benchmark and
progress monitoring
assessments.
Students in grades 3-5 who
score below a 95% accuracy
will be given the Diagnostic
Decoding Survey (3 times
per year) to identify phonics
skills that students are not
solid in.
Coaching Cycles
Additional
PD/Revisit
Progress in January
Ongoing
observations/feedba
ck
Year 1 check in at
the end of the year
(June)
Action Step SWT 2
Year 2: Teach and implement skills for deeper questioning strategies.
Evidence of Implementation Evidence of Impact Timeline Resources Responsibility
All staff training around
questioning strategies (sign-in
sheets)
Improved quality and quantity of
DOK in the questions observed
during observations
Student questioning will improve
Increased comprehension scores
as measured by District Passages
and SBA (Grades 3-5)
Increase in math problem solving
scores as measured by SBA,
IAB’s, and Problem Solving work
August of 2017
Training
October ’17-June
‘18
Classroom data
collected and
reported
Building Hours
Staff Meetings
Building Funds
Anchor Charts
Implementation:
SIP
BLT
Demonstration:
Principal/Assistant
Principal
SIP Template
4 | Page 11/19/2013
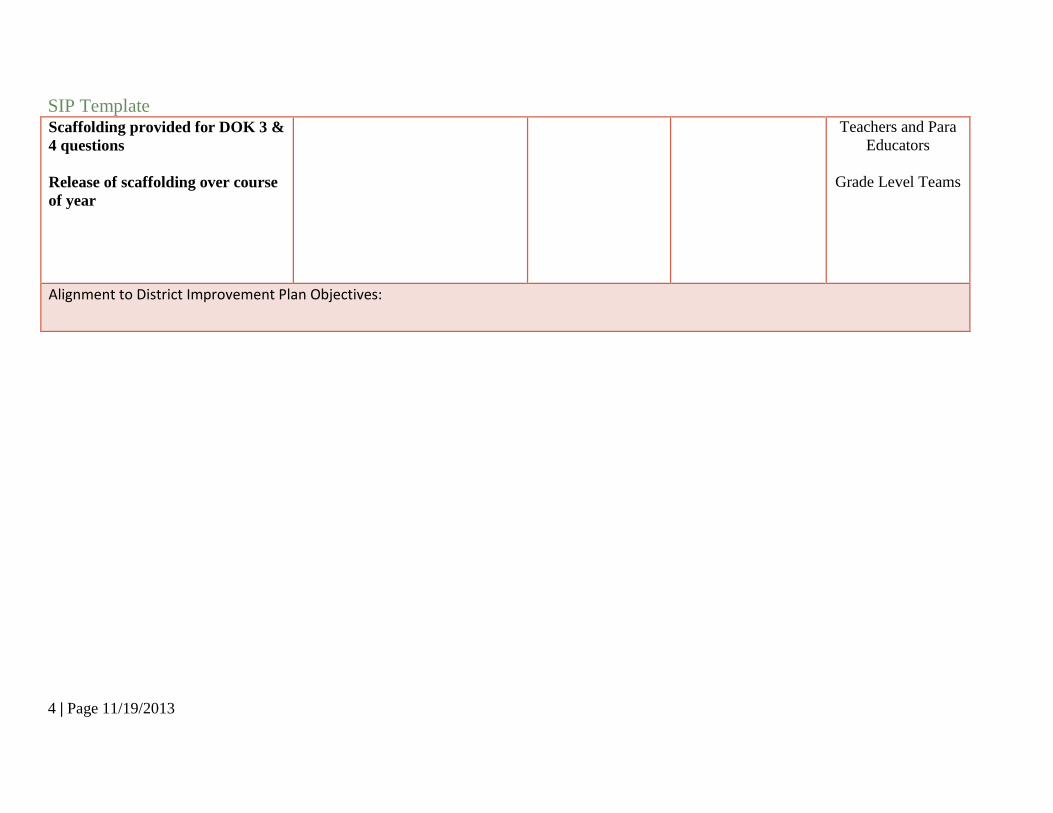
Scaffolding provided for DOK 3 &
4 questions
Release of scaffolding over course
of year
Teachers and Para
Educators
Grade Level Teams
Alignment to District Improvement Plan Objectives:

SIP Template
5 | Page 11/19/2013
SMART Goal 2
Subject Area: Math
School Name: Dick Scobee Elementary
Target Population- based on
demographic, discipline and attendance
data analysis:
All students at Dick Scobee Elementary
Our Reality-based on assessment
data analysis:
Male math scores have consistently decreased within our population and is falling further behind state and
district scores as well.
Our SMART Goal-based on
target population and your reality:
Male scores will improve by 7% from Spring of 2015 to Spring of 2019 as measured by the Smarter Balance
math assessment.
Action Plan
SIP Template
6 | Page 11/19/2013
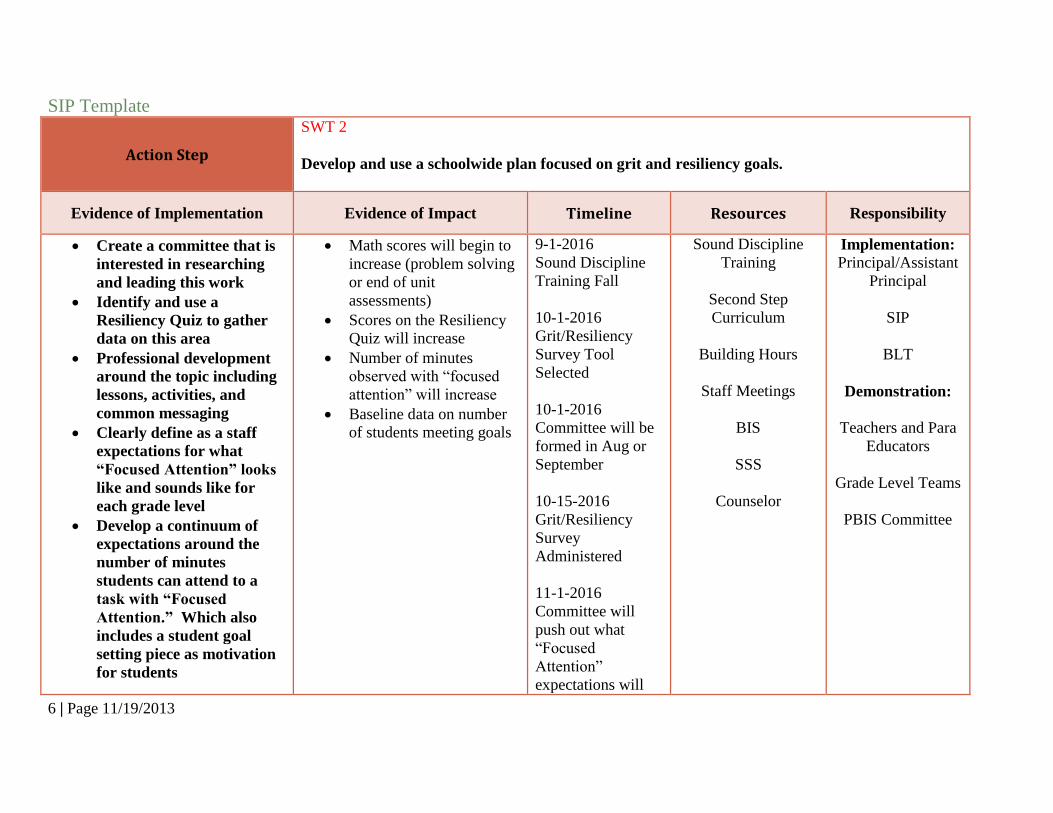
Action Step
SWT 2
Develop and use a schoolwide plan focused on grit and resiliency goals.
Evidence of Implementation Evidence of Impact Timeline Resources Responsibility
Create a committee that is
interested in researching
and leading this work
Identify and use a
Resiliency Quiz to gather
data on this area
Professional development
around the topic including
lessons, activities, and
common messaging
Clearly define as a staff
expectations for what
“Focused Attention” looks
like and sounds like for
each grade level
Develop a continuum of
expectations around the
number of minutes
students can attend to a
task with “Focused
Attention.” Which also
includes a student goal
setting piece as motivation
for students
Math scores will begin to
increase (problem solving
or end of unit
assessments)
Scores on the Resiliency
Quiz will increase
Number of minutes
observed with “focused
attention” will increase
Baseline data on number
of students meeting goals
9-1-2016
Sound Discipline
Training Fall
10-1-2016
Grit/Resiliency
Survey Tool
Selected
10-1-2016
Committee will be
formed in Aug or
September
10-15-2016
Grit/Resiliency
Survey
Administered
11-1-2016
Committee will
push out what
“Focused
Attention”
expectations will
Sound Discipline
Training
Second Step
Curriculum
Building Hours
Staff Meetings
BIS
SSS
Counselor
Implementation:
Principal/Assistant
Principal
SIP
BLT
Demonstration:
Teachers and Para
Educators
Grade Level Teams
PBIS Committee

SIP Template
7 | Page 11/19/2013
Goal setting tools for each
grade level in the areas of
Math, ELA, & SEL
Parent informational letter
regarding expectations and
definition will be created
and shared at conferences
look like in
October (share with
parents during Nov.
conferences)
2-1-2017
Progress
Monitoring data
regarding “focused
attention” minutes
and number of
goals met/on track
6-16-2017
Grit/Resiliency
Survey
Administered
6-15-2017
Second Step
Curriculum taught
Fall-End of Year

SIP Template
8 | Page 11/19/2013
Action Step
SWT 2
Staff will utilize math focused technology apps within teaching.
Evidence of Implementation Evidence of Impact Timeline Resources Responsibility
Year 1, staff will research
and pilot a variety of math
apps/Electronic Programs
to use both on
Chromebooks and on
Tablets.
A committee will be formed
to look at a list of effective
apps/Electronic Programs
to use building wide.
The committee will create a
menu of options from that
list to share with all staff,
students, and parents
through the school website.
Conduct a focused study on
Apps/Electronic Programs
Student scores for fact fluency
will increase.
Approved Apps/Electronic
Programs listed on building and
classroom websites
Student scores on end of unit
assessments will increase.
Results from focused study
2016-2017 school
year will be used
for research,
piloting, and
creating a
committee to look
more specifically at
this action step.
1-1-2017
Rubric for rating
Apps/Electronic
Programs will be
identified
Spring of 2017 the
technology menu
will be available to
all staff.
Committee will
identify apps and
conduct a study.
They will review
Chromebooks
Tablets
Internet
WiFi
Building Budget
Software Budget
Principal/Assistant
Principal
Instructional
Technology
Teacher
Instructional
Technology
Support Specialist
Grade Level Teams
SIP Template
9 | Page 11/19/2013
the results and
communicate them
to staff.
Alignment to District Improvement Plan Objectives:

SIP Template
10 | Page 11/19/2013
SMART Goal 3
Subject Area: Environment
School Name: Dick Scobee Elementary
Target Population- based on
demographic, discipline and attendance
data analysis:
All Students at Dick Scobee Elementary
Our Reality-based on assessment
data analysis:
Due to our large number of free and reduced lunch students (82%), we constantly deal with families who
come from poverty and other types of trauma. Research shows that these students struggle and perform at a
lower academic and social level than peers who do not share the same experiences.
Our SMART Goal-based on
target population and your reality: Out of class time score will decrease by 15% from 82.9 in spring of 2015 to 70.47 in spring of 2019.
Action Plan
Action Step
SWT 2
Year 1: Develop and use additional Tier 1 and Tier 2 strategies to support all students, including
students affected by trauma.
Evidence of Implementation Evidence of Impact Timeline Resources Responsibility
Staff will develop a deeper
understanding of trauma
and how it affects children.
Students will be able to identify
where they are emotionally in a
difficult situation/emotional
escalation.
Initial Sound
Discipline Training
during Aug LID
days
Sound Discipline
Consultant/Presenter
Principal/Assistant
Principal
Principal/Assistant
Principal
Certificated &
Classified Staff

SIP Template
11 | Page 11/19/2013
Staff will learn to identify
different types of trauma
and how to interact with
students.
Staff will understand the
difference between
encouragement and praise
and have common
language to differentiate
between the two.
Staff will develop and use
common language with
students to help them
understand their feelings
and emotions, which will
result in students being
able verbalize and process
difficult situations.
Staff will learn tips and
strategies for how to
successfully de-escalate a
situation and will be able to
support the student in that
process.
Staff will be able to appropriately
respond to students with trauma.
Staff will be able to de-escalate a
situation with students and be
able to appropriately intervene.
Staff will proactively be aware
and identify signs of escalation.
Decrease Office Discipline
Referrals
Identify staff
meetings
throughout the year
to revisit, discuss,
and share strategies
BIS
Student Support
Specialist
Resource Room Staff
Behavior Team

SIP Template
12 | Page 11/19/2013
Action Step
SWT 2
We will develop parents’ understanding of the importance of attendance through collaboration
with Dick Scobee Elementary School.
Evidence of Implementation Evidence of Impact Timeline Resources Responsibility
Plan a presentation to
parents at Open House to
increase parent awareness
around attendance and lost
instructional time
Create and use a more
effective/descriptive
attendance letter for
parents
Create a system for Tier 2
and Tier 3 attendance
students similar to CICO.
Continue student goal
setting and incentive
program for all students
Parents will have a better
understanding of the impact that
attendance has on student
learning (as measured by parent
survey)
TII & TIII will receive more
interventions, instruction, &
academic growth
Open House in
September
Share system for
rewarding during
Nov. parent
conferences (2016)
Finalize and share
the system for Tier
2 and Tier 3
students in Feb.
2017
BIS
Counselor
Office Staff
(Attendance)
Rewards and
Incentives
Principal/Assistant
Principal
BIS
Counselor
Office Staff
(Attendance)
Grade Level Teams
Alignment to District Improvement Plan Objectives:

SIP Template
1 | Page 11/19/2013
Planning and Implementation Calendar - SWT 4
Month Building 28+6 principal’s
hours Staff
Meetings BLT
Meetings District/Waiver
Days Other
June
August 8-31 Template Training
(Evelynn Probert) 3.5 hrs
opposite District Determined
9-1 Sound Discipline
8:30-12:00
Septembe
r Discuss/review Trauma
related strategies and work
9-1 Sound Discipline
8:30-12:00
9-6 Back to School Night
September BLT – team will
select the Resiliency/Grit
tool
9-26 Teachers start using
templates in their instruction
X
X
X
X
October Start watching template
videos at staff meetings
every other month
10-14 Staff administers
Universal Screener
10-14 BLT will create and
share building wide
definition of “Focused
Attention” and Goal Setting
Tools
X
X
X

SIP Template
2 | Page 11/19/2013
10-17 Observations and
feedback by Principal/AP/IS
will take place with a focus
on templates
10-21 Resiliency/Grit
Survey Administered
X
X
November Whole staff review of ODR
and Attendance Data
11-23 “Focused Attention”
expectations and Attendance
Information will be shared
with families during
conferences
11-25 Instructional Tech
Team formed and identifies
a rubric for rating apps and
electronic programs
X
X
X
December Start watching template
videos at staff meetings
every other month
X
January Discuss/review Trauma
related strategies and work
Additional PD related to
Templates and check-in
X
X
February Start watching template
videos at staff meetings
every other month
Progress Monitoring Data re:
“Focused Attention” Data
and # of students who have
met goals and/or on track
X
X

SIP Template
3 | Page 11/19/2013
Finalize and share
attendance systems for TII
and TIII students
March Whole staff review of ODR
and Attendance Data
X
April
Start watching template
videos at staff meetings
every other month
X
May Year 1 SIP Check-in
5-1 Begin Master Calendar
for 2017-2018 (including
year 2 SIP Action Steps)
X
June Whole staff review of ODR
and Attendance Data
6-16 Administer Resiliency /
Grit Post Survey
X
X
Budget - SWT 10
Insert budget page here