school finance and opportunities to learn: does money well spent enhance students' achievement?
TRANSCRIPT
School Finance and Opportunities to Learn: Does Money Well Spent Enhance Students'Achievement?Author(s): Marta ElliottSource: Sociology of Education, Vol. 71, No. 3 (Jul., 1998), pp. 223-245Published by: American Sociological AssociationStable URL: http://www.jstor.org/stable/2673203 .
Accessed: 24/06/2014 20:31
Your use of the JSTOR archive indicates your acceptance of the Terms & Conditions of Use, available at .http://www.jstor.org/page/info/about/policies/terms.jsp
.JSTOR is a not-for-profit service that helps scholars, researchers, and students discover, use, and build upon a wide range ofcontent in a trusted digital archive. We use information technology and tools to increase productivity and facilitate new formsof scholarship. For more information about JSTOR, please contact [email protected].
.
American Sociological Association is collaborating with JSTOR to digitize, preserve and extend access toSociology of Education.
http://www.jstor.org
This content downloaded from 195.34.79.192 on Tue, 24 Jun 2014 20:31:17 PMAll use subject to JSTOR Terms and Conditions
School Finance and Opportunities to Learn: Does Money Well Spent Enhance
Students' Achievement?
Marta Elliott University of Nevada, Reno
The study reported here linked U.S. census data on school finance to data from the National Education Longitudinal Survey of 1988 to evaluate the process through which financial resources affect opportunities to learn in U.S. public high schools. It examined the direct effects of school expenditures on students' achievement in math and science and the indirect effects of expenditures on achievement through their provision of opportunities to learn. ft also tested mul- tiple components of opportunities to learn to determine their relative impact on students' success. The results indicate that per-pupil expenditures indirectly increase students' achievement by giving students access to educated teachers who use effective pedagogies in the classroom.
PT'Vle central issue addressed in the study reported here is how the allocation of public school funds
affects students' achievement through access to opportunities to learn (OTL). The study posed three related ques- tions. First, do educational expendi- tures affect students' achievement? Second, what components of OTL affect math and science achievement? Third, if funds are allocated for the most critical components of OTL, do students learn more? The analyses of OTL focused on 10th-grade math and science classrooms, and the outcome under consideration was change in math or science performance between the 8th and 10th grades. This article illuminates both the relationship between spending practices and stu- dents' achievement and the specific components of OTL in the classroom that affect students' outcomes. Moreover, it indicates how financial resources indirectly affect students' achievement by creating differential access to OTL.
REVIEW OF THE LITERATURE
Widespread inequalities among school districts in the financial resources available to schools and the relative allocation of finances have been carefully documented in the research literature (National Center for Education Statistics, NCES, 1995). These findings have precipitated dozens of lawsuits against states to demand adequate and more equitable funding prac- tices. Most parents and educators assume that greater resources make it possible to improve schools. Nonetheless, there is considerable controversy among educational researchers over the relationship between school finance and students' achievement. One side maintains that there is no significant relation- ship between increasing expendi- tures and improving students' achievement because schools do not effectively use these funds to improve the learning environment (Hanushek 1989a, 1989b, 1991, 1994, 1996a,
SOCIOLOGY OF EDUCATION 1998, VOL. 71 (JuLY): 223-245 223
This content downloaded from 195.34.79.192 on Tue, 24 Jun 2014 20:31:17 PMAll use subject to JSTOR Terms and Conditions
224 Elliott
1996b). The other side argues that there is a significant relationship between money and achievement because money buys smaller class- rooms and schools and more quali- fied teachers (Greenwald, Hedges, and Laine 1996; Hedges and Greenwald 1996; Hedges, Laine, and Greenwald 1994).
The ongoing debate between Hanushek and Greenwald, Hedges, and Laine has centered on method- ological considerations. On the basis of a vote count of 187 separate "edu- cation production function" equa- tions, Hanushek (1989:47) conclud- ed that "there is no strong or system- atic relationship between school expenditures and student perfor- mance." Hedges et al. (1994) argued that Hanushek misinterpreted the thrust of his results and that his method was biased toward accepting the null hypothesis of no relationship between expenditures and achieve- ment.
On the basis of a meta-analysis of a subsample of the same data Hanushek (1989) used, Hedges et al. (1994:12) concluded that "there is strong evidence of at least some posi- tive effects of PPE [per-pupil expendi- tures] on outcome," although the effects of specific resource inputs, such as teachers' salaries or educa- tion, were mixed. Hanushek (1994:6) criticized their method of eliminating equations from the meta-analysis in which the effects of expenditures are nonsignificant but the direction of effects are unknown, arguing that "this has the effect of completely ignoring 30% to 40% of the esti- mates." Hedges et al. (1994:10) defended their criteria for eliminating equations from Hanushek's sample and showed that even without such elimination, the results would still show "strong evidence of positive effects and little evidence of negative effects." The two sides both allowed
that money does matter somehow, sometimes, but they did not agree on the prevailing direction, strength, or consistency of the relationship between money and achievement.
Greewald et al. (1996:384) present- ed a similar meta-analysis of a larger sample of studies of education pro- duction function equations; they con- cluded that their more comprehensive data showed that "school resources are systematically related to student achievement and . . . [that] these rela- tions are large enough to be educa- tionally important." Hanushek (1996a) countered by again attacking their methodology, especially their sample-selection procedures. However, he acknowledged that in "certain circumstances [when coeffi- cients are positive and significant] resources are used effectively" (p. 402). Where both Hanushek and Hedges et al. appear to have agreed all along is on the need to pursue, in Hanushek's (1996a:407) words, "effective resource use," or, in Hedges et al.'s (1994:10) words, "how money matters." Although the two sides dis- agree vehemently on the extent to which public school expenditures, both past and present, promote stu- dents' achievement, they agree that the primary concern of researchers and policy makers alike should be to illuminate the mechanisms through which money can effectively enhance learning.
A unique strength of the study presented here was its attempt to specify the causal pathway through which dollars translate into learning resources that, in turn, promote learning. Previous efforts to address "how money matters" did not explicit- ly distinguish between dollars, per se, and the resources that dollars pur- chase, such as effective teachers. For example, Ferguson (1991) demon- strated that teachers' skills (as mea- sured by test scores) and larger
This content downloaded from 195.34.79.192 on Tue, 24 Jun 2014 20:31:17 PMAll use subject to JSTOR Terms and Conditions
School Finance and Opportunity to Learn 225
teacher-pupil ratios are significantly related to students' higher achieve- ment. However, he did not explicitly demonstrate that expenditures are used to purchase more skilled teach- ers and to ensure smaller classes. Similarly, Greenwald, Hedges, and Laine (1996) found significant effects of smaller schools, smaller class- rooms, and more educated teachers on students' achievement, but did not explicitly link these resources to the way money is spent. The results of the present study show not only the specific school inputs that promote learning, but the larger picture of how resources affect achievement through the provision of these inputs.
In contrast to the literature on school finance and students' achieve- ment, research on OTL pays close attention to the direct relationship between the learning environment and students' achievement, but typi- cally ignores the role of school finance. The concept of OTL arose as a means of comparing students' achievement cross-nationally by tak- ing into account curricular differ- ences in what students are exposed to in schools in various nations. It was later transformed into a policy instrument in debates over educa- tional standards and used by some to argue that students should not be held accountable for their perfor- mance on achievement tests unless their schools provide them with an opportunity to learn the content of the tests (McDonnell 1995).
Early studies of OTL emphasized matching course content with test content so test scores could be valid representations of how well students learned what was actually taught in the classroom (see Stevens 1993 for a review). In the mid-1980s, the concept of OTL expanded from curricular con- tent to include indicators of how cur- riculum is taught and who teaches it (McDonnell 1995). Although
researchers vary in their approaches to categorizing these components of OTL (see Brewer and Stasz 1995 and Stevens 1993 for two alternatives), most focus on course content, instructional strategies, teachers' background, class size, students' readiness (initial achievement levels), and the availability of physical resources (such as books and equip- ment) as central indicators of the classroom learning environment. By measuring OTL in greater depth, researchers (for example, Hoffer and Moore 1995) have been able to docu- ment inequalities among students in access to knowledge through a variety of dimensions of OTL. In seeking ways to reduce these inequalities, it is important to ask what constitutes an adequate level of spending to ensure access to OTL and how existing funds may be allocated to enhance the most effective components of OTL.
Despite decades of litigation and policy making on issues of the adequa- cy and equity of funding, there are still gross inequalities both in funding and in students' achievement within and among school districts. The realization that financial resources alone cannot ensure that students' achievement will improve has focused attention on the issue of how financial resources should be used to create equal access to OTL (Brown 1995). Incorporating compensatory aid into funding formu- las, improving teachers' expertise, moving toward site-based manage- ment, and holding schools account- able for students' achievement are among researchers' recommendations for using money wisely to enhance OTL (Clune 1995; Darling-Hammond 1995; Odden 1995; Porter 1995). However, none of these strategies has been adequately tested with national data that link funding practices to OTL in the classroom and to students' achievement. A major strength of the present study was that it used the
This content downloaded from 195.34.79.192 on Tue, 24 Jun 2014 20:31:17 PMAll use subject to JSTOR Terms and Conditions
226 Elliott
best existing national data to provide evidence of how spending practices affect students' outcomes through the mediator of access to OTL.
There is a long-standing tradition among educational researchers of treating curricular tracks, rather than OTL, as the primary within- school source of unequal access to public education (see, for example, Alexander and McDill 1976; Gamoran 1992; Hallinan 1994; Oakes 1985). Most researchers define tracks as general programs of study, including a vocational track, a general track, and an academic track (Kubitschek and Hallinan 1996). The concept of OTL does not supersede that of tracks but, rather, is a com- plementary way of gauging inequali- ty. Although it is true that many of the components of OTL, such as the quality of teachers, vary systemati- cally among the tracks (Oakes 1985), there is considerable variation in OTL within tracks that must be addressed in its own right. Therefore, in this study, tracking and OTL were treated as distinct phenomena, both conceptually and empirically.
HYPOTHESES
Before modeling the relationships among funding, OTL, and learning, one must ask how and why money should matter as a direct prerequi- site of OTL. Previous research emphasized the links between finance and teachers' education and experience and class size. In this study, I also tested the hypothesis that financial resources improve stu- dents' achievement through the "pur- chase" of more educated and experi- enced teachers and smaller teacher- pupil ratios. In addition, I examined the pathways from finance to stu- dents' performance through the more proximate conditions of learning in the math or science classroom: how
the teacher teaches and what there is to teach with.
I focused on two key links between expenditures and achieve- ment: (1) the effect of expenditures on teachers' effectiveness and (2) the effect of expenditures on classroom resources. First, I hypothesized that teachers in schools that allocate rela- tively more money to staff develop- ment will be more effective in convey- ing their subject matter to students, who will consequently learn more. Second, I hypothesized that schools with greater financial resources will be better able to afford classroom resources, such as math and science equipment, which, in turn, will facili- tate learning. These two links between expenditures and achieve- ment are summarized by the follow- ing hypotheses:
The teaching-effectiveness hypoth- esis: In a given school, per-pupil expenditures increase students' achievement when funds are used to hire the most qualified teachers and to train them further in the most effective methods of teaching math and science.
The classroom-resources hypothe- sis: In a given school, per-pupil expenditures increase students' achievement when funds are used to make the use of equipment, such as computers and microscopes, regular- ly available.
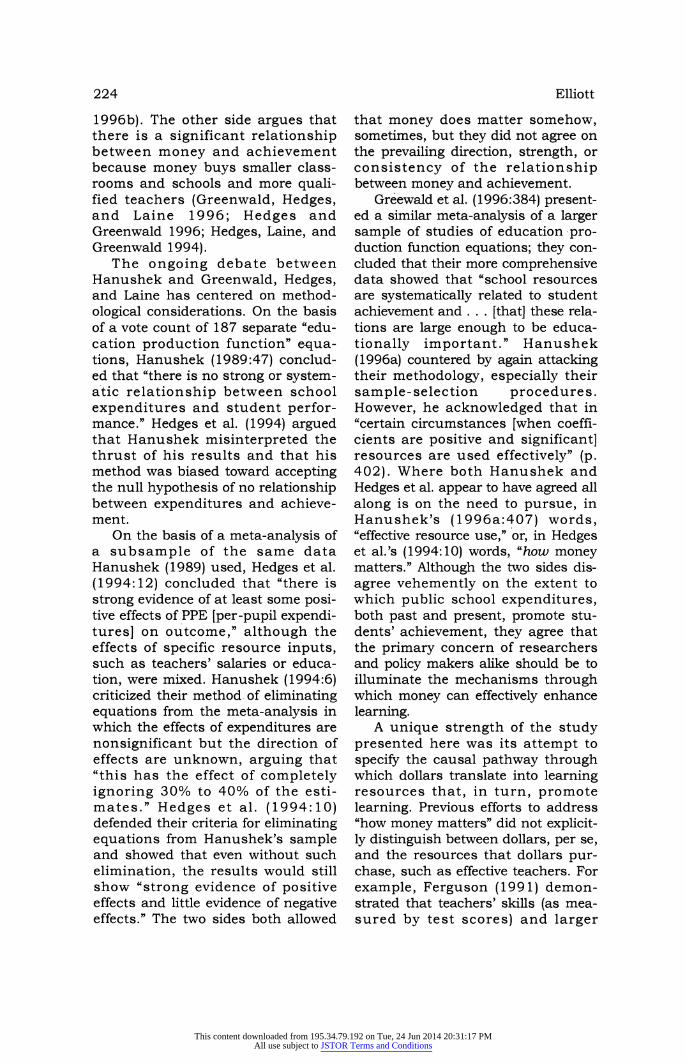
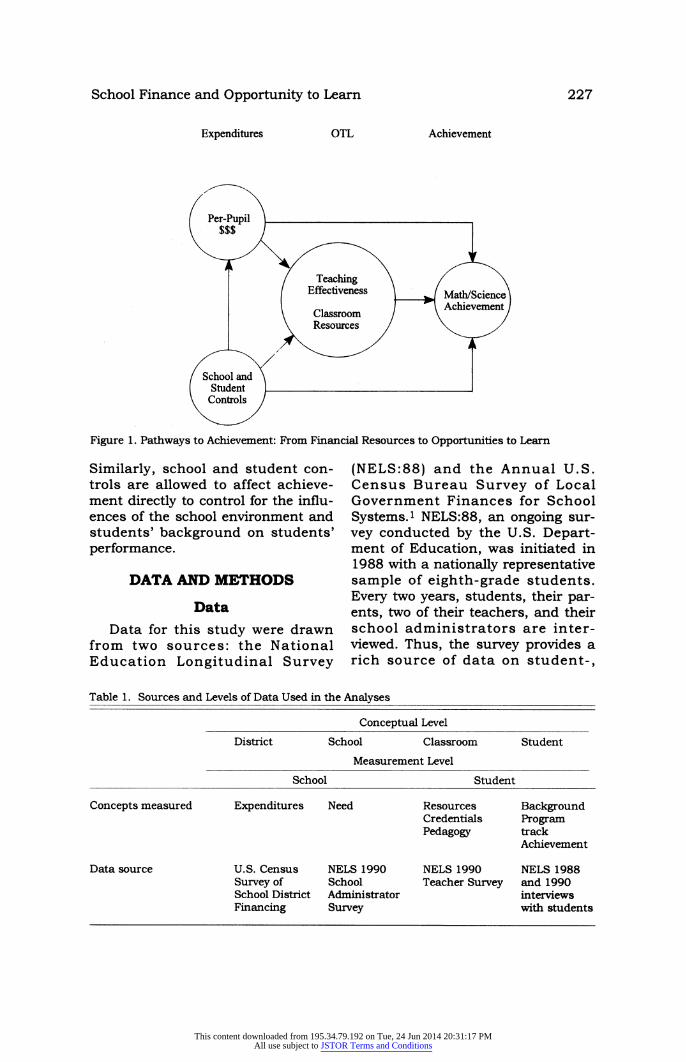
Figure 1 displays the conceptual model that underlies the analysis. On the far left are per-pupil expendi- tures that depend, in part, on the composition of students within schools. Expenditures directly affect the major dimensions of OTL-teach- ing effectiveness and classroom resources, which, in turn, affect math and science achievement. Expenditures are also allowed to affect achievement directly, to con- trol for unobserved learning resources that money buys.
This content downloaded from 195.34.79.192 on Tue, 24 Jun 2014 20:31:17 PMAll use subject to JSTOR Terms and Conditions
School Finance and Opportunity to Learn 227
Expenditures OTL Achievement
Per-Pupi}
Effectiveness _ aSine
Classroom 7 AchievementJ \ Resources / \
Scho and
Studntrol
Figure 1. Pathways to Achievement: From Financial Resources to Opportunities to Learn
Similarly, school and student con- trols are allowed to affect achieve- ment directly to control for the influ- ences of the school environment and students' background on students' performance.
DATA AND METHODS
Data Data for this study were drawn
from two sources: the National Education Longitudinal Survey
(NELS:88) and the Annual U.S. Census Bureau Survey of Local Government Finances for School Systems.' NELS:88, an ongoing sur- vey conducted by the U.S. Depart- ment of Education, was initiated in 1988 with a nationally representative sample of eighth-grade students. Every two years, students, their par- ents, two of their teachers, and their school administrators are inter- viewed. Thus, the survey provides a rich source of data on student-,
Table 1. Sources and Levels of Data Used in the Analyses
Conceptual Level District School Classroom Student
Measurement Level
School Student
Concepts measured Expenditures Need Resources Background Credentials Program Pedagogy track
Achievement
Data source U.S. Census NELS 1990 NELS 1990 NELS 1988 Survey of School Teacher Survey and 1990 School District Administrator interviews Financing Survey with students
This content downloaded from 195.34.79.192 on Tue, 24 Jun 2014 20:31:17 PMAll use subject to JSTOR Terms and Conditions
228 Elliott
classroom-, and school-level educa- tional processes. The census survey on school finance breaks down total public school expenditures at the school-district level into multiple cat- egories, providing information on the absolute level of spending and the proportion of available funds spent in different areas, such as the overall costs of instruction, teachers' salaries for instruction, and staff support (including staff develop- ment).
Table 1 indicates the sources of data and the conceptual and empiri- cal levels of data (which sometimes differ) that were used to measure each major conceptual area. Public school expenditures were measured at the district level using the U.S. census survey but are treated empir- ically as school-level measures. School-level data were measured with the NELS school administrator survey, and classroom- and student- level data were measured with the NELS teacher and student surveys. Classroom- and student-level mea- sures were assessed at the student level. These measures are described in greater detail following a descrip- tion of the samples.
Sample
The main sample was drawn from the NELS:88 panel of 14,868 public school students enrolled in the 10th grade in 1990 who were interviewed in both 1988 and 1990. All the descriptive statistics and multivariate analyses were weighted with the NELS panel weight. Separate subsamples were drawn for the science and math analyses on the basis of two criteria: (1) the students' were currently taking science (93 percent) or math (97 per- cent), and (2) their science or math teachers were interviewed (42 percent and 46 percent, respectively). The teacher data constitute a random
sample of the teachers of the sampled students, not of teachers per se (Ingels et al. 1994), so differences between students whose teachers were or were not interviewed were assumed to be due to random sam- pling error. Therefore, the results for the sample apply to the population of all U.S. public high school students who took math or science in the 10th grade in 1990.
Missing Data
The final sample sizes for the math and science analyses, 6,318 and 5,343, respectively, include all the respondents with valid data on the dependent variable: the 10th- grade math or science item response theory (IRT) theta score. Missing data on independent variables were treat- ed with the following strategy: The mean value of a given variable was substituted for any case that was missing on that variable. In addition, a dummy variable was constructed that corresponded to each indepen- dent variable with missing data. The value of the dummy variable was 1 for cases in which the mean was substituted, and 0 otherwise. The dummy variables indicative of miss- ing data were included in all the multivariate analyses, although their coefficients are not reported here.2 This procedure had the effect of maintaining a sample that is repre- sentative of the population of interest without biasing the coefficients for the independent variables with miss- ing data (Cohen and Cohen 1983).3
Measurement
Detailed descriptions of measure- ments are found in the Appendix. The following sections explain the measurement strategies by concep- tual area.
Student outcome. Achievement
This content downloaded from 195.34.79.192 on Tue, 24 Jun 2014 20:31:17 PMAll use subject to JSTOR Terms and Conditions
School Finance and Opportunity to Learn 229
was measured by the 10th-grade IRT theta scores, a mathematical trans- formation of the standardized test score that is designed to reflect change over time. The 8th-grade IRT theta score was controlled in all analysis such that the true outcome was actually gains in math or science achievement between the 8th and 10th grades.
Student-level controls. Student background characteristics included (1) socioeconomic status (SES), a composite score of parents' educa- tional levels, occupations, and family income; (2) racial background, or a dummy variable identifying students as African American, Hispanic, or Native American versus white or Asian; and (3) gender.
Program track was controlled in all the analyses to distinguish the effects of track placement, as an indicator of OTL, from the effects of variation within tracks in OTL. Three dummy variables indicating general track, vocational track, and academic track were constructed from stu- dents' transcripts or, when data were missing from transcripts, from stu- dents' self-reports.
School expenditures. The finance variable was measured at the school- district level because financial data are not available at the school level. School-district expenditures are not an exact estimate of money available at the school level because they are differentially allocated across schools within a district according to the needs of individual schools. To make district-level expenditures more rep- resentative of the financial resources available to individual schools within districts, differential need across schools was controlled in all the analyses. Differential need was mea- sured by the school administrator's report of the percentage of students eligible for free lunch, the percentage of students receiving special educa-
tional services, and the percentage of students of limited English proficien- cy (LEP).4
The measure of school-district expenditures includes costs of instruction (particularly teachers' salaries), staff support services (including staff development), and student support services, but excludes costs related to administra- tion, operation and maintenance, transportation of students, and food service (see NCES 1995 for a com- plete explication of this measure).5 The expenditure variable and the "need" variables are weighted by the McMahon index of the cost of living (1996) at the county level to correct for geographic variations in what money can buy and what the special needs of students cost. The expendi- ture variable was then transformed into per-pupil-level measures to con- trol for differences in the size of school districts.
School-level controls. School controls include the school adminis- trator's report of the student compo- sition of the school (mentioned earli- er), as well as school size and whether or not the school is located in an urban area.
OTL within the 10th-grade math or science classroom. OTL within the classroom consists of the qualifi- cations of the classroom teacher, class size, the pedagogical strategies used by the teacher, and classroom resources. Teachers' qualifications were measured by (1) teacher's educa- tional background,6 a variable that indicates the teacher's major and minor subject areas in undergradu- ate- and graduate-degree programs (when applicable), and (2) teacher's experience, a variable that indicates years of teaching at the elementary or secondary levels. Virtually all the teachers (99 percent) were certified in math or science, so teacher certifica- tion was not included. Class size is
This content downloaded from 195.34.79.192 on Tue, 24 Jun 2014 20:31:17 PMAll use subject to JSTOR Terms and Conditions
230 Elliott
the teacher's report of the number of students in the given math or science class the sampled student was taking.
The measures of teachers' emphases on specific skills are scales of equally weighted items con- structed from teachers' reports of the emphasis they give to different types of math or science instruction.7 For math, the scales include emphases on higher-order thinking skills and the relevance of math, while those for science include emphases on inquiry skills and the relevance of science. Math teachers were also asked how much emphasis they put on memo- rizing facts and speedy computation.
Classroom resources were mea- sured by the availability and condi- tion of subject-specific equipment. Only the science teachers were asked about the quality and availability of science equipment. Math teachers were asked how frequently they used calculators and computers in the classroom, a proxy of the availability of equipment in the math classroom.
Methods
I used hierarchical linear model- ing (HLM) to estimate school-level intercepts of students' achievement. Math and science achievement were estimated with a series of equations in which sets of variables were added in the following sequence: (1) eighth- grade achievement and student-level controls, (2) expenditures and school-level controls, (3) teachers' qualifications and class size, and (4) teaching emphases and classroom resources. Equation 1 estimates a baseline model of students' achieve- ment at the student level, while Equation 2 estimates the effect of expenditures on achievement, net of student- and school-level controls. Equation 3 estimates the effects on achievement of teachers' background and class size, net of expenditures.
Any reduction or loss of significance in the funding variable is interpreted as the mediating effect between expenditures and achievement of teachers' background and class size; for example, if money is spent on hir- ing relatively educated teachers, stu- dents will learn more. Equation 4 adds direct measures of the class- room learning environment in terms of what the teachers emphasize and the types of equipment that are avail- able and used in the classroom. Any further reduction or loss of signifi- cance in the funding variable is interpreted as the mediating effect between expenditures and achieve- ment of the classroom learning envi- ronment; for instance, if money is spent on technical resources like computers, students will learn more.
HLM is used to control for the clustering of students with shared characteristics into the same schools (Bryk and Raudenbush 1992). It also offers the opportunity to test cross- level effects, such as the effect of funding practices on the relationship between students' characteristics and students' achievement within schools. For example, HLM allows a test of the effect of expenditures on the within-school relationship between SES and achievement. The effects of students' background on achievement may depend, in part, on financial resources because schools with more money may be better able to meet the needs of all students.
RESULTS
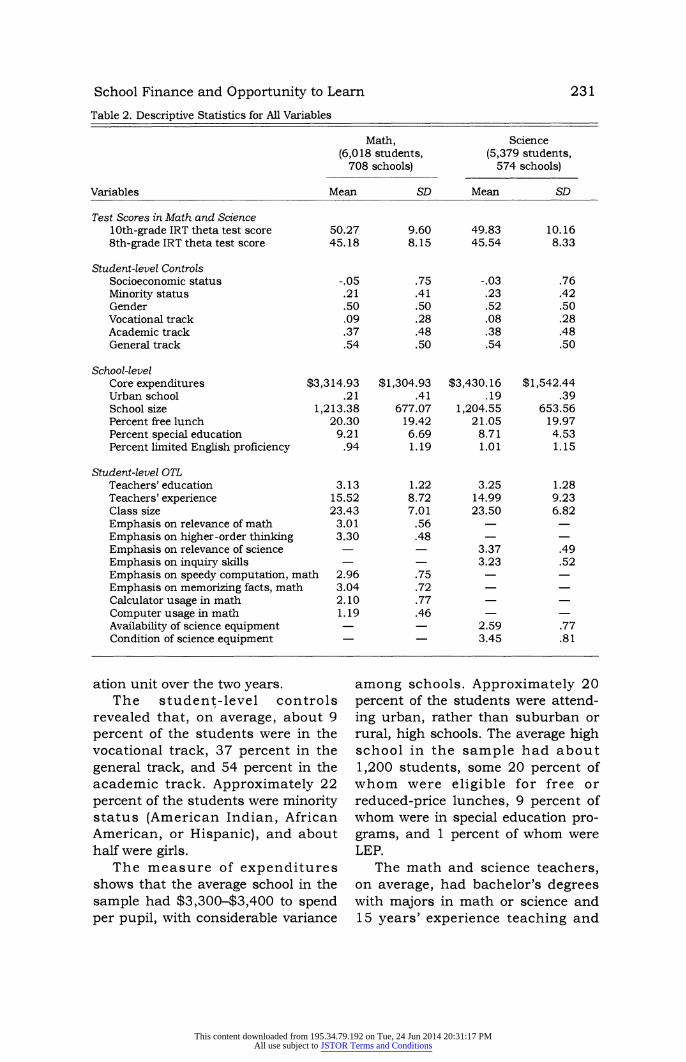
Table 2 presents descriptive sta- tistics of all the variables separately for the math and science subsam- ples. In both math and science, stan- dardized test scores were four to five points higher in the 10th grade than in the 8th, indicating that, on aver- age, the students' performance improved about half a standard devi-
This content downloaded from 195.34.79.192 on Tue, 24 Jun 2014 20:31:17 PMAll use subject to JSTOR Terms and Conditions
School Finance and Opportunity to Learn 231 Table 2. Descriptive Statistics for All Variables
Math, Science (6,018 students, (5,379 students,
708 schools) 574 schools)
Variables Mean SD Mean SD
Test Scores in Math and Science 10th-grade IRT theta test score 50.27 9.60 49.83 10.16 8th-grade IRT theta test score 45.18 8.15 45.54 8.33
Student-level Controls Socioeconomic status -.05 .75 -.03 .76 Minority status .21 .41 .23 .42 Gender .50 .50 .52 .50 Vocational track .09 .28 .08 .28 Academic track .37 .48 .38 .48 General track .54 .50 .54 .50
School-level Core expenditures $3,314.93 $1,304.93 $3,430.16 $1,542.44 Urban school .21 .41 .19 .39 School size 1,213.38 677.07 1,204.55 653.56 Percent free lunch 20.30 19.42 21.05 19.97 Percent special education 9.21 6.69 8.71 4.53 Percent limited English proficiency .94 1.19 1.01 1.15
Student-level OTL Teachers' education 3.13 1.22 3.25 1.28 Teachers' experience 15.52 8.72 14.99 9.23 Class size 23.43 7.01 23.50 6.82 Emphasis on relevance of math 3.01 .56 Emphasis on higher-order thinking 3.30 .48 Emphasis on relevance of science 3.37 .49 Emphasis on inquiry skills 3.23 .52 Emphasis on speedy computation, math 2.96 .75 Emphasis on memorizing facts, math 3.04 .72 Calculator usage in math 2.10 .77 Computer usage in math 1.19 .46 Availability of science equipment 2.59 .77 Condition of science equipment 3.45 .81
ation unit over the two years. The student-level controls
revealed that, on average, about 9 percent of the students were in the vocational track, 37 percent in the general track, and 54 percent in the academic track. Approximately 22 percent of the students were minority status (American Indian, African American, or Hispanic), and about half were girls.
The measure of expenditures shows that the average school in the sample had $3,300-$3,400 to spend per pupil, with considerable variance
among schools. Approximately 20 percent of the students were attend- ing urban, rather than suburban or rural, high schools. The average high school in the sample had about 1,200 students, some 20 percent of whom were eligible for free or reduced-price lunches, 9 percent of whom were in special education pro- grams, and 1 percent of whom were LEP.
The math and science teachers, on average, had bachelor's degrees with majors in math or science and 15 years' experience teaching and
This content downloaded from 195.34.79.192 on Tue, 24 Jun 2014 20:31:17 PMAll use subject to JSTOR Terms and Conditions
232 Elliott
Table 3. Zero-Order Coorelations with Per-Pupil Core Expenditures and 10th-Grade Test Scores
Math, Science (6,318 students, (5,379 students,
708 schools) 574 schools)
Variables Per-pupil IRT Test, Per-pupil IRT Test Dollars 10th Grade Dollars 10th Grade
Test Scores in Math and Science 10th-grade IRT theta test score .099*** .1 15*** 8th-grade IRT theta test score .070*** .852*** .087*** .71 1***
Student-level Controls Socioeconomic status .160*** .408*** .179*** .429*** Minority status .041*** -.289*** -.031** -.290*** Gender .015 -.010 .005 -.138*** Vocational track -.010 -. 190*** -.057*** -.201 *** Academic track -.007 .230*** .046*** .194*** General track .013 -.115*** -.013 -.077***
School-level Controls Urban school .056*** -.076*** .069*** -.078*** School size .106*** .008 -.015 -.041*** Percent free lunch -.101*** -.215*** -. 186*** -.221*** Percent special education .105*** -.017 .042*** -.049*** Percent limited English proficiency .196*** -.018 .099*** -.093***
Student-level OTL Teachers' education .061*** .181*** .111*** Teachers' experience .142*** .122*** .140*** .1 17*** Class size -.068*** .064*** .152*** .012 Emphasis on relevance of math -.052*** -.048*** -.139*** Emphasis on higher-order thinking .068*** .330*** Emphasis on relevance of science -.066*** Emphasis on inquiry skills -.034** .175*** Emphasis on speedy computation, math -.001 -.059*** .010 Emphasis on memorizing facts, math -.048*** -.040*** Calculator usage in math -. 126*** .176*** Computer usage in math .026** -.051*** Availability of science equipment .1 91** .186*** Condition of science equipment .146*** .185***
***p < .005, ***p < .05.
certification in their fields. The class- rooms had an average of 23 stu- dents. The average math teacher put a "moderate" emphasis on higher- order thinking skills, the relevance of math, speedy computation, and memorizing facts, while the average science teacher placed a "moderate" emphasis on inquiry skills and the relevance of science. On average, the math teachers reported using calcu- lators "sometimes" and computers "never," whereas the science teachers reported that the ratio of students to
equipment was 1-3:1 and the condi- tion of the equipment was fair to good.
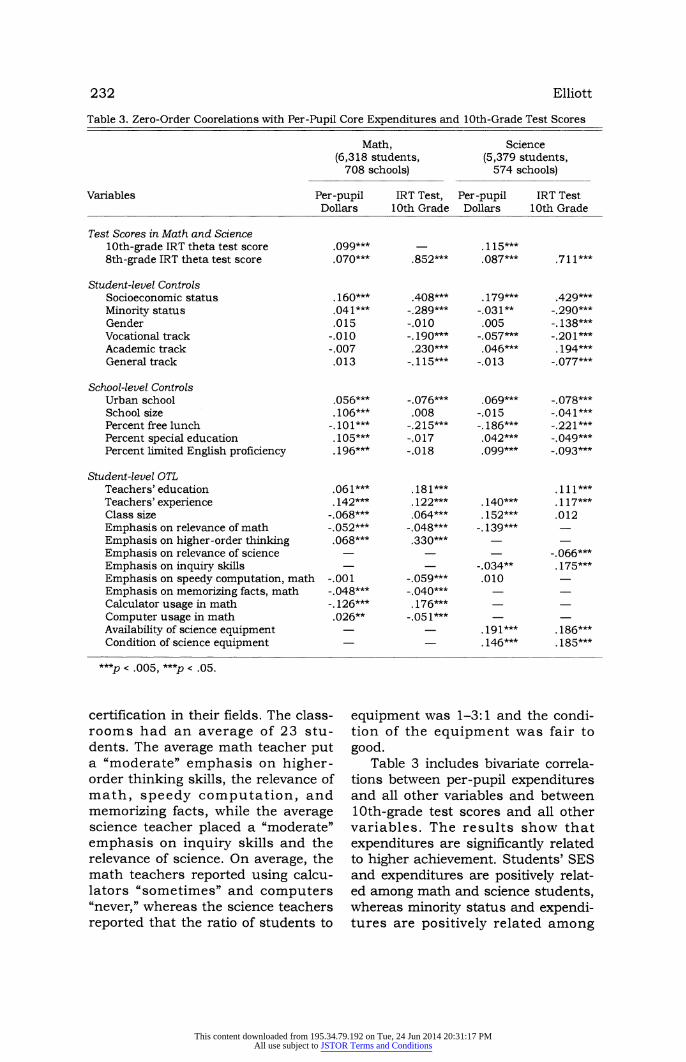
Table 3 includes bivariate correla- tions between per-pupil expenditures and all other variables and between 10th-grade test scores and all other variables. The results show that expenditures are significantly related to higher achievement. Students' SES and expenditures are positively relat- ed among math and science students, whereas minority status and expendi- tures are positively related among
This content downloaded from 195.34.79.192 on Tue, 24 Jun 2014 20:31:17 PMAll use subject to JSTOR Terms and Conditions
School Finance and Opportunity to Learn 233
math students and negatively related among science students. Expendi- tures are negatively related to being in the vocational track and positively related to being in the academic track, among science students only.
At the school level, the bivariate correlations indicate that more money is spent per pupil in urban schools, in larger schools (for math but not for science), and in schools with larger proportions of students in special education program or who are LEP. However, less money is spent in schools where more stu- dents qualify for free lunches.
Expenditures correlate significant- ly with most measures of OTL. More money is spent in schools where the teachers tend to be more educated and more experienced, classes tend to be smaller, teachers tend to put a greater emphasis on higher-order thinking in math, to make greater use of computers in math, and to have greater access to science equip- ment in good condition. In schools where less money is spent, classes tend to be larger and teachers are more likely to emphasize the rele- vance of math and science and mem- orizing facts in math and to make greater use of calculators.
With regard to the bivariate corre- lations with 10th-grade achievement, achievement is strongly correlated between the 8th- and 10th grades, especially in math, although sub- stantial variation remains to be explained. Students of higher SES perform better and minority students perform worse in math and science, but only in science do girls perform more poorly than boys. Placement in the vocational track or general track is negatively related to achievement, whereas placement in the academic track is positively related.
In urban schools and in schools where more students qualify for free lunches, achievement tends to be
lower. School size, percentage of stu- dents in special education, and per- centage of LEP students are negative- ly related to achievement among sci- ence students.
Teachers' education and experi- ence are positively related to achieve- ment, as is placing a stronger emphasis on higher-order thinking and a lesser emphasis on the rele- vance of math or science, speedy computation skills, or the memoriza- tion of facts in math. Students whose math classes are relatively larger tend to achieve more between the 8th and 10th grades. The use of calcula- tors in math and the availability and condition of equipment in science are all positively related to achievement, whereas computer usage in math is negatively related to achievement.
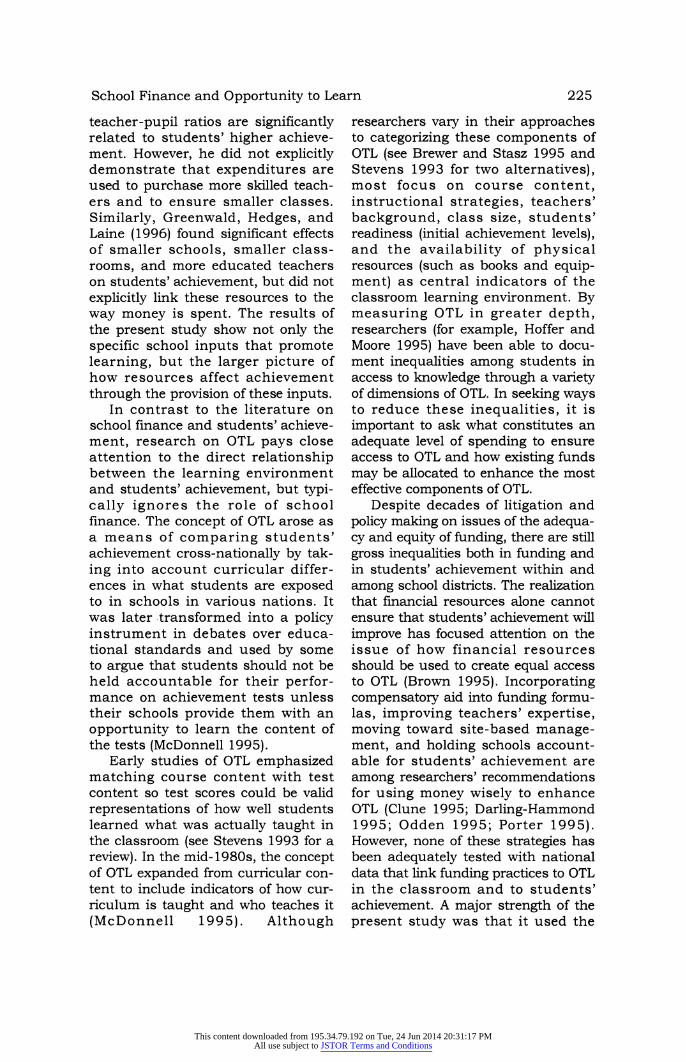
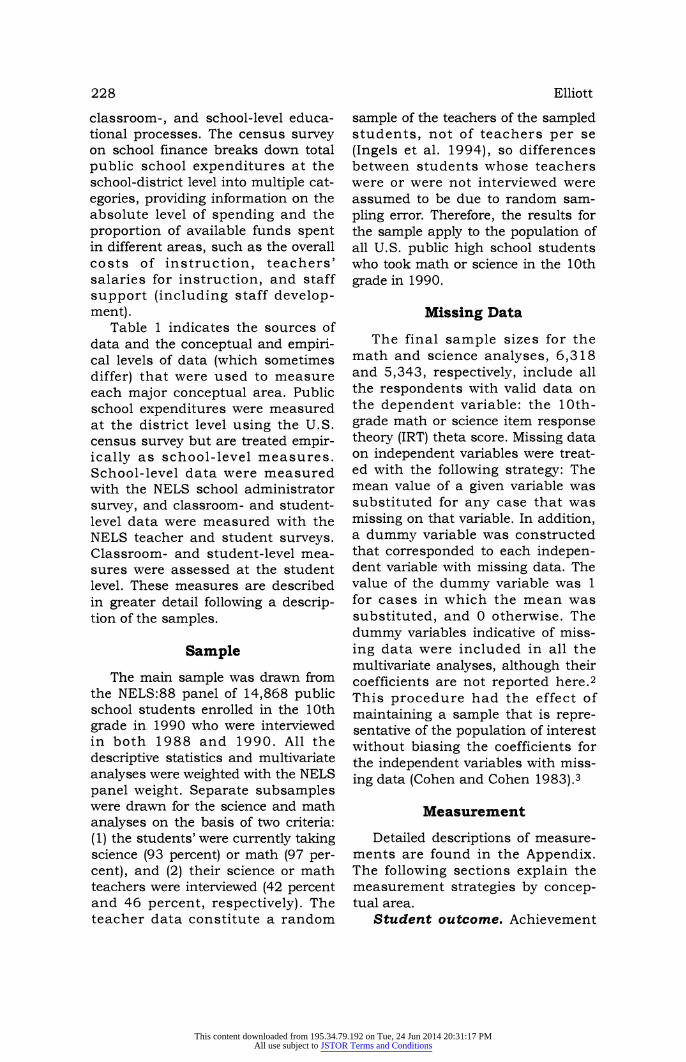
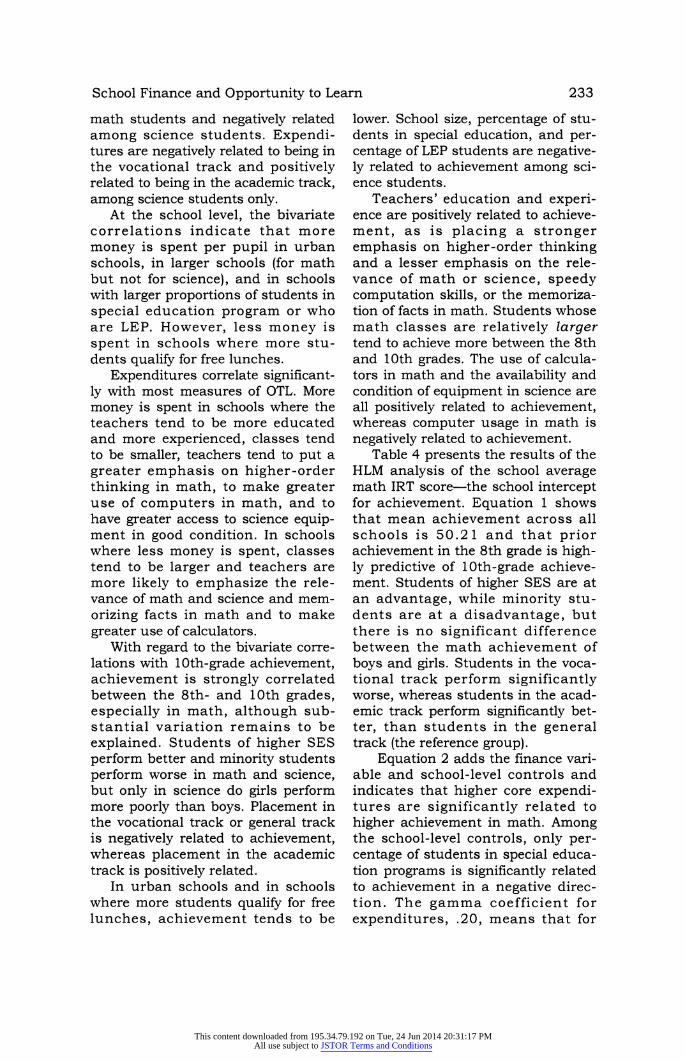
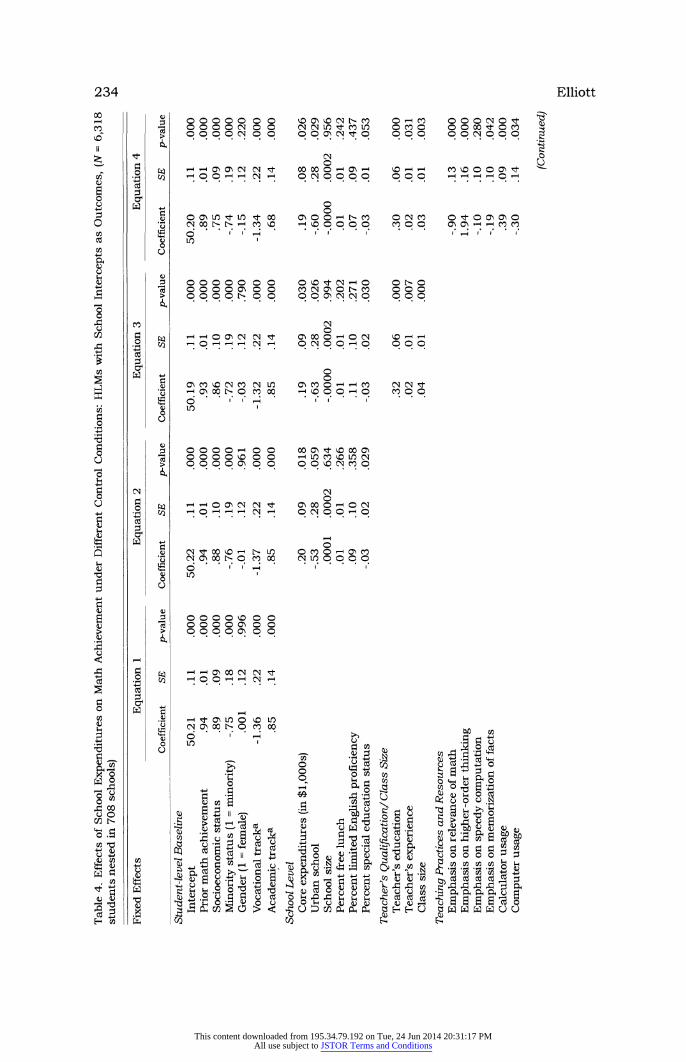
Table 4 presents the results of the HLM analysis of the school average math IRT score-the school intercept for achievement. Equation 1 shows that mean achievement across all schools is 50.21 and that prior achievement in the 8th grade is high- ly predictive of 10th-grade achieve- ment. Students of higher SES are at an advantage, while minority stu- dents are at a disadvantage, but there is no significant difference between the math achievement of boys and girls. Students in the voca- tional track perform significantly worse, whereas students in the acad- emic track perform significantly bet- ter, than students in the general track (the reference group).
Equation 2 adds the finance vari- able and school-level controls and indicates that higher core expendi- tures are significantly related to higher achievement in math. Among the school-level controls, only per- centage of students in special educa- tion programs is significantly related to achievement in a negative direc- tion. The gamma coefficient for expenditures, .20, means that for
This content downloaded from 195.34.79.192 on Tue, 24 Jun 2014 20:31:17 PMAll use subject to JSTOR Terms and Conditions
234 EClliott
r_ O o o o o o o o
sc CO s N t- m
o 4 m o o o
CN o t_e
cl N o o soo csin t_ m in o cl o o o co t_ o n
s i O O O O N O O O O O 0 C~
N It- O O O O O O N O O O
O *O Csl~~~~C 00 CN 1Y 00 00 s) 0~ 1-4 Oc Oc O O Cn O t_
t ~ ~~~~~ : O LO O_ in O _ O O N O 0 -4 t- m O ON cl O _0
0 N 00 - t- co C c Cs 0 0 oo ? cl 0 Cs Cs C~
g . t .~~NH oNooHo ollo >~~~~C LO=
0 ; Onsc sI sc
CY) C;
o CN 0 CN 0 o 0 0 0 0
E~~~~~~C CY) tc CN CY) C N LO o, CY o. CY) o
A~~~~~~~C 00 t- o Y 0~ Y n Q mesH b n onoLO
'i c obono sI 0 * ~ ~ , ~ .,
0 o 0 0- In 0 0| t-~ 0
CN U CO N 0 .d 0 oo~
v) .s C~ CN CN It- o ~ 00 In
1~~~~~~C It 0 Uc '- 2LO 0 CY t C$ CY
u u A Q e E oC~ 0 t- 0 CY:t i8) 00 CN LO E; 0 0
6 4ztttgO> oD
This content downloaded from 195.34.79.192 on Tue, 24 Jun 2014 20:31:17 PMAll use subject to JSTOR Terms and Conditions
School Finance and Opportunity to Learn 235
00 LO CN,
Cd
cq
C-0 0 0
C.) cq 4)
7S I>
C 00 UI) W
CY) cd
'cu 1-4 Lf)
o u C.) cq 00 Lf)
>1 coq"
CN cd 7 cd 00
0 U) S 4
0
u 40-,
C, 0
cq 4-4 > 0
> 0
0 0
00 Lf) 0 4 64 UU)
00
0 0
u
4-4 cq 0 0 .0 w
C.) 144.
0
u
co 0 11
78 cq It
s 4
4> V)
0 0 .45C
C/) C/)
This content downloaded from 195.34.79.192 on Tue, 24 Jun 2014 20:31:17 PMAll use subject to JSTOR Terms and Conditions
236 Elliott
each additional $1,000 spent per pupil, the school mean achievement will rise by .20 points between the 8th and 10th grades. Though signifi- cant, this effect appears small. However, it is impressive that a sig- nificant effect emerges at all, given that the data on expenditures are measured at the district level, the result of which is to underestimate the true effect of financial resources on achievement. If the data on expenditures more closely reflected the actual resources purchased and made available to each student in the classroom, one would expect to see a much larger effect.
In Equation 3, the effects of teachers' qualifications and class size are tested. The results show that the students who tend to achieve higher scores in the 10th grade have more educated and experienced teachers and tend to be in relatively larger math classes. The effect of expendi- tures reduces slightly between Equations 2 and 3, indicating that a small proportion of it is explained by the allocation of financial resources to teachers' salaries.8
Equation 4 adds the indicators of teaching effectiveness and classroom resources. The results show that stu- dents learn more when teachers place a greater emphasis on higher- order thinking and a lesser emphasis on the relevance of math and on the memorization of facts. They also show that the use of calculators appears to improve math achieve- ment, whereas the use of computers tends to decrease it. The effect of core expenditures remains signifi- cant in Equation 4, suggesting that although teaching methods and classroom resources affect math per- formance, they are not primary path- ways through which expenditures translate into greater learning. Therefore, these findings do not pro- vide support for either the teaching-
effectiveness or the classroom- resources hypothesis.
The positive effect of class size remains significant in Equation 4, suggesting that irrespective of teach- ing methods or classroom resources, students' math performance benefits from being in a large classroom. Given the counterintuitive nature of this finding, I examined the relation- ship between class size and achieve- ment within schools more closely, paying special attention to the pover- ty status of each school. The reason- ing was that high-poverty schools may reduce class size in an attempt to improve achievement, but smaller classrooms, in and of themselves, may not be sufficient to bring the scores of students in high-poverty schools up to the level of students in relatively low-poverty schools. Thus, the apparent positive effect of class size may reflect, in part, an unmea- sured selection effect of extremely disadvantaged students into smaller classrooms.
To test the effect of school poverty status on the relationship between class size and achievement, I added a cross-level interaction between per- centage of students eligible for free lunches (hereafter percent free lunch) and class size to Equation 4 (results not shown). The effect of percent free lunch on the relationship between class size and achievement was sig- nificant: When percent free lunch is equal to zero, the effect of class size is .025, meaning that each additional student in the class increases stu- dents' achievement by .025 points. However, for each 1 percent increase in the poverty level of a school, the positive effect of class size decreased by .001. Thus, when 25 percent of the students are eligible for free lunches, the effect of class size becomes zero, and when 50 percent of the students are eligible for free lunches, the effect is -.025. In sum,
This content downloaded from 195.34.79.192 on Tue, 24 Jun 2014 20:31:17 PMAll use subject to JSTOR Terms and Conditions
School Finance and Opportunity to Learn 237
larger class size benefits students' achievement only in science when a school's level of poverty is very low.
Cross-level interactions between expenditures and the effects of stu- dent controls on achievement were tested, but none was found to be sig- nificant. In other words, the within- school relationships between stu- dents' characteristics and students' achievement appear to be constant across various levels of expenditures.
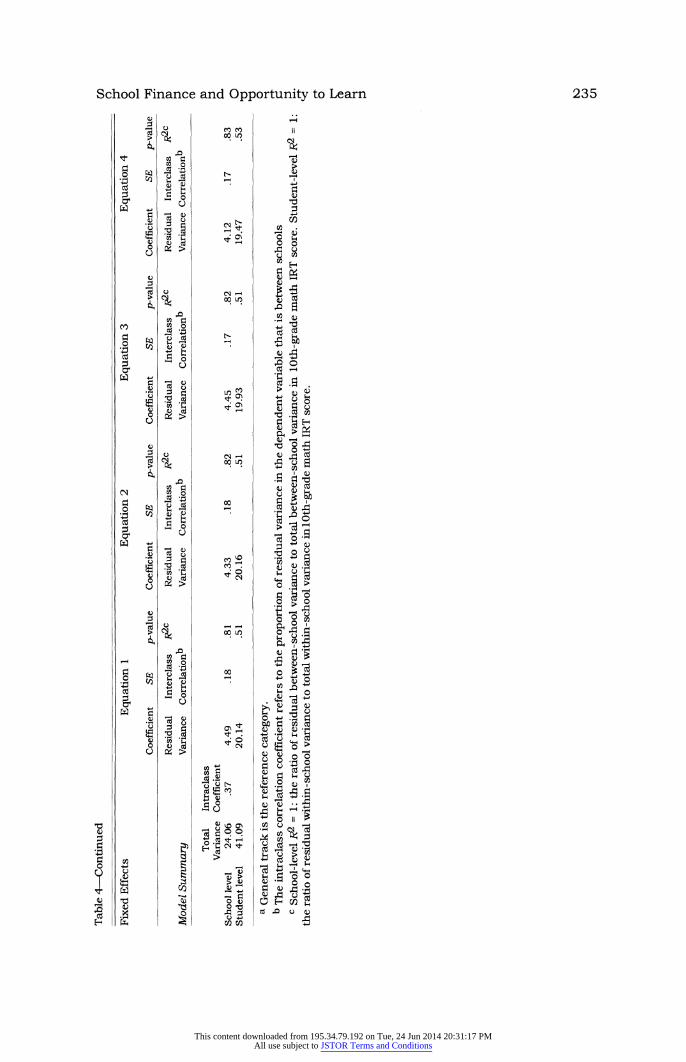
The intraclass coefficient shown in the lower left corner of Table 4 under Model Summary indicates that 37 percent of the unconditional vari- ance in students' test scores is between schools. However, after baseline test scores and expenditures are controlled, the residual between- school variance is reduced to 18 per- cent of the total residual variance. The R2 results show that 81 percent of the between-school variance and 51 percent of the within-school vari- ance are accounted for by Equation 1. Further inspection (results not shown) revealed that 8th-grade achievement was responsible for the bulk of the explained variance. Moving across the four equations, there are small but not remarkable increases in R2. This observation underlines the fact that the models that were tested place high demands on the independent variables to demonstrate significant effects, since they must demonstrate a significant change in test scores between the 8th and 10th grades.
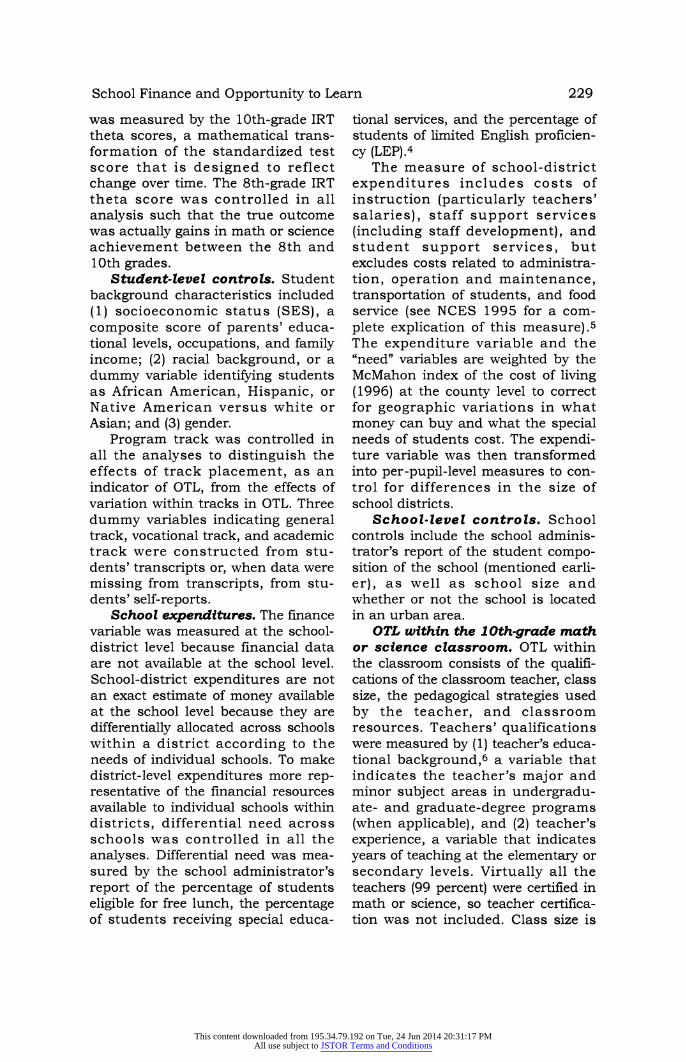
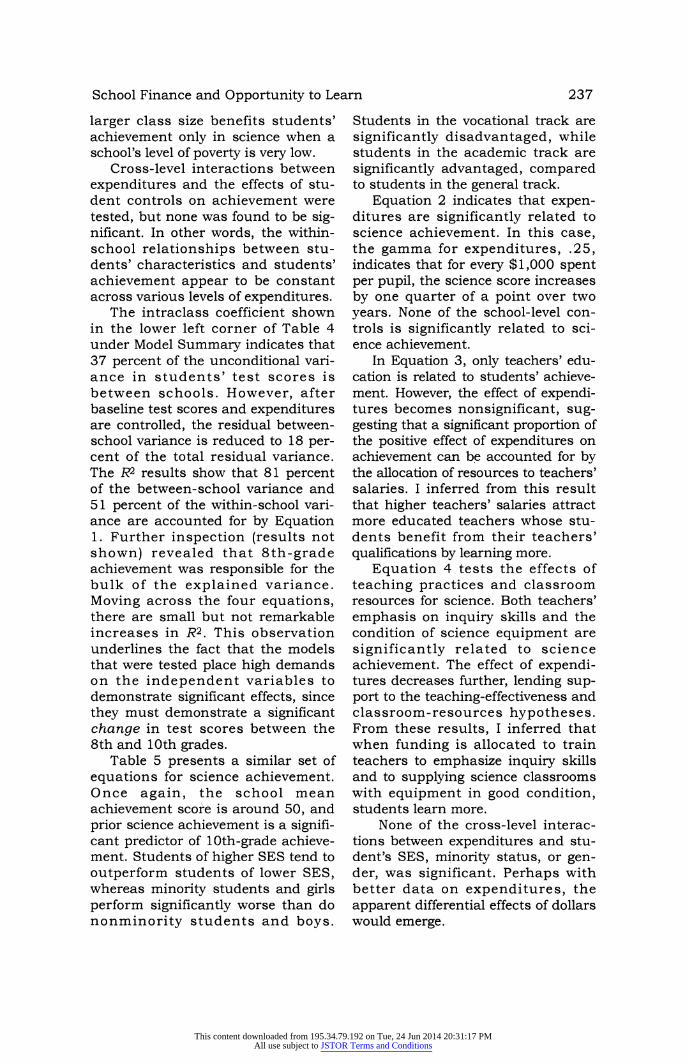
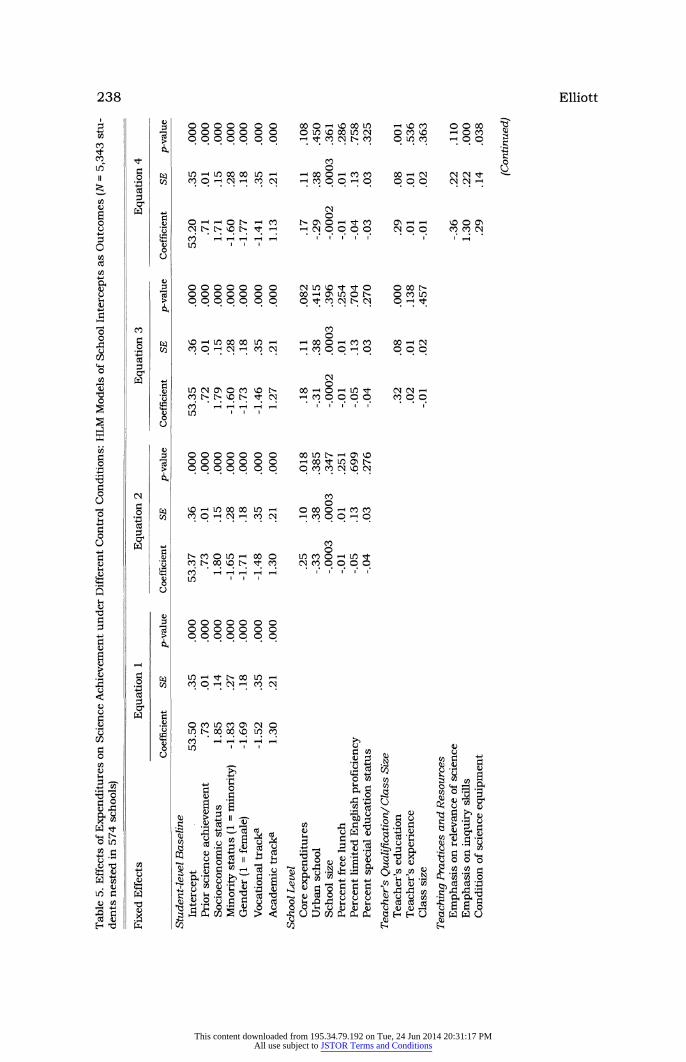
Table 5 presents a similar set of equations for science achievement. Once again, the school mean achievement score is around 50, and prior science achievement is a signifi- cant predictor of 10th-grade achieve- ment. Students of higher SES tend to outperform students of lower SES, whereas minority students and girls perform significantly worse than do nonminority students and boys.
Students in the vocational track are significantly disadvantaged, while students in the academic track are significantly advantaged, compared to students in the general track.
Equation 2 indicates that expen- ditures are significantly related to science achievement. In this case, the gamma for expenditures, .25, indicates that for every $1,000 spent per pupil, the science score increases by one quarter of a point over two years. None of the school-level con- trols is significantly related to sci- ence achievement.
In Equation 3, only teachers' edu- cation is related to students' achieve- ment. However, the effect of expendi- tures becomes nonsignificant, sug- gesting that a significant proportion of the positive effect of expenditures on achievement can be accounted for by the allocation of resources to teachers' salaries. I inferred from this result that higher teachers' salaries attract more educated teachers whose stu- dents benefit from their teachers' qualifications by learning more.
Equation 4 tests the effects of teaching practices and classroom resources for science. Both teachers' emphasis on inquiry skills and the condition of science equipment are significantly related to science achievement. The effect of expendi- tures decreases further, lending sup- port to the teaching-effectiveness and classroom-resources hypotheses. From these results, I inferred that when funding is allocated to train teachers to emphasize inquiry skills and to supplying science classrooms with equipment in good condition, students learn more.
None of the cross-level interac- tions between expenditures and stu- dent's SES, minority status, or gen- der, was significant. Perhaps with better data on expenditures, the apparent differential effects of dollars would emerge.
This content downloaded from 195.34.79.192 on Tue, 24 Jun 2014 20:31:17 PMAll use subject to JSTOR Terms and Conditions
238 Elliott
, : o o o o o o o o0 0 o o r- sc oo In ~c co 0 o o o 2~~~~~~ 0 o o o o o o o n oc 00 L oo 0 o nc 0 o
n ~~~~~~~ 0 o o o o o t co N t- co
o n CO 0 o,o
o 000Ln -1 L C o C o Ln -1 00 0 1c e 0- cN cN cN lqt -
u~~~~~~~c .i --- C
, N -1 ce
N 1- m
o, o, -
o, o o o N N ---
O~~~~~~~~~~~~e t- o~ 0 -- l oqt ce CO ~ c 0 s O Q 'i; ~~~CN t- - sc - qt -1 N Cf o o O CN O O ce ce CN
C? O~~~~L C) 0
;~~~~~~C C) o ) o ) o ) o O OO N LO s t- t- o O 00 Q~~~~~~C C) oooo O) O) C)o 0no - C O0t- O
8~~~~~~~~~~ Ci C, o, o, o, o ~ oll Ol Oi Ct n t:
0 C n
X~~~ ~~~~e .i --- C
, N -1 ce N ce )
o, o, )
o, o, o,o Wo~~~~~~~ .
C? : ~~~~~O O ON O Oe Oc O- 0 -1 C - O lq s C o~~~~~~~e t- o - o o - o - o o o) C) ) C) c C
B i o oo o o o o nn n c
'i;~~~~~ 0 0 oo 0 ce) ce oN o oo Q ~ ~ ~ ~~~ . . . . . . . . . . . .
B O O | | |~~~~~~~~~~~~~~~~~e t Q~~~~~~~~~~~~~~C U ~ ~~~~~~ -1 ooooooo) C 0 ) -Ice e
2~~~~~~c C) oooo oe oN c)C )
8 LO
Q .t ~~~~~o qt In 00 LO
X~~~~~C CO d O CO CN , C ) 8uieO
Q~~~~~~L t- 00 00 c L o goe) tt niC
This content downloaded from 195.34.79.192 on Tue, 24 Jun 2014 20:31:17 PMAll use subject to JSTOR Terms and Conditions
School Finance and Opportunity to Learn 239
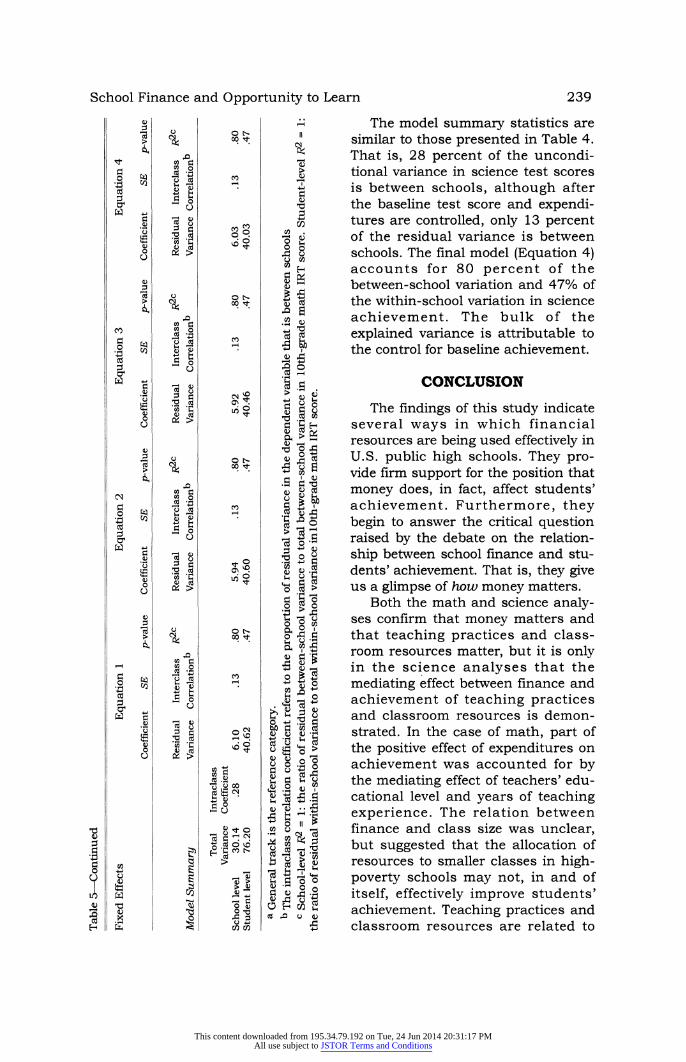
The model summary statistics are similar to those presented in Table 4. That is, 28 percent of the uncondi- tional variance in science test scores is between schools, although after the baseline test score and expendi- tures are controlled, only 13 percent of the residual variance is between schools. The final model (Equation 4) accounts for 80 percent of the between-school variation and 47% of the within-school variation in science achievement. The bulk of the explained variance is attributable to the control for baseline achievement.
CONCLUSION
The findings of this study indicate several ways in which financial resources are being used effectively in U.S. public high schools. They pro- vide firm support for the position that money does, in fact, affect students' achievement. Furthermore, they begin to answer the critical question raised by the debate on the relation- ship between school finance and stu- dents' achievement. That is, they give us a glimpse of how money matters.
Both the math and science analy- ses confirm that money matters and that teaching practices and class- room resources matter, but it is only in the science analyses that the mediating effect between finance and achievement of teaching practices and classroom resources is demon- strated. In the case of math, part of the positive effect of expenditures on achievement was accounted for by the mediating effect of teachers' edu- cational level and years of teaching experience. The relation between finance and class size was unclear, but suggested that the allocation of resources to smaller classes in high- poverty schools may not, in and of itself, effectively improve students' achievement. Teaching practices and classroom resources are related to
C-)
W 0~~~~~~~~~~~~~~~s 0 ~ ~ ~ ~ 0
0 o
W 0
~~~ 0 ~ ~ 00
U
0
Lc ec 00
ON s
,0
Q~~~ 0 ~ ~
0~~~~~~~
W 0~~~
0 ~~~~~ >a~
4) ~~~~~) 04) 0> c~~~ .~~~~ 0~~~ CU 0 H~~~~~~~~ - P
This content downloaded from 195.34.79.192 on Tue, 24 Jun 2014 20:31:17 PMAll use subject to JSTOR Terms and Conditions

240 Elliott
math achievement, but do not medi- ate the positive relationship between finance and achievement.
In the case of science, the results supported both hypotheses, provid- ing strong evidence that how money is spent affects what takes place in the classroom, which, in turn, affects students' learning. In addition to hir- ing more educated teachers, money can be used to train teachers to emphasize inquiry skills and to pur- chase an adequate amount of science equipment in relatively good condi- tion. One reason why the pathway from expenditures to achievement is more readily explained in science than in math may be that there is more variation in science achieve- ment than in math achievement between the 8th and 10th grades. Another reason may be that science is a more difficult subject to convey to secondary students than is math because it requires thinking skills that are relatively underdeveloped. Therefore, science performance may be more dependent on the pathway through which money improves the classroom learning environment than is math performance.
The research examined achieve- ment in math and science, rather than achievement in English or his- tory, for two reasons. First, it was expected that math and science achievement are more dependent on what is taught in school than are English and history achievement, thereby improving the likelihood of establishing school effects. Second, math and science instruction are arguably more dependent on capital- intensive equipment (such as micro- scopes) than are English and history instruction. Hence, the effectiveness of their instruction may be more dependent on available resources.
Future research in this area should continue to trace the pathways through which funding patterns make
learning possible in science and math as well as in other subjects. However, there is still no single national data set that contains measures of school finance, OTL, and student outcomes. This study was an innovative attempt to link two data sets to create a national sample of school finance, OTL, and student achievement data. Nonetheless, it is not ideal, since data on expenditures are measured at the district level and then adjusted for school need. Hence, future national surveys that combine data at the stu- dent, classroom, and school levels should expand their coverage to include school- and classroom-level measures of school finance.
Furthermore, data on finances should be collected on the proportion of funds allocated to various needs so it will be possible to ascertain directly the effects of how money is spent. Finally, a sampling design in which entire classrooms of students are selected should be considered, so classroom effects can be modeled as a separate level.
The implications of this research for educational policy are not straight- forward. Although the results make a case for using school resources to hire more educated math and science teachers, they also indicate that access to educated teachers alone does not explain why some students learn more than do others. To ensure high student achievement, math and science teachers must also use effec- tive teaching strategies. The results of this study indicate that teachers who emphasize higher-order thinking and inquiry skills and who de-emphasize the memorization of facts and the everyday relevance of math have more successful students. In other words, money must be allocated not only for hiring high-quality teachers, but for helping those teachers use the most effective strategies in their math and science classrooms.
This content downloaded from 195.34.79.192 on Tue, 24 Jun 2014 20:31:17 PMAll use subject to JSTOR Terms and Conditions
School Finance and Opportunity to Learn 241
APPENDIX
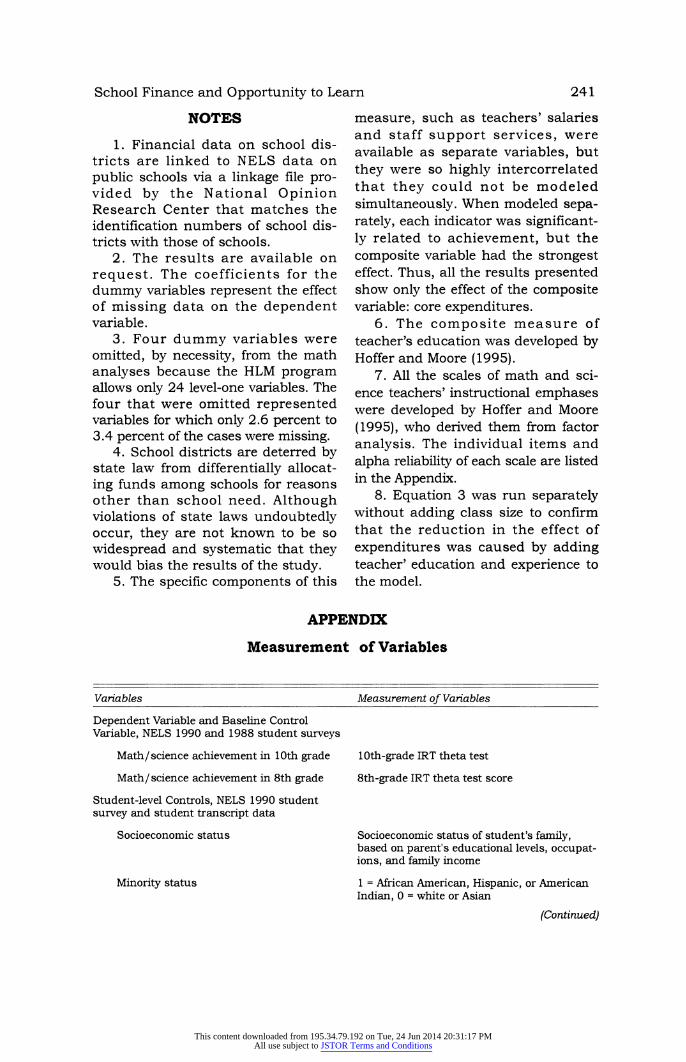
Measurement of Variables
Variables Measurement of Variables
Dependent Variable and Baseline Control Variable, NELS 1990 and 1988 student surveys
Math/science achievement in 10th grade 10th-grade IRT theta test
Math/science achievement in 8th grade 8th-grade IRT theta test score
Student-level Controls, NELS 1990 student survey and student transcript data
Socioeconomic status Socioeconomic status of student's family, based on parent's educational levels, occupat- ions, and family income
Minority status 1 = African American, Hispanic, or American Indian, 0 = white or Asian
(Continued)
NOTES
1. Financial data on school dis- tricts are linked to NELS data on public schools via a linkage file pro- vided by the National Opinion Research Center that matches the identification numbers of school dis- tricts with those of schools.
2. The results are available on request. The coefficients for the dummy variables represent the effect of missing data on the dependent variable.
3. Four dummy variables were omitted, by necessity, from the math analyses because the HLM program allows only 24 level-one variables. The four that were omitted represented variables for which only 2.6 percent to 3.4 percent of the cases were missing.
4. School districts are deterred by state law from differentially allocat- ing funds among schools for reasons other than school need. Although violations of state laws undoubtedly occur, they are not known to be so widespread and systematic that they would bias the results of the study.
5. The specific components of this
measure, such as teachers' salaries and staff support services, were available as separate variables, but they were so highly intercorrelated that they could not be modeled simultaneously. When modeled sepa- rately, each indicator was significant- ly related to achievement, but the composite variable had the strongest effect. Thus, all the results presented show only the effect of the composite variable: core expenditures.
6. The composite measure of teacher's education was developed by Hoffer and Moore (1995).
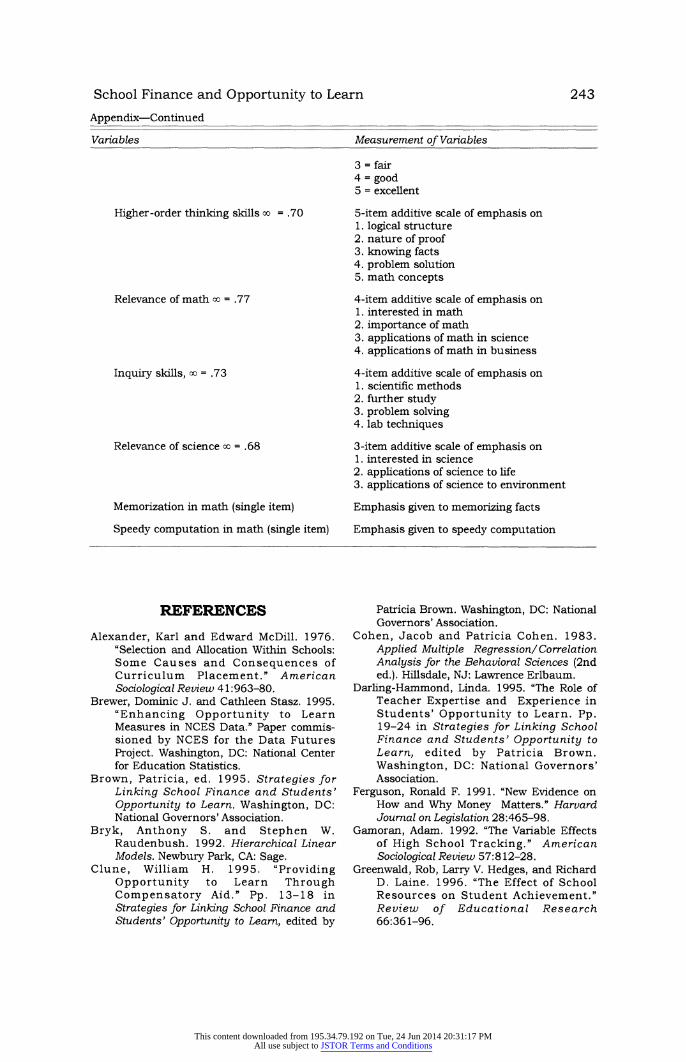
7. All the scales of math and sci- ence teachers' instructional emphases were developed by Hoffer and Moore (1995), who derived them from factor analysis. The individual items and alpha reliability of each scale are listed in the Appendix.
8. Equation 3 was run separately without adding class size to confirm that the reduction in the effect of expenditures was caused by adding teacher' education and experience to the model.
This content downloaded from 195.34.79.192 on Tue, 24 Jun 2014 20:31:17 PMAll use subject to JSTOR Terms and Conditions
242 Elliott
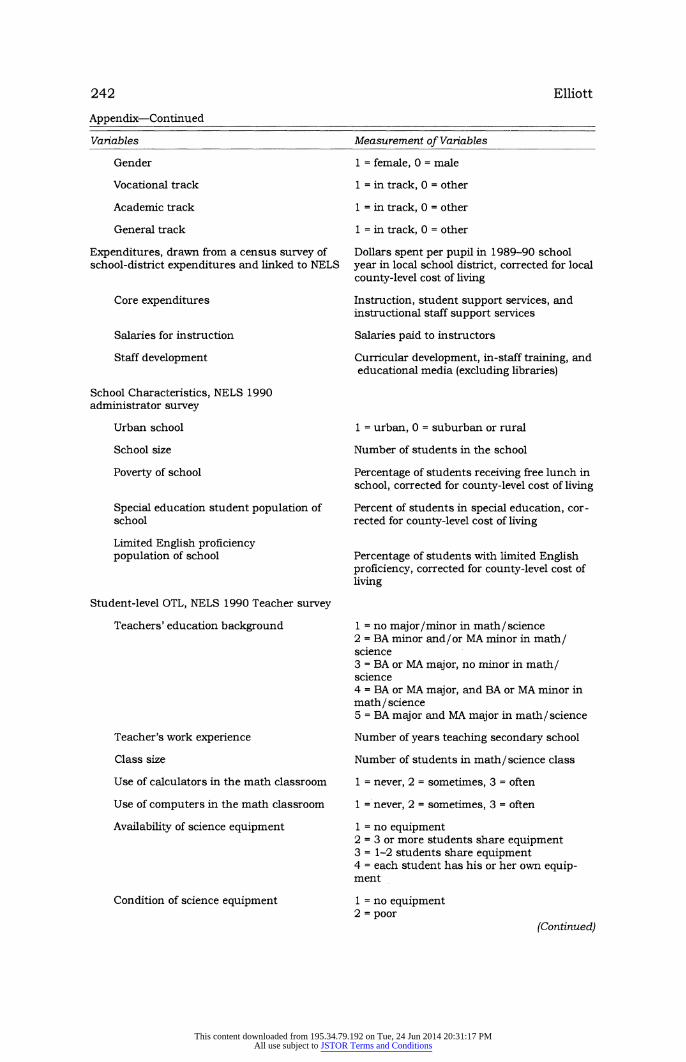
Appendix-Continued
Variables Measurement of Variables
Gender 1 = female, 0 = male
Vocational track 1 = in track, 0 = other
Academic track 1 = in track, 0 = other
General track 1 = in track, 0 = other
Expenditures, drawn from a census survey of Dollars spent per pupil in 1989-90 school school-district expenditures and linked to NELS year in local school district, corrected for local
county-level cost of living
Core expenditures Instruction, student support services, and instructional staff support services
Salaries for instruction Salaries paid to instructors
Staff development Curricular development, in-staff training, and educational media (excluding libraries)
School Characteristics, NELS 1990 administrator survey
Urban school 1 = urban, 0 = suburban or rural
School size Number of students in the school
Poverty of school Percentage of students receiving free lunch in school, corrected for county-level cost of living
Special education student population of Percent of students in special education, cor- school rected for county-level cost of living
Limited English proficiency population of school Percentage of students with limited English
proficiency, corrected for county-level cost of living
Student-level OTL, NELS 1990 Teacher survey
Teachers' education background 1 = no major/minor in math/science 2 = BA minor and/or MA minor in math/ science 3 = BA or MA major, no minor in math/ science 4 = BA or MA major, and BA or MA minor in math/science 5 = BA major and MA major in math/science
Teacher's work experience Number of years teaching secondary school
Class size Number of students in math/science class
Use of calculators in the math classroom 1 = never, 2 = sometimes, 3 = often
Use of computers in the math classroom 1 = never, 2 = sometimes, 3 = often
Availability of science equipment 1 = no equipment 2 = 3 or more students share equipment 3 = 1-2 students share equipment 4 = each student has his or her own equip- ment
Condition of science equipment 1 = no equipment 2 = poor
(Continued)
This content downloaded from 195.34.79.192 on Tue, 24 Jun 2014 20:31:17 PMAll use subject to JSTOR Terms and Conditions
School Finance and Opportunity to Learn 243
Appendix-Continued
Variables Measurement of Variables
3 = fair 4 = good 5 = excellent
Higher-order thinking skills oo = .70 5-item additive scale of emphasis on 1. logical structure 2. nature of proof 3. knowing facts 4. problem solution 5. math concepts
Relevance of math oc = .77 4-item additive scale of emphasis on 1. interested in math 2. importance of math 3. applications of math in science 4. applications of math in business
Inquiry skills, oc = .73 4-item additive scale of emphasis on 1. scientific methods 2. further study 3. problem solving 4. lab techniques
Relevance of science oc = .68 3-item additive scale of emphasis on 1. interested in science 2. applications of science to life 3. applications of science to environment
Memorization in math (single item) Emphasis given to memorizing facts
Speedy computation in math (single item) Emphasis given to speedy computation
REFERENCES Alexander, Karl and Edward McDill. 1976.
"Selection and Allocation Within Schools: Some Causes and Consequences of Curriculum Placement." American Sociological Review 41:963-80.
Brewer, Dominic J. and Cathleen Stasz. 1995. "Enhancing Opportunity to Learn Measures in NCES Data." Paper commis- sioned by NCES for the Data Futures Project. Washington, DC: National Center for Education Statistics.
Brown, Patricia, ed. 1995. Strategies for Linking School Finance and Students' Opportunity to Learn. Washington, DC: National Governors' Association.
Bryk, Anthony S. and Stephen W. Raudenbush. 1992. Hierarchical Linear Models. Newbury Park, CA: Sage.
Clune, William H. 1995. "Providing Opportunity to Learn Through Compensatory Aid." Pp. 13-18 in Strategies for Linking School Finance and Students' Opportunity to Learn, edited by
Patricia Brown. Washington, DC: National Governors' Association.
Cohen, Jacob and Patricia Cohen. 1983. Applied Multiple Regression/Correlation Analysis for the Behavioral Sciences (2nd ed.). Hillsdale, NJ: Lawrence Erlbaum.
Darling-Hammond, Linda. 1995. "The Role of Teacher Expertise and Experience in Students' Opportunity to Learn. Pp. 19-24 in Strategies for Linking School Finance and Students' Opportunity to Learn, edited by Patricia Brown. Washington, DC: National Governors' Association.
Ferguson, Ronald F. 1991. "New Evidence on How and Why Money Matters." Harvard Joumal on Legislation 28:465-98.
Gamoran, Adam. 1992. "The Variable Effects of High School Tracking." American Sociological Review 57:812-28.
Greenwald, Rob, Larry V. Hedges, and Richard D. Laine. 1996. "The Effect of School Resources on Student Achievement." Review of Educational Research 66:361-96.
This content downloaded from 195.34.79.192 on Tue, 24 Jun 2014 20:31:17 PMAll use subject to JSTOR Terms and Conditions
244 Elliott
Marta Elliott, Ph.D., is Assistant Professor, Department of Sociology, University of Nevada, Reno. Her main fields of interest are social psychology and health and social inequality in schooling. She is currently researching the social psychology of health inequalities in urban Nevada.
The author thanks Joyce Epstein, William Fowler, Will Jordan, Nancy Karweit, James McPartland, Jeffrey Owings, Steven Plank, and Michael Ross for their input to this project. The research was supported by NSF Grant RED-9452861 from the American Educational Research Association, which receives funds for its AERA Grants Program from the National Science Foundation and the National Center for Education Statistics (U.S. Department of Education); OERI Grant R-1 1 7-D40005 from the Center for Education of Students Placed at Risk;
Hallinan, Maureen T. 1994. "School Differences in Tracking Effects on Achievement." Social Forces 72:799-820.
Hanushek, Eric A. 1989a. "The Impact of Differential Expenditures on School Performance." Educational Researcher 18:45-51.
. 1989b. "Throwing Money at Schools." Journal of Policy Analysis and Management 1: 19-41.
_. 1991. "When School Finance 'Reform' May Not Be Good Policy." Harvard Joumal on Legislation 28:423-56.
-. 1994. "Money Might Matter Somewhere: A Response to Hedges, Laine, and Greenwald." Educational Researcher 23:5-8. 1996a. "A More Complete Picture of School Resource Policies." Review of Educational Research 66:397-409.
. 1996b. "School Resources and Student Performance." Pp. 43-73 in Does Money Matter? The Effect of School Resources on Student Achievement and Adult Success, edited by G. Burtless. Washington, DC: Brookings Institution.
Hedges, Larry V. and Rob Greenwald. 1996. "Have Times Changed? The Relation between School Resources and Student Performance." Pp. 74-92 in Does Money Matter? The Effect of School Resources on Student Achievement and Adult Success, edited by G. Burtless. Washington, DC: Brookings Institution.
Hedges, Larry V., Richard D. Laine, and Rob Greenwald. 1994. "Does Money Matter? A Meta-Analysis of Studies of the Effects of Differential School Inputs on Student Outcomes." Educational Researcher 23:5-14.
Hoffer, Thomas and Whitney Moore. 1995. High-School Seniors' Instructional Experiences in Science and Mathematics. Chicago: National Opinion Research Center.
Ingels, Steven J., Kathryn L.Dowd, John D.
Baldridge, James L. Stipe, Virginia H. Bartot, and Martin R. Frankel. 1994. National Education Longitudinal Study of 1988 Second Follow-Up: Student Component Data File User's Manual. Washington, DC: U.S. Department of Education.
Kubitschek, Warren N. and Maureen T. Hallinan. 1996. "Race, Gender, and Inequity in Track Assignments." Research in Sociology of Education and Socialization 11:121-46.
McDonnell, Lorraine M. 1995. "Opportunity to Learn as a Research Concept and a Policy Instrument." Educational Evaluation and Policy Analysis 17:305-22.
McMahon, Walter W. 1996. 'Intrastate Cost Adjustments." Pp. 89-114 in Selected Papers in School Finance 1994, edited by W. J. Fowler, Jr. Washington, DC: National Center for Education Statistics.
National Center for Education Statistics. 1995. Disparities in Public School District Spending 1989-90 (NCES Statistical Analysis Report 95-300). Washington, DC: U.S. Department of Education.
Oakes, Jeannie. 1985. Keeping Track: How Schools Structure Inequality. New Haven, CT: Yale University Press.
Odden, Allan R. 1995. "School-Based Financing and Opportunity to Learn." Pp. 25-30 in Strategies for Linking School Finance and Students' Opportunity to Learn, edited by Patricia Brown. Washington, DC: National Governors' Association.
Porter, Andrew C. 1995. "Guaranteeing Good Instruction." Pp. 37-41 in Strategies for Linking School Finance and Students' Opportunity to Learn, edited by Patricia Brown. Washington, DC: National Governors' Association.
Stevens, Floraline I. 1993. Opportunity to Learn: Issues of Equity for Poor and Minority Students. Washington, DC: U.S. Department of Education.
This content downloaded from 195.34.79.192 on Tue, 24 Jun 2014 20:31:17 PMAll use subject to JSTOR Terms and Conditions
School Finance and Opportunity to Learn 245
and NSF Grant RED-9353581 from the National Science Foundation. The opin- ions expressed in this article are the author's and do not necessarily reflect those of the granting agencies. Address all correspondence to Dr. Marta Elliott, Department of Sociology, College of Arts and Sciences, University of Nevada, Reno, NV 89557-0067, or by E-mail at melliott(unr.edu.
This content downloaded from 195.34.79.192 on Tue, 24 Jun 2014 20:31:17 PMAll use subject to JSTOR Terms and Conditions