school district no. 6 (rocky mountain) · the board of education of school district no. 6 (rocky...
TRANSCRIPT

Audited Financial Statements of
School District No. 6 (Rocky Mountain)
June 30, 2016
September 13, 2016 15:56
School District No. 6 (Rocky Mountain)June 30, 2016
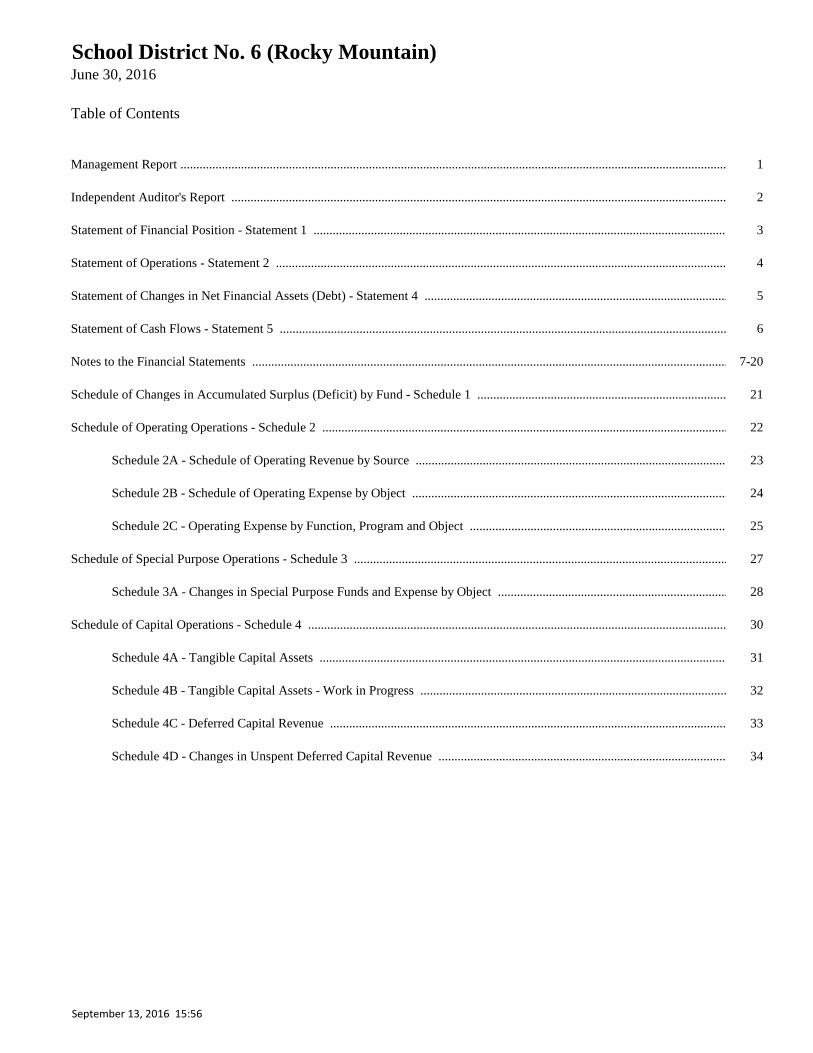
Table of Contents
Management Report ...........................................................................................................................................................................................1
Independent Auditor's Report ...........................................................................................................................................................................................2
Statement of Financial Position - Statement 1 ...........................................................................................................................................................................................3
Statement of Operations - Statement 2 ...........................................................................................................................................................................................4
Statement of Changes in Net Financial Assets (Debt) - Statement 4 ...........................................................................................................................................................................................5
Statement of Cash Flows - Statement 5 ...........................................................................................................................................................................................6
Notes to the Financial Statements ...........................................................................................................................................................................................7-20
Schedule of Changes in Accumulated Surplus (Deficit) by Fund - Schedule 1 ...........................................................................................................................................................................................21
Schedule of Operating Operations - Schedule 2 ...........................................................................................................................................................................................22
Schedule 2A - Schedule of Operating Revenue by Source ...........................................................................................................................................................................................23
Schedule 2B - Schedule of Operating Expense by Object ...........................................................................................................................................................................................24
Schedule 2C - Operating Expense by Function, Program and Object ...........................................................................................................................................................................................25
Schedule of Special Purpose Operations - Schedule 3 ...........................................................................................................................................................................................27
Schedule 3A - Changes in Special Purpose Funds and Expense by Object ...........................................................................................................................................................................................28
Schedule of Capital Operations - Schedule 4 ...........................................................................................................................................................................................30
Schedule 4A - Tangible Capital Assets ..................................................................................................................................................................................31
Schedule 4B - Tangible Capital Assets - Work in Progress ...........................................................................................................................................................................................32
Schedule 4C - Deferred Capital Revenue ...........................................................................................................................................................................................33
Schedule 4D - Changes in Unspent Deferred Capital Revenue ...........................................................................................................................................................................................34
September 13, 2016 15:56
School District No. 6 (Rocky Mountain)
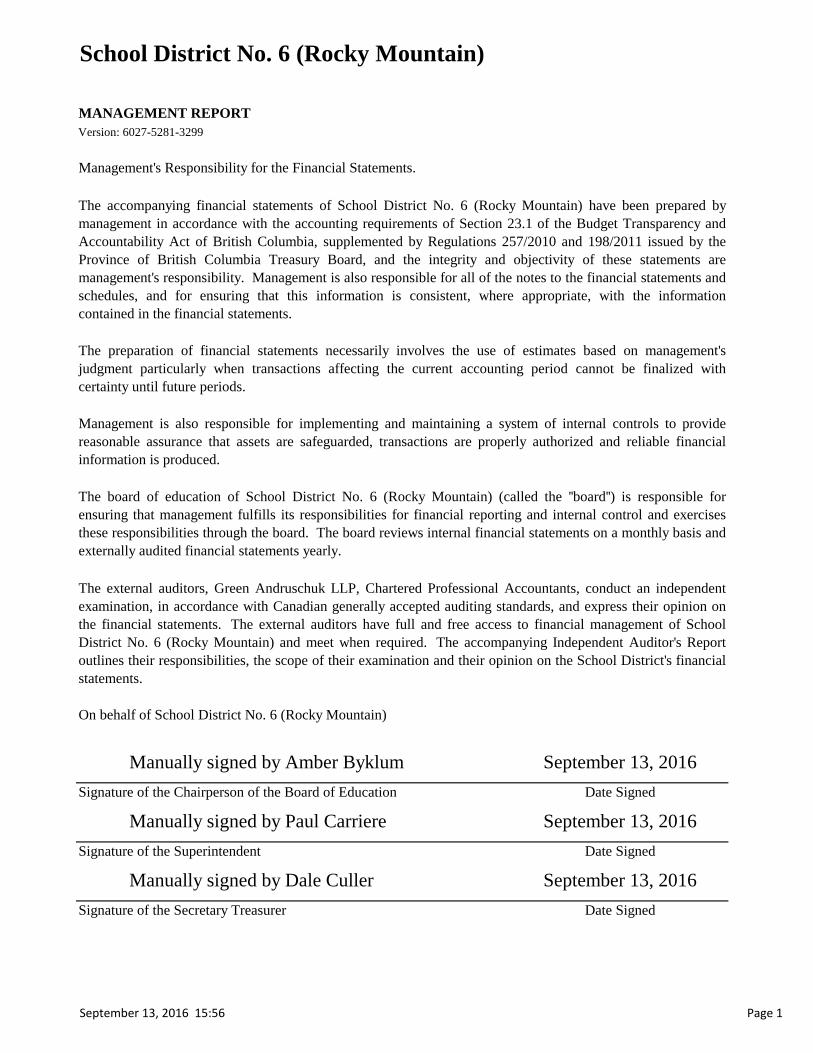
MANAGEMENT REPORT
Management's Responsibility for the Financial Statements.
On behalf of School District No. 6 (Rocky Mountain)
Signature of the Chairperson of the Board of Education
Signature of the Superintendent
Signature of the Secretary Treasurer
Version: 6027-5281-3299
The external auditors, Green Andruschuk LLP, Chartered Professional Accountants, conduct an independent
examination, in accordance with Canadian generally accepted auditing standards, and express their opinion on
the financial statements. The external auditors have full and free access to financial management of School
District No. 6 (Rocky Mountain) and meet when required. The accompanying Independent Auditor's Report
outlines their responsibilities, the scope of their examination and their opinion on the School District's financial
statements.
Date Signed
Date Signed
Date Signed
The accompanying financial statements of School District No. 6 (Rocky Mountain) have been prepared by
management in accordance with the accounting requirements of Section 23.1 of the Budget Transparency and
Accountability Act of British Columbia, supplemented by Regulations 257/2010 and 198/2011 issued by the
Province of British Columbia Treasury Board, and the integrity and objectivity of these statements are
management's responsibility. Management is also responsible for all of the notes to the financial statements and
schedules, and for ensuring that this information is consistent, where appropriate, with the information
contained in the financial statements.
Management is also responsible for implementing and maintaining a system of internal controls to provide
reasonable assurance that assets are safeguarded, transactions are properly authorized and reliable financial
information is produced.
The preparation of financial statements necessarily involves the use of estimates based on management's
judgment particularly when transactions affecting the current accounting period cannot be finalized with
certainty until future periods.
The board of education of School District No. 6 (Rocky Mountain) (called the ''board'') is responsible for
ensuring that management fulfills its responsibilities for financial reporting and internal control and exercises
these responsibilities through the board. The board reviews internal financial statements on a monthly basis and
externally audited financial statements yearly.
Manually signed by Amber Byklum September 13, 2016
Manually signed by Paul Carriere September 13, 2016
Manually signed by Dale Culler September 13, 2016
Page 1 September 13, 2016 15:56


Statement 1
2016 2015
Actual Actual
$ $
Financial Assets
Cash and Cash Equivalents 4,831,169 5,774,731
Accounts Receivable
Due from Province - Ministry of Education 631,791 31,616
Due from LEA/Direct Funding 33,973 56,824
Other (Note 3) 268,755 161,813
Portfolio Investments (Note 4) 3,235,255 3,232,309
Total Financial Assets 9,000,943 9,257,293
Liabilities
Accounts Payable and Accrued Liabilities
Due to Province - Ministry of Education 2,519
Other (Note 5) 2,872,452 2,978,188
Unearned Revenue (Note 6) 948,628 498,649
Deferred Revenue (Note 7) 1,452,048 1,374,608
Deferred Capital Revenue (Note 8) 32,242,417 32,075,774
Employee Future Benefits (Note 9) 662,119 616,438
Capital Lease Obligations (Note 10) 496,785
Total Liabilities 38,674,449 37,546,176
Net Financial Assets (Debt) (29,673,506) (28,288,883)
Non-Financial Assets
Tangible Capital Assets (Note 11) 58,483,176 56,972,465
Restricted Assets (Endowments) (Note 13) 105,873 105,873
Prepaid Expenses 10,501 96,214
Total Non-Financial Assets 58,599,550 57,174,552
Accumulated Surplus (Deficit) 28,926,044 28,885,669
Manually signed by Amber Byklum
Signature of the Chairperson of the Board of Education
Manually signed by Paul Carriere
Signature of the Superintendent
Manually signed by Dale Culler
Signature of the Secretary Treasurer
School District No. 6 (Rocky Mountain)Statement of Financial Position
As at June 30, 2016
Date Signed
Date Signed
Date Signed
Contractual Obligations and Contingencies
Approved by the Board
September 13, 2016
September 13, 2016
September 13, 2016
The accompanying notes are an integral part of these financial statements.Version: 6027-5281-3299
September 13, 2016 15:56 Page 3
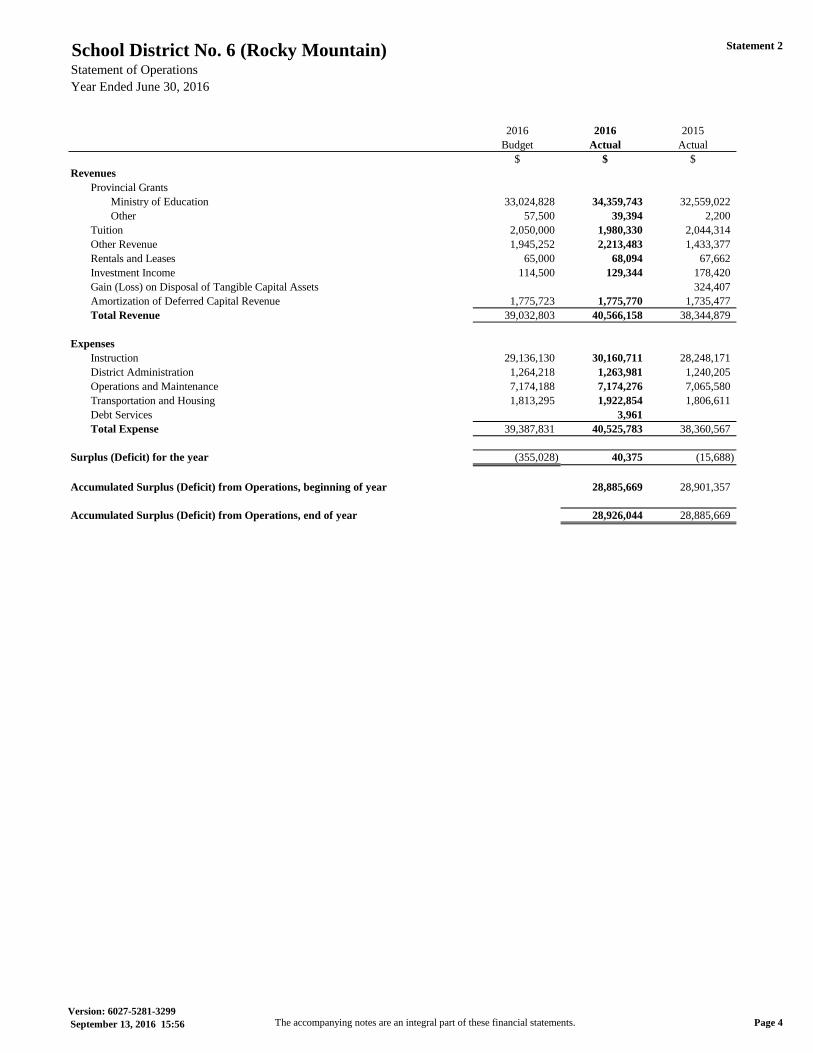
Statement 2
2016 2016 2015
Budget Actual Actual
$ $ $
Revenues
Provincial Grants
Ministry of Education 33,024,828 34,359,743 32,559,022
Other 57,500 39,394 2,200
Tuition 2,050,000 1,980,330 2,044,314
Other Revenue 1,945,252 2,213,483 1,433,377
Rentals and Leases 65,000 68,094 67,662
Investment Income 114,500 129,344 178,420
Gain (Loss) on Disposal of Tangible Capital Assets 324,407
Amortization of Deferred Capital Revenue 1,775,723 1,775,770 1,735,477
Total Revenue 39,032,803 40,566,158 38,344,879
Expenses
Instruction 29,136,130 30,160,711 28,248,171
District Administration 1,264,218 1,263,981 1,240,205
Operations and Maintenance 7,174,188 7,174,276 7,065,580
Transportation and Housing 1,813,295 1,922,854 1,806,611
Debt Services 3,961
Total Expense 39,387,831 40,525,783 38,360,567
Surplus (Deficit) for the year (355,028) 40,375 (15,688)
Accumulated Surplus (Deficit) from Operations, beginning of year 28,885,669 28,901,357
Accumulated Surplus (Deficit) from Operations, end of year 28,926,044 28,885,669
School District No. 6 (Rocky Mountain)Statement of Operations
Year Ended June 30, 2016
The accompanying notes are an integral part of these financial statements.Version: 6027-5281-3299
September 13, 2016 15:56 Page 4

Statement 4
2016 2016 2015
Budget Actual Actual
$ $ $
Surplus (Deficit) for the year (355,028) 40,375 (15,688)
Effect of change in Tangible Capital Assets
Acquisition of Tangible Capital Assets (2,336,770) (4,295,731) (3,404,541)
Amortization of Tangible Capital Assets 2,791,517 2,785,020 2,653,161
Net carrying value of Tangible Capital Assets disposed of 104,023
Total Effect of change in Tangible Capital Assets 454,747 (1,510,711) (647,357)
Acquisition of Prepaid Expenses (10,501) (96,214)
Use of Prepaid Expenses 96,214 94,835
Total Effect of change in Other Non-Financial Assets - 85,713 (1,379)
(Increase) Decrease in Net Financial Assets (Debt),
before Net Remeasurement Gains (Losses) 99,719 (1,384,623) (664,424)
Net Remeasurement Gains (Losses)
(Increase) Decrease in Net Financial Assets (Debt) (1,384,623) (664,424)
Net Financial Assets (Debt), beginning of year (28,288,883) (27,624,459)
Net Financial Assets (Debt), end of year (29,673,506) (28,288,883)
School District No. 6 (Rocky Mountain)Statement of Changes in Net Financial Assets (Debt)
Year Ended June 30, 2016
The accompanying notes are an integral part of these financial statements.Version: 6027-5281-3299
September 13, 2016 15:56 Page 5

Statement 5
2016 2015
Actual Actual
$ $
Operating Transactions
Surplus (Deficit) for the year 40,375 (15,688)
Changes in Non-Cash Working Capital
Decrease (Increase)
Accounts Receivable (684,266) 417,502
Prepaid Expenses 85,713 (1,379)
Increase (Decrease)
Accounts Payable and Accrued Liabilities (108,255) (833,867)
Unearned Revenue 449,979 (1,366)
Deferred Revenue 77,440 168,771
Employee Future Benefits 45,681 26,737
Loss (Gain) on Disposal of Tangible Capital Assets (324,407)
Amortization of Tangible Capital Assets 2,785,020 2,653,161
Amortization of Deferred Capital Revenue (1,775,770) (1,735,477)
Recognition of Deferred Capital Revenue Spent on Sites (102,413)
Total Operating Transactions 915,917 251,574
Capital Transactions
Tangible Capital Assets Purchased (2,993,393) (3,252,028)
Tangible Capital Assets -WIP Purchased (657,421) (152,513)
District Portion of Proceeds on Disposal 352,626
Capital Lease Purchases (644,917)
Total Capital Transactions (4,295,731) (3,051,915)
Financing Transactions
Capital Revenue Received 1,942,413 914,615
Capital Lease Proceeds 644,917
Capital Lease Payments (148,132)
Total Financing Transactions 2,439,198 914,615
Investing Transactions
Proceeds on Disposal of Portfolio Investments 84,690
Investments in Portfolio Investments (2,946)
Total Investing Transactions (2,946) 84,690
Net Increase (Decrease) in Cash and Cash Equivalents (943,562) (1,801,036)
Cash and Cash Equivalents, beginning of year 5,774,731 7,575,767
Cash and Cash Equivalents, end of year 4,831,169 5,774,731
Cash and Cash Equivalents, end of year, is made up of:
Cash 3,695,572 3,663,526
Cash Equivalents 1,135,597 2,111,205
4,831,169 5,774,731
School District No. 6 (Rocky Mountain)Statement of Cash Flows
Year Ended June 30, 2016
The accompanying notes are an integral part of these financial statements.Version: 6027-5281-3299
September 13, 2016 15:56 Page 6
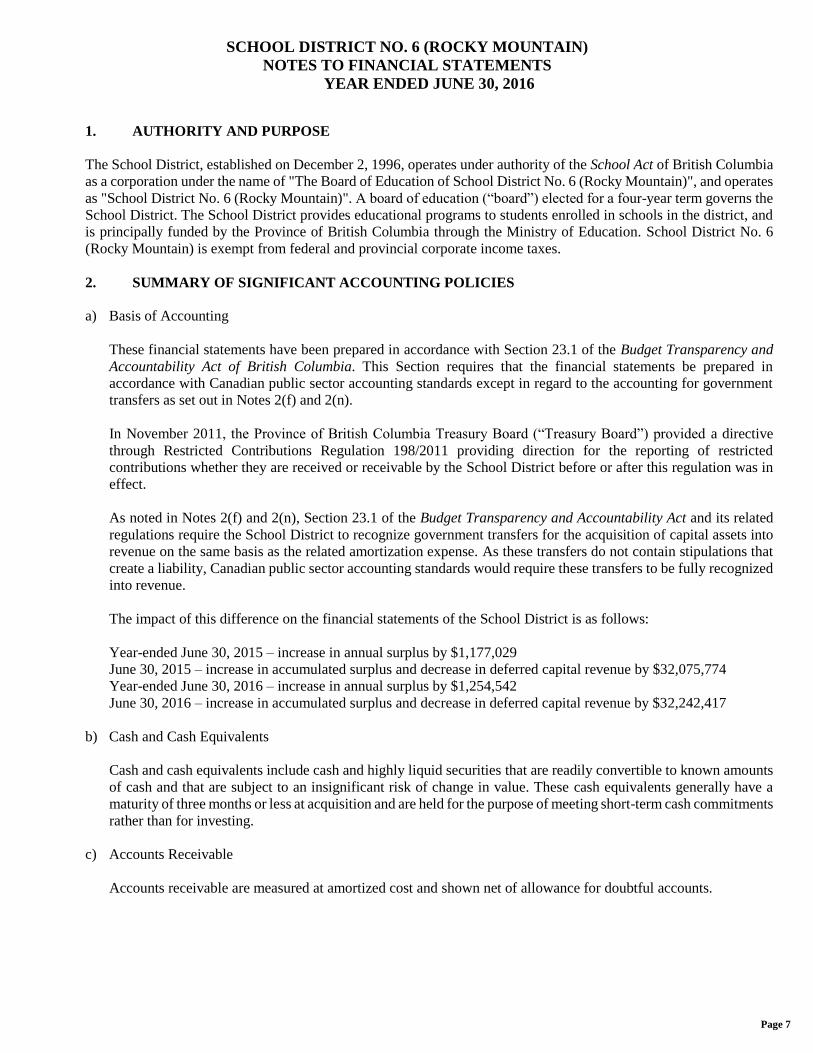
SCHOOL DISTRICT NO. 6 (ROCKY MOUNTAIN)
NOTES TO FINANCIAL STATEMENTS
YEAR ENDED JUNE 30, 2016
Page 7
1. AUTHORITY AND PURPOSE
The School District, established on December 2, 1996, operates under authority of the School Act of British Columbia
as a corporation under the name of "The Board of Education of School District No. 6 (Rocky Mountain)", and operates
as "School District No. 6 (Rocky Mountain)". A board of education (“board”) elected for a four-year term governs the
School District. The School District provides educational programs to students enrolled in schools in the district, and
is principally funded by the Province of British Columbia through the Ministry of Education. School District No. 6
(Rocky Mountain) is exempt from federal and provincial corporate income taxes.
2. SUMMARY OF SIGNIFICANT ACCOUNTING POLICIES
a) Basis of Accounting
These financial statements have been prepared in accordance with Section 23.1 of the Budget Transparency and
Accountability Act of British Columbia. This Section requires that the financial statements be prepared in
accordance with Canadian public sector accounting standards except in regard to the accounting for government
transfers as set out in Notes 2(f) and 2(n).
In November 2011, the Province of British Columbia Treasury Board (“Treasury Board”) provided a directive
through Restricted Contributions Regulation 198/2011 providing direction for the reporting of restricted
contributions whether they are received or receivable by the School District before or after this regulation was in
effect.
As noted in Notes 2(f) and 2(n), Section 23.1 of the Budget Transparency and Accountability Act and its related
regulations require the School District to recognize government transfers for the acquisition of capital assets into
revenue on the same basis as the related amortization expense. As these transfers do not contain stipulations that
create a liability, Canadian public sector accounting standards would require these transfers to be fully recognized
into revenue.
The impact of this difference on the financial statements of the School District is as follows:
Year-ended June 30, 2015 – increase in annual surplus by $1,177,029
June 30, 2015 – increase in accumulated surplus and decrease in deferred capital revenue by $32,075,774
Year-ended June 30, 2016 – increase in annual surplus by $1,254,542
June 30, 2016 – increase in accumulated surplus and decrease in deferred capital revenue by $32,242,417
b) Cash and Cash Equivalents
Cash and cash equivalents include cash and highly liquid securities that are readily convertible to known amounts
of cash and that are subject to an insignificant risk of change in value. These cash equivalents generally have a
maturity of three months or less at acquisition and are held for the purpose of meeting short-term cash commitments
rather than for investing.
c) Accounts Receivable
Accounts receivable are measured at amortized cost and shown net of allowance for doubtful accounts.

SCHOOL DISTRICT NO. 6 (ROCKY MOUNTAIN)
NOTES TO FINANCIAL STATEMENTS
YEAR ENDED JUNE 30, 2016
Page 8
2. SUMMARY OF SIGNIFICANT ACCOUNTING POLICIES
(Continued)
d) Portfolio Investments
The School District has investments in guaranteed investment certificates and term deposits that have a maturity
of greater than three months at the time of acquisition. Guaranteed investment certificates and term deposits not
quoted in an active market are reported at cost.
e) Unearned Revenue
Unearned revenue includes tuition fees received for courses to be delivered in future periods and receipt of
proceeds for services or products to be delivered in a future period. Revenue will be recognized in that future
period when the courses, services, or products are provided.
f) Deferred Revenue and Deferred Capital Revenue
Deferred revenue includes contributions received with stipulations that meet the description of restricted
contributions in the Restricted Contributions Regulation 198/2011 issued by Treasury Board. When restrictions
are met, deferred revenue is recognized as revenue in the fiscal year in a manner consistent with the circumstances
and evidence used to support the initial recognition of the contributions received as a liability as detailed in Note
2(n).
Funding received for the acquisition of depreciable tangible capital assets is recorded as deferred capital revenue
and amortized over the life of the asset acquired as revenue in the statement of operations. This accounting
treatment is not consistent with the requirements of Canadian public sector accounting standards which require
that government transfers be recognized as revenue when approved by the transferor and eligibility criteria have
been met unless the transfer contains a stipulation that creates a liability in which case the transfer is recognized
as revenue over the period that the liability is extinguished. See Note 2(a) for the impact of this policy on these
financial statements.
g) Employee Future Benefits
The School District provides certain post-employment benefits including vested and non-vested benefits for certain
employees pursuant to certain contracts and union agreements. The School District accrues its obligations and
related costs including both vested and non-vested benefits under employee future benefit plans. Benefits include
vested sick leave, accumulating non-vested sick leave, early retirement, retirement/severance, vacation, overtime
and death benefits. The benefits cost is actuarially determined using the projected unit credit method pro-rated on
service and using management’s best estimate of expected salary escalation, termination rates, retirement rates and
mortality. The discount rate used to measure obligations is based on the cost of borrowing. The cumulative
unrecognized actuarial gains and losses are amortized over the expected average remaining service lifetime
(EARSL) of active employees covered under the plan.
The most recent valuation of the obligation was performed at March 31, 2016 and projected to March 31, 2019.
The next valuation will be performed at March 31, 2019 for use at June 30, 2019. For the purposes of determining
the financial position of the plans and the employee future benefit costs, a measurement date of March 31 was
adopted for all periods subsequent to July 1, 2004.
The School District and its employees make contributions to the Teachers’ Pension Plan and Municipal Pension
Plan. The plans are multi-employer plans where assets and obligations are not separated by employer. The costs
are expensed as incurred.

SCHOOL DISTRICT NO. 6 (ROCKY MOUNTAIN)
NOTES TO FINANCIAL STATEMENTS
YEAR ENDED JUNE 30, 2016
Page 9
2. SUMMARY OF SIGNIFICANT ACCOUNTING POLICIES
(Continued)
h) Asset Retirement Obligations
Liabilities are recognized for statutory, contractual or legal obligations associated with the retirement of tangible
capital assets when those obligations result from the acquisition, construction, development or normal operation
of the assets. The obligations are measured initially at fair value, determined using present value methodology,
and the resulting costs capitalized into the carrying amount of the related tangible capital asset. In subsequent
periods, the liability is adjusted for accretion and any changes in the amount or timing of the underlying future
cash flows. The capitalized asset retirement cost is amortized on the same basis as the related asset and accretion
expense is included in the Statement of Operations.
i) Liability for Contaminated Sites
Contaminated sites are a result of contamination being introduced into air, soil, water or sediment of a chemical,
organic or radioactive material or live organism that exceeds an environmental standard. The liability is recorded
net of any expected recoveries. A liability for remediation of contaminated sites is recognized when a site is not in
productive use and all the following criteria are met:
an environmental standard exists;
contamination exceeds the environmental standard;
the School District:
o is directly responsible; or
o accepts responsibility;
it is expected that future economic benefits will be given up; and
a reasonable estimate of the amount can be made.
The liability is recognized as management’s estimate of the cost of post-remediation including operation,
maintenance and monitoring that are an integral part of the remediation strategy for a contaminated site.
j) Tangible Capital Assets
The following criteria apply:
Tangible capital assets acquired or constructed are recorded at cost which includes amounts that are
directly related to the acquisition, design, construction, development, improvement or betterment of the
assets. Cost also includes overhead directly attributable to construction as well as interest costs that are
directly attributable to the acquisition or construction of the asset.
Donated tangible capital assets are recorded at their fair market value on the date of donation, except in
circumstances where fair value cannot be reasonably determined, which are then recognized at nominal
value. Transfers of capital assets from related parties are recorded at carrying value.
Work in progress is recorded as an acquisition to the applicable asset class at substantial completion.
Tangible capital assets are written down to residual value when conditions indicate they no longer
contribute to the ability of the School District to provide services or when the value of future economic
benefits associated with the sites and buildings are less than their net book value. The write-downs are
accounted for as expenses in the Statement of Operations.
Buildings that are demolished or destroyed are written-off.
Works of art, historic assets and other intangible assets are not recorded as assets in these financial
statements.

SCHOOL DISTRICT NO. 6 (ROCKY MOUNTAIN)
NOTES TO FINANCIAL STATEMENTS
YEAR ENDED JUNE 30, 2016
Page 10
2. SUMMARY OF SIGNIFICANT ACCOUNTING POLICIES
(Continued)
j) Tangible Capital Assets (continued)
The cost, less residual value, of tangible capital assets (excluding sites), is amortized on a straight-line
basis over the estimated useful life of the asset and commences the year following acquisition. It is
management’s responsibility to determine the appropriate useful lives for tangible capital assets. These
useful lives are reviewed on a regular basis or if significant events initiate the need to revise. Estimated
useful lives are as follows:
Buildings 40 years
Furniture & Equipment 10 years
Vehicles 10 years
Computer Software 5 years
Computer Hardware 5 years
Computer Hardware Under Capital Lease 5 years
k) Capital Leases
Leases that, from the point of view of the lessee, transfer substantially all the benefits and risks incident to
ownership of the property to the School District are considered capital leases. These are accounted for as an asset
and an obligation. Capital lease obligations are recorded at the present value of the minimum lease payments
excluding executor costs, e.g., insurance, maintenance cost, etc. The discount rate used to determine the present
value of the lease payments is the lower of the School District’s rate for incremental borrowing or the interest rate
implicit in the lease.
All other leases are accounted for as operating leases and the related payments are charged to expenses as incurred.
l) Prepaid Expenses
Prepaid insurance, maintenance fees, permits and other costs included as prepaid expenses are stated at acquisition
cost and are charged to expense over the periods expected to benefit from them.
m) Funds and Reserves
Certain amounts, as approved by the board, are set aside in accumulated surplus for future operating and capital
purposes. Transfers to and from funds and reserves are an adjustment to the respective fund when approved (see
Note 14 – Interfund Transfers and Note 18 – Internally Restricted Surplus – Operating Fund).
n) Revenue Recognition
Revenues are recognized in the period in which the transactions or events occurred that gave rise to the revenues.
All revenues are recorded on an accrual basis, except when the accruals cannot be determined with a reasonable
degree of certainty or when their estimation is impracticable.
Contributions received, or where eligibility criteria have been met, are recognized as revenue except where the
contribution meets the criteria for deferral as described below. Eligibility criteria are the criteria that the School
District has to meet in order to receive the contributions including authorization by the transferring government.

SCHOOL DISTRICT NO. 6 (ROCKY MOUNTAIN)
NOTES TO FINANCIAL STATEMENTS
YEAR ENDED JUNE 30, 2016
Page 11
2. SUMMARY OF SIGNIFICANT ACCOUNTING POLICIES
(Continued)
n) Revenue Recognition (continued)
For contributions subject to a legislative or contractual stipulation or restriction as to their use, revenue is
recognized as follows:
non-capital contributions for specific purposes are recorded as deferred revenue and recognized as revenue
in the year related expenses are incurred;
contributions restricted for site acquisitions are recorded as revenue when the sites are purchased; and
contributions restricted for tangible capital asset acquisitions other than sites are recorded as deferred
capital revenue and amortized over the useful life of the related assets.
Donated tangible capital assets other than sites are recorded at fair market value and amortized over the useful life
of the assets. Donated sites are recorded as revenue at fair market value when received or receivable.
The accounting treatment for restricted contributions is not consistent with the requirements of Canadian public
sector accounting standards which require that government transfers be recognized as revenue when approved by
the transferor and eligibility criteria have been met unless the transfer contains a stipulation that meets the criteria
for liability recognition in which case the transfer is recognized as revenue over the period that the liability is
extinguished. See Note 2(a) for the impact of this policy on these financial statements.
Revenue related to fees or services received in advance of the fee being earned or the service being performed is
deferred and recognized when the fee is earned or service performed.
Investment income is reported in the period earned. When required by the funding party or related Act, investment
income earned on deferred revenue is added to the deferred revenue balance.
o) Expenditures
Expenses are reported on an accrual basis. The cost of all goods consumed and services received during the year
is expensed.
Categories of Salaries
Principals, Vice-Principals, and Directors of Instruction employed under an administrative officer contract
are categorized as Principals and Vice-Principals.
Superintendents, Assistant Superintendents, Secretary-Treasurers, Trustees and other employees excluded
from union contracts are categorized as Other Professionals.
Allocation of Costs
Operating expenses are reported by function, program, and object. Whenever possible, expenditures are
determined by actual identification. Additional costs pertaining to specific instructional programs, such as
special and aboriginal education, are allocated to these programs. All other costs are allocated to related
programs.
Actual salaries of personnel assigned to two or more functions or programs are allocated based on the time
spent in each function and program. School-based clerical salaries are allocated to school administration
and partially to other programs to which they may be assigned. Principals and Vice-Principals salaries are
allocated to school administration and may be partially allocated to other programs to recognize their other
responsibilities.
Employee benefits and allowances are allocated to the same programs, and in the same proportions, as the
individual’s salary.
SCHOOL DISTRICT NO. 6 (ROCKY MOUNTAIN)
NOTES TO FINANCIAL STATEMENTS
YEAR ENDED JUNE 30, 2016
Page 12
2. SUMMARY OF SIGNIFICANT ACCOUNTING POLICIES
(Continued)
o) Expenditures (continued)
Allocation of Costs (continued)
Supplies and services are allocated based on actual program identification.
p) Endowment Contributions
Endowment contributions are reported as revenue on the Statement of Operations when received. Investment
income earned on endowment principal is recorded as deferred revenue if it meets the definition of a liability and
is recognized as revenue in the year related expenses (disbursements) are incurred. If the investment income earned
does not meet the definition of a liability, it is recognized as revenue in the year it is earned. Endowment assets
are reported as restricted non-financial assets on the Statement of Financial Position.
q) Financial Instruments
A contract establishing a financial instrument creates, at its inception, rights and obligations to receive or deliver
economic benefits. The financial assets and liabilities portray these rights and obligations in the financial
statements. The School District recognizes a financial instrument when it becomes a party to a financial instrument
contract.
Financial instruments consist of cash and cash equivalents, accounts receivable, portfolio investments, accounts
payable and accrued liabilities, capital lease obligations and other liabilities.
Except for portfolio investments in equity instruments quoted in an active market that are recorded at fair value,
all financial assets and liabilities are recorded at cost or amortized cost and the associated transaction costs are
added to the carrying value of these investments upon initial recognition. Transaction costs are incremental costs
directly attributable to the acquisition or issue of a financial asset or a financial liability.
Interest and dividends attributable to financial instruments are reported in the Statement of Operations.
All financial assets except derivatives are tested annually for impairment. When financial assets are impaired,
impairment losses are recorded in the statement of operations. A write-down of a portfolio investment to reflect a
loss in value is not reversed for a subsequent increase in value.
For financial instruments measured using amortized cost, the effective interest rate method is used to determine
interest revenue or expense.
r) Measurement Uncertainty
Preparation of financial statements in accordance with the basis of accounting described in Note 2(a) requires
management to make estimates and assumptions that impact reported amounts of assets and liabilities at the date
of the financial statements and revenues and expenses during the reporting periods. Significant areas requiring the
use of management estimates relate to the potential impairment of assets, liabilities for contaminated sites, rates
for amortization and estimated employee future benefits. Actual results could differ from those estimates.

SCHOOL DISTRICT NO. 6 (ROCKY MOUNTAIN)
NOTES TO FINANCIAL STATEMENTS
YEAR ENDED JUNE 30, 2016
Page 13
3. ACCOUNTS RECEIVABLE – OTHER RECEIVABLES
2016
2015
Due from Federal Government $ 75,249 $ 79,789
Due from Other School Districts 12,769 4,141
Other 180,737 77,883
$ 268,755 $ 161,813
4. PORTFOLIO INVESTMENTS
2016
2015
Investments in the cost and amortized cost category:
Guaranteed investment certificates $ 157,123 $ 156,116
Term deposits 3,078,132 3,076,193
$ 3,235,255 $ 3,232,309
5. ACCOUNTS PAYABLE AND ACCRUED LIABILITIES - OTHER
2016
2015
Trade payables $ 1,665,008 $ 1,752,045
Salaries and benefits payable 885,010 870,235
Accrued vacation pay 322,434 355,908
$ 2,872,452 $ 2,978,188
6. UNEARNED REVENUE
2016
2015
Balance, beginning of year $ 498,649 $ 500,015
Changes for the year:
Increase:
Tuition fees 948,628 498,649
948,628 498,649
Decrease:
Tuition fees 498,649 500,015
Net changes for the year 449,979 (1,366)
Balance, end of year $ 948,628 $ 498,649
7. DEFERRED REVENUE
Deferred revenue includes unspent grants and contributions received that meet the description of a restricted
contribution in the Restricted Contributions Regulation 198/2011 issued by Treasury Board, i.e., the stipulations
associated with those grants and contributions have not yet been fulfilled. Detailed information about the changes in
deferred revenue is included in Schedule 3A.

SCHOOL DISTRICT NO. 6 (ROCKY MOUNTAIN)
NOTES TO FINANCIAL STATEMENTS
YEAR ENDED JUNE 30, 2016
Page 14
8. DEFERRED CAPITAL REVENUE
Deferred capital revenue includes grants and contributions received that are restricted by the contributor for the
acquisition of tangible capital assets that meet the description of a restricted contribution in the Restricted Contributions
Regulation 198/2011 issued by Treasury Board. Once spent, the contributions are amortized into revenue over the life
of the asset acquired. Detailed information about the changes in deferred capital revenue is included in Schedules 4C
and 4D.
9. EMPLOYEE FUTURE BENEFITS
Benefits include vested sick leave, accumulating non-vested sick leave, early retirement, retirement/severance,
vacation, overtime and death benefits. Funding is provided when the benefits are paid and accordingly, there are no
plan assets. Although no plan assets are uniquely identified, the School District has provided for the payment of these
benefits.
2016 2015
Reconciliation of Accrued Benefit Obligation
Accrued Benefit Obligation – April 1 $ 711,210 $ 642,535
Service Cost 52,203 45,714
Interest Cost 16,608 21,616
Benefit Payments (37,767) (48,430)
Actuarial (Gain) Loss (184,284) 49,775
Accrued Benefit Obligation – March 31 $ 557,970 $ 711,210
Reconciliation of Funded Status at End of Fiscal Year
Accrued Benefit Obligation – March 31 $ 557,970 $ 711,210
Market Value of Plan Assets – March 31 0 0
Funded Status – Surplus (Deficit) (557,970) (711,210)
Employer Contributions After Measurement Date 0 3,506
Benefits Expense After Measurement Date (12,574) (17,203)
Unamortized Net Actuarial (Gain) Loss (91,575) 108,469
Accrued Benefit Asset (Liability) – June 30 $ (662,119) $ (616,438)
Reconciliation of Change in Accrued Benefit Liability
Accrued Benefit Liability – July 1 $ 616,438 $ 589,701
Net expense for Fiscal Year 79,942 78,276
Employer Contributions (34,261) (51,539)
Accrued Benefit Liability – June 30 $ 662,119 $ 616,438
Components of Net Benefit Expense
Service Cost $ 48,201 $ 47,337
Interest Cost 15,981 20,364
Amortization of Net Actuarial (Gain)/Loss 15,760 10,575
Net Benefit Expense (Income) $ 79,942 $ 78,276
The significant actuarial assumptions adopted for measuring the School District’s accrued benefit obligations are:
Discount Rate – April 1 2.25% 3.25%
Discount Rate – March 31 2.50% 2.25%
Long Term Salary Growth – April 1 2.50% + seniority 2.50% + seniority
Long Term Salary Growth – March 31 2.50% + seniority 2.50% + seniority
EARSL – March 31 9.8 9.6

SCHOOL DISTRICT NO. 6 (ROCKY MOUNTAIN)
NOTES TO FINANCIAL STATEMENTS
YEAR ENDED JUNE 30, 2016
Page 15
10. CAPITAL LEASE OBLIGATIONS
The School District has entered into capital leases for computer hardware from Macquarie Equipment Finance Ltd.
with implicit interest rates of 0% to 3.30%, expiring September 17, 2019 to May 31, 2021.
Repayments are due as follows:
2017 $ 152,094
2018 152,094
2019 152,094
2020 55,526
Total minimum lease payments $ 511,808
Less amounts representing interest (15,023)
Present value of net minimum capital lease payments $ 496,785
Total interest on leases for the year was $3,961 (2015: $0)
11. TANGIBLE CAPITAL ASSETS
Net Book Value:
Net Book Value
2016
Net Book Value
2015
Sites $ 7,064,902 $ 7,037,914
Buildings 46,082,722 45,462,754
Buildings – work in progress 657,421 152,513
Furniture & equipment 1,222,115 1,331,619
Vehicles 2,007,136 2,238,904
Computer software 99,735 91,157
Computer hardware 704,228 657,604
Computer hardware under capital lease 644,917 -
Total $ 58,483,176 $ 56,972,465
JUNE 30, 2016
Opening
Cost
Additions
Disposals
Transfers
(WIP)
Total
2016
Sites $ 7,037,914 $ 26,988 $ - $ - $ 7,064,902
Buildings 89,597,309 2,434,232 - 152,513 92,184,054
Buildings –
work in progress
152,513
657,421
-
(152,513)
657,421
Furniture & equipment 2,168,729 107,369 (107,717) - 2,168,381
Vehicles 3,584,898 126,722 (247,695) - 3,463,925
Computer software 143,709 37,320 (27,639) - 153,390
Computer hardware 1,070,692 260,762 (204,455) - 1,126,999
Computer hardware –
under capital lease
-
644,917
-
-
644,917
Total $ 103,755,764 $ 4,295,731 $ (587,506) $ - $ 107,463,989
SCHOOL DISTRICT NO. 6 (ROCKY MOUNTAIN)
NOTES TO FINANCIAL STATEMENTS
YEAR ENDED JUNE 30, 2016
Page 16
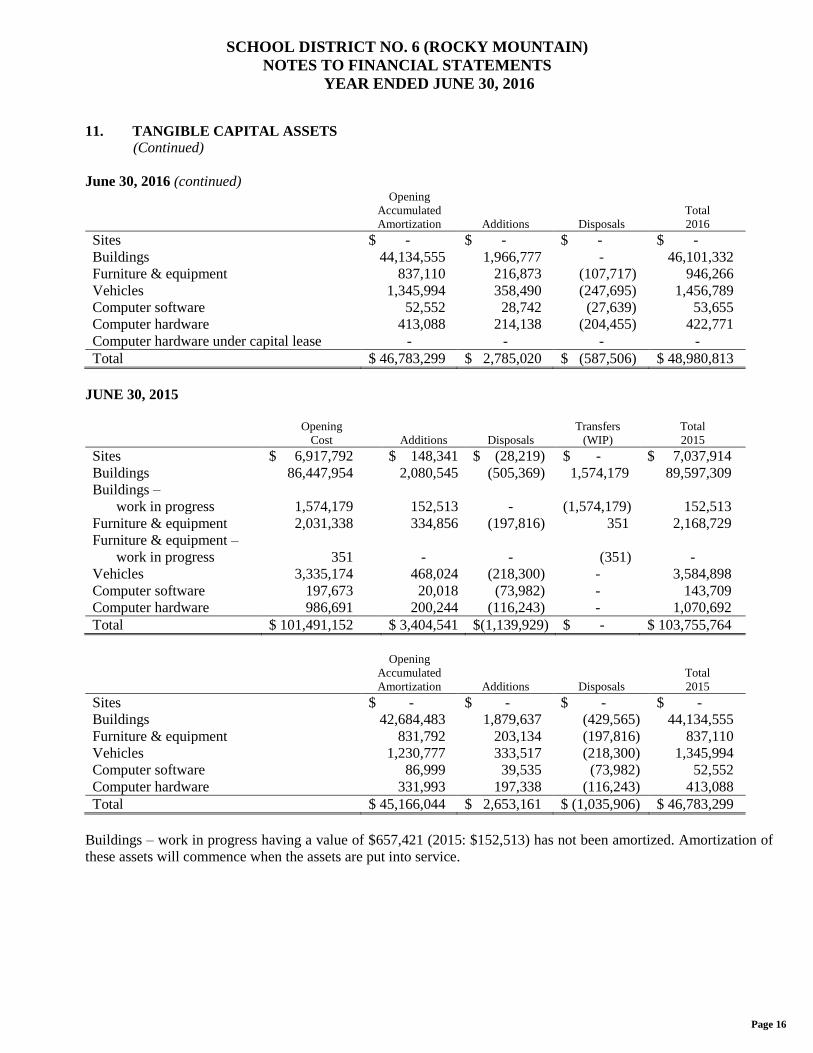
11. TANGIBLE CAPITAL ASSETS
(Continued)
June 30, 2016 (continued) Opening
Accumulated
Amortization
Additions
Disposals
Total
2016
Sites $ - $ - $ - $ -
Buildings 44,134,555 1,966,777 - 46,101,332
Furniture & equipment 837,110 216,873 (107,717) 946,266
Vehicles 1,345,994 358,490 (247,695) 1,456,789
Computer software 52,552 28,742 (27,639) 53,655
Computer hardware 413,088 214,138 (204,455) 422,771
Computer hardware under capital lease - - - -
Total $ 46,783,299 $ 2,785,020 $ (587,506) $ 48,980,813
JUNE 30, 2015
Opening
Cost
Additions
Disposals
Transfers
(WIP)
Total
2015
Sites $ 6,917,792 $ 148,341 $ (28,219) $ - $ 7,037,914
Buildings 86,447,954 2,080,545 (505,369) 1,574,179 89,597,309
Buildings –
work in progress
1,574,179
152,513
-
(1,574,179)
152,513
Furniture & equipment 2,031,338 334,856 (197,816) 351 2,168,729
Furniture & equipment –
work in progress
351
-
-
(351)
-
Vehicles 3,335,174 468,024 (218,300) - 3,584,898
Computer software 197,673 20,018 (73,982) - 143,709
Computer hardware 986,691 200,244 (116,243) - 1,070,692
Total $ 101,491,152 $ 3,404,541 $(1,139,929) $ - $ 103,755,764
Opening
Accumulated
Amortization
Additions
Disposals
Total
2015
Sites $ - $ - $ - $ -
Buildings 42,684,483 1,879,637 (429,565) 44,134,555
Furniture & equipment 831,792 203,134 (197,816) 837,110
Vehicles 1,230,777 333,517 (218,300) 1,345,994
Computer software 86,999 39,535 (73,982) 52,552
Computer hardware 331,993 197,338 (116,243) 413,088
Total $ 45,166,044 $ 2,653,161 $ (1,035,906) $ 46,783,299
Buildings – work in progress having a value of $657,421 (2015: $152,513) has not been amortized. Amortization of
these assets will commence when the assets are put into service.
SCHOOL DISTRICT NO. 6 (ROCKY MOUNTAIN)
NOTES TO FINANCIAL STATEMENTS
YEAR ENDED JUNE 30, 2016
Page 17
12. EMPLOYEE PENSION PLANS
The School District and its employees contribute to the Teachers’ Pension Plan and Municipal Pension Plan (jointly
trusteed pension plans). The boards of trustees for these plans, representing plan members and employers, are
responsible for administering the pension plans, including investing assets and administering benefits. The plans are
multi-employer defined benefit pension plans. Basic pension benefits provided are based on a formula. As at December
31, 2014 the Teachers’ Pension Plan has about 45,000 active members and approximately 35,000 retired members. As
at December 31, 2014 the Municipal Pension Plan has about 185,000 active members, including approximately 24,000
from school districts.
Every three years, an actuarial valuation is performed to assess the financial position of the plans and the adequacy of
plan funding. The actuary determines an appropriate combined employer and member contribution rate to fund the
plans. The actuary’s calculated contribution rate is based on the entry-age normal cost method, which produces the
long-term rate of member and employer contributions sufficient to provide benefits for average future entrants to the
plans. This rate is then adjusted to the extent there is amortization of any funding deficit.
The most recent actuarial valuation of the Teachers’ Pension Plan as at December 31, 2014 indicated a $449 million
surplus for basic pension benefits on a going concern basis.
The most recent actuarial valuation for the Municipal Pension Plan as at December 31, 2012 indicated a $1,370 million
funding deficit for basic pension benefits on a going concern basis.
The next valuation for the Teachers’ Pension Plan will be as at December 31, 2017, with results available in 2018. The
next valuation for the Municipal Pension Plan will be as at December 31, 2015, with results available in 2016.
Employers participating in the plans record their pension expense as the amount of employer contributions made during
the fiscal year (defined contribution plan accounting). This is because the plans record accrued liabilities and accrued
assets for each plan in aggregate, resulting in no consistent and reliable basis for allocating the obligation, plan assets
and cost to individual employers participating in the plans.
School District No. 6 (Rocky Mountain) paid $3,230,000 for employer contributions to the plans for the year ended
June 30, 2016 (2015: $2,973,000).
13. RESTRICTED ASSETS - ENDOWMENT FUNDS
Donors have placed restrictions on their contributions to the endowment funds of the School District. One restriction
is that the original contribution should not be spent. Another potential restriction is that any investment income of the
endowment fund that is required to offset the eroding effect of inflation or preserve the original value of the endowment
should also not be spent.

SCHOOL DISTRICT NO. 6 (ROCKY MOUNTAIN)
NOTES TO FINANCIAL STATEMENTS
YEAR ENDED JUNE 30, 2016
Page 18
13. RESTRICTED ASSETS - ENDOWMENT FUNDS
(Continued)
Name of Endowment
Balance
June 30, 2015
Contributions
June 30, 2016
Balance
June 30, 2016
Tom Sanders Memorial
Scholarship $ 50,000 $ - $ 50,000
J. Alfred and Mollie Laird
Bursaries 22,739 - 22,739
Nathan Emery Memorial
Bursary 11,619 - 11,619
Alicia Raven Memorial
Scholarship 10,645 - 10,645
Other Scholarships and
Bursaries 10,870 - 10,870
Total $ 105,873 $ - $ 105,873
14. INTERFUND TRANSFERS
Interfund transfers between the operating, special purpose and capital funds for the year ended June 30, 2016 were as
follows:
Operating funds transferred to capital funds - $1,631,566
Special purpose funds transferred to capital funds - $105,053
15. RELATED PARTY TRANSACTIONS
The School District is related through common ownership to all Province of British Columbia ministries, agencies,
school districts, health authorities, colleges, universities, and crown corporations. Transactions with these entities,
unless disclosed separately, are considered to be in the normal course of operations and are recorded at the exchange
amount.
16. BUDGET FIGURES
Budget figures included in the financial statements are not audited. They were approved by the board through the
adoption of an annual budget on May 12, 2015.
17. EXPENSE BY OBJECT
2016 2015
Salaries and benefits $ 31,133,275 $ 29,257,240
Services and supplies 6,603,527 6,450,166
Interest 3,961 -
Amortization 2,785,020 2,653,161
$ 40,525,783 $ 38,360,567
SCHOOL DISTRICT NO. 6 (ROCKY MOUNTAIN)
NOTES TO FINANCIAL STATEMENTS
YEAR ENDED JUNE 30, 2016
Page 19
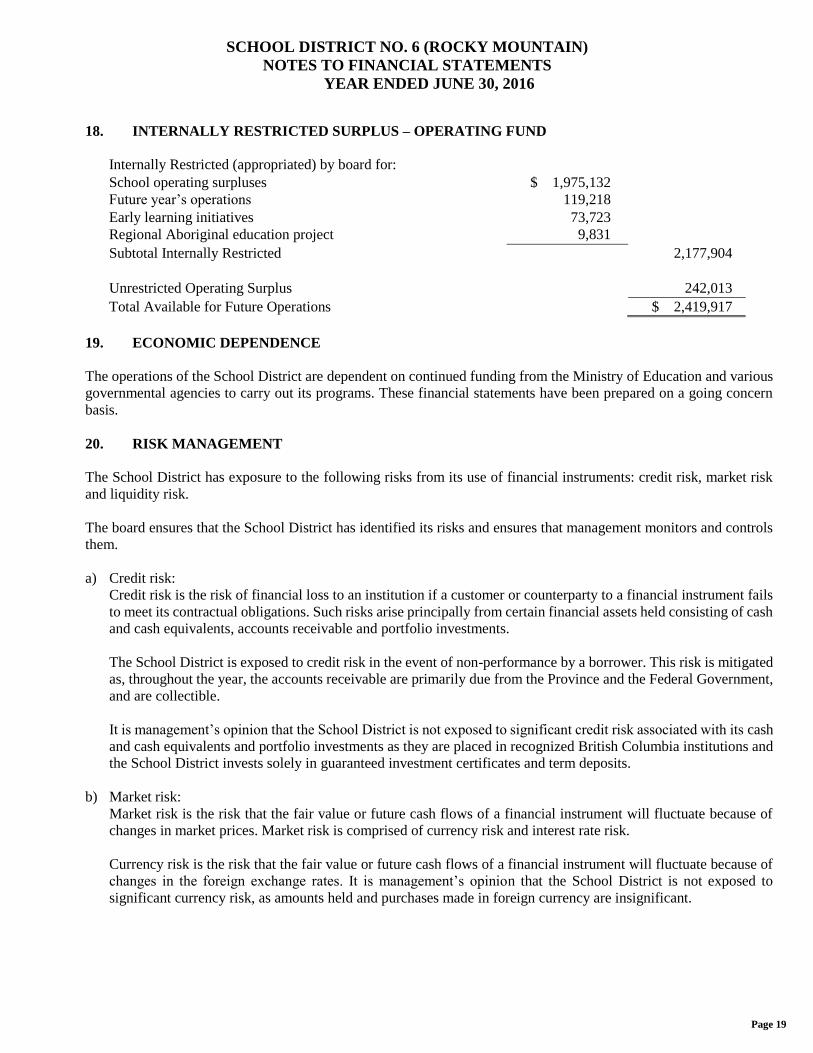
18. INTERNALLY RESTRICTED SURPLUS – OPERATING FUND
Internally Restricted (appropriated) by board for:
School operating surpluses $ 1,975,132
Future year’s operations 119,218
Early learning initiatives 73,723
Regional Aboriginal education project 9,831
Subtotal Internally Restricted 2,177,904
Unrestricted Operating Surplus 242,013
Total Available for Future Operations $ 2,419,917
19. ECONOMIC DEPENDENCE
The operations of the School District are dependent on continued funding from the Ministry of Education and various
governmental agencies to carry out its programs. These financial statements have been prepared on a going concern
basis.
20. RISK MANAGEMENT
The School District has exposure to the following risks from its use of financial instruments: credit risk, market risk
and liquidity risk.
The board ensures that the School District has identified its risks and ensures that management monitors and controls
them.
a) Credit risk:
Credit risk is the risk of financial loss to an institution if a customer or counterparty to a financial instrument fails
to meet its contractual obligations. Such risks arise principally from certain financial assets held consisting of cash
and cash equivalents, accounts receivable and portfolio investments.
The School District is exposed to credit risk in the event of non-performance by a borrower. This risk is mitigated
as, throughout the year, the accounts receivable are primarily due from the Province and the Federal Government,
and are collectible.
It is management’s opinion that the School District is not exposed to significant credit risk associated with its cash
and cash equivalents and portfolio investments as they are placed in recognized British Columbia institutions and
the School District invests solely in guaranteed investment certificates and term deposits.
b) Market risk:
Market risk is the risk that the fair value or future cash flows of a financial instrument will fluctuate because of
changes in market prices. Market risk is comprised of currency risk and interest rate risk.
Currency risk is the risk that the fair value or future cash flows of a financial instrument will fluctuate because of
changes in the foreign exchange rates. It is management’s opinion that the School District is not exposed to
significant currency risk, as amounts held and purchases made in foreign currency are insignificant.

SCHOOL DISTRICT NO. 6 (ROCKY MOUNTAIN)
NOTES TO FINANCIAL STATEMENTS
YEAR ENDED JUNE 30, 2016
Page 20
20. RISK MANAGEMENT
(Continued)
b) Market risk: (continued)
Interest rate risk is the risk that the fair value or future cash flows of a financial instrument will fluctuate because
of changes in the market interest rates. The School District is exposed to interest rate risk through its portfolio
investments. It is management’s opinion that the School District is not exposed to significant interest rate risk as
it invests solely in guaranteed investment certificates and term deposits that have a maturity date of no more than
five years.
c) Liquidity risk:
Liquidity risk is the risk that the School District will not be able to meet its financial obligations as they become
due.
The School District manages liquidity risk by continually monitoring actual and forecasted cash flows from
operations and anticipated investing activities to ensure, as far as possible, that it will always have sufficient
liquidity to meet its liabilities when due, under both normal and stressed conditions, without incurring unacceptable
losses or risking damage to the School District’s reputation.
Risk management and insurance services for all school districts in British Columbia are provided by the Risk
Management Branch of the Ministry of Finance.
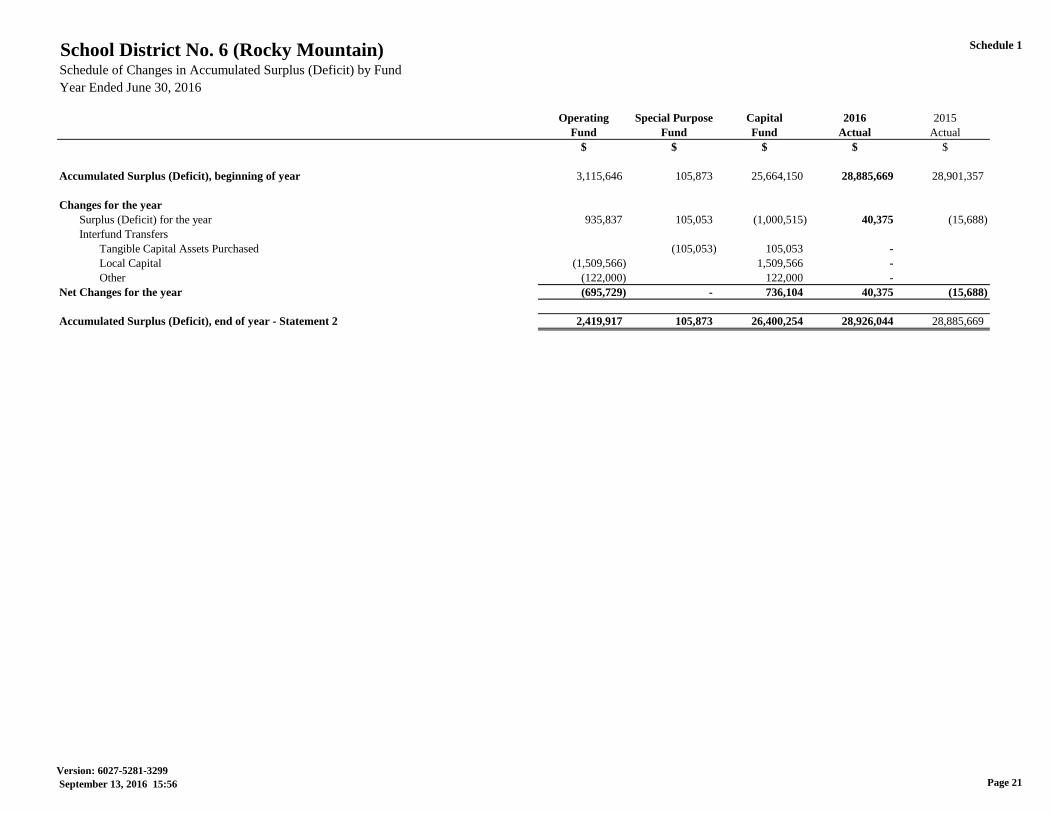
Schedule 1
Operating Special Purpose Capital 2016 2015
Fund Fund Fund Actual Actual
$ $ $ $ $
Accumulated Surplus (Deficit), beginning of year 3,115,646 105,873 25,664,150 28,885,669 28,901,357
Changes for the year
Surplus (Deficit) for the year 935,837 105,053 (1,000,515) 40,375 (15,688)
Interfund Transfers
Tangible Capital Assets Purchased (105,053) 105,053 -
Local Capital (1,509,566) 1,509,566 -
Other (122,000) 122,000 -
Net Changes for the year (695,729) - 736,104 40,375 (15,688)
Accumulated Surplus (Deficit), end of year - Statement 2 2,419,917 105,873 26,400,254 28,926,044 28,885,669
School District No. 6 (Rocky Mountain)Schedule of Changes in Accumulated Surplus (Deficit) by Fund
Year Ended June 30, 2016
Version: 6027-5281-3299
September 13, 2016 15:56 Page 21

Schedule 2
2016 2016 2015
Budget Actual Actual
$ $ $
Revenues
Provincial Grants
Ministry of Education 31,425,714 32,853,770 30,992,594
Other 2,000 2,200
Tuition 2,050,000 1,980,330 2,044,314
Other Revenue 920,341 1,192,990 506,178
Rentals and Leases 65,000 68,094 67,662
Investment Income 100,000 111,710 142,780
Total Revenue 34,561,055 36,208,894 33,755,728
Expenses
Instruction 26,575,872 27,811,010 26,073,165
District Administration 1,256,099 1,257,358 1,239,260
Operations and Maintenance 4,624,137 4,610,339 4,575,412
Transportation and Housing 1,571,829 1,594,350 1,566,836
Total Expense 34,027,937 35,273,057 33,454,673
Operating Surplus (Deficit) for the year 533,118 935,837 301,055
Budgeted Appropriation (Retirement) of Surplus (Deficit) 626,578
Net Transfers (to) from other funds
Local Capital (1,159,696) (1,509,566) (773,472)
Other (122,000)
Total Net Transfers (1,159,696) (1,631,566) (773,472)
Total Operating Surplus (Deficit), for the year - (695,729) (472,417)
Operating Surplus (Deficit), beginning of year 3,115,646 3,588,063
Operating Surplus (Deficit), end of year 2,419,917 3,115,646
Operating Surplus (Deficit), end of year
Internally Restricted 2,177,904 2,733,174
Unrestricted 242,013 382,472
Total Operating Surplus (Deficit), end of year 2,419,917 3,115,646
School District No. 6 (Rocky Mountain)Schedule of Operating Operations
Year Ended June 30, 2016
Version: 6027-5281-3299
September 13, 2016 15:56 Page 22

Schedule 2A
2016 2016 2015
Budget Actual Actual
$ $ $
Provincial Grants - Ministry of Education
Operating Grant, Ministry of Education 31,322,736 32,729,505 31,345,544
AANDC/LEA Recovery (157,845) (176,714) (157,845)
Strike Savings Recovery (1,009,579)
Other Ministry of Education Grants
Labour Settlement Funding 516,058
Pay Equity 207,823 207,823 207,823
Funding for Graduated Adults 1,426 12,736
Economic Stability Dividend 22,922
Carbon Tax Reimbursement 53,000 53,858 53,843
Teacher EHB Plan Grant 16,533
Focus Group Workplan Grant 7,481
Curriculum Implementation Supports 8,300
Skills Training Grant 5,000
Aboriginal Provincial Gathering Grant 900
MyEd SD Academy Travel 750
Total Provincial Grants - Ministry of Education 31,425,714 32,853,770 30,992,594
Provincial Grants - Other 2,000 2,200
Tuition
Offshore Tuition Fees 2,050,000 1,980,330 2,044,314
Total Tuition 2,050,000 1,980,330 2,044,314
Other Revenues
Other School District/Education Authorities 997 17,013
LEA/Direct Funding from First Nations 157,845 175,344 157,845
Miscellaneous
Project Donations 739,696 965,565 314,599
Course Registration Fees 240 8,050
Artists in Education 7,800 7,720 7,800
Other 15,000 43,124 871
Total Other Revenue 920,341 1,192,990 506,178
Rentals and Leases 65,000 68,094 67,662
Investment Income 100,000 111,710 142,780
Total Operating Revenue 34,561,055 36,208,894 33,755,728
School District No. 6 (Rocky Mountain)Schedule of Operating Revenue by Source
Year Ended June 30, 2016
Version: 6027-5281-3299
September 13, 2016 15:56 Page 23
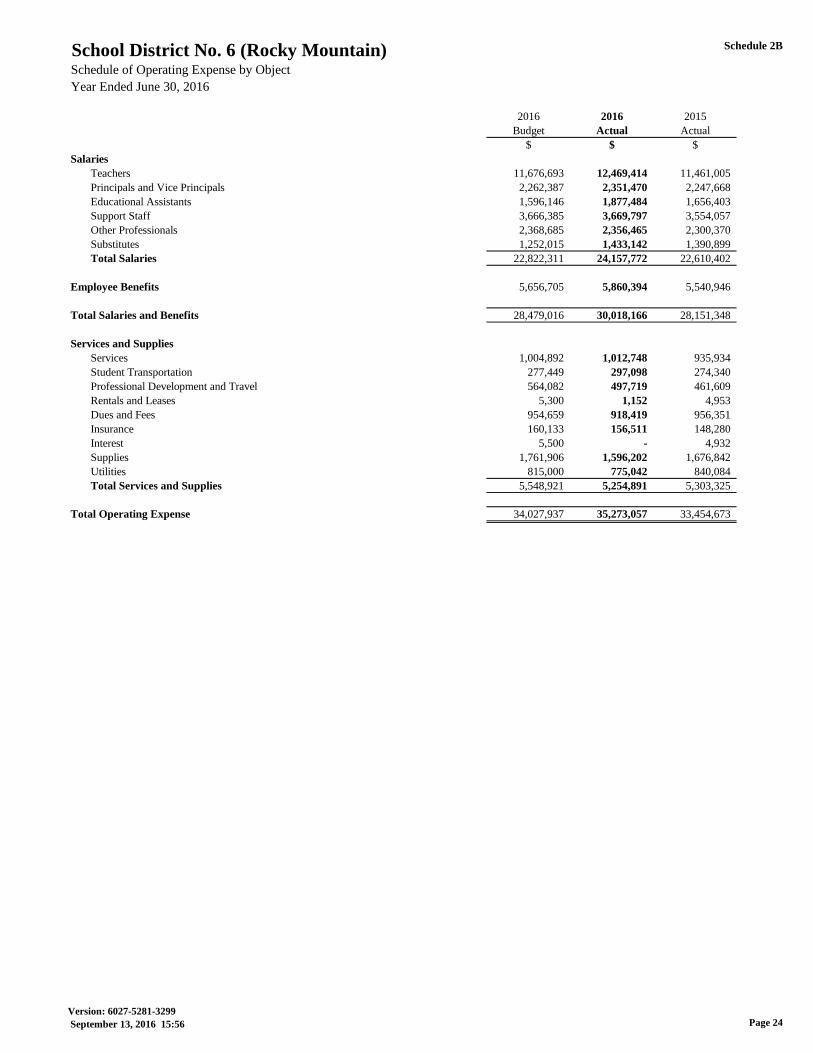
Schedule 2B
2016 2016 2015
Budget Actual Actual
$ $ $
Salaries
Teachers 11,676,693 12,469,414 11,461,005
Principals and Vice Principals 2,262,387 2,351,470 2,247,668
Educational Assistants 1,596,146 1,877,484 1,656,403
Support Staff 3,666,385 3,669,797 3,554,057
Other Professionals 2,368,685 2,356,465 2,300,370
Substitutes 1,252,015 1,433,142 1,390,899
Total Salaries 22,822,311 24,157,772 22,610,402
Employee Benefits 5,656,705 5,860,394 5,540,946
Total Salaries and Benefits 28,479,016 30,018,166 28,151,348
Services and Supplies
Services 1,004,892 1,012,748 935,934
Student Transportation 277,449 297,098 274,340
Professional Development and Travel 564,082 497,719 461,609
Rentals and Leases 5,300 1,152 4,953
Dues and Fees 954,659 918,419 956,351
Insurance 160,133 156,511 148,280
Interest 5,500 - 4,932
Supplies 1,761,906 1,596,202 1,676,842
Utilities 815,000 775,042 840,084
Total Services and Supplies 5,548,921 5,254,891 5,303,325
Total Operating Expense 34,027,937 35,273,057 33,454,673
School District No. 6 (Rocky Mountain)
Year Ended June 30, 2016
Schedule of Operating Expense by Object
Version: 6027-5281-3299
September 13, 2016 15:56 Page 24

Schedule 2CSchool District No. 6 (Rocky Mountain)Operating Expense by Function, Program and Object
Principals and Educational Support Other
Teachers Vice Principals Assistants Staff Professionals Substitutes Total
Salaries Salaries Salaries Salaries Salaries Salaries Salaries
$ $ $ $ $ $ $
1 Instruction
1.02 Regular Instruction 10,799,275 698,954 301,069 524,801 138,494 1,083,708 13,546,301
1.03 Career Programs 10,528 355 10,883
1.07 Library Services 143,782 117,475 128,551 3,891 393,699
1.08 Counselling 322,170 322,170
1.10 Special Education 1,171,557 144,846 1,513,383 16,032 316,377 137,088 3,299,283
1.30 English Language Learning 7,367 16,072 23,439
1.31 Aboriginal Education 63,032 403,481 23,486 489,999
1.41 School Administration 1,348,074 329,850 22,630 1,700,554
1.61 Continuing Education 14,735 14,735
1.62 Offshore Students 5,090 261,649 6,586 273,325
Total Function 1 12,469,414 2,325,421 1,877,484 1,004,324 1,120,001 1,277,744 20,074,388
4 District Administration
4.11 Educational Administration 178,426 178,426
4.40 School District Governance 103,177 103,177
4.41 Business Administration 534,277 534,277
Total Function 4 - - - - 815,880 - 815,880
5 Operations and Maintenance
5.41 Operations and Maintenance Administration 26,049 113,228 2,924 142,201
5.50 Maintenance Operations 1,956,963 146,054 78,811 2,181,828
5.52 Maintenance of Grounds 64,208 11,648 75,856
5.56 Utilities -
Total Function 5 - 26,049 - 2,021,171 259,282 93,383 2,399,885
7 Transportation and Housing
7.41 Transportation and Housing Administration 63,933 11,414 75,347
7.70 Student Transportation 644,302 97,369 50,601 792,272
Total Function 7 - - - 644,302 161,302 62,015 867,619
9 Debt Services
Total Function 9 - - - - - - -
Total Functions 1 - 9 12,469,414 2,351,470 1,877,484 3,669,797 2,356,465 1,433,142 24,157,772
Year Ended June 30, 2016
Page 25Version: 6027-5281-3299
September 13, 2016 15:56

Schedule 2CSchool District No. 6 (Rocky Mountain)Operating Expense by Function, Program and Object
1 Instruction
1.02 Regular Instruction
1.03 Career Programs
1.07 Library Services
1.08 Counselling
1.10 Special Education
1.30 English Language Learning
1.31 Aboriginal Education
1.41 School Administration
1.61 Continuing Education
1.62 Offshore Students
Total Function 1
4 District Administration
4.11 Educational Administration
4.40 School District Governance
4.41 Business Administration
Total Function 4
5 Operations and Maintenance
5.41 Operations and Maintenance Administration
5.50 Maintenance Operations
5.52 Maintenance of Grounds
5.56 Utilities
Total Function 5
7 Transportation and Housing
7.41 Transportation and Housing Administration
7.70 Student Transportation
Total Function 7
9 Debt Services
Total Function 9
Total Functions 1 - 9
Year Ended June 30, 2016
Total Employee Total Salaries Services and 2016 2016 2015
Salaries Benefits and Benefits Supplies Actual Budget Actual
$ $ $ $ $ $ $
13,546,301 3,341,693 16,887,994 1,062,765 17,950,759 16,831,155 16,680,630
10,883 2,768 13,651 30,360 44,011 23,799 23,501
393,699 102,921 496,620 158,135 654,755 637,154 592,974
322,170 83,307 405,477 8,746 414,223 411,262 350,896
3,299,283 848,143 4,147,426 229,148 4,376,574 4,266,833 4,087,284
23,439 5,639 29,078 731 29,809 33,791 29,653
489,999 124,014 614,013 62,086 676,099 636,738 640,746
1,700,554 390,999 2,091,553 129,094 2,220,647 2,249,414 2,213,956
14,735 3,838 18,573 18,573 19,370 17,219
273,325 43,855 317,180 1,108,380 1,425,560 1,466,356 1,436,306
20,074,388 4,947,177 25,021,565 2,789,445 27,811,010 26,575,872 26,073,165
178,426 49,578 228,004 20,549 248,553 235,720 240,747
103,177 1,690 104,867 62,673 167,540 201,153 185,670
534,277 124,775 659,052 182,213 841,265 819,226 812,843
815,880 176,043 991,923 265,435 1,257,358 1,256,099 1,239,260
142,201 31,212 173,413 117,399 290,812 301,424 282,653
2,181,828 487,184 2,669,012 572,818 3,241,830 3,314,577 3,241,458
75,856 15,779 91,635 97,362 188,997 189,460 174,546
- - 888,700 888,700 818,676 876,755
2,399,885 534,175 2,934,060 1,676,279 4,610,339 4,624,137 4,575,412
75,347 15,005 90,352 11,780 102,132 110,450 100,532
792,272 187,994 980,266 511,952 1,492,218 1,461,379 1,466,304
867,619 202,999 1,070,618 523,732 1,594,350 1,571,829 1,566,836
- - - - - - -
24,157,772 5,860,394 30,018,166 5,254,891 35,273,057 34,027,937 33,454,673
Page 26Version: 6027-5281-3299
September 13, 2016 15:56

Schedule 3
2016 2016 2015
Budget Actual Actual
$ $ $
Revenues
Provincial Grants
Ministry of Education 1,599,114 1,505,973 1,464,015
Other 57,500 37,394
Other Revenue 1,024,911 1,020,493 927,199
Investment Income 4,500 4,938 4,915
Total Revenue 2,686,025 2,568,798 2,396,129
Expenses
Instruction 2,560,258 2,349,701 2,175,006
District Administration 8,119 6,623 945
Operations and Maintenance 107,421 76,782
Total Expense 2,568,377 2,463,745 2,252,733
Special Purpose Surplus (Deficit) for the year 117,648 105,053 143,396
Net Transfers (to) from other funds
Tangible Capital Assets Purchased (117,648) (105,053) (143,396)
Total Net Transfers (117,648) (105,053) (143,396)
Total Special Purpose Surplus (Deficit) for the year - - -
Special Purpose Surplus (Deficit), beginning of year 105,873 105,873
Special Purpose Surplus (Deficit), end of year 105,873 105,873
Special Purpose Surplus (Deficit), end of year
Endowment Contributions 105,873 105,873
Total Special Purpose Surplus (Deficit), end of year 105,873 105,873
School District No. 6 (Rocky Mountain)
Year Ended June 30, 2016
Schedule of Special Purpose Operations
Version: 6027-5281-3299
September 13, 2016 15:56 Page 27
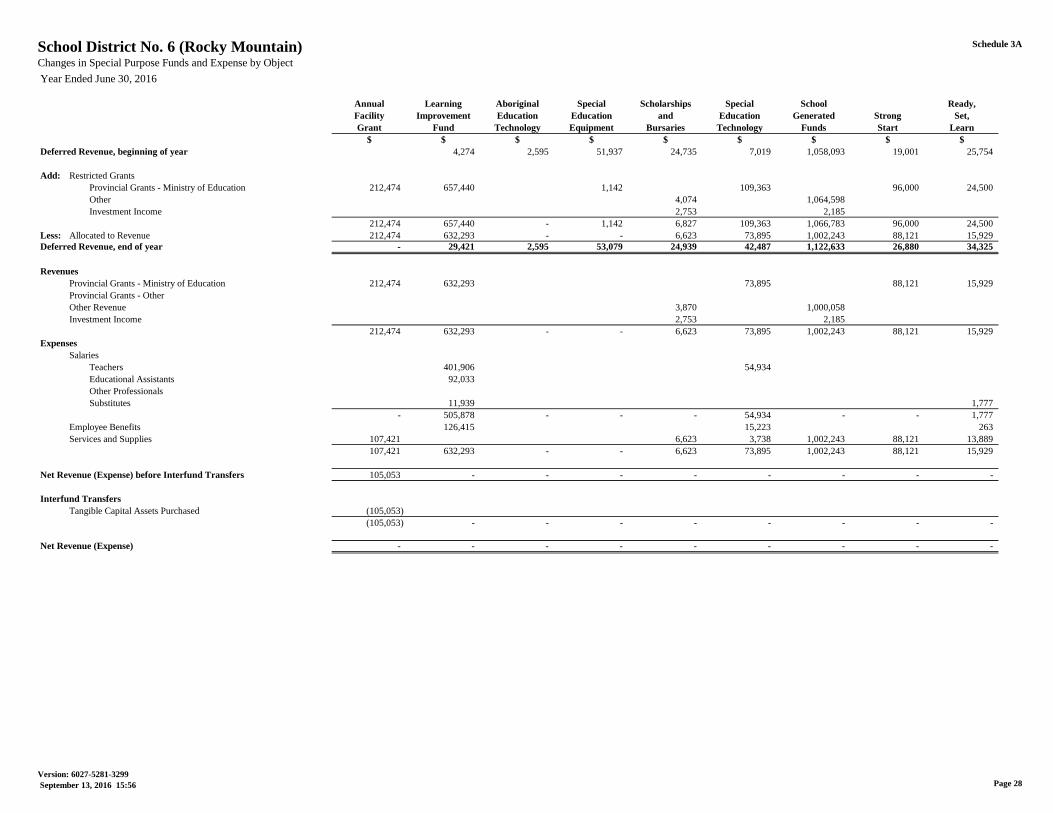
Schedule 3ASchool District No. 6 (Rocky Mountain)Changes in Special Purpose Funds and Expense by Object
Annual Learning Aboriginal Special Scholarships Special School Ready,
Facility Improvement Education Education and Education Generated Strong Set,
Grant Fund Technology Equipment Bursaries Technology Funds Start Learn
$ $ $ $ $ $ $ $ $
Deferred Revenue, beginning of year 4,274 2,595 51,937 24,735 7,019 1,058,093 19,001 25,754
Add: Restricted Grants
Provincial Grants - Ministry of Education 212,474 657,440 1,142 109,363 96,000 24,500
Other 4,074 1,064,598
Investment Income 2,753 2,185
212,474 657,440 - 1,142 6,827 109,363 1,066,783 96,000 24,500
Less: Allocated to Revenue 212,474 632,293 - - 6,623 73,895 1,002,243 88,121 15,929
Deferred Revenue, end of year - 29,421 2,595 53,079 24,939 42,487 1,122,633 26,880 34,325
Revenues
Provincial Grants - Ministry of Education 212,474 632,293 73,895 88,121 15,929
Provincial Grants - Other
Other Revenue 3,870 1,000,058
Investment Income 2,753 2,185
212,474 632,293 - - 6,623 73,895 1,002,243 88,121 15,929
Expenses
Salaries
Teachers 401,906 54,934
Educational Assistants 92,033
Other Professionals
Substitutes 11,939 1,777
- 505,878 - - - 54,934 - - 1,777
Employee Benefits 126,415 15,223 263
Services and Supplies 107,421 6,623 3,738 1,002,243 88,121 13,889
107,421 632,293 - - 6,623 73,895 1,002,243 88,121 15,929
Net Revenue (Expense) before Interfund Transfers 105,053 - - - - - - - -
Interfund Transfers
Tangible Capital Assets Purchased (105,053)
(105,053) - - - - - - - -
Net Revenue (Expense) - - - - - - - - -
Year Ended June 30, 2016
Page 28Version: 6027-5281-3299
September 13, 2016 15:56

Schedule 3ASchool District No. 6 (Rocky Mountain)Changes in Special Purpose Funds and Expense by Object
Deferred Revenue, beginning of year
Add: Restricted Grants
Provincial Grants - Ministry of Education
Other
Investment Income
Less: Allocated to Revenue
Deferred Revenue, end of year
Revenues
Provincial Grants - Ministry of Education
Provincial Grants - Other
Other Revenue
Investment Income
Expenses
Salaries
Teachers
Educational Assistants
Other Professionals
Substitutes
Employee Benefits
Services and Supplies
Net Revenue (Expense) before Interfund Transfers
Interfund Transfers
Tangible Capital Assets Purchased
Net Revenue (Expense)
Year Ended June 30, 2016
Service School
Community- Delivery Reach Out FSA POPFASD Student Based
OLEP LINK Transformation And Up! Testing Project Assistance Prevention TOTAL
$ $ $ $ $ $ $ $ $
32,222 51,206 25,000 14,229 7,468 1,075 50,000 1,374,608
90,786 369,891 8,696 1,570,292
2,336 1,071,008
4,938
90,786 369,891 - 2,336 8,696 - - - 2,646,238
116,406 358,159 - 16,565 8,696 - - 37,394 2,568,798
6,602 62,938 25,000 - - 7,468 1,075 12,606 1,452,048
116,406 358,159 8,696 1,505,973
37,394 37,394
16,565 1,020,493
4,938
116,406 358,159 - 16,565 8,696 - - 37,394 2,568,798
29,470 85,463 571,773
47,293 139,326
149,542 149,542
6,825 8,187 2,353 31,081
36,295 282,298 - - 8,187 - - 2,353 891,722
8,716 72,259 511 223,387
71,395 3,602 16,565 509 34,530 1,348,636
116,406 358,159 - 16,565 8,696 - - 37,394 2,463,745
- - - - - - - - 105,053
(105,053)
- - - - - - - - (105,053)
- - - - - - - - -
Year Ended June 30, 2016
Page 29Version: 6027-5281-3299
September 13, 2016 15:56

Schedule 4
2016 Invested in Tangible Local Fund 2015
Budget Capital Assets Capital Balance Actual
$ $ $ $ $
Revenues
Provincial Grants
Ministry of Education - 102,413
Investment Income 10,000 12,696 12,696 30,725
Gain (Loss) on Disposal of Tangible Capital Assets - 324,407
Amortization of Deferred Capital Revenue 1,775,723 1,775,770 1,775,770 1,735,477
Total Revenue 1,785,723 1,775,770 12,696 1,788,466 2,193,022
Expenses
Amortization of Tangible Capital Assets
Operations and Maintenance 2,550,051 2,456,516 2,456,516 2,413,386
Transportation and Housing 241,466 328,504 328,504 239,775
Debt Services
Capital Lease Interest 3,961 3,961
Total Expense 2,791,517 2,785,020 3,961 2,788,981 2,653,161
Capital Surplus (Deficit) for the year (1,005,794) (1,009,250) 8,735 (1,000,515) (460,139)
Net Transfers (to) from other funds
Tangible Capital Assets Purchased 117,648 105,053 105,053 143,396
Local Capital 1,159,696 1,509,566 1,509,566 773,472
Capital Lease Payment 122,000 122,000
Total Net Transfers 1,277,344 105,053 1,631,566 1,736,619 916,868
Other Adjustments to Fund Balances
Tangible Capital Assets Purchased from Local Capital 1,673,740 (1,673,740) -
Principal Payment
Capital Lease 148,132 (148,132) -
Total Other Adjustments to Fund Balances 1,821,872 (1,821,872) -
Total Capital Surplus (Deficit) for the year 271,550 917,675 (181,571) 736,104 456,729
Capital Surplus (Deficit), beginning of year 24,962,670 701,480 25,664,150 25,207,421
Capital Surplus (Deficit), end of year 25,880,345 519,909 26,400,254 25,664,150
School District No. 6 (Rocky Mountain)Schedule of Capital Operations
Year Ended June 30, 2016
2016 Actual
Version: 6027-5281-3299
September 13, 2016 15:56 Page 30

Schedule 4A
Furniture and Computer Computer
Sites Buildings Equipment Vehicles Software Hardware Total
$ $ $ $ $ $ $
Cost, beginning of year 7,037,914 89,597,309 2,168,729 3,584,898 143,709 1,070,692 103,603,251
Changes for the Year
Increase:
Purchases from:
Deferred Capital Revenue - Bylaw 1,214,600 1,214,600
Special Purpose Funds 26,988 78,065 105,053
Local Capital 1,141,567 107,369 126,722 37,320 260,762 1,673,740
Assests Acquired by Lease 644,917 644,917
Transferred from Work in Progress 152,513 152,513
26,988 2,586,745 107,369 126,722 37,320 905,679 3,790,823
Decrease:
Deemed Disposals 107,717 247,695 27,639 204,455 587,506
- - 107,717 247,695 27,639 204,455 587,506
Cost, end of year 7,064,902 92,184,054 2,168,381 3,463,925 153,390 1,771,916 106,806,568
Work in Progress, end of year 657,421 657,421
Cost and Work in Progress, end of year 7,064,902 92,841,475 2,168,381 3,463,925 153,390 1,771,916 107,463,989
Accumulated Amortization, beginning of year 44,134,555 837,110 1,345,994 52,552 413,088 46,783,299
Changes for the Year
Increase: Amortization for the Year 1,966,777 216,873 358,490 28,742 214,138 2,785,020
Decrease:
Deemed Disposals 107,717 247,695 27,639 204,455 587,506
- 107,717 247,695 27,639 204,455 587,506
Accumulated Amortization, end of year 46,101,332 946,266 1,456,789 53,655 422,771 48,980,813
Tangible Capital Assets - Net 7,064,902 46,740,143 1,222,115 2,007,136 99,735 1,349,145 58,483,176
School District No. 6 (Rocky Mountain)Tangible Capital Assets
Year Ended June 30, 2016
Version: 6027-5281-3299
September 13, 2016 15:56 Page 31
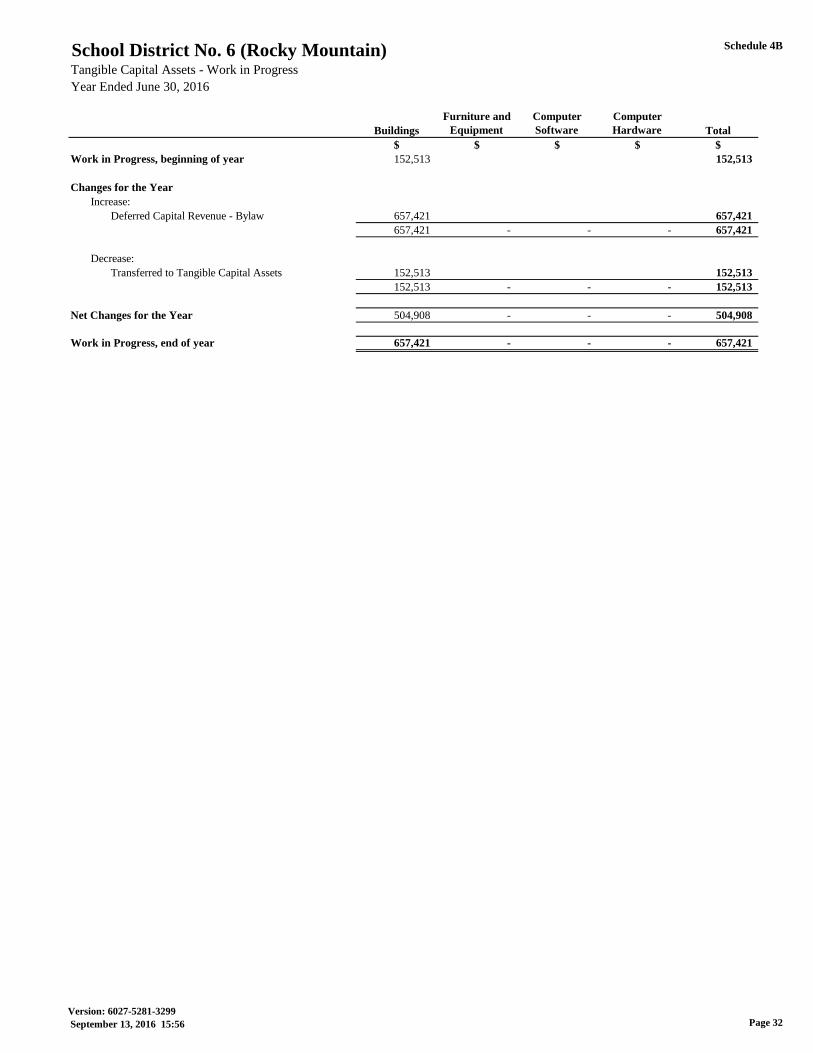
Schedule 4B
Furniture and Computer Computer
Buildings Equipment Software Hardware Total
$ $ $ $ $
Work in Progress, beginning of year 152,513 152,513
Changes for the Year
Increase:
Deferred Capital Revenue - Bylaw 657,421 657,421
657,421 - - - 657,421
Decrease:
Transferred to Tangible Capital Assets 152,513 152,513
152,513 - - - 152,513
Net Changes for the Year 504,908 - - - 504,908
Work in Progress, end of year 657,421 - - - 657,421
School District No. 6 (Rocky Mountain)Tangible Capital Assets - Work in Progress
Year Ended June 30, 2016
Version: 6027-5281-3299
September 13, 2016 15:56 Page 32

Schedule 4C
Bylaw Other Other Total
Capital Provincial Capital Capital
$ $ $ $
Deferred Capital Revenue, beginning of year 30,432,699 1,537,155 31,969,854
Changes for the Year
Increase:
Transferred from Deferred Revenue - Capital Additions 1,214,600 1,214,600
Transferred from Work in Progress 39,942 39,942
1,254,542 - - 1,254,542
Decrease:
Amortization of Deferred Capital Revenue 1,731,862 43,908 1,775,770
1,731,862 43,908 - 1,775,770
Net Changes for the Year (477,320) (43,908) - (521,228)
Deferred Capital Revenue, end of year 29,955,379 1,493,247 - 31,448,626
Work in Progress, beginning of year 39,942 39,942
Changes for the Year
Increase
Transferred from Deferred Revenue - Work in Progress 657,421 657,421
657,421 - - 657,421
Decrease
Transferred to Deferred Capital Revenue 39,942 39,942
39,942 - - 39,942
Net Changes for the Year 617,479 - - 617,479
Work in Progress, end of year 657,421 - - 657,421
Total Deferred Capital Revenue, end of year 30,612,800 1,493,247 - 32,106,047
School District No. 6 (Rocky Mountain)Deferred Capital Revenue
Year Ended June 30, 2016
Version: 6027-5281-3299
September 13, 2016 15:56 Page 33

Schedule 4D
MEd Other
Bylaw Restricted Provincial Land Other
Capital Capital Capital Capital Capital Total
$ $ $ $ $ $
Balance, beginning of year 10,057 55,921 65,978
Changes for the Year
Increase:
Provincial Grants - Ministry of Education 1,921,028 1,921,028
Other 20,000 20,000
Investment Income 1,385 1,385
1,921,028 21,385 - - - 1,942,413
Decrease:
Transferred to DCR - Capital Additions 1,214,600 1,214,600
Transferred to DCR - Work in Progress 657,421 657,421
1,872,021 - - - - 1,872,021
Net Changes for the Year 49,007 21,385 - - - 70,392
Balance, end of year 59,064 77,306 - - - 136,370
School District No. 6 (Rocky Mountain)Changes in Unspent Deferred Capital Revenue
Year Ended June 30, 2016
Version: 6027-5281-3299
September 13, 2016 15:56 Page 34