school district 36 surrey wave 6 …earlylearning.ubc.ca/media/edi_w6_communityprofiles/edi...school...
TRANSCRIPT

SCHOOL DISTRICT 36 SURREY
WAVE 6 COMMUNITY PROFILE
WAVE 6 EDI RESULTS
EDI

ACKNOWLEDGEMENTSThe Human Early Learning Partnership (HELP) would like to thank school districts across BC for their participation in the Early Development Instrument (EDI) questionnaire. Involvement of teachers, principals, staff and parents is essential to helping us understand the state of early child development across the province. Together we have collected EDI data for over 245,000 children in BC since 2001, providing rich detail about the patterns and trends in the early development of BC’s children.
HELP would also like to acknowledge the support we have received from the Ministries of Children and Family Development, Education, and Health since 2001. This investment has supported the development of a unique child development monitoring system that provides a foundation for high quality, evidence-informed decisions on behalf of children and their families.
ABOUT THE HUMAN EARLY LEARNING PARTNERSHIPHELP is an interdisciplinary research institute, based at the School of Population and Public Health at the University of British Columbia. The institute was founded by Drs. Clyde Hertzman and Hillel Goelman in 1999. Clyde’s vision for HELP was to advance knowledge about child development and importantly, to apply this knowledge in communities.
HELP’s unique partnership brings together researchers and practitioners from across BC, Canada and internationally to address complex child development issues. HELP’s research projects explore how different environments and experiences contribute to health and social inequities in children’s development over their life course. To learn more please visit our website at earlylearning.ubc.ca.
Suggested citationHuman Early Learning Partnership. EDI (Early Years Development Instrument) report. Wave 6 Community Profile, 2016. Surrey (SD36). Vancouver, BC: University of British Columbia, School of Population and Public Health; October 2016.
EDI

EDI COMMUNITY PROFILE TABLE OF CONTENTS 1. COMMUNITY PROFILE OVERVIEW 4
2. INTRODUCTION TO THE EDI 5
YOUR COMMUNITY DATA 7
3. SCHOOL DISTRICT EDI RESULTS 8 WAVE 6 PARTICIPATION 8
WAVE 6 DATA 9
SCHOOL DISTRICT TRENDS 10
DIFFERENCES ACROSS BC SCHOOL DISTRICTS 11
4. NEIGHBOURHOOD RESULTS 13
NEIGHBOURHOOD VULNERABILITY RATES 14
NEIGHBOURHOOD MAPS 15
CHANGE OVER TIME 22
NEIGHBOURHOOD PROFILES 25
5. USING EDI RESULTS IN COMMUNITIES

4 - EDI COMMUNITY PROFILE
COMMUNITY PROFILE OVERVIEW
The Human Early Learning Partnership (HELP) uses the Early Development Instrument (EDI) to measure the developmental health of the kindergarten population across the province. The EDI measures childhood vulnerability rates, reflecting how children’s experiences and environments in the first five years of their lives have affected their development as a whole.
Children’s development is impacted by the broad policy environment, socioeconomic conditions, family and neighbourhood characteristics, play and peers, language and literacy, early learning and care, and their overall health. EDI data illustrate the distinct differences in children’s developmental outcomes that exist across communities in BC.
Overall, EDI data are integral to the story of early child development in BC, contributing important evidence for guiding informed responses and investments in children and families as well as helping us to understand the effectiveness of those responses.
“The quality of early childhood affects the quality of the future population and the prosperity of the society in which these children are raised.” - Dr. Fraser Mustard
EDI: A LENS ONTO THE EARLY YEARS

WAVE 6 EDI RESULTS - 5
EDI COLLECTION HISTORY
WAVE 1* WAVE 2 WAVE 3 WAVE 4 WAVE 5 WAVE 6
2001-04 2004-07 2007-09 2009-11 2011-13 2013-16
40,312 37,756 37,398 46,671 42,406 43,181NUMBER OF CHILDREN
SCHOOL YEAR
247,724TOTAL NUMBER OF CHILDREN
* Wave 1 is not generally reported - data are used as a benchmark
INTRODUCTION TO THE EDI
Figure 1. EDI Data collection history from 2001-2016
Please note: A ‘Wave’ is a 2-3 year data collection period, based on the annual school calendar (September – June). Due to changes in the EDI questionnaire after Wave 1 data collection, Wave 2 is HELP’s baseline and Wave 1 data are not publicly reported.
QUICK FACTS ABOUT THE EDI
The EDI is a questionnaire used province-wide to measure patterns and trends in children’s developmental health. HELP has been collecting EDI data since 2001. Over the past 15 years, we have collected data for 247,724 kindergarten children in BC. This has established an important foundation for a population health monitoring system that supports an increased understanding of children’s early developmental outcomes over time and across geographies.
• Developed by Dr. Dan Offord and Dr. Magdalena Janus at the Offord Centre for Child Studies at McMaster University.
• Designed as a population-level monitoring tool, not for screening or diagnosing individual children.
• The questionnaire includes 104 questions that measure five areas, also called scales, that are important to early child development and are good predictors of health, education and social outcomes in adolescence and adulthood.
• EDI Questionnaires are completed by kindergarten teachers for students in their classroom in February of the school year.
• Teachers participate in a standardized training session prior to completing the EDI questionnaires.
For more information about the EDI please visit: earlylearning.ubc.ca/edi
EDI: A LENS ONTO THE EARLY YEARS

6 - EDI COMMUNITY PROFILE
INTRODUCTION TO THE EDI
PHYSICAL HEALTH & WELL-BEING
Assesses children’s gross and fine motor skills, physical independence and readiness for the school day. E.g. Can the child hold a pencil? Is the child able to manipulate objects? Is the child on time for school?
SOCIAL COMPETENCE
Assesses children’s overall social competencies, capacity for respect and responsibility, approaches to learning, and readiness to explore new things. E.g. Is the child able to follow class routines? Is the child self-confident? Is the child eager to read a new book?
EMOTIONAL MATURITY
Assesses children’s prosocial and helping behaviours, as well as hyperactivity and inattention, and aggressive, anxious and fearful behaviours. E.g. Does the child comfort a child who is crying or upset? Does the child help clean up a mess?
LANGUAGE & COGNITIVE DEVELOPMENT
Assesses children’s basic and advanced literacy skills, numeracy skills, interest in math and reading, and memory. E.g. Is the child interested in reading and writing? Can the childcount and recognize numbers? Is the child able to read simplesentences?
COMMUNICATION SKILLS & GENERAL KNOWLEDGE
Assesses children’s English language skills and general knowledge. E.g. Can the child tell a story? Can the child communicate with adults and children? Can the child take part in imaginative play?
HOW DOES THE EDI MEASURE CHILDHOOD VULNERABILITY?
Data gathered from the EDI are used to report on childhood vulnerability rates. The data illustrate trends in vulnerability over time. Through data analyses and mapping, it also becomes possible to examine regional differences in child vulnerability at multiple geographical levels from a broad provincial snapshot to community and neighbourhood analyses.
Vulnerable children are those who, without additional support and care, are more likely to experience challenges in their school years and beyond. Vulnerability is assessed for each of the five EDI scales. Children whose scores fall below the vulnerability cut-off on a particular EDI scale are said to be vulnerable in that area of development.
The five scales of the EDI are:
REPORTING ON EDI VULNERABILITY
Vulnerability on the Five EDI Scales The percentage of children vulnerable on each of the five scales of the EDI are measured and reported as vulnerability rates.
Vulnerable on One or More Scales Vulnerable on One or More Scales is a summary measure that reports the percentage of children who are vulnerable on at least one or more of the five scales of the EDI. Children represented by this measure may be vulnerable on only one scale or may be experiencing vulnerabilities on two, three, four or all five scales of the EDI.
For more information about vulnerability on the EDI and how it is calculated please see our Fact Sheet: earlylearning.ubc.ca/documents/68

WAVE 6 EDI RESULTS - 7
INTRODUCTION TO THE EDI
Interpreting Maps and Data
EDI data in this report are presented for each of the five scales, and by a summary measure representing children who are Vulnerable on One or More Scales. Graphs, data tables and maps in this report use the following colours and shades to indicate rates of vulnerability. Darker colours represent higher rates of vulnerability.
YOUR COMMUNITY DATAThis community profile explores EDI data for Surrey School District and its neighbourhoods. It provides an overview of the patterns and trends in early child development for Wave 6 (2013-2016) and explores change over time from Wave 2 (2004-2007) through Wave 6, based on EDI data collected and analyzed for kindergarten children between 2004 and 2016. These data are reported based on children’s home postal codes and include all children who live in the school district. This includes children attending public schools and participating independent and Aboriginal schools. This profile also provides information on provincial-level results, intended to help communities situate local data in the broader provincial context.
Please note: Data are suppressed for school districts and neighbourhoods with fewer than 35 kindergarten children.
Figure 2. EDI scores and colour values
Phy
sica
l
Suppressed/No Data
100% 100%
PERC
ENT
VU
LNER
ABL
E 25% 45%
20% 40%
15% 35%
10% 30%
5% 25%
0% 20%
15%
Soc
ial
Em
otio
nal
Lang
uage
Com
mun
icat
ion
One
or M
ore
Sca
les
0%

8 - EDI COMMUNITY PROFILE
WAVE 6 SCHOOL YEAR
PARTICIPATED Y/N
# OF VALID EDI
2013/14 N 66
2014/15 N 160
2015/16 Y 4,834
Total District Participation 5,060
WAVE 6 PARTICIPATION
SCHOOL DISTRICT RESULTS
SD36 SURREY
Total District Participation refers to the total number of children in the school district for whom an EDI was completed.
Please note: EDI data are aggregated by school district of residence (where children live) using home postal code information. Some children attend school in districts other than where they live, therefore even in years when your district did not participate, some children may be included in the results.

WAVE 6 EDI RESULTS - 9
SOCIAL COMPETENCECooperation, respect for others, socially appropriate behaviour, self-control and self-confidence.
LANGUAGE & COGNITIVE DEVELOPMENTInterest in books, reading, language skills, literacy and math-related activities.
EMOTIONAL MATURITYTolerance, a focus on helping and the ability to demonstrate empathy for others.
PHYSICAL HEALTH & WELL-BEINGMotor control, energy level, daily preparedness for school and washroom independence.
COMMUNICATION SKILLS & GENERAL KNOWLEDGEAbility to clearly communicate one’s own needs, participate in story-telling, and general interest in the world.
VULNERABLE ON ONE OR MORE SCALESReports on the percentage of children who are vulnerable on one or more of the 5 scales of the EDI.
Total Number of Vulnerable ChildrenProvincial Average (Wave 6)
761
871
793
571
859
1711
15%
17%
16%
11%
17%
34%
Percent Vulnerable
WAVE 6 DATAWave 6 data show that in Surrey School District, 34% or 1711 children are experiencing vulnerabilities on at least one area of development in Wave 6. Figure 3 explores vulnerability rates across the five scales of the EDI.
Figure 3. Wave 6 EDI results for Surrey
1 IN 3 CHILDRENVULNERABLE
IN BC
SCHOOL DISTRICT RESULTS
The current provincial vulnerability rate (Wave 6) for children Vulnerable on One or More Scales of the EDI is 32.2%. This means about 1 in 3 children, or about 14,000 kindergarten students in the province, are starting school with vulnerabilities in one or more areas that are critical to their healthy development. This is a meaningful increase (i.e. worthy of attention) from the Wave 2 rate of 29.9% and a small shift from Wave 5 rate of 32.5%. Child vulnerability in the province has meaningfully increased over the last decade.
0% 25% 50% 75% 100%
0% 25% 50% 75% 100%

10 - EDI COMMUNITY PROFILE
0 %
10 %
20 %
30 %
40 %
50 %
60 %
WAVE 2 WAVE 3 WAVE 4 WAVE 5 WAVE 6
PER
CEN
T VU
LNER
AB
LE
11 12 14 14 15
13 12 15 17 17
11 11 12 14 16
12 11 10 10 11
16 14 16 17 17
30 28 32 34 34One or More Scales
Communication
Language
Emotional
Social
Physical
Note: Data is suppressed for waves when there are fewer than 35 kindergarten children in the school district.
For the summary measure Vulnerable on One or More Scales, the vulnerability rate was 34% in Wave 5 and 34% in Wave 6. This represents no meaningful change in childhood vulnerability for this time period. The longer-term trend shows that 30% of children were vulnerable in Wave 2 and 34% were vulnerable in Wave 6. This represents a meaningful increase in childhood vulnerability for this time period.
Collecting EDI data over multiple years allows for an improved understanding of trends in children’s development.
Figure 4 illustrates EDI vulnerability rates for each of the five scales and Vulnerable on One or More Scales across five points in time (Waves 2 through 6) for Surrey School District. These trend data help identify gradual changes and sustained rates in vulnerability across and between EDI scales over this period.
SCHOOL DISTRICT TRENDS
SCHOOL DISTRICT RESULTS
2004-07 2007-09 2009-11 2011-13 2013-16
PERC
ENT
VU
LNER
ABL
E
Figure 4. Surrey EDI trends from Wave 2 to 6

WAVE 6 EDI RESULTS - 11
Figure 5. Surrey results in a provincial context
SCHOOL DISTRICT RESULTS
Figure 5 illustrates Surrey’s vulnerability rates for each scale and the summary measure, Vulnerable on One or More Scales, for Wave 6 in comparison to results from all other school districts in the province. Each coloured bar in Figure 5 represents one school district’s vulnerability rate, which are ordered from lowest to highest vulnerability. The black bar represents this school district’s vulnerability rates.
See Figure 6 (Wave 6 EDI data for all school districts) on the following page for a detailed comparison of EDI results for all school districts in the province.
DIFFERENCES ACROSS BC SCHOOL DISTRICTS
There is a wide range in vulnerability rates across all BC school districts in Wave 6. Provincially, the range differs on each of the five EDI scales. The lowest school district-level vulnerability rate on the measure Vulnerable on One or More Scales is 9%, while the highest is 53%.
For individual scales, the lowest school district-level vulnerability rate in the province is found on the Communication Scale at 2% while the highest is on the Physical Health and Well-Being Scale at 32%.
0%
30%
60%
0%
30%
60%
PERC
ENT
VU
LNER
ABL
E
9%53%HIGHEST
LOWEST
VULNERABILITY RATES
34%
One or More Scales
15%
Physical Health & Well−Being
17%
Social Competence
16%
Emotional Maturity
11%
Language & Cognitive
17%
Communication

12 - EDI COMMUNITY PROFILE
495
314
206
505
473
1,089
1,433
550
1,020
1,201
265
310
232
1,071
287
501464
377
708
1,025
195
1,056
436
410
479
71
16
17
5
9
21
12
12
10
13
10
20
19
19
17
24
1819
11
14
17
19
13
12
15
19
6
16
15
3
13
18
14
18
12
16
12
18
26
23
16
21
1516
11
15
17
16
14
19
17
16
10
17
19
6
13
21
15
17
13
18
12
18
21
20
16
22
1717
12
18
18
21
16
20
16
20
6
8
8
3
5
17
7
8
7
9
6
13
27
15
11
14
1310
6
8
10
12
10
9
13
13
4
8
11
2
7
14
12
20
15
11
11
17
27
20
12
17
1514
7
13
13
13
10
12
12
16
4
29
35
9
22
38
28
35
30
31
25
36
51
40
30
40
3435
20
32
34
37
28
31
30
37
17
SaanichRocky Mountain
RichmondRevelstoke
QuesnelQualicum
Prince RupertPrince George
Powell RiverPeace River SouthPeace River North
Okanagan − SkahaOkanagan − Similkameen
North VancouverNorth Okanagan − Shuswap
Nisga'aNicola − Similkameen
New WestminsterNechako Lakes
Nanaimo − LadysmithMission
Maple Ridge − Pitt MeadowsLangley
Kootenay LakeKootenay − Columbia
Kamloops − Thompson
942
83
584
1,446
623
887
1,392
5,060
956
3,468
1,690
2,097
506
440
36
118
213272
1,467
825
268
549
475
752
144343
574
183
515
57248
1114
12
14
11
22
17
16
15
12
14
12
11
11
20
19
19
1723
14
14
17
18
21
13
3229
18
13
23
3223
13
11
10
14
21
17
16
17
13
17
17
14
14
14
8
16
2117
13
13
11
15
21
12
2320
18
11
18
2615
17
10
13
16
23
19
15
16
16
15
14
16
13
17
11
15
1721
15
15
15
14
23
14
1915
18
15
15
2625
5
6
10
7
15
11
9
11
8
9
9
8
5
5
14
8
139
6
7
8
12
11
9
1813
14
5
17
239
10
7
9
10
16
13
19
17
11
20
17
14
13
14
6
16
1517
11
10
11
16
17
8
2218
17
7
20
267
30
17
26
27
41
34
34
34
28
36
33
31
28
36
28
31
3339
28
27
29
32
40
28
5043
35
26
42
5341
West VancouverVernon
Vancouver Island WestVancouver Island North
VancouverSurrey
Sunshine CoastStikine
Southeast KootenaySooke
784 14 14 18 8 13 31Sea to Sky
Haida GwaiiGulf Islands
Greater VictoriaGold Trail
Fraser − CascadeFort Nelson
DeltaCowichan Valley
CoquitlamComox Valley
Coast MountainsChilliwack
Central OkanaganCentral Coast
Cariboo − ChilcotinCampbell River
BurnabyBulkley Valley
BoundaryArrow Lakes
AlberniAbbotsford
Tota
l Cou
nt
Phys
ical
Soci
al
Emot
iona
l
Lang
uage
Com
mun
icat
ion
One
or M
ore
Scal
es
Figure 6 illustrates the percentage of children vulnerable on each of the five scales and on Vulnerable on One or More Scales for all BC school districts.
Please note: data are suppressed where there are fewer than 35 kindergarten children.
Figure 6. Wave 6 EDI data for all school districts
SCHOOL DISTRICT RESULTS

WAVE 6 EDI RESULTS - 13
NEIGHBOURHOOD RESULTS
EDI data show that vulnerable children live in every neighbourhood in BC. Yet, these data reveal large differences in vulnerability rates between neighbourhoods, both within and across school districts. While some neighbourhoods are doing very well and sustain low vulnerability rates over time, others have seen high and sustained rates. On the summary measure Vulnerable on One or More Scales, Wave 6 data show some neighbourhoods are experiencing vulnerability rates as low as 9% while in others, up to 60% of children are vulnerable, a range of 51%.
Neighbourhoods – small or large, rural/remote or urban/suburban - have unique characteristics that provide important context for interpreting and applying EDI results. Reporting and mapping EDI data at the neighbourhood-level improves our understanding of the various factors influencing children’s development and health by highlighting geographic patterns and trends.
VULNERABLECHILDRENLIVE INEVERYNEIGHBOURHOOD
IN BC
The following section explores EDI data for neighbourhoods in this school district, highlighting Wave 6 results and exploring neighbourhood-level trends and patterns over time.
• NEIGHBOURHOOD VULNERABILITY RATES
• NEIGHBOURHOOD MAPS
• CHANGE OVER TIME
• NEIGHBOURHOOD PROFILES
“...vulnerable children in BC are not spread evenly throughoutthe province. EDI research reveals a large ‘geography of opportunity’ where some children face steep difficulties andothers do not...” - Dr. Clyde Hertzman

14 - EDI COMMUNITY PROFILE
171
109
268
160
107
362
170
373
270
131
168
167
180
294
240
225
310
274
137
281
114
184
178
187
16
6
9
7
13
16
18
16
17
11
15
26
17
13
15
24
17
19
12
10
10
9
25
11
23
14
11
8
17
16
20
19
17
10
20
20
15
24
19
20
17
18
15
15
17
14
28
13
18
11
9
7
19
16
24
17
15
8
15
19
13
15
20
21
21
16
9
16
13
13
20
13
13
3
8
4
7
7
12
13
11
7
10
16
12
18
14
18
10
15
15
8
1
5
22
11
21
7
8
8
9
11
18
23
21
14
15
21
19
22
16
25
15
24
13
14
16
10
30
13
39
21
19
19
31
28
35
38
36
25
33
40
33
40
35
47
36
39
31
31
32
26
51
29
66
23
52
31
33
102
60
143
97
33
56
67
60
119
85
106
113
107
42
86
37
48
91
54
Guildford West
Newton East
Newton West
Whalley North
Whalley Southwest
Surrey City Centre
Fleetwood Southwest
Newton Northeast
Fleetwood Northeast
Newton Northwest
Cloverdale North
Whalley West
Guildford Center
Rosemary
Clayton
Whalley Southeast
South Surrey East
Newton Southwest
Cloverdale South
South Surrey West
Guildford East
Whiterock
Semiahmoo
Newton Southeast
Tota
l Cou
nt
Phy
sica
l
Soc
ial
Em
otio
nal
Lang
uage
Com
mun
icat
ion
One
or M
ore
Sca
les
# Vu
lner
able
WAVE 6 NEIGHBOURHOOD VULNERABILITY RATES Figure 7 shows Wave 6 vulnerability rates for all neighbourhoods in Surrey School District, including rates for each of the five scales, Vulnerable on One or More Scales and the total number of children vulnerable on this summary measure.
Figure 7. Wave 6 neighbourhood results for Surrey
Please note: Data are suppressed for neighbourhoods with fewer than 35 kindergarten children.
NEIGHBOURHOOD RESULTS

EDI
% VULNERABLE
0%
20%
25%
100%
30%
35%
40%
45%
15%
No Data/Suppressed
VULNERABLE ON ONE OR MORE SCALES
Percent of children Vulnerable on One or More Scales of the EDI.
SCHOOL DISTRICT AVERAGE
34%PROVINCIAL AVERAGE
32.2%
For more information please visit:earlylearning.ubc.ca/maps/edi
SURREY (SD 36) WAVE 6

EDI
% VULNERABLE
5%
0%
10%
15%
20%
25%
100%
No Data/Suppressed
VULNERABILITY ON THE PHYSICAL HEALTH & WELL-BEING SCALEMeasures things such as motor development, energy level, daily preparedness for school, washroom independence and established handedness.
For more information please visit:earlylearning.ubc.ca/maps/edi
SURREY (SD 36) WAVE 6
SCHOOL DISTRICT AVERAGE
15%PROVINCIAL AVERAGE
14.8%

EDI
% VULNERABLE
5%
0%
10%
15%
20%
25%
100%
No Data/Suppressed
VULNERABILITY ON THE SOCIAL COMPETENCE SCALEMeasures behaviour in structuredenvironments including cooperation andrespect for others, socially appropriatebehaviour, self-control and self-confidence.
For more information please visit:earlylearning.ubc.ca/maps/edi
SURREY (SD 36) WAVE 6
SCHOOL DISTRICT AVERAGE
17%PROVINCIAL AVERAGE
15.7%
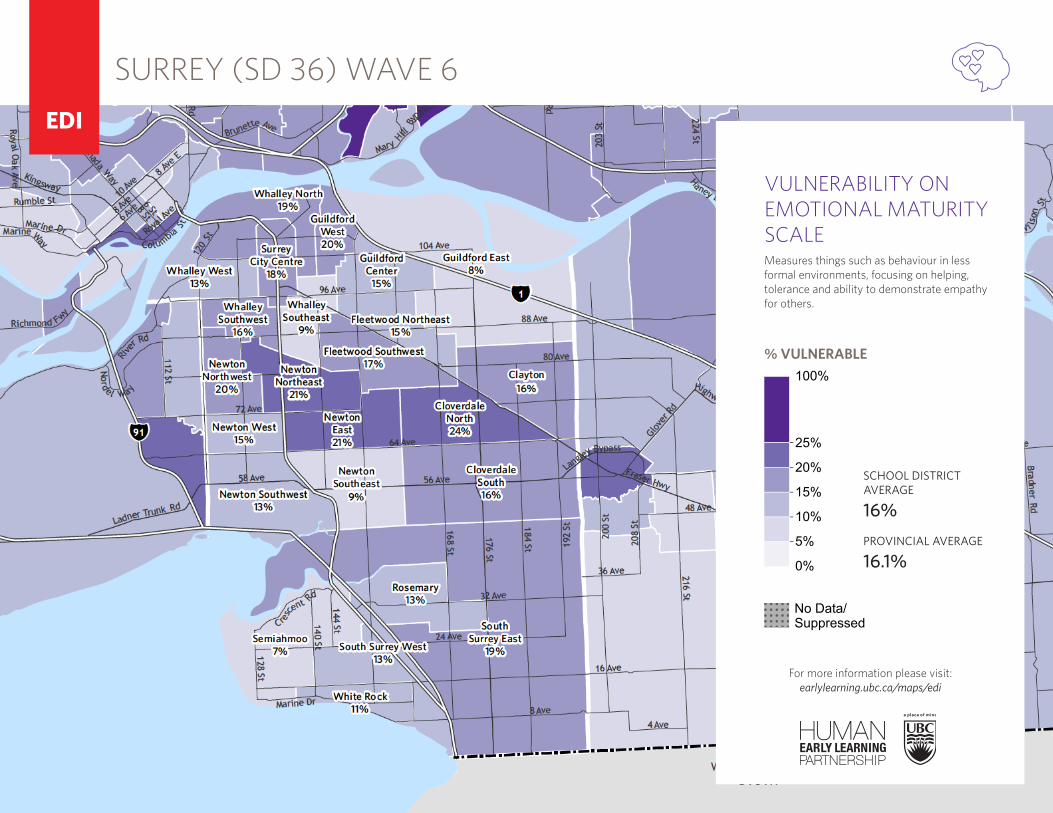
EDI
VULNERABILITY ON EMOTIONAL MATURITY SCALEMeasures things such as behaviour in less formal environments, focusing on helping, tolerance and ability to demonstrate empathy for others.
For more information please visit:earlylearning.ubc.ca/maps/edi
SURREY (SD 36) WAVE 6
% VULNERABLE
5%
0%
10%
15%
20%
25%
100%
No Data/Suppressed
SCHOOL DISTRICT AVERAGE
16%PROVINCIAL AVERAGE
16.1%

EDI
VULNERABILITY ON THE LANGUAGE & COGNITIVE SCALEMeasures things such as interest in books, reading, language-related activities, literacy and interest in simple math-related activities.
For more information please visit:earlylearning.ubc.ca/maps/edi
SURREY (SD 36) WAVE 6
% VULNERABLE
5%
0%
10%
15%
20%
25%
100%
No Data/Suppressed
SCHOOL DISTRICT AVERAGE
11%PROVINCIAL AVERAGE
9.4%

EDI
VULNERABILITY ON COMMUNICATION SKILLS SCALEMeasures things such as the ability to communicate one’s needs, understand others in English, actively participate in storytelling and general interest in the world.
For more information please visit:earlylearning.ubc.ca/maps/edi
SURREY (SD 36) WAVE 6
% VULNERABLE
5%
0%
10%
15%
20%
25%
100%
No Data/Suppressed
SCHOOL DISTRICT AVERAGE
17%PROVINCIAL AVERAGE
14.2%

EDI
SURREY (SD 36) WAVE 6
VULNERABLE ON ONE OR MORE SCALES
Percent of children Vulnerable on One or More Scales of the EDI.
For more information please visit:earlylearning.ubc.ca/maps/edi
STARPLOT
How to Read the Starplot:Each scale of the EDI isrepresented by a triangle. Larger triangles represent higher vulnerability and smaller triangles represent lower vulnerability foreach scale of the EDI.
% VULNERABLE
0%
20%
25%
100%
30%
35%
40%
45%
15%
No Data/Suppressed
40%30%20%10%
& Well-Being
Social
Cogn
itive
Emotional
Communication
Lang
uage
&
Competence
Develo
pmen
t
Skills50%
Physical Health
Maturity

8 - EDI COMMUNITY PROFILE
To learn more about meaningful change in vulnerability in your region, including trends for other EDI scales, visit your district’s interactive Critical Difference Map: www.earlylearning.ubc.ca/maps/edi/sd/36/#critDiff For more information on Critical Difference calculations visit: earlylearning.ubc.ca/supporting-research/critical-difference
WAVE 6 NEIGHBOURHOOD VULNERABILITY RATES Figure 7 shows Wave 6 vulnerability rates for all neighbourhoods in Surrey School District, including rates for each of the five scales, Vulnerable on One or More Scales and the total number of children vulnerable on this summary measure.
CHANGE OVER TIMECollecting EDI data over multiple waves allows us to explore trends in children’s development and to answer the broader question: “Are our kindergarten-aged children doing better, worse or about the same as in the past?” With each new wave of EDI data, vulnerability rates change across the province. While some neighbourhoods see improvements over time for particular aspects of children’s developmental health, others see declines. When looking at all of these changes over time it is important to identify the amount of change in vulnerability that is meaningful – i.e. change that is worthy of further exploration and discussion.
The following maps illustrate the recent (Wave 5 to 6) and long-term (Wave 2 to 6) trends in neighbourhood-level change in Surrey School District, highlighting neighbourhoods that have experienced:
- A meaningful increase in vulnerability
- A meaningful decrease in vulnerability
NEIGHBOURHOOD RESULTS
Figure 8. Number of neighbourhoods that have experienced meaningful changes in vulnerability
NUMBER OF NEIGHBOURHOODS
MEANINGFUL INCREASE
NO CHANGE
MEANINGFUL DECREASE N/A*
LONG-TERM TREND WAVE 2-6 9 15 0 0
RECENT TREND WAVE 5-6 4 16 4 0
*Please note: Neighbourhood trends are not available (N/A) if there are fewer than 35 kindergarten children in one or both waves.
Vulnerable on One or More Scales
22 - EDI COMMUNITY PROFILE
CHANGE OVER TIMECollecting EDI data over multiple waves allows us to explore trends in children’s development and to answer the broader question: “Are our kindergarten-aged children doing better, worse or about the same as in the past?” With each new wave of EDI data, vulnerability rates change across the province. While some neighbourhoods see improvements over time for particular aspects of children’s developmental health, others see declines. When looking at all of these changes over time it is important to identify the amount of change in vulnerability that is meaningful – i.e. change that is worthy of further exploration and discussion.
The following maps illustrate the recent (Wave 5 to 6) and long-term (Wave 2 to 6) trends in neighbourhood-level change in <<sd_name>> School District, highlighting neighbourhoods that have experienced:
- A meaningful increase in vulnerability
- A meaningful decrease in vulnerability
- No change in vulnerability Figure 8 provides a summary of the number of neighbourhoods that have experienced each type of trend over recent and long-term time periods.

EDI
SURREY (SD 36) WAVE 5 - 6
WAVE 5 - WAVE 6 MEANINGFUL CHANGE ON VULNERABLE ON ONE OR MORE SCALESCritical difference is a method that we use to determine whether a change in EDI vulnerability rates from one period to another (shown on this map), or between two neighbourhoods reflects a meaningful change in vulnerability, rather than a more minor change associated with measurement variations.
For more information please visit:earlylearning.ubc.ca/maps/edi
Change in EDI vulnerability rates
No Data/ Suppressed
Meaningful Decrease in Vulnerability
Meaningful Increase in Vulnerability
No Change
# of Neighbourhoods
4
0
4
16

EDI
0
15
For more information please visit:earlylearning.ubc.ca/maps/edi
SURREY (SD 36) WAVE 2 - 6
WAVE 2 - WAVE 6 MEANINGFUL CHANGE ON VULNERABLE ON ONE OR MORE SCALESCritical difference is a method that we use to determine whether a change in EDI vulnerability rates from one period to another (shown on this map), or between two neighbourhoods reflects a meaningful change in vulnerability, rather than a more minor change associated with measurement variations.
Change in EDI vulnerability rates
No Data/ Suppressed
Meaningful Decrease in Vulnerability
Meaningful Increase in Vulnerability
No Change
# of Neighbourhoods
9
0

NEIGHBOURHOOD PROFILES
WAVE 6 EDI COMMUNITY PROFILE
0 %
10 %
20 %
30 %
40 %
50 %
60 %
WAVE 2 WAVE 3 WAVE 4 WAVE 5 WAVE 6
PER
CEN
T VU
LNER
AB
LE
15 19 8 10 10
7 6 8 13 15
6 6 11 13 16
2 9 5 4 8
13 5 5 8 14
24 29 17 26 31One or More Scales
Communication
Language
Emotional
Social
Physical
PERC
ENT
VU
LNER
ABL
E
2004-07 2007-09 2009-11 2011-13 2013-16
CLAYTON
10%
15%
16%
8%
14%
31%
Percent Vulnerable
Physical
Social
Emotional
Language
Communication
One or More Scales
School District Average
29
# Vulnerable Children
42
45
22
39
86
NUMBER OF CHILDREN: 281
WAVE 6 CHANGE OVER TIMEOne or More Scales
LONG-TERM TREND (W2-W6)MEANINGFUL INCREASE
RECENT TREND (W5-W6)MEANINGUL INCREASE
0 25 50 75 100
0 %
10 %
20 %
30 %
40 %
50 %
60 %
WAVE 2 WAVE 3 WAVE 4 WAVE 5 WAVE 6
PER
CEN
T VU
LNER
AB
LE
3 7 8 11 18
9 7 8 18 20
10 11 9 19 24
6 10 8 5 12
6 6 13 10 18
20 22 18 34 35One or More Scales
Communication
Language
Emotional
Social
Physical
PERC
ENT
VU
LNER
ABL
E
2004-07 2007-09 2009-11 2011-13 2013-16
CLOVERDALE NORTH
18%
20%
24%
12%
18%
35%
Percent Vulnerable
Physical
Social
Emotional
Language
Communication
One or More Scales
School District Average
30
# Vulnerable Children
34
40
21
30
60
NUMBER OF CHILDREN: 170
WAVE 6 CHANGE OVER TIMEOne or More Scales
LONG-TERM TREND (W2-W6)MEANINGFUL INCREASE
RECENT TREND (W5-W6)NO MEANINGFUL CHANGE
0 25 50 75 100

NEIGHBOURHOOD PROFILES
WAVE 6 EDI COMMUNITY PROFILE
0 %
10 %
20 %
30 %
40 %
50 %
60 %
WAVE 2 WAVE 3 WAVE 4 WAVE 5 WAVE 6
PER
CEN
T VU
LNER
AB
LE
7 8 9 12 16
13 10 20 15 16
9 7 11 12 16
9 11 5 8 7
9 11 9 10 11
26 22 30 27 28One or More Scales
Communication
Language
Emotional
Social
Physical
PERC
ENT
VU
LNER
ABL
E
2004-07 2007-09 2009-11 2011-13 2013-16
CLOVERDALE SOUTH
16%
16%
16%
7%
11%
28%
Percent Vulnerable
Physical
Social
Emotional
Language
Communication
One or More Scales
School District Average
57
# Vulnerable Children
57
57
26
41
102
NUMBER OF CHILDREN: 362
WAVE 6 CHANGE OVER TIMEOne or More Scales
LONG-TERM TREND (W2-W6)NO MEANINGFUL CHANGE
RECENT TREND (W5-W6)NO MEANINGFUL CHANGE
0 25 50 75 100
0 %
10 %
20 %
30 %
40 %
50 %
60 %
WAVE 2 WAVE 3 WAVE 4 WAVE 5 WAVE 6
PER
CEN
T VU
LNER
AB
LE
8 12 14 16 17
8 12 18 18 17
8 11 15 13 15
7 8 8 11 11
12 11 18 18 21
24 24 34 35 36One or More Scales
Communication
Language
Emotional
Social
Physical
PERC
ENT
VU
LNER
ABL
E
2004-07 2007-09 2009-11 2011-13 2013-16
FLEETWOOD NORTHEAST
17%
17%
15%
11%
21%
36%
Percent Vulnerable
Physical
Social
Emotional
Language
Communication
One or More Scales
School District Average
45
# Vulnerable Children
47
41
30
56
97
NUMBER OF CHILDREN: 270
WAVE 6 CHANGE OVER TIMEOne or More Scales
LONG-TERM TREND (W2-W6)MEANINGFUL INCREASE
RECENT TREND (W5-W6)NO MEANINGFUL CHANGE
0 25 50 75 100

NEIGHBOURHOOD PROFILES
WAVE 6 EDI COMMUNITY PROFILE
0 %
10 %
20 %
30 %
40 %
50 %
60 %
WAVE 2 WAVE 3 WAVE 4 WAVE 5 WAVE 6
PER
CEN
T VU
LNER
AB
LE
13 9 13 12 16
15 11 17 15 19
14 10 11 12 17
14 13 11 9 13
17 10 13 15 23
31 25 33 31 38One or More Scales
Communication
Language
Emotional
Social
Physical
PERC
ENT
VU
LNER
ABL
E
2004-07 2007-09 2009-11 2011-13 2013-16
FLEETWOOD SOUTHWEST
16%
19%
17%
13%
23%
38%
Percent Vulnerable
Physical
Social
Emotional
Language
Communication
One or More Scales
School District Average
59
# Vulnerable Children
72
64
47
86
143
NUMBER OF CHILDREN: 373
WAVE 6 CHANGE OVER TIMEOne or More Scales
LONG-TERM TREND (W2-W6)MEANINGFUL INCREASE
RECENT TREND (W5-W6)MEANINGUL INCREASE
0 25 50 75 100
0 %
10 %
20 %
30 %
40 %
50 %
60 %
WAVE 2 WAVE 3 WAVE 4 WAVE 5 WAVE 6
PER
CEN
T VU
LNER
AB
LE
13 14 14 16 15
12 8 8 15 20
10 11 8 14 15
13 6 6 11 10
16 17 16 21 15
26 30 33 36 33One or More Scales
Communication
Language
Emotional
Social
Physical
PERC
ENT
VU
LNER
ABL
E
2004-07 2007-09 2009-11 2011-13 2013-16
GUILDFORD CENTER
15%
20%
15%
10%
15%
33%
Percent Vulnerable
Physical
Social
Emotional
Language
Communication
One or More Scales
School District Average
26
# Vulnerable Children
33
25
16
25
56
NUMBER OF CHILDREN: 168
WAVE 6 CHANGE OVER TIMEOne or More Scales
LONG-TERM TREND (W2-W6)MEANINGFUL INCREASE
RECENT TREND (W5-W6)NO MEANINGFUL CHANGE
0 25 50 75 100

NEIGHBOURHOOD PROFILES
WAVE 6 EDI COMMUNITY PROFILE
0 %
10 %
20 %
30 %
40 %
50 %
60 %
WAVE 2 WAVE 3 WAVE 4 WAVE 5 WAVE 6
PER
CEN
T VU
LNER
AB
LE
6 4 14 11 11
9 5 19 16 10
8 3 13 14 8
2 6 6 7 7
11 9 19 13 14
21 14 38 28 25One or More Scales
Communication
Language
Emotional
Social
Physical
PERC
ENT
VU
LNER
ABL
E
2004-07 2007-09 2009-11 2011-13 2013-16
GUILDFORD EAST
11%
10%
8%
7%
14%
25%
Percent Vulnerable
Physical
Social
Emotional
Language
Communication
One or More Scales
School District Average
15
# Vulnerable Children
13
11
9
18
33
NUMBER OF CHILDREN: 131
WAVE 6 CHANGE OVER TIMEOne or More Scales
LONG-TERM TREND (W2-W6)NO MEANINGFUL CHANGE
RECENT TREND (W5-W6)NO MEANINGFUL CHANGE
0 25 50 75 100
0 %
10 %
20 %
30 %
40 %
50 %
60 %
WAVE 2 WAVE 3 WAVE 4 WAVE 5 WAVE 6
PER
CEN
T VU
LNER
AB
LE
17 18 21 21 25
14 26 21 27 28
14 22 19 17 20
10 18 12 14 22
14 18 22 23 30
38 40 45 43 51One or More Scales
Communication
Language
Emotional
Social
Physical
PERC
ENT
VU
LNER
ABL
E
2004-07 2007-09 2009-11 2011-13 2013-16
GUILDFORD WEST
25%
28%
20%
22%
30%
51%
Percent Vulnerable
Physical
Social
Emotional
Language
Communication
One or More Scales
School District Average
44
# Vulnerable Children
50
36
39
53
91
NUMBER OF CHILDREN: 178
WAVE 6 CHANGE OVER TIMEOne or More Scales
LONG-TERM TREND (W2-W6)MEANINGFUL INCREASE
RECENT TREND (W5-W6)MEANINGUL INCREASE
0 25 50 75 100

NEIGHBOURHOOD PROFILES
WAVE 6 EDI COMMUNITY PROFILE
0 %
10 %
20 %
30 %
40 %
50 %
60 %
WAVE 2 WAVE 3 WAVE 4 WAVE 5 WAVE 6
PER
CEN
T VU
LNER
AB
LE
15 15 21 26 24
11 16 21 23 20
14 10 16 21 21
13 14 12 15 18
12 21 26 25 25
35 36 46 50 47One or More Scales
Communication
Language
Emotional
Social
Physical
PERC
ENT
VU
LNER
ABL
E
2004-07 2007-09 2009-11 2011-13 2013-16
NEWTON EAST
24%
20%
21%
18%
25%
47%
Percent Vulnerable
Physical
Social
Emotional
Language
Communication
One or More Scales
School District Average
55
# Vulnerable Children
44
47
40
57
106
NUMBER OF CHILDREN: 225
WAVE 6 CHANGE OVER TIMEOne or More Scales
LONG-TERM TREND (W2-W6)MEANINGFUL INCREASE
RECENT TREND (W5-W6)NO MEANINGFUL CHANGE
0 25 50 75 100
0 %
10 %
20 %
30 %
40 %
50 %
60 %
WAVE 2 WAVE 3 WAVE 4 WAVE 5 WAVE 6
PER
CEN
T VU
LNER
AB
LE
9 15 12 19 17
17 15 16 25 17
12 11 13 19 21
19 15 13 14 10
20 17 17 23 15
40 31 33 42 36One or More Scales
Communication
Language
Emotional
Social
Physical
PERC
ENT
VU
LNER
ABL
E
2004-07 2007-09 2009-11 2011-13 2013-16
NEWTON NORTHEAST
17%
17%
21%
10%
15%
36%
Percent Vulnerable
Physical
Social
Emotional
Language
Communication
One or More Scales
School District Average
52
# Vulnerable Children
52
63
31
47
113
NUMBER OF CHILDREN: 310
WAVE 6 CHANGE OVER TIMEOne or More Scales
LONG-TERM TREND (W2-W6)NO MEANINGFUL CHANGE
RECENT TREND (W5-W6)MEANINGFUL DECREASE
0 25 50 75 100

NEIGHBOURHOOD PROFILES
WAVE 6 EDI COMMUNITY PROFILE
0 %
10 %
20 %
30 %
40 %
50 %
60 %
WAVE 2 WAVE 3 WAVE 4 WAVE 5 WAVE 6
PER
CEN
T VU
LNER
AB
LE
13 8 12 14 15
13 10 19 19 19
8 8 15 11 20
10 8 12 17 14
20 18 23 28 16
31 27 38 41 35One or More Scales
Communication
Language
Emotional
Social
Physical
PERC
ENT
VU
LNER
ABL
E
2004-07 2007-09 2009-11 2011-13 2013-16
NEWTON NORTHWEST
15%
19%
20%
14%
16%
35%
Percent Vulnerable
Physical
Social
Emotional
Language
Communication
One or More Scales
School District Average
37
# Vulnerable Children
45
48
34
39
85
NUMBER OF CHILDREN: 240
WAVE 6 CHANGE OVER TIMEOne or More Scales
LONG-TERM TREND (W2-W6)NO MEANINGFUL CHANGE
RECENT TREND (W5-W6)MEANINGFUL DECREASE
0 25 50 75 100
0 %
10 %
20 %
30 %
40 %
50 %
60 %
WAVE 2 WAVE 3 WAVE 4 WAVE 5 WAVE 6
PER
CEN
T VU
LNER
AB
LE
7 4 8 6 9
9 6 8 9 11
9 7 6 6 9
10 5 4 4 8
16 5 6 12 8
25 14 18 22 19One or More Scales
Communication
Language
Emotional
Social
Physical
PERC
ENT
VU
LNER
ABL
E
2004-07 2007-09 2009-11 2011-13 2013-16
NEWTON SOUTHEAST
9%
11%
9%
8%
8%
19%
Percent Vulnerable
Physical
Social
Emotional
Language
Communication
One or More Scales
School District Average
24
# Vulnerable Children
30
24
22
21
52
NUMBER OF CHILDREN: 268
WAVE 6 CHANGE OVER TIMEOne or More Scales
LONG-TERM TREND (W2-W6)NO MEANINGFUL CHANGE
RECENT TREND (W5-W6)NO MEANINGFUL CHANGE
0 25 50 75 100

NEIGHBOURHOOD PROFILES
WAVE 6 EDI COMMUNITY PROFILE
0 %
10 %
20 %
30 %
40 %
50 %
60 %
WAVE 2 WAVE 3 WAVE 4 WAVE 5 WAVE 6
PER
CEN
T VU
LNER
AB
LE
8 12 15 10 11
12 8 8 20 13
9 9 10 17 13
19 9 14 15 11
16 10 17 18 13
33 27 29 37 29One or More Scales
Communication
Language
Emotional
Social
Physical
PERC
ENT
VU
LNER
ABL
E
2004-07 2007-09 2009-11 2011-13 2013-16
NEWTON SOUTHWEST
11%
13%
13%
11%
13%
29%
Percent Vulnerable
Physical
Social
Emotional
Language
Communication
One or More Scales
School District Average
21
# Vulnerable Children
24
24
21
24
54
NUMBER OF CHILDREN: 187
WAVE 6 CHANGE OVER TIMEOne or More Scales
LONG-TERM TREND (W2-W6)NO MEANINGFUL CHANGE
RECENT TREND (W5-W6)MEANINGFUL DECREASE
0 25 50 75 100
0 %
10 %
20 %
30 %
40 %
50 %
60 %
WAVE 2 WAVE 3 WAVE 4 WAVE 5 WAVE 6
PER
CEN
T VU
LNER
AB
LE
18 15 16 17 13
16 16 17 18 24
16 17 12 15 15
17 17 14 13 18
26 28 24 25 22
38 44 39 39 40One or More Scales
Communication
Language
Emotional
Social
Physical
PERC
ENT
VU
LNER
ABL
E
2004-07 2007-09 2009-11 2011-13 2013-16
NEWTON WEST
13%
24%
15%
18%
22%
40%
Percent Vulnerable
Physical
Social
Emotional
Language
Communication
One or More Scales
School District Average
39
# Vulnerable Children
70
44
52
66
119
NUMBER OF CHILDREN: 294
WAVE 6 CHANGE OVER TIMEOne or More Scales
LONG-TERM TREND (W2-W6)NO MEANINGFUL CHANGE
RECENT TREND (W5-W6)NO MEANINGFUL CHANGE
0 25 50 75 100
NEIGHBOURHOOD PROFILES
WAVE 6 EDI COMMUNITY PROFILE
0 %
10 %
20 %
30 %
40 %
50 %
60 %
WAVE 2 WAVE 3 WAVE 4 WAVE 5 WAVE 6
PER
CEN
T VU
LNER
AB
LE
2 4 4 13 10
5 4 6 11 17
4 4 7 14 13
2 3 2 6 1
4 4 3 13 16
9 10 15 32 32One or More Scales
Communication
Language
Emotional
Social
Physical
PERC
ENT
VU
LNER
ABL
E
2004-07 2007-09 2009-11 2011-13 2013-16
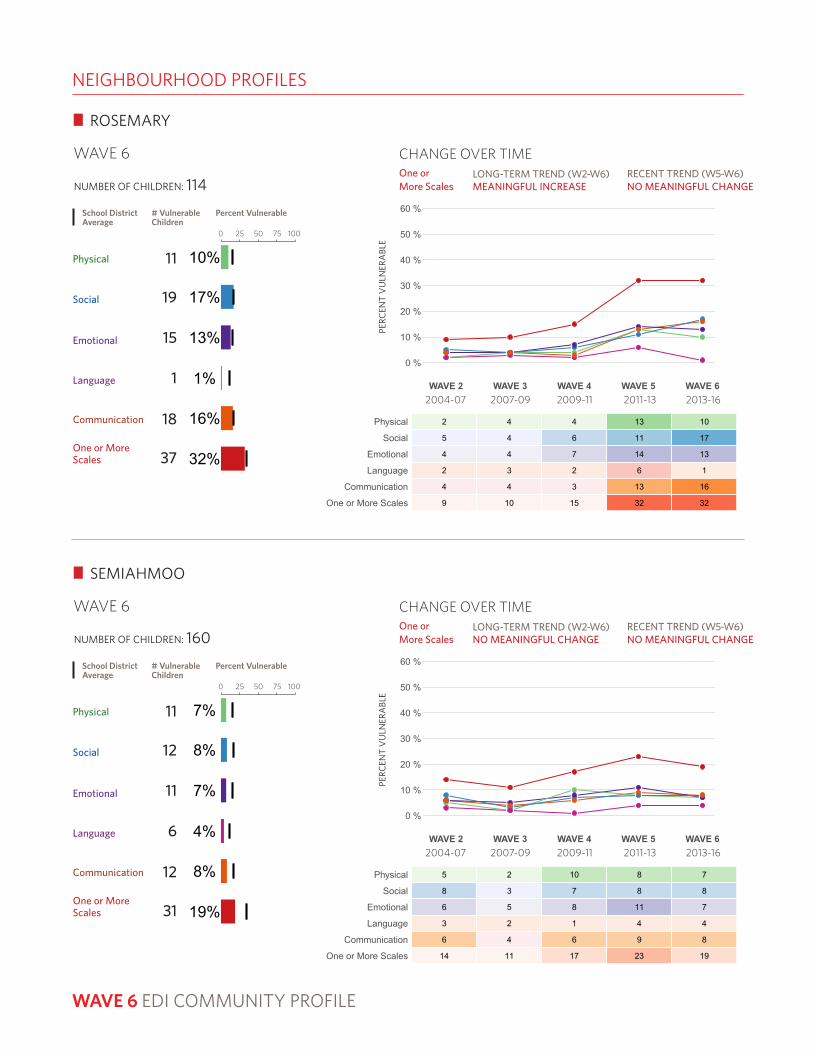
ROSEMARY
10%
17%
13%
1%
16%
32%
Percent Vulnerable
Physical
Social
Emotional
Language
Communication
One or More Scales
School District Average
11
# Vulnerable Children
19
15
1
18
37
NUMBER OF CHILDREN: 114
WAVE 6 CHANGE OVER TIMEOne or More Scales
LONG-TERM TREND (W2-W6)MEANINGFUL INCREASE
RECENT TREND (W5-W6)NO MEANINGFUL CHANGE
0 25 50 75 100
0 %
10 %
20 %
30 %
40 %
50 %
60 %
WAVE 2 WAVE 3 WAVE 4 WAVE 5 WAVE 6
PER
CEN
T VU
LNER
AB
LE
5 2 10 8 7
8 3 7 8 8
6 5 8 11 7
3 2 1 4 4
6 4 6 9 8
14 11 17 23 19One or More Scales
Communication
Language
Emotional
Social
Physical
PERC
ENT
VU
LNER
ABL
E
2004-07 2007-09 2009-11 2011-13 2013-16
SEMIAHMOO
7%
8%
7%
4%
8%
19%
Percent Vulnerable
Physical
Social
Emotional
Language
Communication
One or More Scales
School District Average
11
# Vulnerable Children
12
11
6
12
31
NUMBER OF CHILDREN: 160
WAVE 6 CHANGE OVER TIMEOne or More Scales
LONG-TERM TREND (W2-W6)NO MEANINGFUL CHANGE
RECENT TREND (W5-W6)NO MEANINGFUL CHANGE
0 25 50 75 100

NEIGHBOURHOOD PROFILES
WAVE 6 EDI COMMUNITY PROFILE
0 %
10 %
20 %
30 %
40 %
50 %
60 %
WAVE 2 WAVE 3 WAVE 4 WAVE 5 WAVE 6
PER
CEN
T VU
LNER
AB
LE
10 7 8 13 13
12 12 7 24 17
8 7 14 13 19
14 12 10 8 7
14 7 14 18 9
27 21 22 35 31One or More Scales
Communication
Language
Emotional
Social
Physical
PERC
ENT
VU
LNER
ABL
E
2004-07 2007-09 2009-11 2011-13 2013-16
SOUTH SURREY EAST
13%
17%
19%
7%
9%
31%
Percent Vulnerable
Physical
Social
Emotional
Language
Communication
One or More Scales
School District Average
14
# Vulnerable Children
18
20
7
10
33
NUMBER OF CHILDREN: 107
WAVE 6 CHANGE OVER TIMEOne or More Scales
LONG-TERM TREND (W2-W6)NO MEANINGFUL CHANGE
RECENT TREND (W5-W6)NO MEANINGFUL CHANGE
0 25 50 75 100
0 %
10 %
20 %
30 %
40 %
50 %
60 %
WAVE 2 WAVE 3 WAVE 4 WAVE 5 WAVE 6
PER
CEN
T VU
LNER
AB
LE
8 4 4 11 9
10 10 9 17 14
8 12 10 14 13
11 7 6 8 5
5 7 10 12 10
22 21 20 30 26One or More Scales
Communication
Language
Emotional
Social
Physical
PERC
ENT
VU
LNER
ABL
E
2004-07 2007-09 2009-11 2011-13 2013-16
SOUTH SURREY WEST
9%
14%
13%
5%
10%
26%
Percent Vulnerable
Physical
Social
Emotional
Language
Communication
One or More Scales
School District Average
17
# Vulnerable Children
25
24
9
19
48
NUMBER OF CHILDREN: 184
WAVE 6 CHANGE OVER TIMEOne or More Scales
LONG-TERM TREND (W2-W6)NO MEANINGFUL CHANGE
RECENT TREND (W5-W6)NO MEANINGFUL CHANGE
0 25 50 75 100

NEIGHBOURHOOD PROFILES
WAVE 6 EDI COMMUNITY PROFILE
0 %
10 %
20 %
30 %
40 %
50 %
60 %
WAVE 2 WAVE 3 WAVE 4 WAVE 5 WAVE 6
PER
CEN
T VU
LNER
AB
LE
17 23 23 12 16
18 19 27 14 23
18 16 20 14 18
22 17 14 6 13
21 14 18 12 21
42 37 40 31 39One or More Scales
Communication
Language
Emotional
Social
Physical
PERC
ENT
VU
LNER
ABL
E
2004-07 2007-09 2009-11 2011-13 2013-16
SURREY CITY CENTRE
16%
23%
18%
13%
21%
39%
Percent Vulnerable
Physical
Social
Emotional
Language
Communication
One or More Scales
School District Average
27
# Vulnerable Children
39
31
23
36
66
NUMBER OF CHILDREN: 171
WAVE 6 CHANGE OVER TIMEOne or More Scales
LONG-TERM TREND (W2-W6)NO MEANINGFUL CHANGE
RECENT TREND (W5-W6)MEANINGUL INCREASE
0 25 50 75 100
0 %
10 %
20 %
30 %
40 %
50 %
60 %
WAVE 2 WAVE 3 WAVE 4 WAVE 5 WAVE 6
PER
CEN
T VU
LNER
AB
LE
12 24 21 16 26
16 20 18 15 20
14 24 14 15 19
8 15 15 11 16
9 20 22 14 21
31 46 43 37 40One or More Scales
Communication
Language
Emotional
Social
Physical
PERC
ENT
VU
LNER
ABL
E
2004-07 2007-09 2009-11 2011-13 2013-16
WHALLEY NORTH
26%
20%
19%
16%
21%
40%
Percent Vulnerable
Physical
Social
Emotional
Language
Communication
One or More Scales
School District Average
43
# Vulnerable Children
34
32
27
35
67
NUMBER OF CHILDREN: 167
WAVE 6 CHANGE OVER TIMEOne or More Scales
LONG-TERM TREND (W2-W6)MEANINGFUL INCREASE
RECENT TREND (W5-W6)NO MEANINGFUL CHANGE
0 25 50 75 100

NEIGHBOURHOOD PROFILES
WAVE 6 EDI COMMUNITY PROFILE
0 %
10 %
20 %
30 %
40 %
50 %
60 %
WAVE 2 WAVE 3 WAVE 4 WAVE 5 WAVE 6
PER
CEN
T VU
LNER
AB
LE
10 7 18 10 12
9 11 16 10 15
7 6 13 9 9
10 9 12 11 15
17 12 17 21 13
25 24 32 29 31One or More Scales
Communication
Language
Emotional
Social
Physical
PERC
ENT
VU
LNER
ABL
E
2004-07 2007-09 2009-11 2011-13 2013-16
WHALLEY SOUTHEAST
12%
15%
9%
15%
13%
31%
Percent Vulnerable
Physical
Social
Emotional
Language
Communication
One or More Scales
School District Average
16
# Vulnerable Children
20
13
21
18
42
NUMBER OF CHILDREN: 137
WAVE 6 CHANGE OVER TIMEOne or More Scales
LONG-TERM TREND (W2-W6)NO MEANINGFUL CHANGE
RECENT TREND (W5-W6)NO MEANINGFUL CHANGE
0 25 50 75 100
0 %
10 %
20 %
30 %
40 %
50 %
60 %
WAVE 2 WAVE 3 WAVE 4 WAVE 5 WAVE 6
PER
CEN
T VU
LNER
AB
LE
10 20 18 22 19
16 16 16 22 18
15 18 13 13 16
15 20 16 18 15
26 19 21 25 24
40 40 38 45 39One or More Scales
Communication
Language
Emotional
Social
Physical
PERC
ENT
VU
LNER
ABL
E
2004-07 2007-09 2009-11 2011-13 2013-16
WHALLEY SOUTHWEST
19%
18%
16%
15%
24%
39%
Percent Vulnerable
Physical
Social
Emotional
Language
Communication
One or More Scales
School District Average
52
# Vulnerable Children
49
43
42
66
107
NUMBER OF CHILDREN: 274
WAVE 6 CHANGE OVER TIMEOne or More Scales
LONG-TERM TREND (W2-W6)NO MEANINGFUL CHANGE
RECENT TREND (W5-W6)MEANINGFUL DECREASE
0 25 50 75 100

NEIGHBOURHOOD PROFILES
WAVE 6 EDI COMMUNITY PROFILE
0 %
10 %
20 %
30 %
40 %
50 %
60 %
WAVE 2 WAVE 3 WAVE 4 WAVE 5 WAVE 6
PER
CEN
T VU
LNER
AB
LE
11 11 17 16 17
14 13 14 10 15
10 11 12 11 13
16 9 11 8 12
23 10 22 17 19
33 24 34 30 33One or More Scales
Communication
Language
Emotional
Social
Physical
PERC
ENT
VU
LNER
ABL
E
2004-07 2007-09 2009-11 2011-13 2013-16
WHALLEY WEST
17%
15%
13%
12%
19%
33%
Percent Vulnerable
Physical
Social
Emotional
Language
Communication
One or More Scales
School District Average
30
# Vulnerable Children
27
23
22
35
60
NUMBER OF CHILDREN: 180
WAVE 6 CHANGE OVER TIMEOne or More Scales
LONG-TERM TREND (W2-W6)NO MEANINGFUL CHANGE
RECENT TREND (W5-W6)NO MEANINGFUL CHANGE
0 25 50 75 100
0 %
10 %
20 %
30 %
40 %
50 %
60 %
WAVE 2 WAVE 3 WAVE 4 WAVE 5 WAVE 6
PER
CEN
T VU
LNER
AB
LE
17 4 10 11 6
15 18 11 15 14
11 10 10 16 11
5 6 6 3 3
9 8 8 6 7
27 30 25 27 21One or More Scales
Communication
Language
Emotional
Social
Physical
PERC
ENT
VU
LNER
ABL
E
2004-07 2007-09 2009-11 2011-13 2013-16
WHITEROCK
6%
14%
11%
3%
7%
21%
Percent Vulnerable
Physical
Social
Emotional
Language
Communication
One or More Scales
School District Average
7
# Vulnerable Children
15
12
3
8
23
NUMBER OF CHILDREN: 109
WAVE 6 CHANGE OVER TIMEOne or More Scales
LONG-TERM TREND (W2-W6)NO MEANINGFUL CHANGE
RECENT TREND (W5-W6)NO MEANINGFUL CHANGE
0 25 50 75 100

WAVE 6 EDI RESULTS
0
9
15
0
USING EDI RESULTS IN COMMUNITIES
“EDI results are an important catalyst to further the work we do in communities to improve child outcomes. The results, in isolation, don’t prescribe our local actions. They do, however, allow us to focus our efforts in particular neighbourhoods and areas of child development; to monitor the impact of our collaborative work; and most importantly, to engage new partners in the importance of supporting children in their earliest years.”
- Joanne Schroeder, Comox Valley Child Development Association
EDI data are a foundation for furthering understanding about children’s development in our communities. While they do not point to specific solutions, these data provide a common starting point for new areas of inquiry and collaborative conversations across sectors. From this process of planning and decision-making, new ideas for investment and action can emerge.
The following section outlines suggested approaches for exploring and using EDI data in communities.
A FOCUS ON LOCALEDI data are useful for exploring early childhood outcomes at a neighbourhood-level while also placing these data within the larger regional and provincial contexts. Interpreting EDI data through a local lens can enhance the work of community, planners, coalitions and governments in decision-making and priority setting to improve early child development. Neighbourhood EDI profiles and maps can support this approach.
USING COMPLEMENTARY DATAEDI data are particularly valuable when used alongside other data and information including census, administrative health and education data, community knowledge and expertise, and information on local services and programs. Listening to the experiences of parents and caregivers can also provide important context to guide conversations and planning efforts.

USING EDI RESULTS IN COMMUNITIES
COLLABORATIVE CONVERSATIONSEDI data can provide a platform for facilitating discussion and inquiry across sectors on the status of early child development in communities. Start with highlighting strengths in the data and identifying long-term trends.
It is valuable to explore the main themes included in this report as a starting point for these conversations:
1. What are the major changes or trends in EDI vulnerability at the school district and neighbourhood-level?
• HELP’s interactive Critical Difference Tool allows to you broaden your exploration in this area by looking atthe meaningful change over time in each neighbourhood’s vulnerability rate on any five EDI scales, or onVulnerability On One or More Scales. Visit www.earlylearning.ubc.ca/maps/edi/sd/36/#critDiff to learn more.
2. Are there particular areas of child development that are pressing in the region and in each neighbourhood?
• Compare vulnerability rates on each of the scales of the EDI. It is important to remember that all areas ofdevelopment captured on the EDI are interconnected. EDI subscale data, available for BC school districtsin 2017, provide increasingly specific information on children’s developmental health, strengthening ourunderstanding of the influences contributing to their developmental vulnerabilities. Subscale data need tobe seen in the context of the whole child and should not be used to select isolated programs that have asingular focus on one particular area of development.
3. What underlying factors might explain the differences that exist in neighbourhood-level vulnerability in yourregion?
• Neighbourhood differences can be explained by a wide range of factors including social and economicdifferences, variations in community networks and collaborations that support children and families, andalso the number, quality and accessibility of programs.
• The large variation in vulnerability rates across neighbourhoods in the province demonstrates that theexperiences of children vary greatly from one neighbourhood to the next. This is explored through mappingEDI data. Explore HELP’s interactive EDI maps to learn more: earlylearning.ubc.ca/interactive-map.
DECISION-MAKING AND ACTIONAs a stronger and shared understanding of child vulnerability emerges through conversation and inquiry in a community or region, it is possible to move toward a collective plan of action. This process might include the creation of a shared vision across organizations and sectors, collective strategic planning, partnership development, and finally the selection of new actions and initiatives.
CONNECT WITH LOCAL EDI LEADSLearn more about initiatives in your community by connecting with local early childhood coalitions, public partners committees, school district or local leadership, planning or advocacy groups. Visit www.earlylearning.ubc.ca/maps/edi/sd/36/#contacts to connect with your local EDI leads.
EDI COMMUNITY PROFILE

WAVE 6 EDI RESULTS
Visit www.earlylearning.ubc.ca/maps/edi/sd/36/ to learn more about your results.
EDI CONTACT [email protected]
FOLLOW US ON SOCIAL MEDIA
HELP Twitter @HELP_UBC
HELP Facebook facebook.com/HumanEarlyLearningPartnership
EXPLORE OUR WEBSITE earlylearning.ubc.ca
RESOURCESTHE OFFORD CENTRE FOR CHILD STUDIES edi.offordcentre.com
HELP’S EDI RESOURCES earlylearning.ubc.ca/edi
INTERACTIVE EDI MAPS earlylearning.ubc.ca/interactive-map
HELP FACT SHEETS
• The Early Development Instrument (EDI) earlylearning.ubc.ca/documents/478
• Vulnerability on the EDI earlylearning.ubc.ca/documents/68
• Proportionate Universality earlylearning.ubc.ca/documents/475
• What Makes a Difference for Early Child Development earlylearning.ubc.ca/documents/304
CONTACTS