school attendance data from primary and post-primary schools · school attendance data from primary...
TRANSCRIPT

School Attendance Data
from Primary and Post-Primary Schools
2011/12
[under Section 21(6) of the Education (Welfare) Act 2000]
Analysis and Report to the Child and Family Agency
David Millar
Educational Research Centre
Table of Contents
Executive Summary i
Introduction 1
Section 1: Non-Attendance Data, 2007/08 to 2011/12 2
1.1 Response Rate 2
1.2 Results of the Annual Attendance Report 3
1.2.1 Non-Attendance 3
1.2.2 Twenty-Day Absences 4
1.2.3 Expulsions 5
1.2.4 Suspensions 5
1.3 Aspects of Non-Attendance 6
1.3.1 Non-Attendance in the Population and in Schools 6
1.3.2 Precision of Non-Attendance Figures 6
1.3.3 Other formulations of Non-Attendance Rates 7
Section 2: Non-Attendance in Primary Schools, 2011/12 8
2.1 Non-Attendance by School Type 8
2.2 Non-Attendance in Urban and Rural Schools 8
2.3 DEIS Categories and Non-Attendance 10
2.4 Non-Attendance by Province and County 11
Section 3: Non-Attendance in Post-Primary Schools, 2011/12 13
3.1 Secondary, Vocational, and Community/Comprehensive 13
Schools
3.2 DEIS and Non-Attendance 14
3.3 Non-Attendance by Province and County 14
References 16
Appendix 17
i
Executive Summary
Response of schools to annual attendance reporting requirements rose to their
highest levels for both primary and post-primary in 2011/12
The Annual Attendance Report represents a de facto census. Response rates
were 99.1% for both the primary and post-primary sectors.
Figures for General Non-Attendance lower for 2011/12
The percentage of overall student/days lost through absence in a school year
was 5.8% in primary schools and 7.7% in post-primary schools. The figures at
both levels for 2011/12 are lower than for 2010/11 and are at the lowest for the
five year period 2007/08 – 2011/12.
Approximately 55,000 students on average miss school each day, consisting of
approximately 30,000 primary and 24,800 post-primary students. This equates
to a loss of 11 school days for a primary school student from the required 183-
day school year and 13 days for a post-primary student from the 167-day
school year.
Figures for Twenty-Day Absences stable for primary school pupils but lower for
post-primary students
In primary schools 11.1% of pupils were absent for twenty days or more, the
same figure as the previous year. The figure for twenty-day absences in post-
primary schools was 16.1% in 2011/12 (0.4% lower compared to 2010/11).
Based on population numbers this represents approximately 57,500 primary
school students, and 52,000 post-primary students.
Non-Attendance remains higher in Special Schools
In the primary school sector non-attendance remains substantially higher in
special schools and higher in ordinary schools with special classes.
Non-Attendance in Primary School Higher in Urban Areas
Rates of non-attendance in primary schools are higher in towns and cities than
they are in rural areas. This is particularly apparent in terms of the percentage
of pupils absent for twenty days or more where rates of 20-day absences are
almost double the rural rate. This pattern remains stable year-on-year.
ii
Non-Attendance higher in schools serving disadvantaged areas, but falling
In primary schools non-attendance is generally higher in schools involved in
the DEIS School Support Programme (SSP) for designated schools serving
socio-economically disadvantaged communities. However, there continues to
be an important urban/rural dimension in non-attendance when DEIS and non-
DEIS primary schools are compared. General non-attendance and twenty-day
absences are higher in urban schools outside DEIS than they are in rural
schools within the DEIS programme. This pattern is stable year-on-year.
In post-primary schools all forms of non-attendance were higher in schools
within the DEIS programme. Around 27% of students in these schools were
absent for twenty days or more in 2011/12. This figure is down 1.5% from
2010/11 and down approximately 3% from 2009/10. In schools outside DEIS
the figure for 20-day absences was 14.2% for 2011/12, down 0.4% on the
previous year.
Expulsions Still Rare
Only 26 expulsions were reported in primary schools in 2011/12 (25 in
2010/11). The corresponding figures in post-primary schools showed an
increase of 50 in 2011/12 (186 students, accounting for less than 0.06% of
students).
Suspensions Occur Mostly in Post-Primary Schools
Less than 5% of post-primary students were suspended in 2011/12. However,
there was a small increase from 4.4% to 4.7% when compared to 2010/11.
Just 0.2 % of primary pupils were suspended in 2011/12.
Irish non-attendance figures similar to those in Northern Ireland and the UK
Non-attendance in Irish primary schools was 5.8% of student/days in 2011/12
(removing data for special schools) compared to between 4.4% and 6.2% for
Northern Ireland, England and Wales. Non-attendance for Irish post-primary
schools was 7.7% of student days, compared to between 5.7% and 7.8% in
neighbouring jurisdictions.
iii
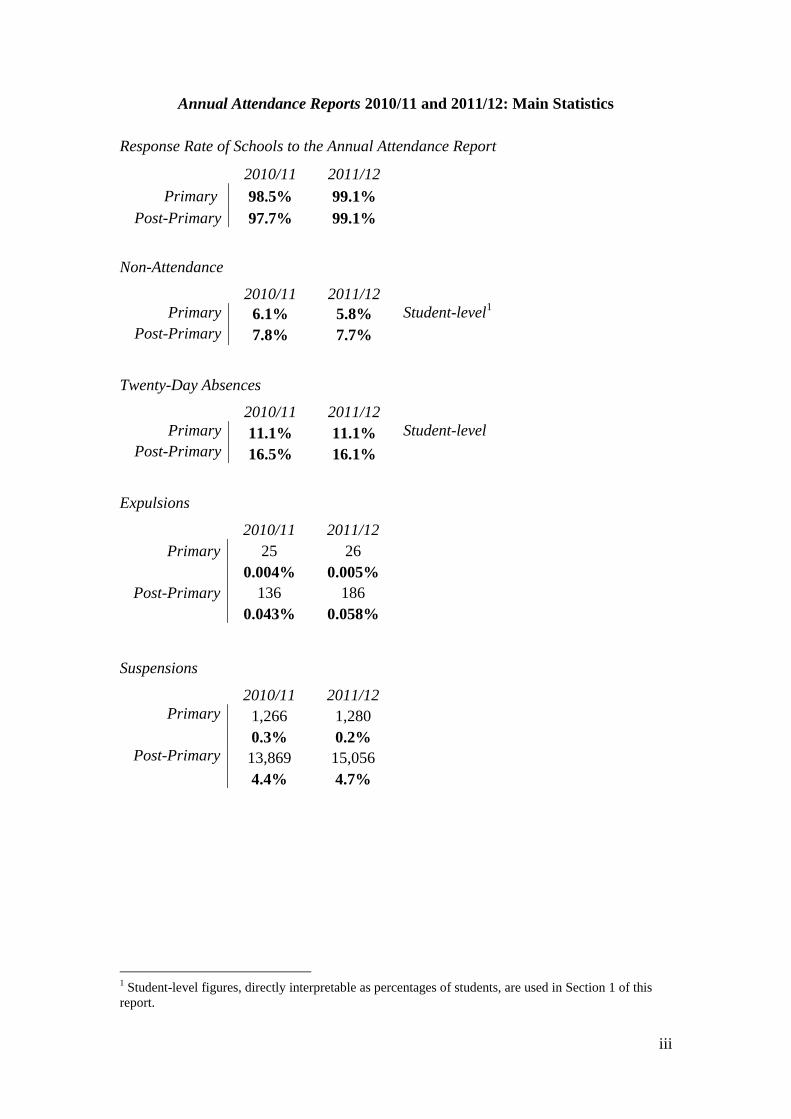
Annual Attendance Reports 2010/11 and 2011/12: Main Statistics
Response Rate of Schools to the Annual Attendance Report
2010/11 2011/12
Primary 98.5% 99.1%
Post-Primary 97.7% 99.1%
Non-Attendance
2010/11 2011/12
Primary 6.1% 5.8% Student-level1
Post-Primary 7.8% 7.7%
Twenty-Day Absences
2010/11 2011/12
Primary 11.1% 11.1% Student-level
Post-Primary 16.5% 16.1%
Expulsions
Suspensions
2010/11 2011/12
Primary 1,266 1,280
0.3% 0.2%
Post-Primary 13,869 15,056
4.4% 4.7%
1 Student-level figures, directly interpretable as percentages of students, are used in Section 1 of this
report.
2010/11 2011/12
Primary 25 26
0.004% 0.005%
Post-Primary 136 186
0.043% 0.058%
1
Introduction
This is the first report to the Child and Family Agency in this series. With the
establishment of the Agency on 1 January 2014, the former National Educational
Welfare Board (NEWB) was dissolved and its functions under the Education
(Welfare) Act 2000 transferred to the Agency. The obligation on schools under
Sections 21(6) of the Act of 2000 (the Annual Attendance Report) is not affected.
Data on non-attendance in primary and post-primary schools are collected by the
through the Annual Attendance Report (AAR) requirement on schools. Data for the
years 2003/04 through to 2010/11 are the focus of the earlier reports (Weir (2004), Ó
Briain (2006), Mac Aogáin (2008), Millar (2010, 2011, 2012, 2013)). This report
deals with data for the academic year 2011/12 and links to the data reported
previously.
The report is in three sections:
1 Non-Attendance from 2007/08 to 2011/12, integrating the 2011/12 NEWB
data with summary statistics for the five-year period, and a discussion of
issues relating to the data set as a whole.
2 Non-Attendance in Primary Schools in 2011/12, which provides data for
non-attendance by school location (urban / rural), disadvantaged area
status of the school, and county by county figures.
3 Non-Attendance in Post-Primary Schools in 2011/12, which provides data
for non-attendance by school type (community / comprehensive,
secondary, vocational), disadvantaged area status of the school and county
by county figures.
2
Section 1
Non-Attendance Data, 2007/08 to 2011/12
1.1 Response Rate
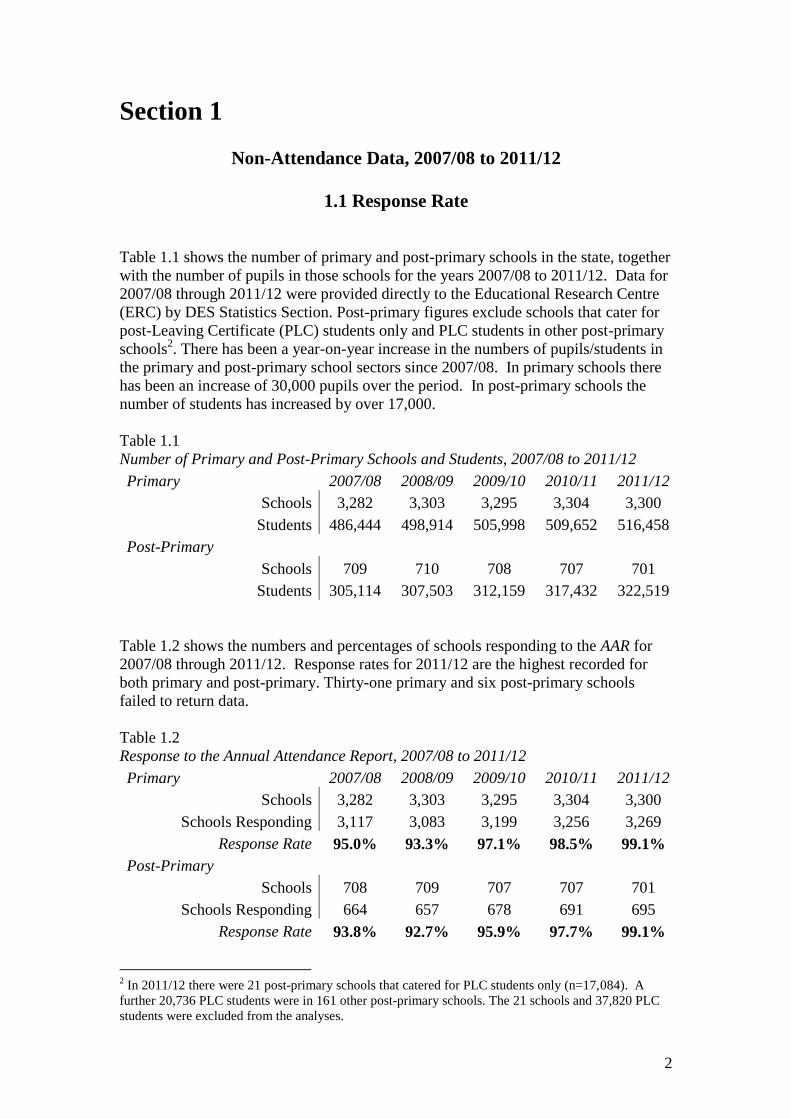
Table 1.1 shows the number of primary and post-primary schools in the state, together
with the number of pupils in those schools for the years 2007/08 to 2011/12. Data for
2007/08 through 2011/12 were provided directly to the Educational Research Centre
(ERC) by DES Statistics Section. Post-primary figures exclude schools that cater for
post-Leaving Certificate (PLC) students only and PLC students in other post-primary
schools2. There has been a year-on-year increase in the numbers of pupils/students in
the primary and post-primary school sectors since 2007/08. In primary schools there
has been an increase of 30,000 pupils over the period. In post-primary schools the
number of students has increased by over 17,000.
Table 1.1
Number of Primary and Post-Primary Schools and Students, 2007/08 to 2011/12
Primary 2007/08 2008/09 2009/10 2010/11 2011/12
Schools 3,282 3,303 3,295 3,304 3,300
Students 486,444 498,914 505,998 509,652 516,458
Post-Primary
Schools 709 710 708 707 701
Students 305,114 307,503 312,159 317,432 322,519
Table 1.2 shows the numbers and percentages of schools responding to the AAR for
2007/08 through 2011/12. Response rates for 2011/12 are the highest recorded for
both primary and post-primary. Thirty-one primary and six post-primary schools
failed to return data.
Table 1.2
Response to the Annual Attendance Report, 2007/08 to 2011/12
Primary 2007/08 2008/09 2009/10 2010/11 2011/12
Schools 3,282 3,303 3,295 3,304 3,300
Schools Responding 3,117 3,083 3,199 3,256 3,269
Response Rate 95.0% 93.3% 97.1% 98.5% 99.1%
Post-Primary
Schools 708 709 707 707 701
Schools Responding 664 657 678 691 695
Response Rate 93.8% 92.7% 95.9% 97.7% 99.1%
2 In 2011/12 there were 21 post-primary schools that catered for PLC students only (n=17,084). A
further 20,736 PLC students were in 161 other post-primary schools. The 21 schools and 37,820 PLC
students were excluded from the analyses.
3
1.2 Results of the Annual Attendance Report
The core of the NEWB data-set consists of four variables. They record
(1) 'Total number of days lost through student absence in the entire school
year',
(2) 'number of students who were absent for 20 days or more in the school
year',
(3) 'total number of students expelled in respect of whom all appeal processes
have been exhausted', and
(4) 'total number of students who were suspended'.
The numbers of schools listed in the tables below sometimes differ slightly from one
table to the next. This is because schools providing data for one form of non-
attendance may have had missing or unusable data for another.
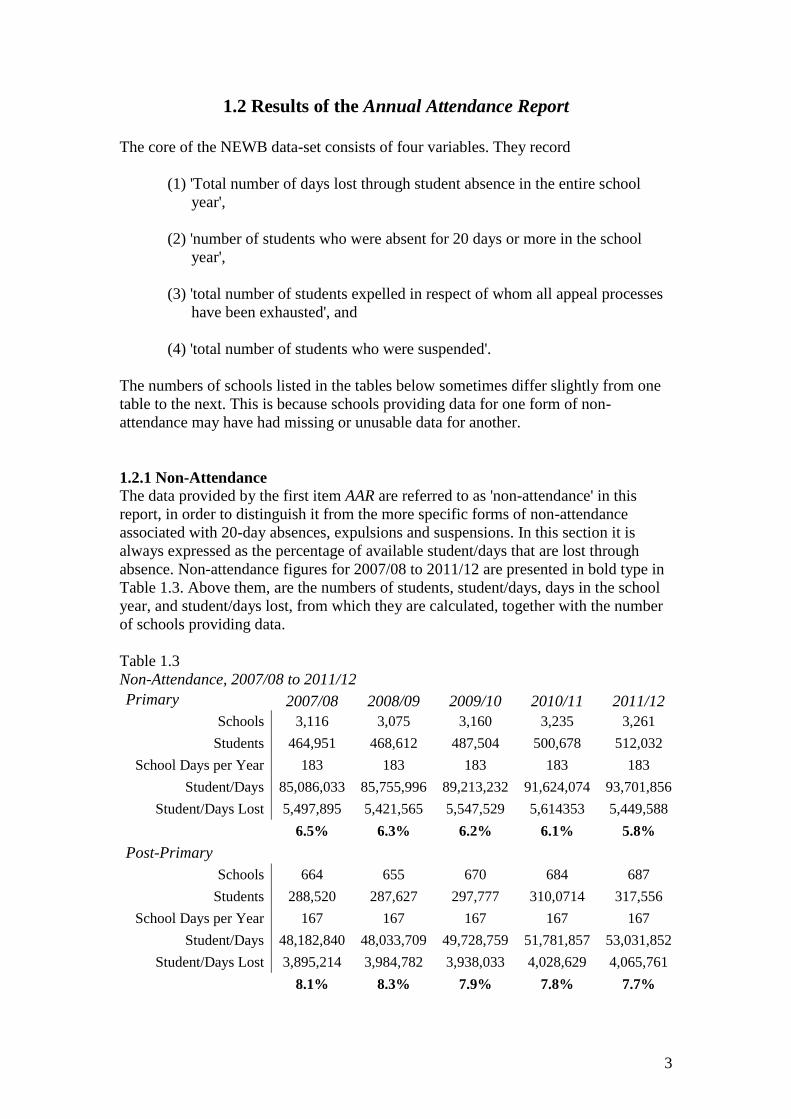
1.2.1 Non-Attendance
The data provided by the first item AAR are referred to as 'non-attendance' in this
report, in order to distinguish it from the more specific forms of non-attendance
associated with 20-day absences, expulsions and suspensions. In this section it is
always expressed as the percentage of available student/days that are lost through
absence. Non-attendance figures for 2007/08 to 2011/12 are presented in bold type in
Table 1.3. Above them, are the numbers of students, student/days, days in the school
year, and student/days lost, from which they are calculated, together with the number
of schools providing data.
Table 1.3
Non-Attendance, 2007/08 to 2011/12
Primary 2007/08 2008/09 2009/10 2010/11 2011/12
Schools 3,116 3,075 3,160 3,235 3,261
Students 464,951 468,612 487,504 500,678 512,032
School Days per Year 183 183 183 183 183
Student/Days 85,086,033 85,755,996 89,213,232 91,624,074 93,701,856
Student/Days Lost 5,497,895 5,421,565 5,547,529 5,614353 5,449,588
6.5% 6.3% 6.2% 6.1% 5.8%
Post-Primary
Schools 664 655 670 684 687
Students 288,520 287,627 297,777 310,0714 317,556
School Days per Year 167 167 167 167 167
Student/Days 48,182,840 48,033,709 49,728,759 51,781,857 53,031,852
Student/Days Lost 3,895,214 3,984,782 3,938,033 4,028,629 4,065,761
8.1% 8.3% 7.9% 7.8% 7.7%
4
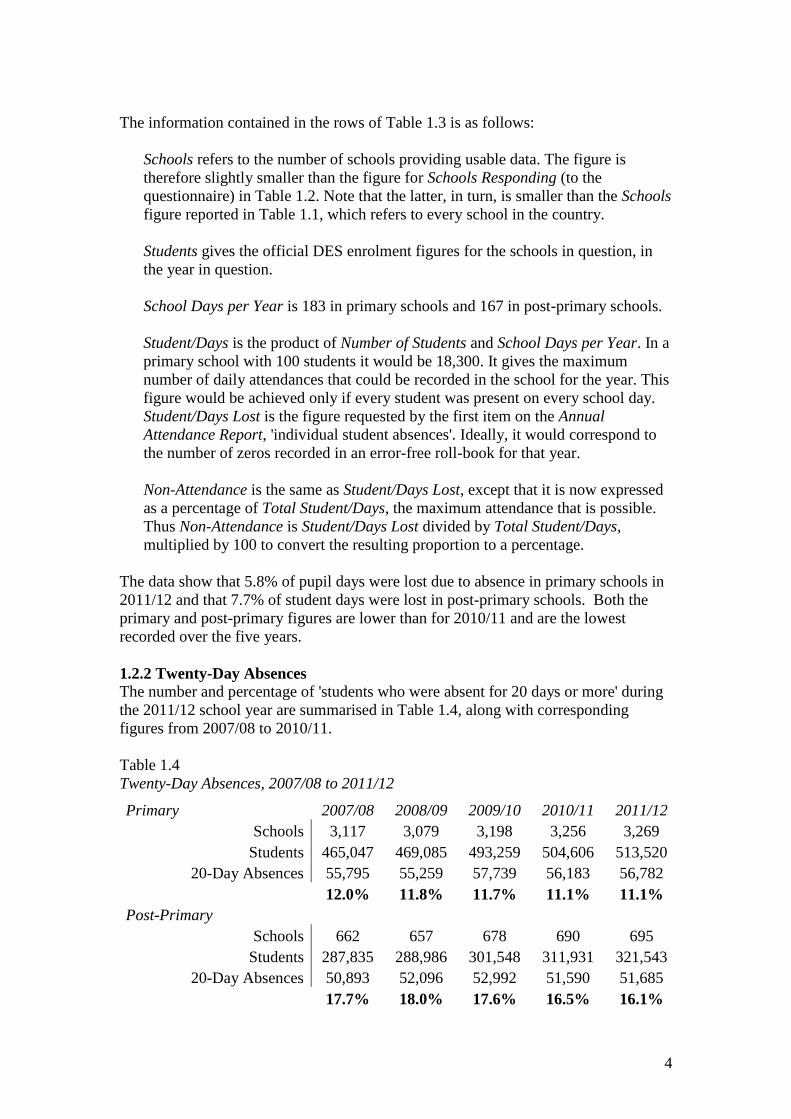
The information contained in the rows of Table 1.3 is as follows:
Schools refers to the number of schools providing usable data. The figure is
therefore slightly smaller than the figure for Schools Responding (to the
questionnaire) in Table 1.2. Note that the latter, in turn, is smaller than the Schools
figure reported in Table 1.1, which refers to every school in the country.
Students gives the official DES enrolment figures for the schools in question, in
the year in question.
School Days per Year is 183 in primary schools and 167 in post-primary schools.
Student/Days is the product of Number of Students and School Days per Year. In a
primary school with 100 students it would be 18,300. It gives the maximum
number of daily attendances that could be recorded in the school for the year. This
figure would be achieved only if every student was present on every school day.
Student/Days Lost is the figure requested by the first item on the Annual
Attendance Report, 'individual student absences'. Ideally, it would correspond to
the number of zeros recorded in an error-free roll-book for that year.
Non-Attendance is the same as Student/Days Lost, except that it is now expressed
as a percentage of Total Student/Days, the maximum attendance that is possible.
Thus Non-Attendance is Student/Days Lost divided by Total Student/Days,
multiplied by 100 to convert the resulting proportion to a percentage.
The data show that 5.8% of pupil days were lost due to absence in primary schools in
2011/12 and that 7.7% of student days were lost in post-primary schools. Both the
primary and post-primary figures are lower than for 2010/11 and are the lowest
recorded over the five years.
1.2.2 Twenty-Day Absences
The number and percentage of 'students who were absent for 20 days or more' during
the 2011/12 school year are summarised in Table 1.4, along with corresponding
figures from 2007/08 to 2010/11.
Table 1.4
Twenty-Day Absences, 2007/08 to 2011/12
Primary 2007/08 2008/09 2009/10 2010/11 2011/12
Schools 3,117 3,079 3,198 3,256 3,269
Students 465,047 469,085 493,259 504,606 513,520
20-Day Absences 55,795 55,259 57,739 56,183 56,782
12.0% 11.8% 11.7% 11.1% 11.1%
Post-Primary
Schools 662 657 678 690 695
Students 287,835 288,986 301,548 311,931 321,543
20-Day Absences 50,893 52,096 52,992 51,590 51,685
17.7% 18.0% 17.6% 16.5% 16.1%
5
The percentage of pupils who were absent for twenty-days or more lies in the range of
approximately 11-12% in primary schools over the five year period. The 2011/12
figure lies at the lower end of this range but shows no improvement from 2010/11.
For post-primary the figure is 0.4% lower than the previous year and is the lowest
figure for the period.
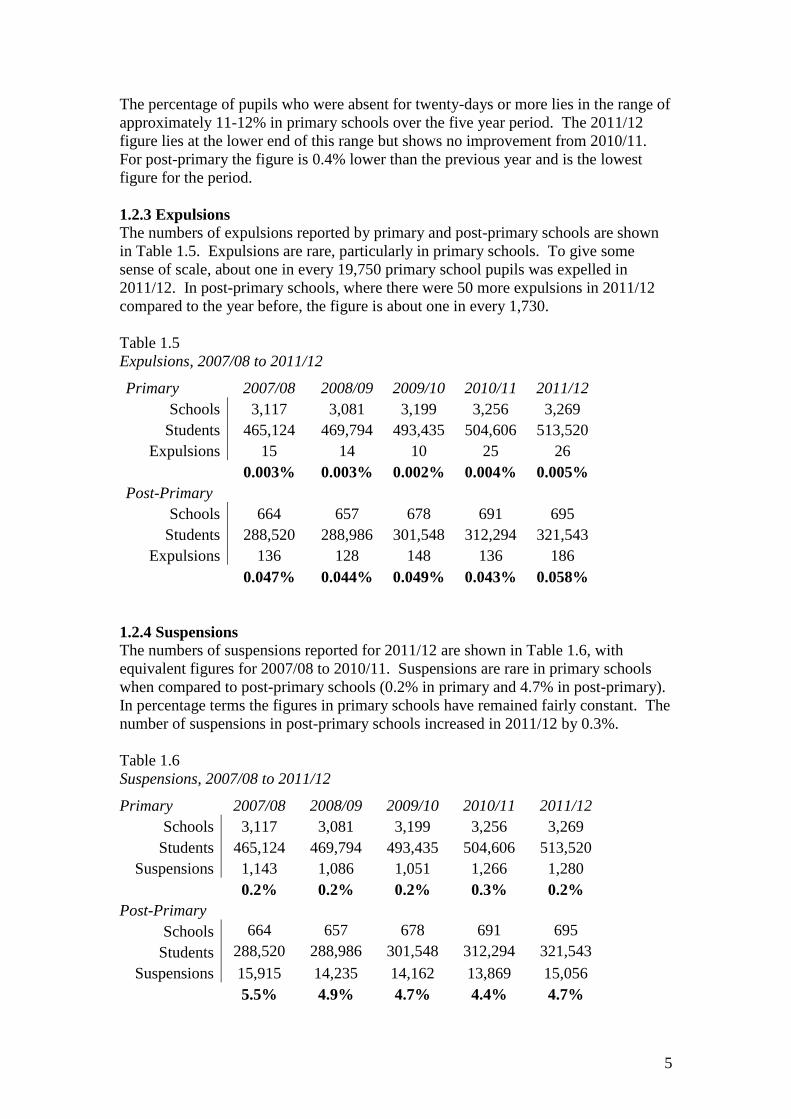
1.2.3 Expulsions
The numbers of expulsions reported by primary and post-primary schools are shown
in Table 1.5. Expulsions are rare, particularly in primary schools. To give some
sense of scale, about one in every 19,750 primary school pupils was expelled in
2011/12. In post-primary schools, where there were 50 more expulsions in 2011/12
compared to the year before, the figure is about one in every 1,730.
Table 1.5
Expulsions, 2007/08 to 2011/12
Primary 2007/08 2008/09 2009/10 2010/11 2011/12
Schools 3,117 3,081 3,199 3,256 3,269
Students 465,124 469,794 493,435 504,606 513,520
Expulsions 15 14 10 25 26
0.003% 0.003% 0.002% 0.004% 0.005%
Post-Primary
Schools 664 657 678 691 695
Students 288,520 288,986 301,548 312,294 321,543
Expulsions 136 128 148 136 186
0.047% 0.044% 0.049% 0.043% 0.058%
1.2.4 Suspensions
The numbers of suspensions reported for 2011/12 are shown in Table 1.6, with
equivalent figures for 2007/08 to 2010/11. Suspensions are rare in primary schools
when compared to post-primary schools (0.2% in primary and 4.7% in post-primary).
In percentage terms the figures in primary schools have remained fairly constant. The
number of suspensions in post-primary schools increased in 2011/12 by 0.3%.
Table 1.6
Suspensions, 2007/08 to 2011/12
Primary 2007/08 2008/09 2009/10 2010/11 2011/12
Schools 3,117 3,081 3,199 3,256 3,269
Students 465,124 469,794 493,435 504,606 513,520
Suspensions 1,143 1,086 1,051 1,266 1,280
0.2% 0.2% 0.2% 0.3% 0.2%
Post-Primary
Schools 664 657 678 691 695
Students 288,520 288,986 301,548 312,294 321,543
Suspensions 15,915 14,235 14,162 13,869 15,056
5.5% 4.9% 4.7% 4.4% 4.7%
6
1.3 Aspects of Non-Attendance
Non-attendance, defined as the percentage of all student/days lost through absence,
needs to be discussed briefly. Twenty-day absences, expulsions and suspensions do
not require any further discussion here.
1.3.1 Non-Attendance in the Population and in Schools
Firstly, non-attendance for the entire population of students, which has just been
reported on, needs to be distinguished from non-attendance in a particular school. In
Section 1 of the report, non-attendance has in all cases been treated as feature of the
population of students nationally, and the statistic is computed and presented
accordingly, as shown above in Table 1.3. Individual schools don't enter the picture,
except for their role in providing the data. Numbers of student/days lost through non-
attendance are added up school by school, and only when the total number of
student/days lost nation-wide has been calculated is non-attendance expressed as a
percentage, by dividing through by the maximum student/days achievable nationwide
in the year in question.
In Sections 2 and 3 of the report, on the other hand, non-attendance is calculated as a
separate figure for each school. These figures are close to 0% in some schools and can
be 20% or more in others. This rescaling, relative to the size of the school, provides an
index that shows to what extent each school is affected by the phenomenon of non-
attendance. Such school-based indices of non-attendance are essential in establishing
relationships between non-attendance and other school-based measures of educational
disadvantage, such as retention rates and academic achievement. They are also needed
to link non-attendance to aspects of disadvantage described only at school level, as
will be done in the following two sections of this report. In this Section, however,
non-attendance refers to the percentage of students absent from school each day.
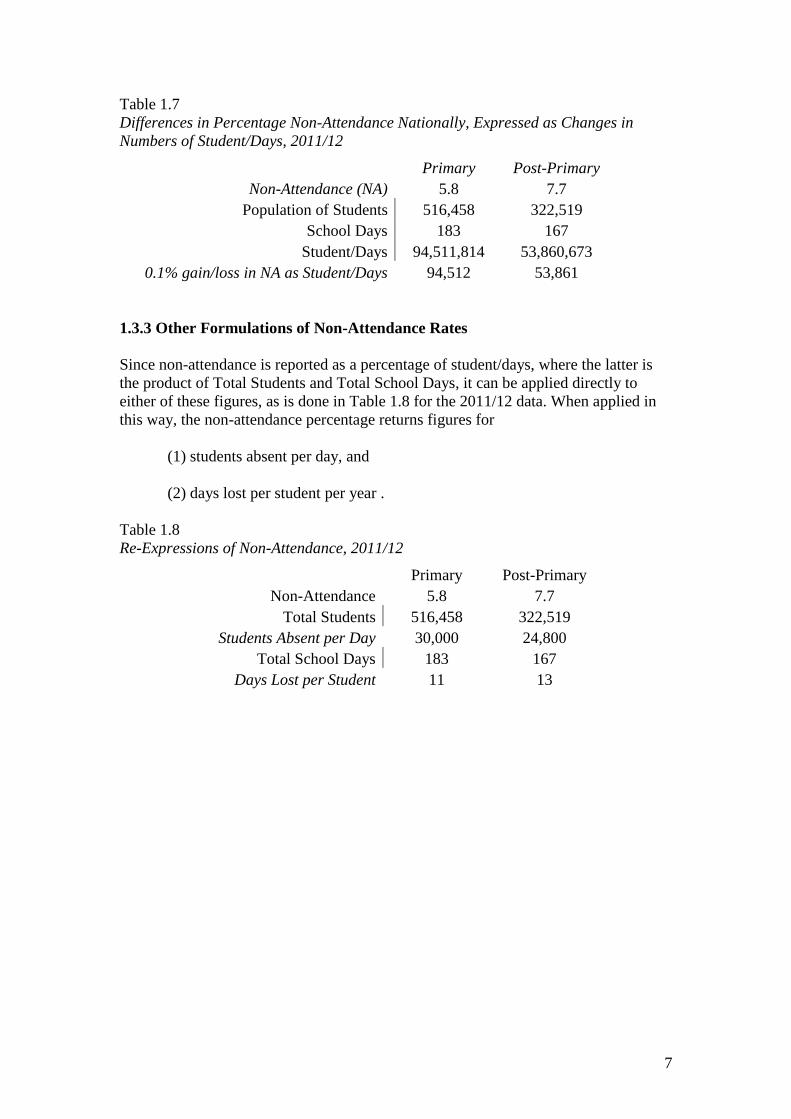
1.3.2 Precision of Non-Attendance Figures
Non-attendance is rounded to one decimal place in this report. This is the usual
practice in the international literature, consistent with the view that two decimal
places would overstate the level of precision that is to be expected in national non-
attendance data. Nonetheless, Table 1.7 shows that a difference of even one tenth of
one percent in non-attendance nationally amounts to a very substantial numbers of
student/days saved or lost. Thus the reported figure of 5.8% for non-attendance in
primary schools in 2011/12 suggests a decrease of 0.3% in the figure of 6.1% reported
for 2010/11 (Table 1.3), implying a gain of 283,000 additional student days in
attendance. The decrease in non-attendance of 0.1% in post-primary from 2010/11
implies an additional 53,000 student days in attendance.
The question arises whether the data are accurate enough to be interpreted in this way,
or whether changes of the magnitude of 0.1% should be treated as random
fluctuations due to error in the data. Analyses by Mac Aogáin (2008) and Millar
(2010) suggest that error in the data due to inconsistency is considerable and therefore
changes of this size are likely to be attributable only to error. Annual data are now
checked for year-on-year consistency within schools and where abnormally large
changes occur NEWB contact the school to confirm or correct the return. This
process should, in time, reduce inconsistency and improve the accuracy of attendance
data.
7
Table 1.7
Differences in Percentage Non-Attendance Nationally, Expressed as Changes in
Numbers of Student/Days, 2011/12
Primary Post-Primary
Non-Attendance (NA) 5.8 7.7
Population of Students 516,458 322,519
School Days 183 167
Student/Days 94,511,814 53,860,673
0.1% gain/loss in NA as Student/Days 94,512 53,861
1.3.3 Other Formulations of Non-Attendance Rates
Since non-attendance is reported as a percentage of student/days, where the latter is
the product of Total Students and Total School Days, it can be applied directly to
either of these figures, as is done in Table 1.8 for the 2011/12 data. When applied in
this way, the non-attendance percentage returns figures for
(1) students absent per day, and
(2) days lost per student per year .
Table 1.8
Re-Expressions of Non-Attendance, 2011/12
Primary Post-Primary
Non-Attendance 5.8 7.7
Total Students 516,458 322,519
Students Absent per Day 30,000 24,800
Total School Days 183 167
Days Lost per Student 11 13
8
Section 2
Non-Attendance in Primary Schools, 2011/12
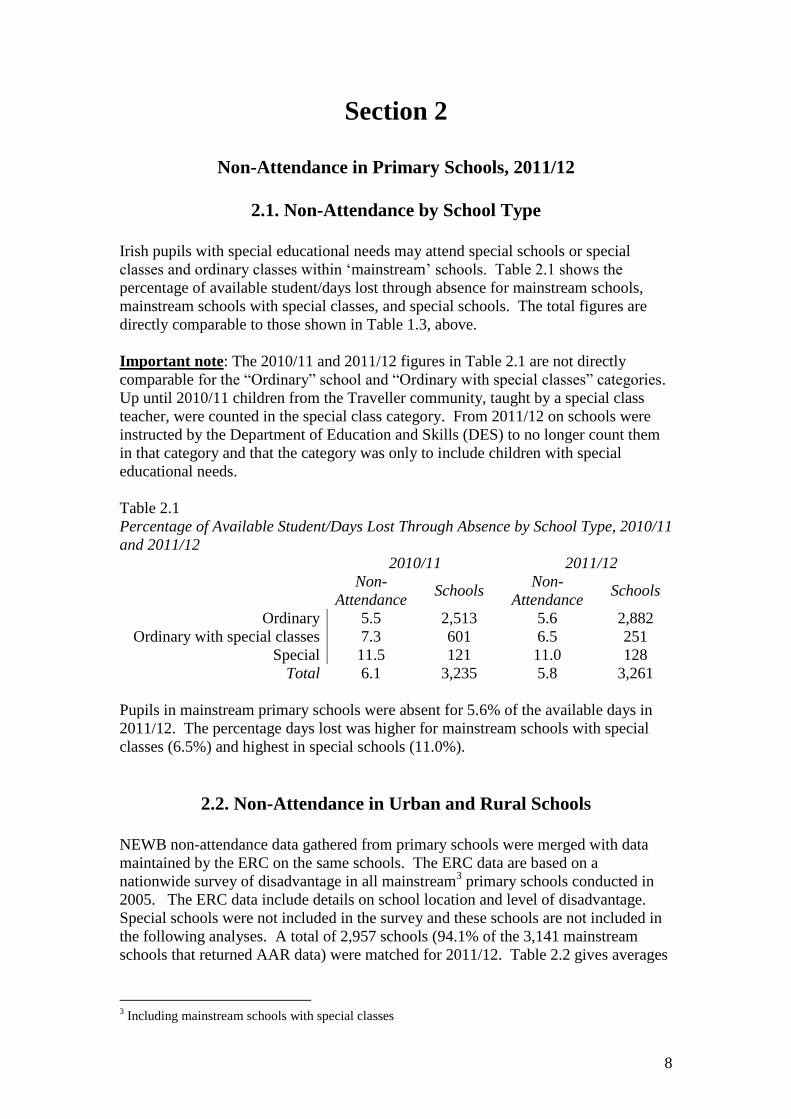
2.1. Non-Attendance by School Type
Irish pupils with special educational needs may attend special schools or special
classes and ordinary classes within ‘mainstream’ schools. Table 2.1 shows the
percentage of available student/days lost through absence for mainstream schools,
mainstream schools with special classes, and special schools. The total figures are
directly comparable to those shown in Table 1.3, above.
Important note: The 2010/11 and 2011/12 figures in Table 2.1 are not directly
comparable for the “Ordinary” school and “Ordinary with special classes” categories.
Up until 2010/11 children from the Traveller community, taught by a special class
teacher, were counted in the special class category. From 2011/12 on schools were
instructed by the Department of Education and Skills (DES) to no longer count them
in that category and that the category was only to include children with special
educational needs.
Table 2.1
Percentage of Available Student/Days Lost Through Absence by School Type, 2010/11
and 2011/12
2010/11 2011/12
Non-
Attendance Schools
Non-
Attendance Schools
Ordinary 5.5 2,513 5.6 2,882
Ordinary with special classes 7.3 601 6.5 251
Special 11.5 121 11.0 128
Total 6.1 3,235 5.8 3,261
Pupils in mainstream primary schools were absent for 5.6% of the available days in
2011/12. The percentage days lost was higher for mainstream schools with special
classes (6.5%) and highest in special schools (11.0%).
2.2. Non-Attendance in Urban and Rural Schools
NEWB non-attendance data gathered from primary schools were merged with data
maintained by the ERC on the same schools. The ERC data are based on a
nationwide survey of disadvantage in all mainstream3 primary schools conducted in
2005. The ERC data include details on school location and level of disadvantage.
Special schools were not included in the survey and these schools are not included in
the following analyses. A total of 2,957 schools (94.1% of the 3,141 mainstream
schools that returned AAR data) were matched for 2011/12. Table 2.2 gives averages
3 Including mainstream schools with special classes

9
for non-attendance, 20-day absences, and suspensions in urban and rural primary
schools. Expulsions have not been included because of the low numbers.
Table 2.2
Non-Attendance in Urban and Rural* Primary Schools, 2010/11 and 2011/12
2010/11 2011/12
Non Attendance Mean
N
Schools SD Mean
N
Schools SD
Rural Schools 5.00 1,911 1.46 4.81 1,915 1.47
Urban Schools 6.83 1,030 2.95 6.44 1,034 2.63
Total 5.64 2,941 2.28 5.38 2,949 2.11
20-Day Absences Mean
N
Schools SD Mean
N
Schools SD
Rural Schools 7.34 1,919 6.38 7.14 1,918 6.15
Urban Schools 14.12 1,041 9.13 13.77 1,039 8.55
Total 9.73 2,960 8.13 9.47 2,957 7.76
Suspensions Mean
N
Schools SD Mean
N
Schools SD
Rural Schools .05 1,919 .37 .05 1,918 .34
Urban Schools .36 1,041 1.30 .38 1,039 1.29
Total .16 2,960 .84 .17 2,957 .83 *Rural location is defined as “A village or rural community – population less than 1499”.
Non-attendance in all forms is higher in urban schools. This is in line with the
findings for 2010/11 and previously. Twenty-day absences distinguish urban from
rural schools much more sharply than general non-attendance does. Suspensions,
while uncommon in either school type, are more common in urban schools.
In looking at table 2.2 it should be remembered that data on absenteeism are here
reported at the school level (see section 1.3.1 above). For example, for the 2,957
matched schools in 2011/12 the percentage of days lost was calculated for each
school. Then the mean and standard deviation for all schools was calculated. Thus
for the 1,911 rural schools the mean percentage of student days lost (Non Attendance)
per school was 4.81%. The mean percentage of pupil days lost for the 1,030 urban
schools was higher, 6.44%. However, there was some variation within each school
type (as measured by the standard deviation), with this spread being greater for urban
schools. Much the same is true for the twenty-day absences and suspensions. For the
2,957 schools for which we have data for 2011/12, the mean school figure for the
percentage of pupils missing twenty days’ schooling was just under 9.5%. However,
there were considerable differences between schools as shown by the large standard
deviation (7.76). This means that some schools will have had no pupils absent for
twenty or more days while others will have more than one fifth (20%) of pupils
missing this number of days.
10
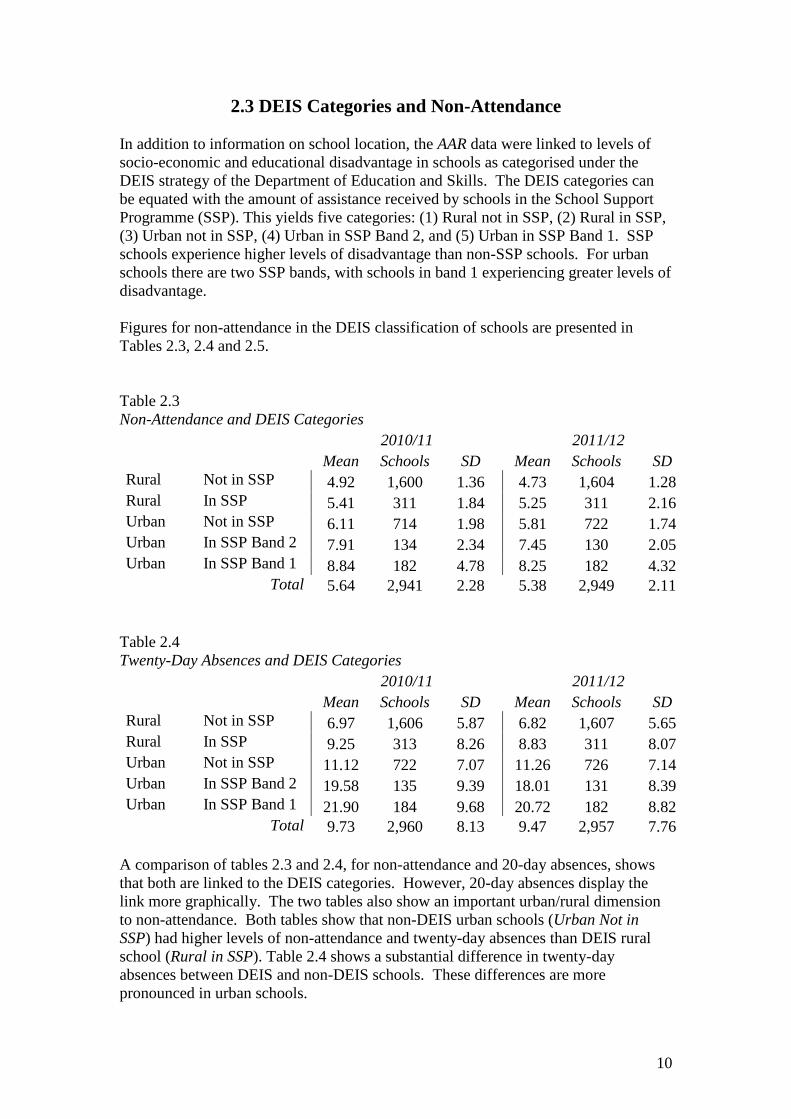
2.3 DEIS Categories and Non-Attendance
In addition to information on school location, the AAR data were linked to levels of
socio-economic and educational disadvantage in schools as categorised under the
DEIS strategy of the Department of Education and Skills. The DEIS categories can
be equated with the amount of assistance received by schools in the School Support
Programme (SSP). This yields five categories: (1) Rural not in SSP, (2) Rural in SSP,
(3) Urban not in SSP, (4) Urban in SSP Band 2, and (5) Urban in SSP Band 1. SSP
schools experience higher levels of disadvantage than non-SSP schools. For urban
schools there are two SSP bands, with schools in band 1 experiencing greater levels of
disadvantage.
Figures for non-attendance in the DEIS classification of schools are presented in
Tables 2.3, 2.4 and 2.5.
Table 2.3
Non-Attendance and DEIS Categories
2010/11 2011/12
Mean Schools SD Mean Schools SD
Rural Not in SSP 4.92 1,600 1.36 4.73 1,604 1.28
Rural In SSP 5.41 311 1.84 5.25 311 2.16
Urban Not in SSP 6.11 714 1.98 5.81 722 1.74
Urban In SSP Band 2 7.91 134 2.34 7.45 130 2.05
Urban In SSP Band 1 8.84 182 4.78 8.25 182 4.32
Total 5.64 2,941 2.28 5.38 2,949 2.11
Table 2.4
Twenty-Day Absences and DEIS Categories
2010/11 2011/12
Mean Schools SD Mean Schools SD
Rural Not in SSP 6.97 1,606 5.87 6.82 1,607 5.65
Rural In SSP 9.25 313 8.26 8.83 311 8.07
Urban Not in SSP 11.12 722 7.07 11.26 726 7.14
Urban In SSP Band 2 19.58 135 9.39 18.01 131 8.39
Urban In SSP Band 1 21.90 184 9.68 20.72 182 8.82
Total 9.73 2,960 8.13 9.47 2,957 7.76
A comparison of tables 2.3 and 2.4, for non-attendance and 20-day absences, shows
that both are linked to the DEIS categories. However, 20-day absences display the
link more graphically. The two tables also show an important urban/rural dimension
to non-attendance. Both tables show that non-DEIS urban schools (Urban Not in
SSP) had higher levels of non-attendance and twenty-day absences than DEIS rural
school (Rural in SSP). Table 2.4 shows a substantial difference in twenty-day
absences between DEIS and non-DEIS schools. These differences are more
pronounced in urban schools.
11
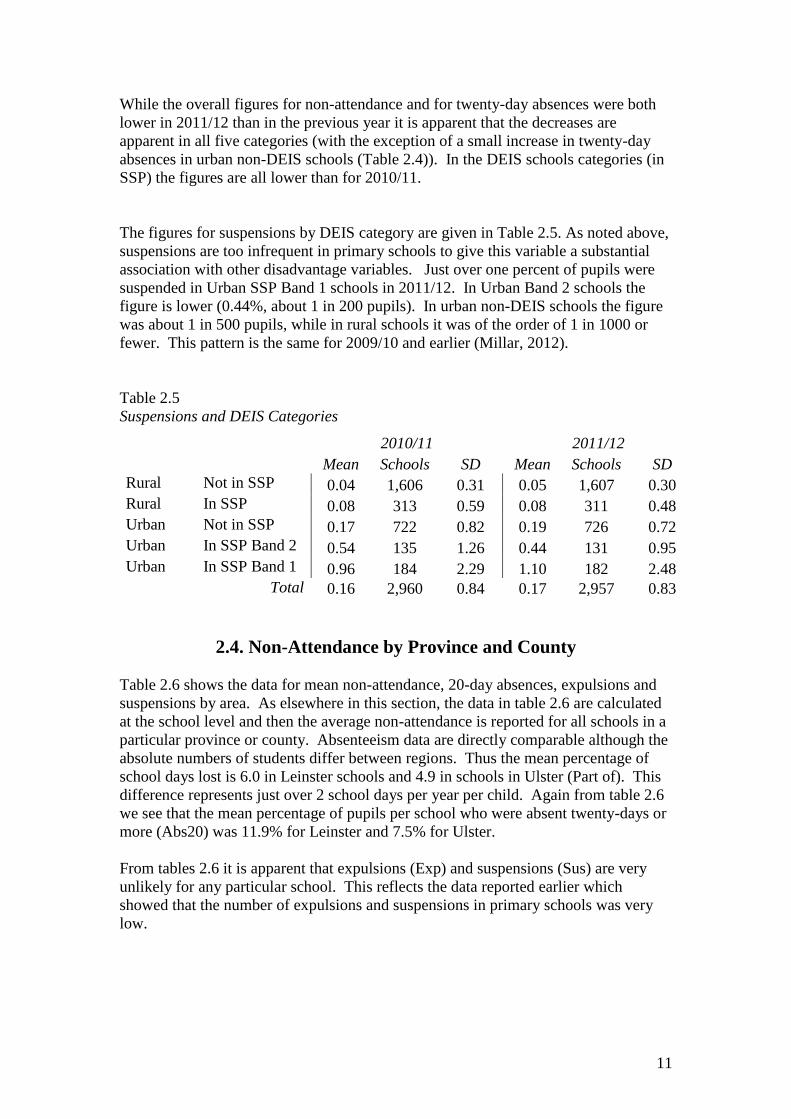
While the overall figures for non-attendance and for twenty-day absences were both
lower in 2011/12 than in the previous year it is apparent that the decreases are
apparent in all five categories (with the exception of a small increase in twenty-day
absences in urban non-DEIS schools (Table 2.4)). In the DEIS schools categories (in
SSP) the figures are all lower than for 2010/11.
The figures for suspensions by DEIS category are given in Table 2.5. As noted above,
suspensions are too infrequent in primary schools to give this variable a substantial
association with other disadvantage variables. Just over one percent of pupils were
suspended in Urban SSP Band 1 schools in 2011/12. In Urban Band 2 schools the
figure is lower (0.44%, about 1 in 200 pupils). In urban non-DEIS schools the figure
was about 1 in 500 pupils, while in rural schools it was of the order of 1 in 1000 or
fewer. This pattern is the same for 2009/10 and earlier (Millar, 2012).
Table 2.5
Suspensions and DEIS Categories
2010/11 2011/12
Mean Schools SD Mean Schools SD
Rural Not in SSP 0.04 1,606 0.31 0.05 1,607 0.30
Rural In SSP 0.08 313 0.59 0.08 311 0.48
Urban Not in SSP 0.17 722 0.82 0.19 726 0.72
Urban In SSP Band 2 0.54 135 1.26 0.44 131 0.95
Urban In SSP Band 1 0.96 184 2.29 1.10 182 2.48
Total 0.16 2,960 0.84 0.17 2,957 0.83
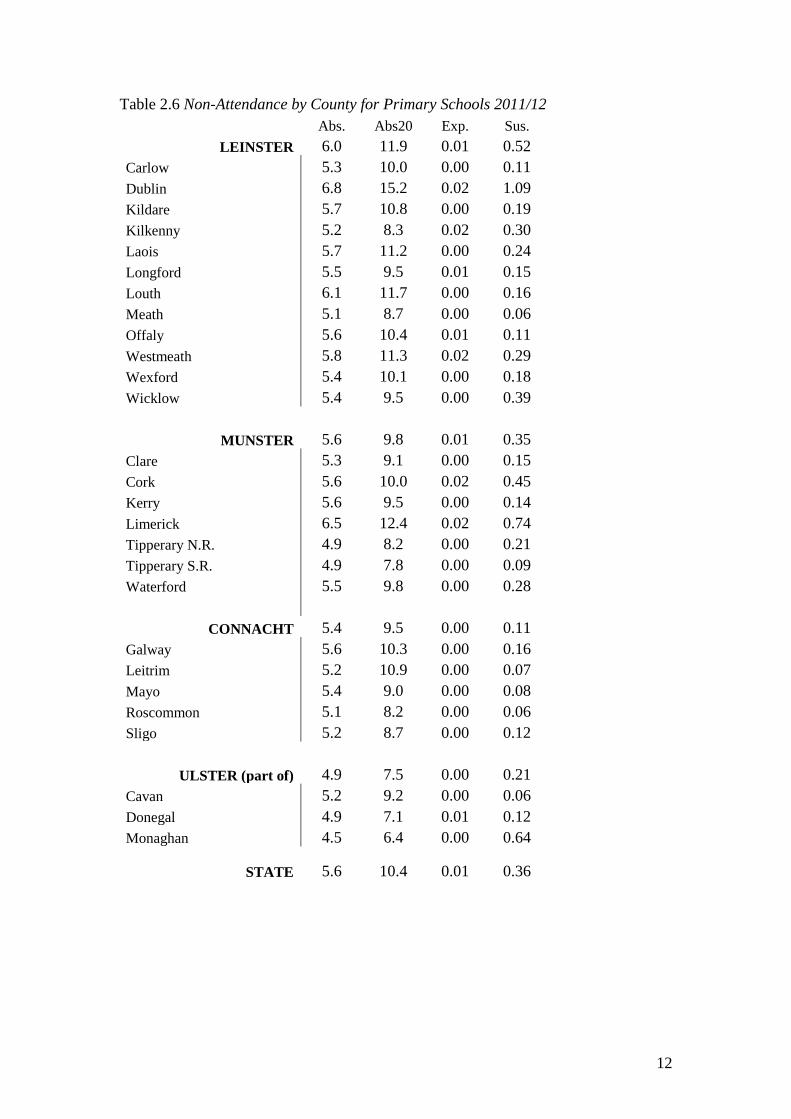
2.4. Non-Attendance by Province and County
Table 2.6 shows the data for mean non-attendance, 20-day absences, expulsions and
suspensions by area. As elsewhere in this section, the data in table 2.6 are calculated
at the school level and then the average non-attendance is reported for all schools in a
particular province or county. Absenteeism data are directly comparable although the
absolute numbers of students differ between regions. Thus the mean percentage of
school days lost is 6.0 in Leinster schools and 4.9 in schools in Ulster (Part of). This
difference represents just over 2 school days per year per child. Again from table 2.6
we see that the mean percentage of pupils per school who were absent twenty-days or
more (Abs20) was 11.9% for Leinster and 7.5% for Ulster.
From tables 2.6 it is apparent that expulsions (Exp) and suspensions (Sus) are very
unlikely for any particular school. This reflects the data reported earlier which
showed that the number of expulsions and suspensions in primary schools was very
low.
12
Table 2.6 Non-Attendance by County for Primary Schools 2011/12
Abs. Abs20 Exp. Sus.
LEINSTER 6.0 11.9 0.01 0.52
Carlow 5.3 10.0 0.00 0.11
Dublin 6.8 15.2 0.02 1.09
Kildare 5.7 10.8 0.00 0.19
Kilkenny 5.2 8.3 0.02 0.30
Laois 5.7 11.2 0.00 0.24
Longford 5.5 9.5 0.01 0.15
Louth 6.1 11.7 0.00 0.16
Meath 5.1 8.7 0.00 0.06
Offaly 5.6 10.4 0.01 0.11
Westmeath 5.8 11.3 0.02 0.29
Wexford 5.4 10.1 0.00 0.18
Wicklow 5.4 9.5 0.00 0.39
MUNSTER 5.6 9.8 0.01 0.35
Clare 5.3 9.1 0.00 0.15
Cork 5.6 10.0 0.02 0.45
Kerry 5.6 9.5 0.00 0.14
Limerick 6.5 12.4 0.02 0.74
Tipperary N.R. 4.9 8.2 0.00 0.21
Tipperary S.R. 4.9 7.8 0.00 0.09
Waterford 5.5 9.8 0.00 0.28
CONNACHT 5.4 9.5 0.00 0.11
Galway 5.6 10.3 0.00 0.16
Leitrim 5.2 10.9 0.00 0.07
Mayo 5.4 9.0 0.00 0.08
Roscommon 5.1 8.2 0.00 0.06
Sligo 5.2 8.7 0.00 0.12
ULSTER (part of) 4.9 7.5 0.00 0.21
Cavan 5.2 9.2 0.00 0.06
Donegal 4.9 7.1 0.01 0.12
Monaghan 4.5 6.4 0.00 0.64
STATE 5.6 10.4 0.01 0.36
13
Section 3
Non-Attendance in Post-Primary Schools, 2011/12
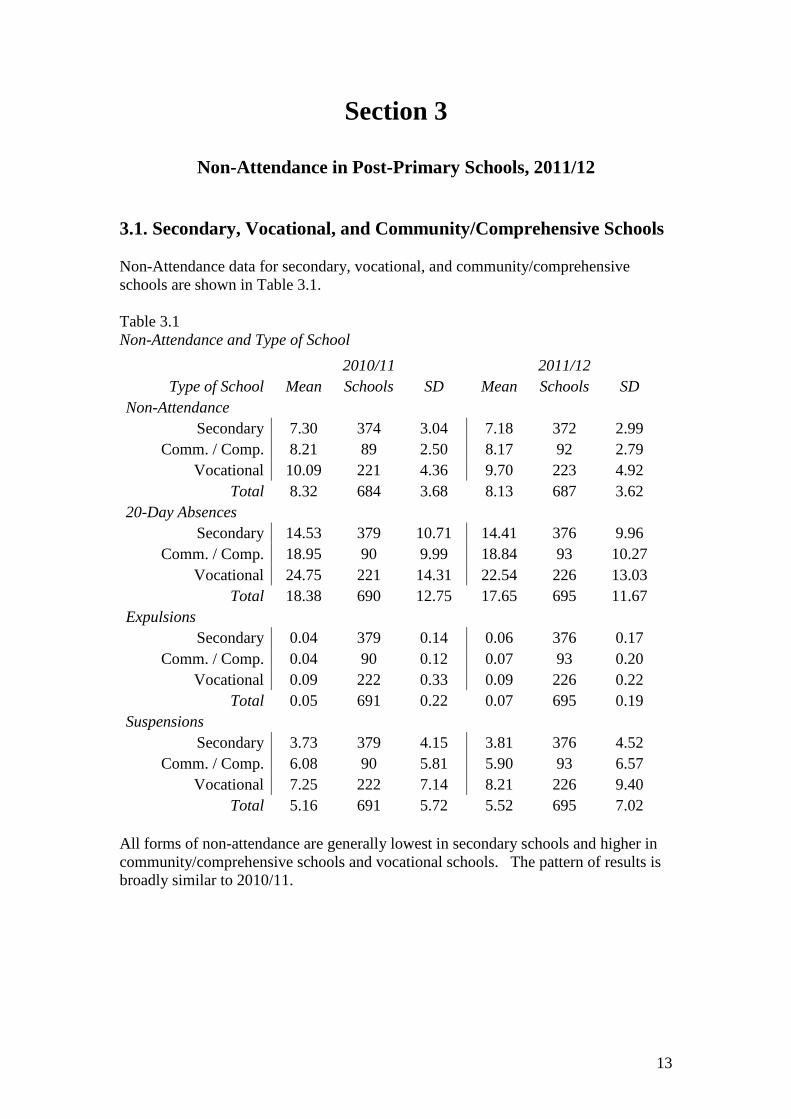
3.1. Secondary, Vocational, and Community/Comprehensive Schools
Non-Attendance data for secondary, vocational, and community/comprehensive
schools are shown in Table 3.1.
Table 3.1
Non-Attendance and Type of School
2010/11 2011/12
Type of School Mean Schools SD Mean Schools SD
Non-Attendance
Secondary 7.30 374 3.04 7.18 372 2.99
Comm. / Comp. 8.21 89 2.50 8.17 92 2.79
Vocational 10.09 221 4.36 9.70 223 4.92
Total 8.32 684 3.68 8.13 687 3.62
20-Day Absences
Secondary 14.53 379 10.71 14.41 376 9.96
Comm. / Comp. 18.95 90 9.99 18.84 93 10.27
Vocational 24.75 221 14.31 22.54 226 13.03
Total 18.38 690 12.75 17.65 695 11.67
Expulsions
Secondary 0.04 379 0.14 0.06 376 0.17
Comm. / Comp. 0.04 90 0.12 0.07 93 0.20
Vocational 0.09 222 0.33 0.09 226 0.22
Total 0.05 691 0.22 0.07 695 0.19
Suspensions
Secondary 3.73 379 4.15 3.81 376 4.52
Comm. / Comp. 6.08 90 5.81 5.90 93 6.57
Vocational 7.25 222 7.14 8.21 226 9.40
Total 5.16 691 5.72 5.52 695 7.02
All forms of non-attendance are generally lowest in secondary schools and higher in
community/comprehensive schools and vocational schools. The pattern of results is
broadly similar to 2010/11.
14
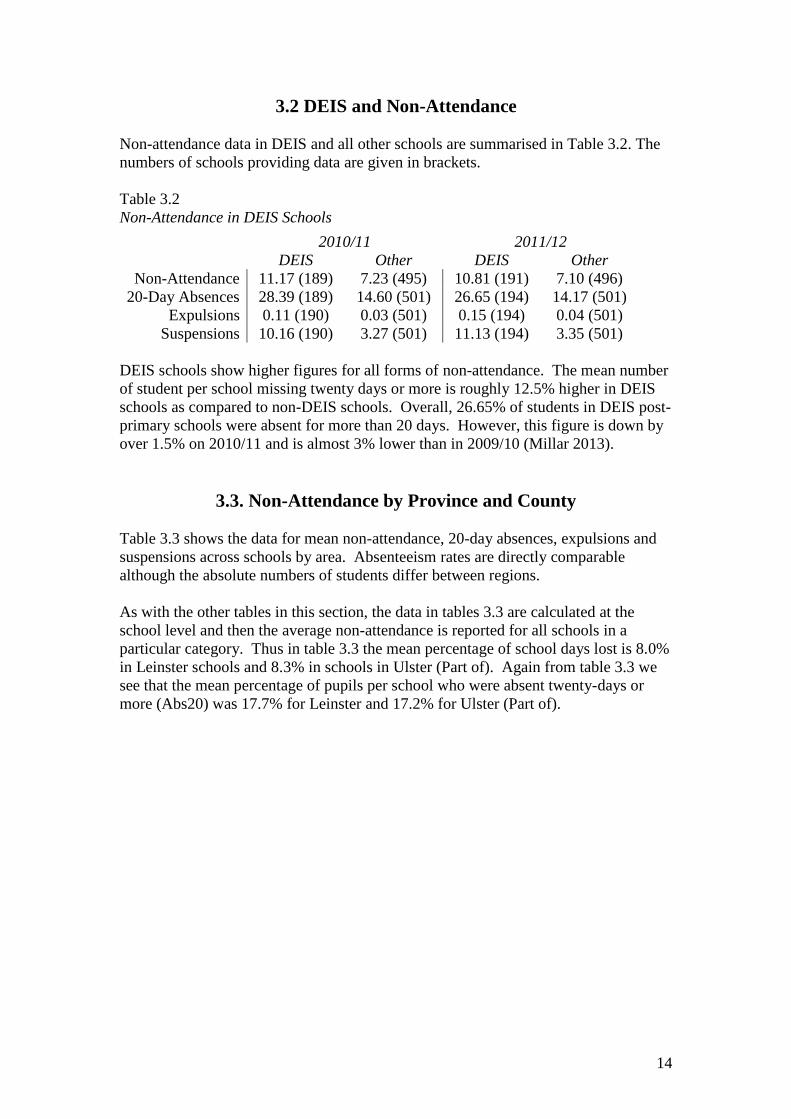
3.2 DEIS and Non-Attendance
Non-attendance data in DEIS and all other schools are summarised in Table 3.2. The
numbers of schools providing data are given in brackets.
Table 3.2
Non-Attendance in DEIS Schools
2010/11 2011/12
DEIS Other DEIS Other
Non-Attendance 11.17 (189) 7.23 (495) 10.81 (191) 7.10 (496)
20-Day Absences 28.39 (189) 14.60 (501) 26.65 (194) 14.17 (501)
Expulsions 0.11 (190) 0.03 (501) 0.15 (194) 0.04 (501)
Suspensions 10.16 (190) 3.27 (501) 11.13 (194) 3.35 (501)
DEIS schools show higher figures for all forms of non-attendance. The mean number
of student per school missing twenty days or more is roughly 12.5% higher in DEIS
schools as compared to non-DEIS schools. Overall, 26.65% of students in DEIS post-
primary schools were absent for more than 20 days. However, this figure is down by
over 1.5% on 2010/11 and is almost 3% lower than in 2009/10 (Millar 2013).
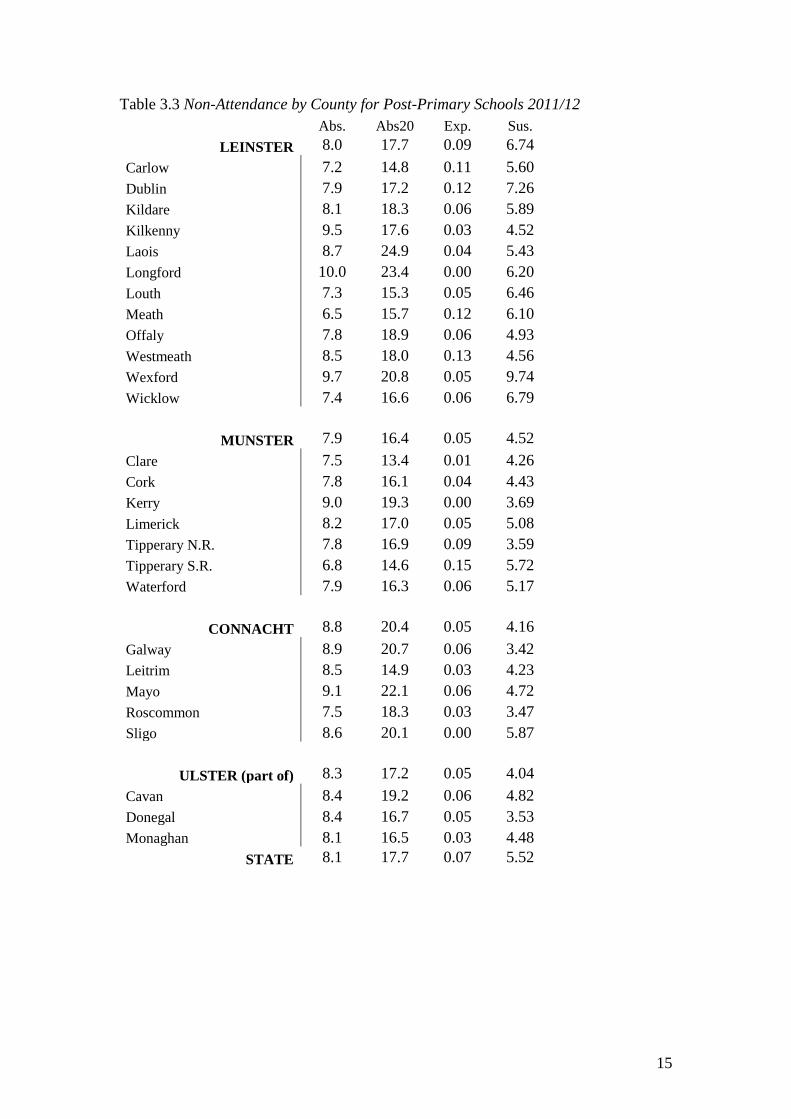
3.3. Non-Attendance by Province and County
Table 3.3 shows the data for mean non-attendance, 20-day absences, expulsions and
suspensions across schools by area. Absenteeism rates are directly comparable
although the absolute numbers of students differ between regions.
As with the other tables in this section, the data in tables 3.3 are calculated at the
school level and then the average non-attendance is reported for all schools in a
particular category. Thus in table 3.3 the mean percentage of school days lost is 8.0%
in Leinster schools and 8.3% in schools in Ulster (Part of). Again from table 3.3 we
see that the mean percentage of pupils per school who were absent twenty-days or
more (Abs20) was 17.7% for Leinster and 17.2% for Ulster (Part of).
15
Table 3.3 Non-Attendance by County for Post-Primary Schools 2011/12
Abs. Abs20 Exp. Sus.
LEINSTER 8.0 17.7 0.09 6.74
Carlow 7.2 14.8 0.11 5.60
Dublin 7.9 17.2 0.12 7.26
Kildare 8.1 18.3 0.06 5.89
Kilkenny 9.5 17.6 0.03 4.52
Laois 8.7 24.9 0.04 5.43
Longford 10.0 23.4 0.00 6.20
Louth 7.3 15.3 0.05 6.46
Meath 6.5 15.7 0.12 6.10
Offaly 7.8 18.9 0.06 4.93
Westmeath 8.5 18.0 0.13 4.56
Wexford 9.7 20.8 0.05 9.74
Wicklow 7.4 16.6 0.06 6.79
MUNSTER 7.9 16.4 0.05 4.52
Clare 7.5 13.4 0.01 4.26
Cork 7.8 16.1 0.04 4.43
Kerry 9.0 19.3 0.00 3.69
Limerick 8.2 17.0 0.05 5.08
Tipperary N.R. 7.8 16.9 0.09 3.59
Tipperary S.R. 6.8 14.6 0.15 5.72
Waterford 7.9 16.3 0.06 5.17
CONNACHT 8.8 20.4 0.05 4.16
Galway 8.9 20.7 0.06 3.42
Leitrim 8.5 14.9 0.03 4.23
Mayo 9.1 22.1 0.06 4.72
Roscommon 7.5 18.3 0.03 3.47
Sligo 8.6 20.1 0.00 5.87
ULSTER (part of) 8.3 17.2 0.05 4.04
Cavan 8.4 19.2 0.06 4.82
Donegal 8.4 16.7 0.05 3.53
Monaghan 8.1 16.5 0.03 4.48
STATE 8.1 17.7 0.07 5.52

16
References
Mac Aogáin, E. (2008) Analysis of school attendance data in primary and post-
primary schools, 2003/4 to 2005/6, Report to the NEWB. Dublin: Educational
Research Centre.
Millar, D. (2010) Analysis of School Attendance Data in Primary and Post-Primary
schools,2006/7 and 2007/8, Report to the NEWB. Dublin: Educational Research
Centre.
Millar, D. (2011) Analysis of School Attendance Data in Primary and Post-Primary
schools,2008/09, Report to the NEWB. Dublin: Educational Research
Centre.
Millar, D. (2012) Analysis of School Attendance Data in Primary and Post-Primary
schools,2009/10, Report to the NEWB. Dublin: Educational Research
Centre.
Millar, D. (2013) Analysis of School Attendance Data in Primary and Post-Primary
schools,2010/11, Report to the NEWB. Dublin: Educational Research
Centre.
Northern Ireland Statistics and Research Agency (2011) Attendance at Grant-aided
Primary, Post-primary and Special Schools 2009/10: Detailed Statistics.
http://www.deni.gov.uk/attendance_at_grant-aided_primary__post-
primary_and_special_schools_200910_detailed_statistics.pdf
Northern Ireland Statistics and Research Agency (2012) Attendance at Grant-aided
Primary, Post-primary and Special Schools 2010/11: Detailed Statistics.
http://www.deni.gov.uk/attendance_at_grant-aided_primary__post-
primary_and_special_schools_2010_11__detailed_statistics-2.pdf
Northern Ireland Statistics and Research Agency (2013) Attendance at grant-aided
primary, post-primary and special schools 2011/12: Detailed statistics.
http://www.deni.gov.uk/attendance_at_grant-aided_primary_post-
primary_and_special_schools_2011_12__detailed_statistics__pdf_394kb_.pdf
Ó Briain, E. (2006) Analysis of school attendance data at primary and post-primary
levels for 2004/2005. Report to the NEWB. Dublin: MORI Ireland.
Weir, S. (2004) Analysis of school attendance data at primary and post-primary
levels for 2003/2004, Report to the NEWB. Dublin: Educational Research Centre.
17
Appendix
Comparison with Northern Irish and British
Rates of Non-attendance
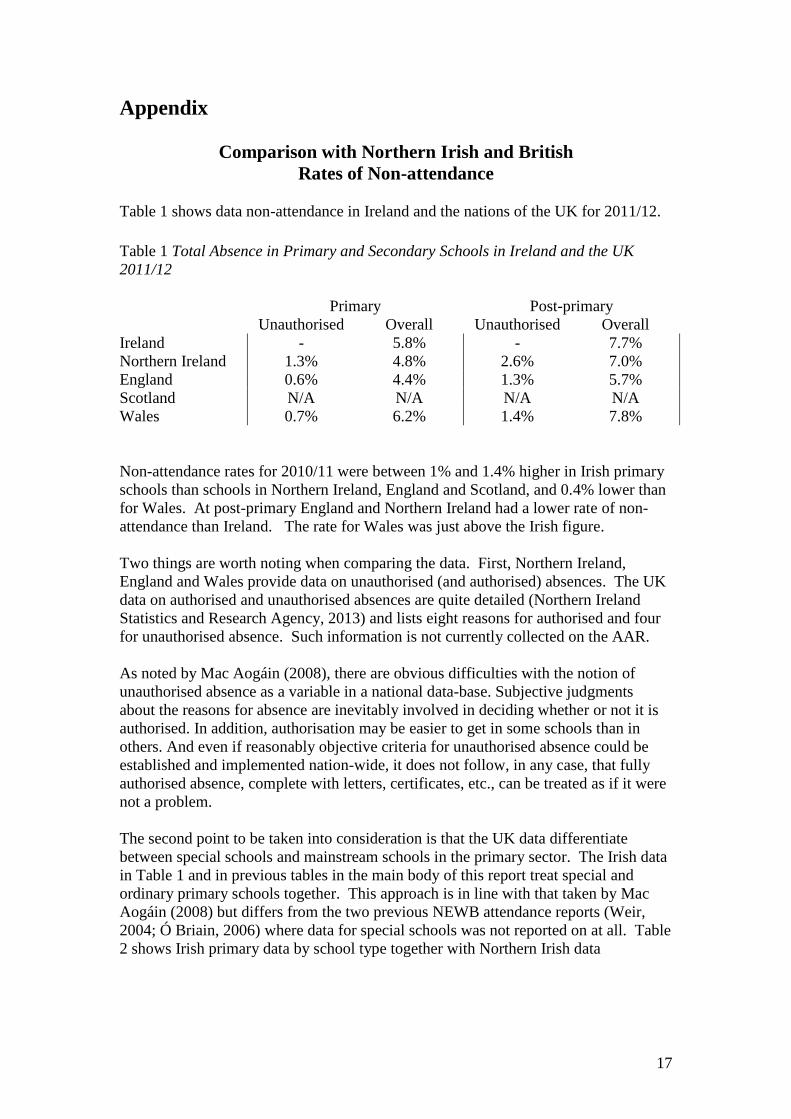
Table 1 shows data non-attendance in Ireland and the nations of the UK for 2011/12.
Table 1 Total Absence in Primary and Secondary Schools in Ireland and the UK
2011/12
Primary Post-primary
Unauthorised Overall Unauthorised Overall
Ireland - 5.8% - 7.7%
Northern Ireland 1.3% 4.8% 2.6% 7.0%
England 0.6% 4.4% 1.3% 5.7%
Scotland N/A N/A N/A N/A
Wales 0.7% 6.2% 1.4% 7.8%
Non-attendance rates for 2010/11 were between 1% and 1.4% higher in Irish primary
schools than schools in Northern Ireland, England and Scotland, and 0.4% lower than
for Wales. At post-primary England and Northern Ireland had a lower rate of non-
attendance than Ireland. The rate for Wales was just above the Irish figure.
Two things are worth noting when comparing the data. First, Northern Ireland,
England and Wales provide data on unauthorised (and authorised) absences. The UK
data on authorised and unauthorised absences are quite detailed (Northern Ireland
Statistics and Research Agency, 2013) and lists eight reasons for authorised and four
for unauthorised absence. Such information is not currently collected on the AAR.
As noted by Mac Aogáin (2008), there are obvious difficulties with the notion of
unauthorised absence as a variable in a national data-base. Subjective judgments
about the reasons for absence are inevitably involved in deciding whether or not it is
authorised. In addition, authorisation may be easier to get in some schools than in
others. And even if reasonably objective criteria for unauthorised absence could be
established and implemented nation-wide, it does not follow, in any case, that fully
authorised absence, complete with letters, certificates, etc., can be treated as if it were
not a problem.
The second point to be taken into consideration is that the UK data differentiate
between special schools and mainstream schools in the primary sector. The Irish data
in Table 1 and in previous tables in the main body of this report treat special and
ordinary primary schools together. This approach is in line with that taken by Mac
Aogáin (2008) but differs from the two previous NEWB attendance reports (Weir,
2004; Ó Briain, 2006) where data for special schools was not reported on at all. Table
2 shows Irish primary data by school type together with Northern Irish data
18
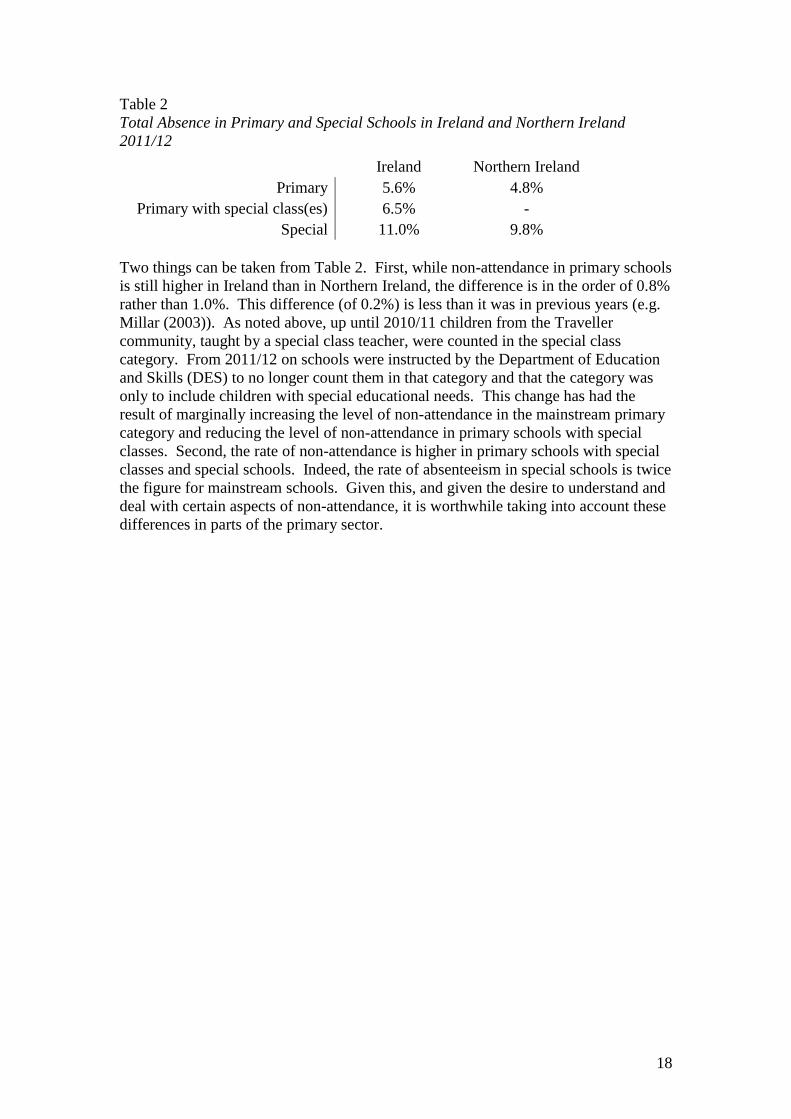
Table 2
Total Absence in Primary and Special Schools in Ireland and Northern Ireland
2011/12
Ireland Northern Ireland
Primary 5.6% 4.8%
Primary with special class(es) 6.5% -
Special 11.0% 9.8%
Two things can be taken from Table 2. First, while non-attendance in primary schools
is still higher in Ireland than in Northern Ireland, the difference is in the order of 0.8%
rather than 1.0%. This difference (of 0.2%) is less than it was in previous years (e.g.
Millar (2003)). As noted above, up until 2010/11 children from the Traveller
community, taught by a special class teacher, were counted in the special class
category. From 2011/12 on schools were instructed by the Department of Education
and Skills (DES) to no longer count them in that category and that the category was
only to include children with special educational needs. This change has had the
result of marginally increasing the level of non-attendance in the mainstream primary
category and reducing the level of non-attendance in primary schools with special
classes. Second, the rate of non-attendance is higher in primary schools with special
classes and special schools. Indeed, the rate of absenteeism in special schools is twice
the figure for mainstream schools. Given this, and given the desire to understand and
deal with certain aspects of non-attendance, it is worthwhile taking into account these
differences in parts of the primary sector.