school accountability report · filipino english learners 25 hispanic or latino 40 students with...
TRANSCRIPT
School Accountability Report
Dixon Unified School District
1 | P a g e
School Accountability Report Reported for the 2011-12 School Year Published During 2012-13
Maine Prairie High (Continuation)
This executive summary of the School
Accountability Report Card (SARC) is intended to
provide parents and community members with a quick snapshot of information related to individual public schools. Most data
presented in this report are reported for the 2011-12 school year. School finances and school completion data are reported for
the 2010-11 school year. Contact information, facilities, curriculum and instructional materials, and select teacher data are
reported for the 2012-13 school year. For additional information about the school, parents and community members should
review the entire SARC or contact the school principal or the district office.
I. About This School
Contact Information (2012-13 School Year)
School Name Maine Prairie District Name Dixon Unified
Street 305 East C Street Phone Number 707-678-5582
City, Street, Zip Dixon, Ca 95620-3209 Website www.dixonusd.org
Phone Number 707-693-6340 Interim Superintendent Brian Dolan
Principal Yvette Ramos Email Address [email protected]
Email Address [email protected] CDS Code 4875324830055
Principals Message: (2011-2012 School Year)
It is a true pleasure to serve the students of Maine Prairie High School. The faculty and staff have
done an outstanding job of fostering an atmosphere of mutual respect and trust. Students are
provided a supportive environment all the while preparing for achievement of their post secondary
goals.

School Accountability Report
Dixon Unified School District
2 | P a g e
School Accountability Report Reported for the 2011-12 School Year Published During 2012-13
Parental Involvement (2011-12) School Year)
Contact Person: Yvette Ramos Contact Person Phone #: 707-693-6340
Maine Prairie HS welcomes parents on campus at all times. We encourage parents to become an active participant in all
student activities.
Average Class Size and Class Size Distribution (Secondary)
Subject
2009 - 2010 2010 - 2011 2011 - 12
Avg. Class Size
Number of Classrooms Avg.
Class Size
Number of Classrooms Avg.
Class Size
Number of Classrooms
1-22 23-32 33+ 1-22 23-32 33+ 1-22 23-32 33+
English 22 5 0 0
20 5 0 0
22 6 0 0
Mathematics 22 2 0 0
20 2 0 0
20 3 0 0
Science 15 2 0 0
20 4 0 0
20 3 0 0
Social Science 22 5 0 0
20 5 0 0
22 5 0 0
Student Enrollment by Grade Level (2011-12 School Year)
Grade Level Number of Students Grade Level Number of Students
Kindergarten 0 Grade 8 0
Grade 1 0 Ungraded Elementary 0
Grade 2 0 Grade 9 0
Grade 3 0 Grade 10 11
Grade 4 0 Grade 11 44
Grade 5 0 Grade 12 41
Grade 6 0 Ungraded Secondary
Grade 7 0 Total Enrollment 96

School Accountability Report
Dixon Unified School District
3 | P a g e
School Accountability Report Reported for the 2011-12 School Year Published During 2012-13
Student Enrollment by Group (2011-12 School Year)
Group Percent of Total Enrollment Group Percent of Total
Enrollment
Black or African American 1.7 White (not Hispanic) 55
American Indian or Alaska Native
1.7 Two or More Races --
Asian -- Socioeconomically Disadvantaged
90
Filipino English Learners 25
Hispanic or Latino 40 Students with Disabilities 15
Native Hawaiian or Pacific Islander
1.7 --
II. School Safety and Facilities
School Safety Plan (2011-12)
Date School Safety Plan last reviewed: June 2011
Students at MPHS are guided by specific school and classroom expectations which foster mutual respect, cooperation, courtesy,
and tolerance of others. The site is monitored for physical security and safety which includes appropriate evacuation and
notification processes.
Suspensions & Expulsions This table displays the rate of suspensions and expulsions (the total of incidents divided by the total enrollment) at the school and the district
levels for the most recent three-year period. Total number of at-home suspensions divided by total number of students accounted in CBEDS for
11-12.
School District
2009-2010 2010-11 2011-12 2009-2010 2010-11 2011-12
Suspension Rate .8 32.0 11.4 .6 14.0 9.5
Expulsion Rate .6 0 .01 .5 .5 .5
School Facility Conditions Maine Prairie High School is a small, all portable building campus. There are five classrooms, an administrative/MP room and a restroom facility. MPHS has been in this site since 1977. The general condition of the campus is good. The school is cleaned daily. Students are supervised before, during and after school and the site is maintained to ensure student safety.
School Accountability Report
Dixon Unified School District
4 | P a g e
School Accountability Report Reported for the 2011-12 School Year Published During 2012-13
Planned Improvements (2012-13 School Year)
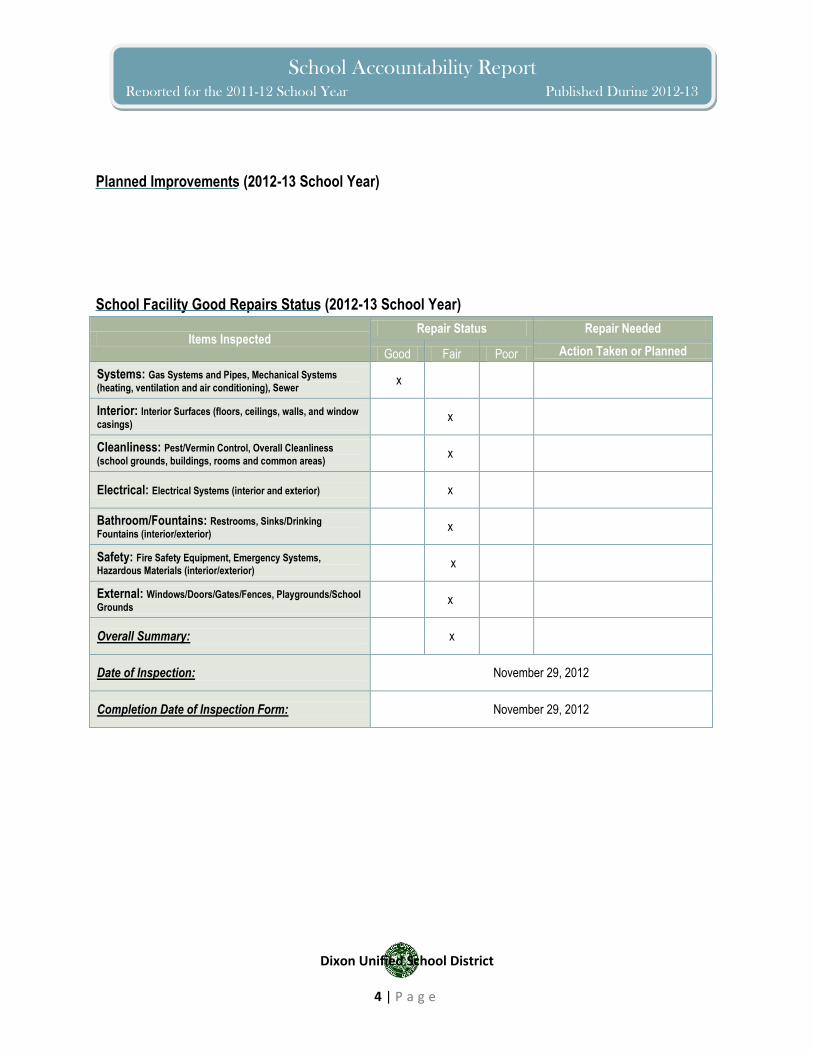
School Facility Good Repairs Status (2012-13 School Year)
Items Inspected Repair Status Repair Needed
Good Fair Poor Action Taken or Planned
Systems: Gas Systems and Pipes, Mechanical Systems
(heating, ventilation and air conditioning), Sewer x
Interior: Interior Surfaces (floors, ceilings, walls, and window
casings) x
Cleanliness: Pest/Vermin Control, Overall Cleanliness
(school grounds, buildings, rooms and common areas) x
Electrical: Electrical Systems (interior and exterior) x
Bathroom/Fountains: Restrooms, Sinks/Drinking
Fountains (interior/exterior) x
Safety: Fire Safety Equipment, Emergency Systems,
Hazardous Materials (interior/exterior) x
External: Windows/Doors/Gates/Fences, Playgrounds/School
Grounds x
Overall Summary:
x
Date of Inspection: November 29, 2012
Completion Date of Inspection Form: November 29, 2012

School Accountability Report
Dixon Unified School District
5 | P a g e
School Accountability Report Reported for the 2011-12 School Year Published During 2012-13
III. Curriculum and Instructional Materials
Quality, Currency and Availability of Textbooks and Instructional Materials (2011-12 School Year) This table displays information about the quality, currency, and availability of the standards-aligned textbooks and other instructional materials
used at this school; the year of the most recent adopted materials; and information about the school’s use of any supplemental curriculum or
non adopted textbooks or instructional materials.
MPHS uses textbooks and instructional materials which meet or exceed state standards. All materials are approved by the
governing board and consistent with the content and cycles of the curriculum frameworks adopted by the SBE. Every student
has access to their own textbooks and materials. MPHS follows the comprehensive high school selection process.
Subject Area Textbook Title/Publisher Year of Adoption
English-Language Arts Prentice Hall 2007
Mathematics Glencoe 2008
History-Social Science Prentice Hall Magruders
2006
Science Prentice Hall 2007
Other
Yes / No
Most recent SBE or Local Governing Agency Approved Textbooks and Instructional Materials
No
Availability of Textbooks and Instructional Materials
Core Curriculum Area Percent of Pupils who Lack Their Own Assigned Textbooks
and Instructional Materials
Reading/Language Arts 0
Mathematics 0
Science 0
History-Social Science 0
Foreign Language 0
School Accountability Report
Dixon Unified School District
6 | P a g e
School Accountability Report Reported for the 2011-12 School Year Published During 2012-13
Health 0
Visual and Performing Arts 0
Science Laboratory Equipment (9-12) 0
Textbook Information Collection Date: November 29, 2012
Textbook Insufficiency (if applicable) NA
Standardized Testing and Reporting The Standardized Testing and Reporting (STAR) Program consists of several key components, including the California Standards Tests
(CST’s); the California Modified Assessment (CMA), and the California Alternate Performance Assessment (CAPA). The CST’s show how well
students are doing in relation to the state content standards. The CST’s include English-language Arts (ELA) and mathematics in grades two
through eleven; science in grades five, eight, and nine through eleven; and history-social science in grades eight, and nine though eleven. The
CAPA is given to those students with significant cognitive disabilities whose disabilities prevent them from taking either the CST’s with
accommodations or modifications or the CMA with accommodations. The CMA includes ELA for grades three through eight and science in
grades five and eight and is an alternate assessment based on modified achievement standards. The CMA is designed to assess those
students whose disabilities preclude them from achieving grade-level proficiency on an assessment of the California content standards with or
without accommodations or modifications of the CMA with accommodations. Student scores are reported as performance levels. Detailed
information regarding the STAR Program results for each grade and performance level, including the percent of students not tested, can be
found on the CDE Standardized Testing and Reporting (STAR) Results Web site at http://star.cde.ca.gov. Program information regarding the
STAR program can be found in the Explaining 2011 STAR Program Results to the public guide at
http://www.cde.ca.gov/ta/tg/sr/documents/pkt5intrpts09.pdf
Note: Scores are not shown when the number of students tested is ten or less, either because the number of students in this category is too
small for statistical accuracy or to protect student privacy. In no case shall any group score be reported that would deliberately or inadvertently
make public the score or performance of any individual student.
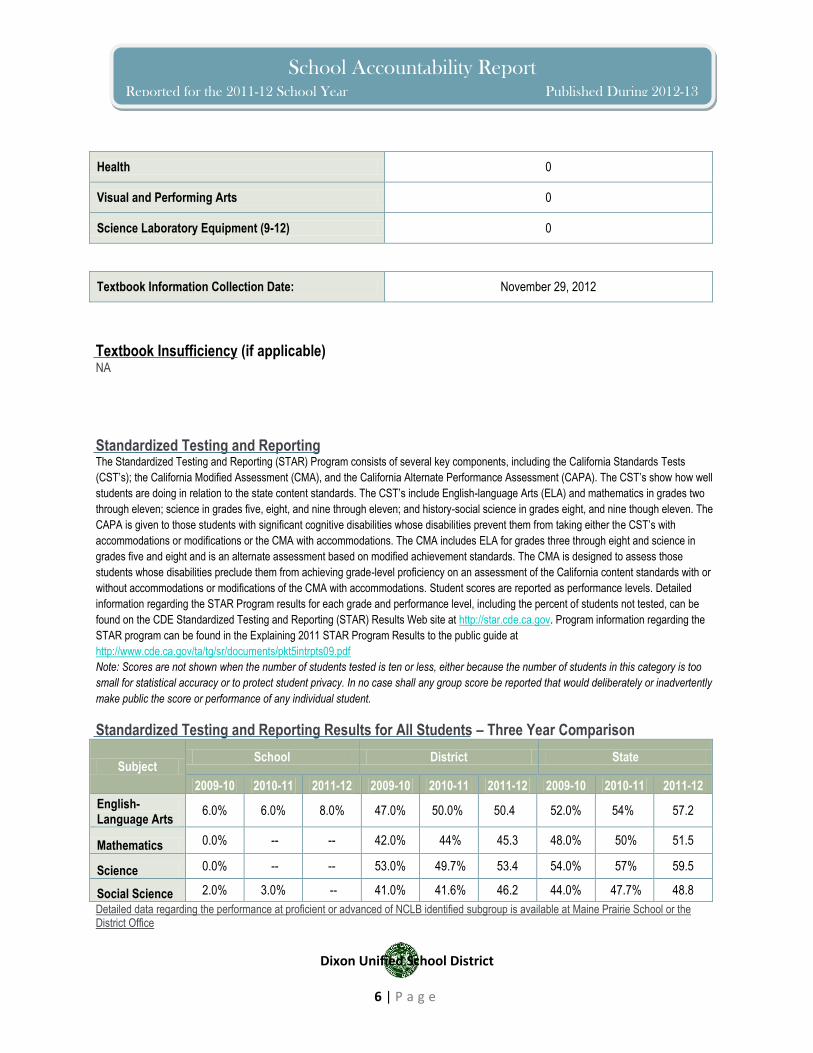
Standardized Testing and Reporting Results for All Students – Three Year Comparison
Subject School District State
2009-10 2010-11 2011-12 2009-10 2010-11 2011-12 2009-10 2010-11 2011-12
English-Language Arts
6.0% 6.0% 8.0% 47.0% 50.0% 50.4 52.0% 54% 57.2
Mathematics 0.0% -- -- 42.0% 44% 45.3 48.0% 50% 51.5
Science 0.0% -- -- 53.0% 49.7% 53.4 54.0% 57% 59.5
Social Science 2.0% 3.0% -- 41.0% 41.6% 46.2 44.0% 47.7% 48.8
Detailed data regarding the performance at proficient or advanced of NCLB identified subgroup is available at Maine Prairie School or the District Office

School Accountability Report
Dixon Unified School District
7 | P a g e
School Accountability Report Reported for the 2011-12 School Year Published During 2012-13
Standardized Testing and Reporting Results for by Student Group –Most Recent Year
Group Percentage of Students Scoring at Proficient or
Advanced Level
English-Language
Arts Mathematics Science
History- Social
Science
All Students in the District 50.4 45.3 53.4 46.2
All Students at the School 6 -- -- --
Black or African American -- -- -- --
American Indian or Alaska Native -- -- -- --
Asian -- -- -- --
Filipino -- -- -- --
Hispanic or Latino 7 -- 5 7
Native Hawaiian or Pacific Islander -- -- -- --
White (Not Hispanic) 9 -- -- 5
Two or More Races -- -- -- --
Male 9 -- 5 9
Female 5 -- -- --
Economically Disadvantaged -- -- -- --
English Learners -- -- -- --
Students with Disabilities -- -- -- --
Students Receiving Migrant Education Services
-- -- -- --
Detailed data regarding the performance at proficient or advanced of NCLB identified subgroup is available at Maine Prairie School or the District Office
2011-12 Alternative School Accountability Information (Based on ASAR) Report Summary (Based on CBEDS 2011-12)
Student Enrollment
Grades 9 – 12: 96
Total Long-term (90 day) Students Served 96
Total Independent Study Students Including in Total Long-term Students Served
7
Students Enrolled (unduplicated count): 96
School Accountability Report
Dixon Unified School District
8 | P a g e
School Accountability Report Reported for the 2011-12 School Year Published During 2012-13
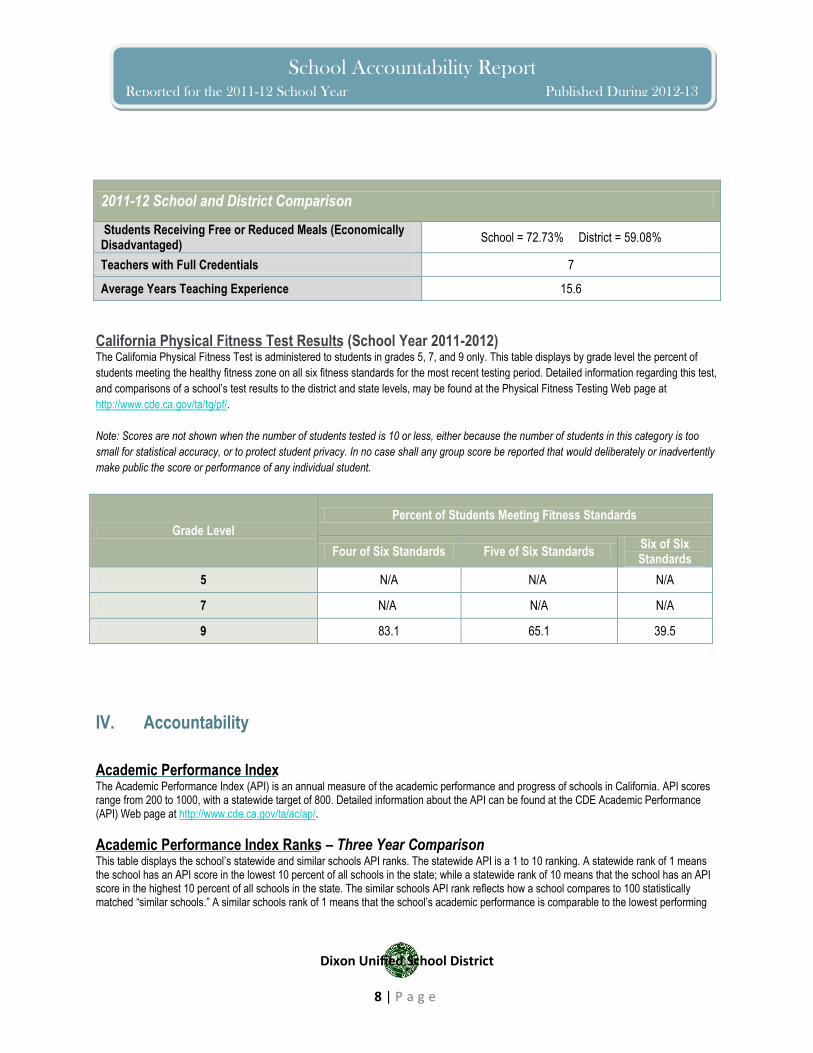
2011-12 School and District Comparison
Students Receiving Free or Reduced Meals (Economically Disadvantaged)
School = 72.73% District = 59.08%
Teachers with Full Credentials 7
Average Years Teaching Experience 15.6
California Physical Fitness Test Results (School Year 2011-2012) The California Physical Fitness Test is administered to students in grades 5, 7, and 9 only. This table displays by grade level the percent of
students meeting the healthy fitness zone on all six fitness standards for the most recent testing period. Detailed information regarding this test,
and comparisons of a school’s test results to the district and state levels, may be found at the Physical Fitness Testing Web page at
http://www.cde.ca.gov/ta/tg/pf/.
Note: Scores are not shown when the number of students tested is 10 or less, either because the number of students in this category is too
small for statistical accuracy, or to protect student privacy. In no case shall any group score be reported that would deliberately or inadvertently
make public the score or performance of any individual student.
Grade Level
Percent of Students Meeting Fitness Standards
Four of Six Standards Five of Six Standards Six of Six Standards
5 N/A N/A N/A
7 N/A N/A N/A
9 83.1 65.1 39.5
IV. Accountability
Academic Performance Index The Academic Performance Index (API) is an annual measure of the academic performance and progress of schools in California. API scores range from 200 to 1000, with a statewide target of 800. Detailed information about the API can be found at the CDE Academic Performance (API) Web page at http://www.cde.ca.gov/ta/ac/ap/.
Academic Performance Index Ranks – Three Year Comparison This table displays the school’s statewide and similar schools API ranks. The statewide API is a 1 to 10 ranking. A statewide rank of 1 means the school has an API score in the lowest 10 percent of all schools in the state; while a statewide rank of 10 means that the school has an API score in the highest 10 percent of all schools in the state. The similar schools API rank reflects how a school compares to 100 statistically matched “similar schools.” A similar schools rank of 1 means that the school’s academic performance is comparable to the lowest performing

School Accountability Report
Dixon Unified School District
9 | P a g e
School Accountability Report Reported for the 2011-12 School Year Published During 2012-13
10 schools of the 100 similar schools, while a similar schools rank of 10 means the school’s academic performance is better than at least 90 of the 100 similar school.
API Rank 2009 2010 2011
Statewide 0 0 0
Similar Schools 0 0 0
Academic Performance Index Growth by Student Group – Three Year Comparison
Group Actual API Change
2009-10 2010-11 2011-12
All Students at the School -49 -46 -71
Black or African American -- -- --
American Indian or Alaska Native
-- -- --
Asian -- -- --
Filipino -- -- --
Hispanic or Latino 0 0 --
Native Hawaiian or Pacific Islander
-- -- --
White (Not Hispanic) 0 0 --
Two or More Races -- -- --
Socioeconomically Disadvantaged
0 0 --
English Learners -- -- --
-Students with Disabilities -- -- --
Academic Performance Index Growth by Student Group – 2012 Growth API Comparison
Group 2012 Growth API
School District State
All Students at the School 14 7 12
Black or African American --
-- 14

School Accountability Report
Dixon Unified School District
10 | P a g e
School Accountability Report Reported for the 2011-12 School Year Published During 2012-13
American Indian or Alaska Native
-- -- 9
Asian --
-- 7
Filipino --
-- 10
Hispanic or Latino --
8 11
Native Hawaiian or Pacific Islander
-- -- 12
White (Not Hispanic) --
13 8
Two or More Races --
-- 13
Socioeconomically Disadvantaged
-- 6 11
English Learners --
-1 10
Students with Disabilities --
10 14
Adequate Yearly Progress The federal NCLB Act requires that all schools and districts meet the following Adequate Yearly Progress (AYP) criteria:
• Participation rate on the state’s standards-based assessments in English-language arts (ELA) and mathematics
• Percent proficient on the state’s standards-based assessments in ELA and mathematics
• API as an additional indicator
• Graduation rate (for secondary schools) Detailed information about AYP, including participation rates and percent proficient results by student group, can be found at the AYP Web page http://www.cde.ca.gov/ta/ac/ay/.
AYP Overall and by Criteria (2011-2012 School Year)
AYP Criteria School District
Overall 100 100
Participation Rate – English Language Arts 100 100
Participation Rate -- Mathematics 100 100
Percent Proficient – English Language Arts 6% 51.9
Percent Proficient – Mathematics -- 55.1
API ASAM 754
Graduation Rate 78 78.1

School Accountability Report
Dixon Unified School District
11 | P a g e
School Accountability Report Reported for the 2011-12 School Year Published During 2012-13
Federal Intervention Program (2011-2012 School Year) Schools and districts receiving federal Title I funding enter Program Improvement (PI) if they do not make AYP for two consecutive years in the
same content area (ELA or mathematics) or on the same indicator (API or graduation rate). After entering PI, schools and districts advance to
the next level of intervention with each additional year that they do not make AYP. Detailed information about PI identification can be found at
the CDE Adequate Yearly Progress (AYP) Web page at http://www.cde.ca.gov/ta/ac/ay/.
Indicator School District
Program Improvement Status NA Yes
First Year of Program Improvement NA 2008-09
Year in Program Improvement NA Year 3+
Number of Schools Currently in Program Improvement NA 3
V. Teachers and Support Staff
Teacher Credentials This table displays the number of teachers assigned to the school with a full credential, without a full credential, and those teaching outside of
their subject area of competence. Detailed information about teacher qualifications can be found on the CDE Web site on the DataQuest Web
page at http://dq.cde.ca.gov/dataquest/.
Parents may request information regarding the professional qualifications of their child’s teacher(s) and teacher(s)’ aide(s). Detailed information regarding teacher credentials can be found at: http://www.ctc.ca.gov/
Teachers School District
2009-10 2010-11 2011-12 2011-12
With Full Credential 5 7 7 171
Without Full Credential 0 0 0 0
Teaching Outside Subject Area of Competence
0 0 0 0
Vacant Teacher Positions and Teacher Misassignments
Indicators School
2009-2010 2010-2011 2011-2012

School Accountability Report
Dixon Unified School District
12 | P a g e
School Accountability Report Reported for the 2011-12 School Year Published During 2012-13
Vacant Teacher Positions 0 0 0
Misassignments of Teachers of English Learners 0 0 0
Total Teacher Misassignments 0 0 0
Core Academic Class Taught by No Child Left Behind Compliant Teachers (2011-12 School Year) This table displays the percent of classes in core academic subjects taught by No Child Left Behind (NCLB) compliant and non-NCLB
compliant teachers in the school, in all schools in the district, in high-poverty schools in the district, and in low-poverty schools in the district.
High poverty schools are defined as those schools with student participation of approximately 75 percent or more in the free and reduced price
meals program. Low poverty schools are those with student participation of approximately 25 percent or less in the free and reduced price
meals program. More information on teacher qualifications required under NCLB can be found on the CDE Improving Teacher and Principal
Quality Web page at http://www.cde.ca.gov/nclb/sr/tq/.
Location of Classes
Percent of Classes in Core Academic Subjects
Taught by NCLB Compliant Teachers Taught by Non-NCLB Complaint
Teachers
This School 100% 0%
All Schools in District 99% .5%
High-Poverty Schools in District 100% 0%
Low-Poverty Schools in District -- --
Professional Development This section provides detailed information on teacher and staff and the process in which they are trained for instructional improvement.
Faculty and staff have participated in a variety of professional development. All staff are preparing for the Western Association of Schools and Colleges (WASC) self study. Along with the district MPHS teachers are beginning to participate in Professional Learning Communities.
Professional Development Days
Indicator Professional Development Days
2009-10 2010-11 2011-12
Number of school days dedicated to staff development 2 2 2
Counselors, and Other Support Staff (School Year 2011-2012)
School Accountability Report
Dixon Unified School District
13 | P a g e
School Accountability Report Reported for the 2011-12 School Year Published During 2012-13
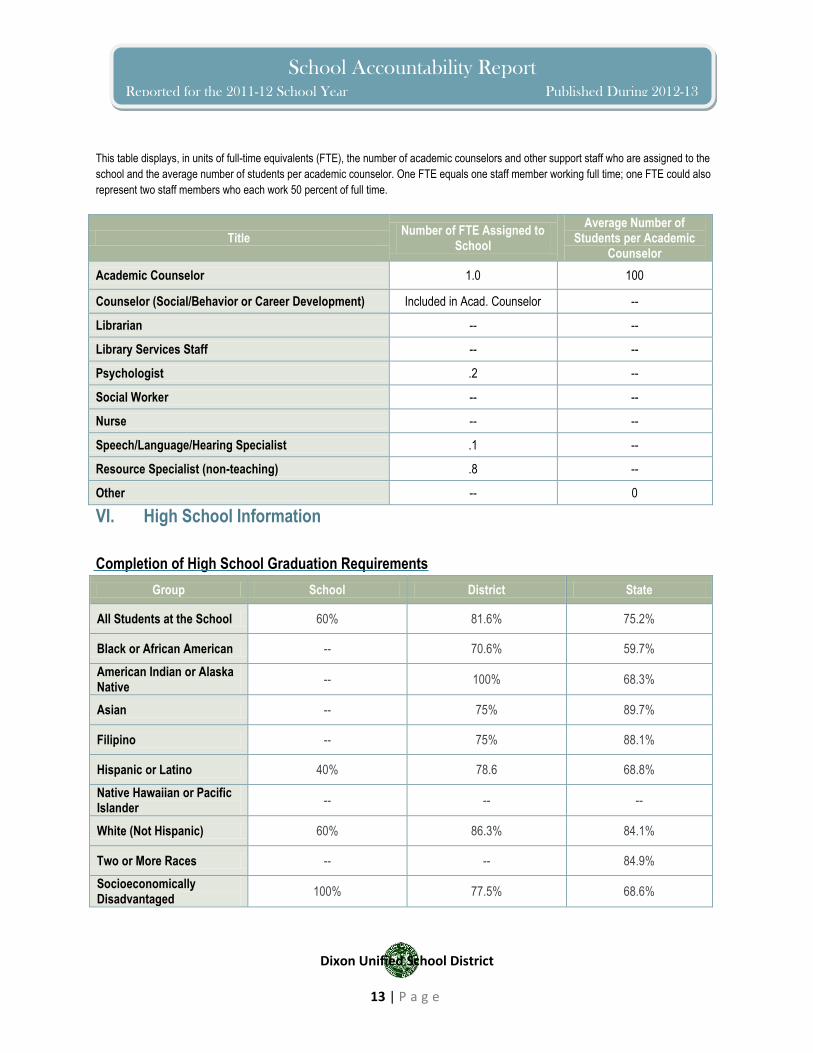
This table displays, in units of full-time equivalents (FTE), the number of academic counselors and other support staff who are assigned to the
school and the average number of students per academic counselor. One FTE equals one staff member working full time; one FTE could also
represent two staff members who each work 50 percent of full time.
Title Number of FTE Assigned to
School
Average Number of Students per Academic
Counselor
Academic Counselor 1.0 100
Counselor (Social/Behavior or Career Development) Included in Acad. Counselor --
Librarian -- --
Library Services Staff -- --
Psychologist .2 --
Social Worker -- --
Nurse -- --
Speech/Language/Hearing Specialist .1 --
Resource Specialist (non-teaching) .8 --
Other -- 0
VI. High School Information
Completion of High School Graduation Requirements
Group School District State
All Students at the School 60% 81.6% 75.2%
Black or African American -- 70.6% 59.7%
American Indian or Alaska Native
-- 100% 68.3%
Asian -- 75% 89.7%
Filipino -- 75% 88.1%
Hispanic or Latino 40% 78.6 68.8%
Native Hawaiian or Pacific Islander
-- -- --
White (Not Hispanic) 60% 86.3% 84.1%
Two or More Races -- -- 84.9%
Socioeconomically Disadvantaged
100% 77.5% 68.6%

School Accountability Report
Dixon Unified School District
14 | P a g e
School Accountability Report Reported for the 2011-12 School Year Published During 2012-13
English Learners 25% 64% 56.6%
Students with Disabilities 10% 62.9% 57.7%
Advanced Placement Courses (2011-12 School Year)
Subject Number of AP Courses Offered Percent of Students in AP Courses
English NA NA
Mathematics NA NA
Science NA NA
Social Studies NA NA
Computer Science NA NA
Foreign Language NA NA
Fine and Performing Arts NA NA
Other Courses NA NA
UC/CSU Course Measure Percent
Students Enrolled in Courses Required for UC/CSU Admissions
NA
Graduates Who Completed All Courses Required for UC/CSU Admission
NA
**For more information regarding Admissions: University of CA: http://www.universityofcalifornia.edu/admissions/.
CA State University: http://www.calstate.edu/admissions/.
Drop Out and Graduation Rate
School District State
2008-09 2009-10 2010-11 2008-09 2009-10 2010-11 2008-09 2009-10 2010-11
Drop Out Rate 7.2% 14.3% 16.4 4.5% 17.5% 14.4%

School Accountability Report
Dixon Unified School District
15 | P a g e
School Accountability Report Reported for the 2011-12 School Year Published During 2012-13
Graduation Rate
79.02% 81.8% 78.1% 78.6% 75.2% 76.3%
CAHSEE Results by Performance Level for All Students – Three-Year Comparison
Subject School District State
2009-10 2010-11 2011-12 2009-10 2010-11 2011-12 2009-10 2010-11 2011-12
English-Language Arts
0.0% 0.0% 0.0% 54.0% 56.3% 51.9% 54.0% 58.9% 58.1%
Mathematics 0.0% 0.0% 0.0% 64.0% 54.4% 55.1% 53.0% 56.2% 59.5%
CAHSEE Results by Performance Level for Student Groups
Group English-Language Arts Mathematics
Not Proficient Proficient Advanced
Not Proficient Proficient Advanced
All Students in the District -- -- -- -- -- --
All Students at this School -- -- -- -- -- --
Black or African American -- -- -- -- -- --
American Indian or Alaska Native -- -- -- -- -- --
Asian -- -- -- -- -- --
Filipino -- -- -- -- -- --
Hispanic or Latino -- -- -- -- -- --
Native Hawaiian or Pacific Islander
-- -- -- -- -- --
White (Not Hispanic) -- -- -- -- -- --
Two or more Races -- -- -- -- -- --
Male -- -- -- -- -- --
Female -- -- -- -- -- --
Economically Disadvantaged -- -- -- -- -- --
English Learners -- -- -- -- -- --
Students with Disabilities -- -- -- -- -- --
Students Receiving Migrant Education Services
-- -- -- -- -- --
** For more information on CAHSEE: http://cahsee.cde.ca.gov/, or visit Maine Prairie School or the District Office.

School Accountability Report
Dixon Unified School District
16 | P a g e
School Accountability Report Reported for the 2011-12 School Year Published During 2012-13
VII. School Finances
Expenditures Per Pupil and School Site Teacher Salaries (2010-11 Fiscal Year) This table displays a comparison of the school’s per pupil expenditures from unrestricted (basic) sources with other schools in the district and
throughout the state, and a comparison of the average teacher salary at the school site with average teacher salaries at the district and state
levels. Detailed information regarding school expenditures can be found at the Current Expense of Education Web page at
http://www.cde.ca.gov/ds/fd/ec/ and teacher salaries can be found on the Certificated Salaries and Benefits Web page at
http://www.cde.ca.gov/ds/fd/cs/.
Total Expenditures Per Pupil
Expenditures Per Pupil (Supplemental)
Expenditures Per Pupil (Basic)
Average Teacher Salary
School $6,819.00 $6,672.00 $147.00
District $6,850.00 $62,008.00
State $8,323.00 $67,871.00
Types of Services Funded (2011-12 Fiscal Year) Categorical funds, namely Economic Impact Aid (EIA) are spent on the school counselor.
Teacher and Administrative Salaries (2010-2011 Fiscal Year)
Range District State Average for Districts in the
Same Category
Beginning Teacher Salary $36,495.00 $38,725.00
Mid-Range Teacher Salary $55,593.00 $59,717.00
Highest Teacher Salary $74,377.00 $77,957.00
Average Principal Salary (Elementary) $86,806.00 $95,363.00
Average Principal Salary (Middle) $97,878.00 $98,545.00
Average Principal Salary (High) $101,018.00 $107,031.00
Superintendent Salary $168,566.00 $149,398.00
Percent of Budget for Teacher Salaries $40.75% 37.20%

School Accountability Report
Dixon Unified School District
17 | P a g e
School Accountability Report Reported for the 2011-12 School Year Published During 2012-13
Percent of Budget for Administrative Salaries
5.24% 5.85%
(http://www.cde.ca.gov/fg/fr/sa/cefavgsalaries.asp)
VIII. Data Access
DataQuest
DataQuest is an online data tool located on the CDE DataQuest Web page at http://dq.cde.ca.gov/dataquest that contains additional information about this school and comparisons of the school to the district, the county, and the state. Specifically, DataQuest is a dynamic system that provides reports for accountability (e.g Academic Performance Index [API], Adequate Yearly Process [AYP], test data, enrollment, graduates, dropouts, course enrollments, staffing and data pertaining to English Learners.
Internet Access
Internet access is available at public libraries and other locations that are publicly accessible (e.g., the California State Library). Access to the Internet at libraries and public locations is generally provided on a first-come, first-served basis. Other use restrictions may include the hours of operation, the length of time that a workstation may be used (depending on availability), the types of software programs available on a workstation, and the ability to print documents.