schill, rosellón, egerer
DESCRIPTION
Regulated Expansion of Electricity Transmission Networks: the effects of Fluctuating Demand and Wind Generation. Schill, Rosellón, Egerer. Outline. Motivation The model Model application Results Conclusions and challenges. Motivation. - PowerPoint PPT PresentationTRANSCRIPT

34th IAEE International Conference, Stockholm , June 19-23, 2011 Juan Rosellon, CIDE and DIW Berlin
Regulated Expansion of Electricity Transmission Networks: the effects of
Fluctuating Demand and Wind Generation
Schill, Rosellón, Egerer

16 June 2011 2
Outline
• Motivation
• The model
• Model application
• Results
• Conclusions and challenges

16 June 2011 3
Motivation• Starting point: Hogan, Rosellón and Vogelsang (2010)
- “HRV“– Rosellón and Weigt (2011), and Rosellón, Myslikóvá and
Zenón (2011): “Seminal, but simplified”• Challenges:
– Demand and prices vary considerably over a day / over a year
– Increasing importance of fluctuating wind power– Comparison to other regulatory regimes
• Our approach:– Include hourly time resolution and appropriate data– Implement additional regulatory regimes How will the HRV model perform?
16 June 2011 4
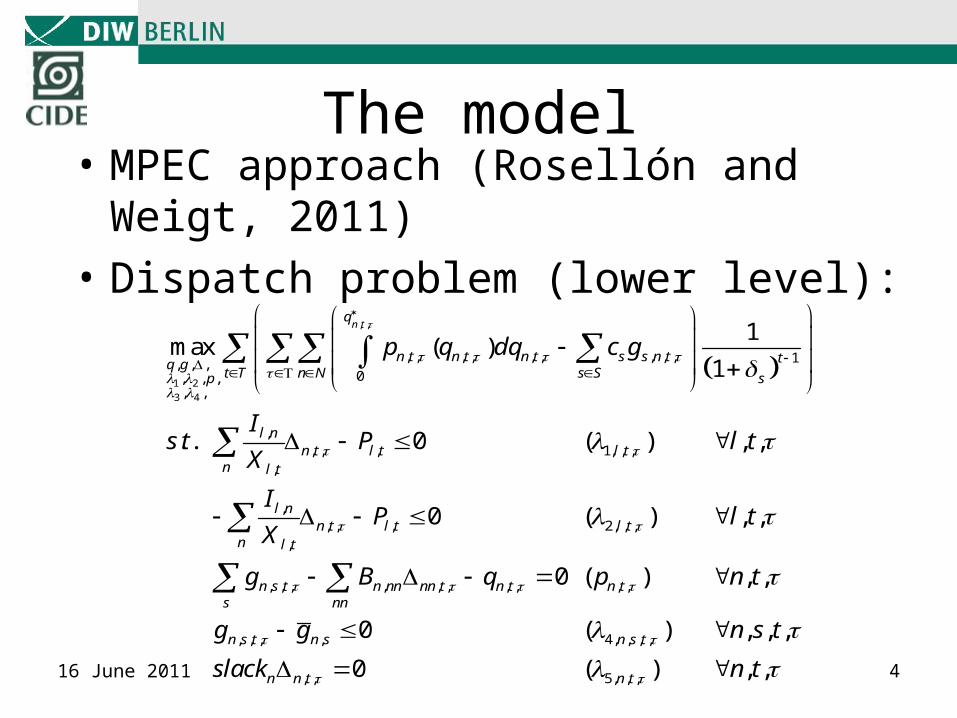
The model• MPEC approach (Rosellón and Weigt,
2011)
• Dispatch problem (lower level):
, ,
1 2
3 4
, , , , , , , , , 1, , ,0, , ,
, ,
,, , , 1, , ,
,
,, , , 2, , ,
,
, , ,
1max ( )
1
. . 0 ( ) , ,
0 ( ) , ,
n tq
n t n t n t s s n t tq gt T n N s Sp s
l nn t l t l t
n l t
l nn t l t l t
n l t
n s t ns
p q dq c g
Is t P l t
X
IP l t
X
g B
, , , , , , ,
, , , , 4, , , ,
, , 5, , ,
0 ( ) , ,
0 ( ) , , ,
0 ( ) , ,
nn nn t n t n tnn
n s t n s n s t
n n t n t
q p n t
g g n s t
slack n t

16 June 2011 5
Maximization Transco Problem (upper level)
, , , , , , , , , , 1
1max
1n t n t n t s n t t l l tt tp
t T n N s S l L tt t
p q p g fixpart ec ext

16 June 2011 6
Additional equations
• HRV cap on fix part:
, 1, , , , 1, , , , 1n N
, , , , , , , , ,n N
1
HRVn t n t n t s n t t
s S
HRVn t n t n t s n t t
s S
p q p g fixpart
RPI X
p q p g fixpart

16 June 20117
Model application• Implementation in GAMS• Elmod framework for load
flows• Stylized central European
network
F
NL3
NL2
BE2
BE1
NL1
GER
Cross border lines
Zonal lines
Unlimited zonal lines
Country borders
Main nodes
Auxilliary nodes
l1
l2
l3
l4
l5
l6
l7
l8
l9
l10l12
l11
l13
l14l15l16
l17
l18 l19
l20
Technology Variable generation costs in €/MWh
Overall available capacity
Nuclear 9 64,858
Lignite 29 15,120
Hard coal 35 35,064
CCGT 43 16,358
Gas turbine 65 16,286
Oil 72 12,584
Hydro 0 9,841
Wind 0 29,790
Table 1: Variable generation costs and available capacity

16 June 2011 8
Different casesCase Representation of demand Wind generation
Static Yearly average Yearly average
DRes 144 hours, representing six characteristic days of the year Yearly average
WindRes 144 hours, representing six characteristic days of the year Fluctuating pattern
Hourly reference demand at different nodes
0
10
20
30
40
50
60
70
80
90
1 13 25 37 49 61 73 85 97 109 121 133
hours
GW
F
GER
NL1
BE1
NL3
BE2
NL2
WeekdaySummer
WeekendSummer
WeekdayWinter
WeekendWinter
WeekdayShoulder
WeekendShoulder
Figure 2: Hourly nodal reference demand in DRes and WindRes
6 October 2010 9
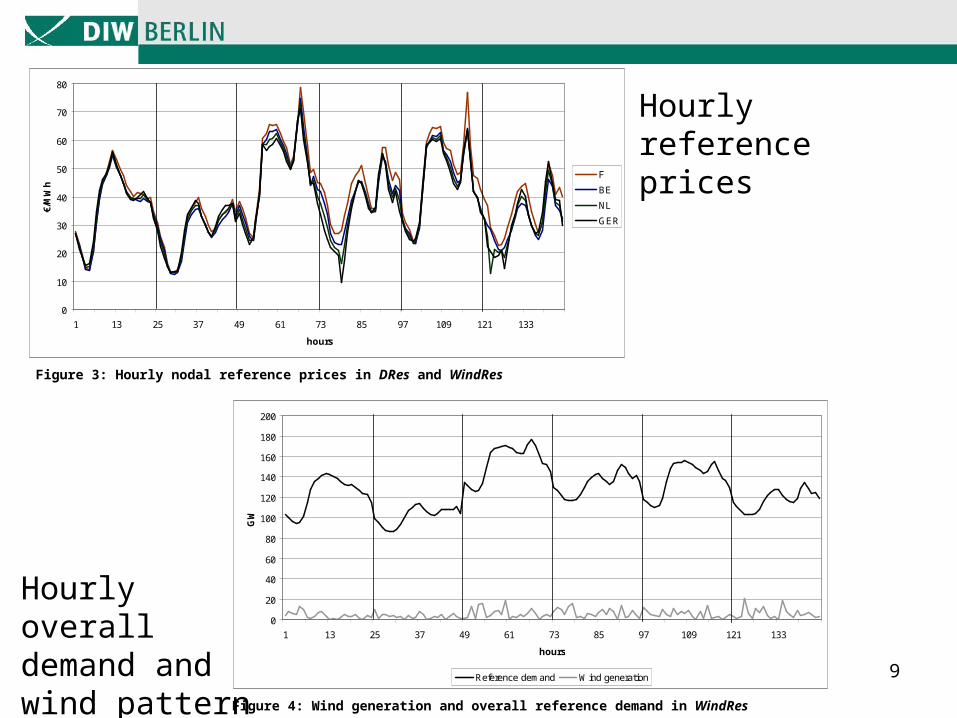
Hourly overall demand and wind pattern
Hourly reference prices
0
10
20
30
40
50
60
70
80
1 13 25 37 49 61 73 85 97 109 121 133
hours
€/M
Wh
F
BE
NL
GER
WeekdaySummer
WeekendSummer
WeekdayWinter
WeekendWinter
WeekdayShoulder
WeekendShoulder
Figure 3: Hourly nodal reference prices in DRes and WindRes
0
20
40
60
80
100
120
140
160
180
200
1 13 25 37 49 61 73 85 97 109 121 133
hours
GW
Reference demand Wind generation
WeekdaySummer
WeekendSummer
WeekdayWinter
WeekendWinter
WeekdayShoulder
WeekendShoulder
Figure 4: Wind generation and overall reference demand in WindRes
16 June 201110
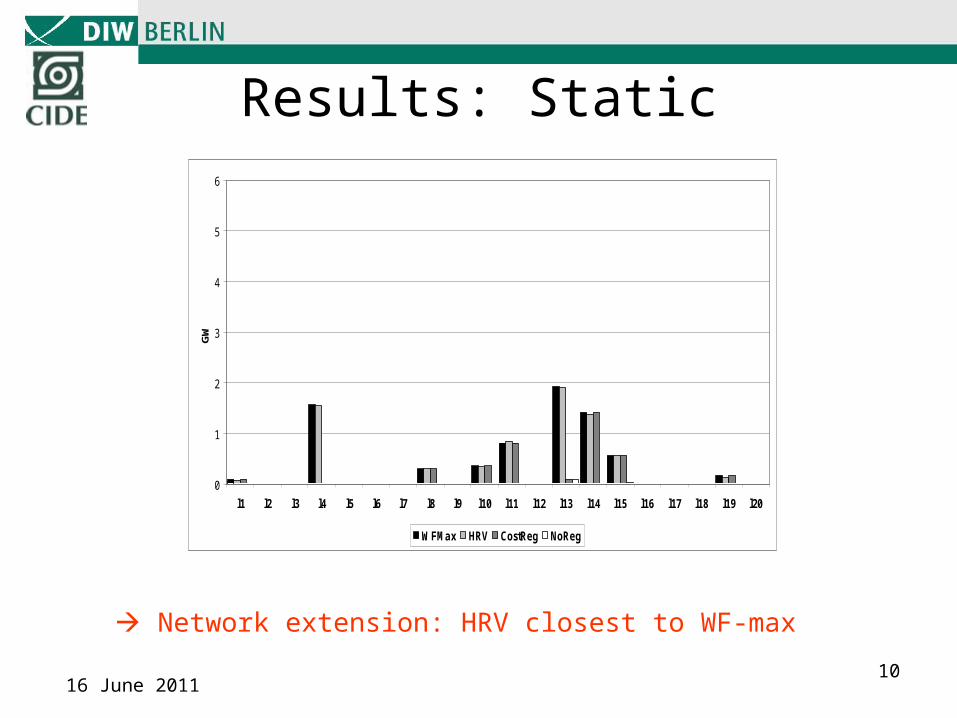
Results: Static
Network extension: HRV closest to WF-max
0
1
2
3
4
5
6
l1 l2 l3 l4 l5 l6 l7 l8 l9 l10 l11 l12 l13 l14 l15 l16 l17 l18 l19 l20
GW
WFMax HRV CostReg NoReg

16 June 2011 11
Line expansion (Static)
Extension: Germany-Netherlands and France-Belgium
100%
105%
110%
115%
120%
125%
t0 t1 t2 t3 t4 t5
MW
WFMax
HRV
CostReg
NoReg
Figure 6: Time path of overall extension in the Static case

16 June 2011 12
Results: Static vs. DRes
Demand fluctuations increase extension in wf-max and HRV
Opposite effect in noreg and costreg cases!
Social welfare
Producer rent
Consumer rent
Congestion rent
Extension costs
Transco profit
Fixed part
WFMax +1.94 +19.04 -15.57 -1.50 +0.03 -1.50 -
NoReg +0.13 -1.42 +1.36 +0.19 +0.00 +0.19 -
CostReg +0.11 -1.43 +1.37 +0.19 +0.01 +0.19 +0.02
HRV +1.81 +13.08 -11.13 -0.12 +0.02 +1.68 +1.82
Social welfare
Producer rent
Consumer rent
Congestion rent
Extension costs
Transco profit
Fixed part
WFMax +2.80 +11.13 -5.97 -2.27 +0.08 -2.27 -
NoReg +1.10 +1.82 -1.13 +0.42 +0.01 +0.41 -
CostReg +1.06 +1.77 -1.08 +0.41 +0.04 +0.42 +0.04
HRV +2.25 +6.59 -3.62 -0.68 +0.04 +1.79 +2.51

16 June 2011 13
Hourly prices in t5 (Dres, WFMax)
0
10
20
30
40
50
60
70
80
90
1 7 13 19 25 31 37 43 49 55 61 67 73 79 85 91 97 103 109 115 121 127 133 139
€/M
Wh
GER
F
BE1
BE2
NL1
NL2
NL3
Hourly prices in t5 (Dres, HRV)
0
10
20
30
40
50
60
70
80
90
1 7 13 19 25 31 37 43 49 55 61 67 73 79 85 91 97 103 109 115 121 127 133 139
€/M
Wh
GER
F
BE1
BE2
NL1
NL2
NL3
Hourly prices in t5 (Dres, CostReg)
0
10
20
30
40
50
60
70
80
90
1 7 13 19 25 31 37 43 49 55 61 67 73 79 85 91 97 103 109 115 121 127 133 139
€/M
Wh
GER
F
BE1
BE2
NL1
NL2
NL3
Hourly prices in t5 (Dres, NoReg)
0
10
20
30
40
50
60
70
80
90
1 7 13 19 25 31 37 43 49 55 61 67 73 79 85 91 97 103 109 115 121 127 133 139
€/M
Wh
GER
F
BE1
BE2
NL1
NL2
NL3
Price convergence in DRes
Figure 18: Convergence of hourly nodal prices under different regulatory approaches in DRes

16 June 2011 14
WindRes
HRV again closer to wf-max than noreg and costreg
Social welfare
Producer rent
Consumer rent
Congestion rent
Extension costs
Transco profit
Fixed part
WFMax+2.80 +11.13 -5.97 -2.27 +0.08 -2.27 -
NoReg+1.10 +1.82 -1.13 +0.42 +0.01 +0.41 -
CostReg+1.06 +1.77 -1.08 +0.41 +0.04 +0.42 +0.04
HRV+2.25 +6.59 -3.62 -0.68 +0.04 +1.79 +2.51
Table 5: Welfare results DRes: Differences to baseline without extension in bn €
Social welfare
Producer rent
Consumer rent
Congestion rent
Extension costs
Transco profit
Fixed part
WFMax+2.82 +11.46 -6.31 -2.25 +0.08 -2.33 -
NoReg+1.09 +1.81 -1.15 +0.44 +0.01 +0.43 -
CostReg+1.09 +1.99 -1.30 +0.44 +0.05 +0.44 +0.05
HRV+2.30 +6.80 -3.69 -0.76 +0.04 +1.79 +2.59
Table 6: Welfare results WindRes: Differences to baseline without extension in bn €

16 June 201115
Comparison of welfare and extension results
HRV much closer to wf-optimum in all cases robust!
Fluctuating demand and wind power both increase the gap between wf-max and the regulatory cases
-20%
0%
20%
40%
60%
80%
100%
HRV NoReg CostReg
Ten regulatory periods Higher extension costs
More wind Endogenous line reactance
Figure 17: Social welfare gain of extension compared to WFMax for different model runs
16 June 2011 16
Conclusions• Details matter in electricity market modelling:
– Demand: simplified, static approach systematically underestimates the need for transmission upgrades
– Fluctuating wind: further increases expansion requirements
• HRV is robust against demand and wind fluctuations– WF: HRV closest to wf-max– Extension: HRV also leads to second-highest outcomes– Performance of HRV relative to alternatives increases with more
realistic setting!
• HRV has favourable characteristics for future large-scale wind integration (high extension)
further research necessary

16 June 2011 17
Challenges
• Computationally very intensive• Data:
– Better reference demands and prices– More realistic wind power fluctuations
• Strong assumptions:– Perfect competition in generation– A single Transco