schedule 3 priority infrastructure plan mapping and … · web viewschedule 3 – priority...
TRANSCRIPT

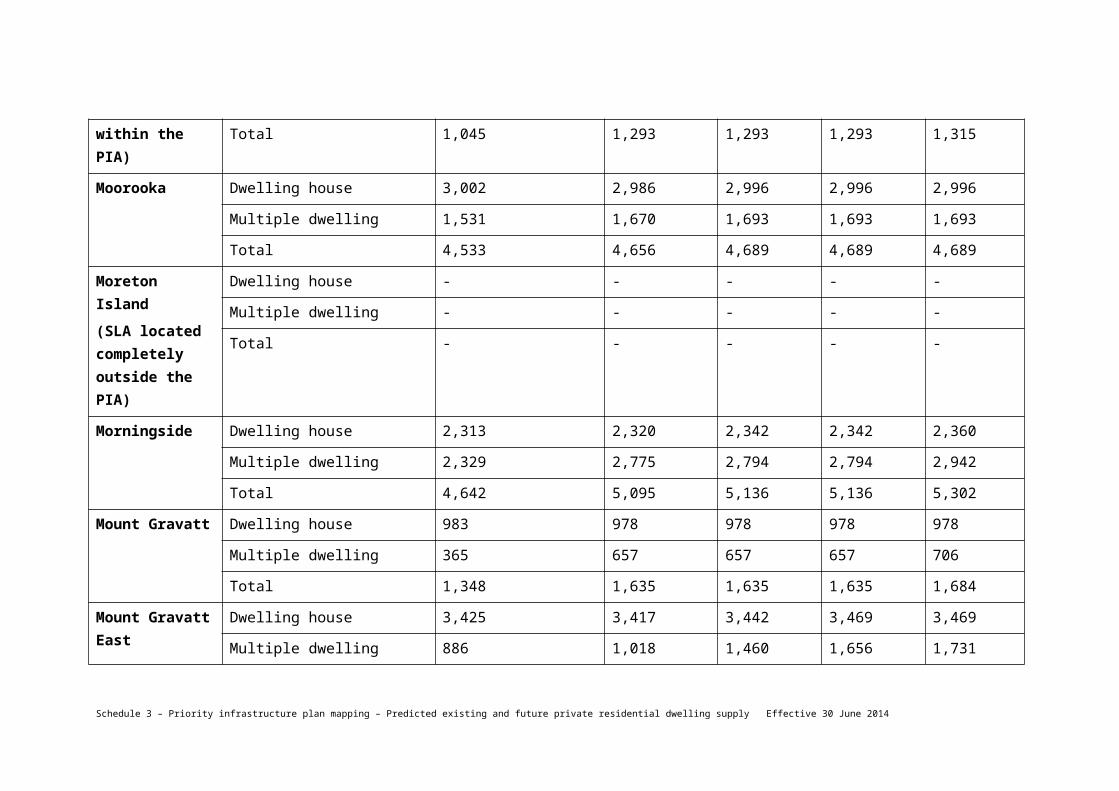
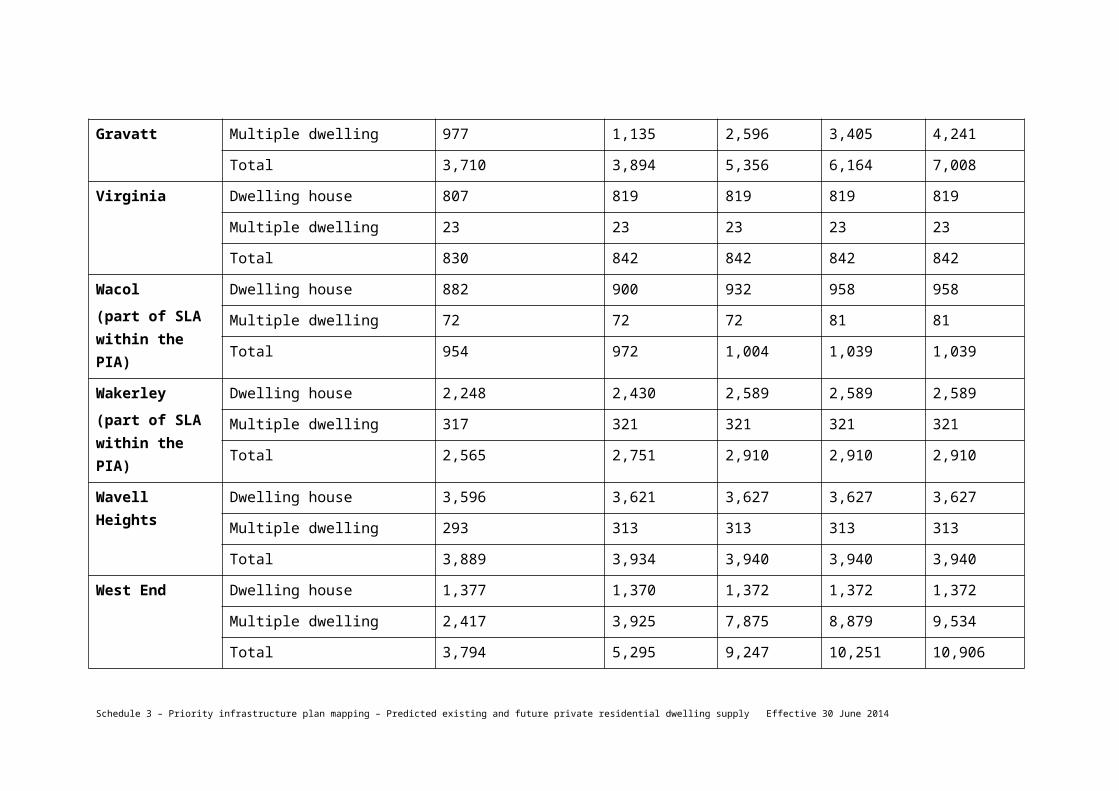
SC3.6 Predicted existing and future private residential dwelling supply
The predicted existing and future private residential dwelling supply in the local government area is stated in Table SC3.6.1 for the following:
(1) the priority infrastructure area locality in column 1;
(2) the development category in column 2;
(3) the time period in column 3.
Table SC3.6.1—Predicted existing and future private residential dwelling supply
Column 1 Column 2 Column 3
PIA locality
(Statistical local area ASGC 2011)
Development category Predicted existing and future private residential dwelling supply (number)
2011
(Predicted existing)
2016 2021 2026 2031
Predicted existing and future private residential dwelling supply within the priority infrastructure area
Acacia Ridge Dwelling house (1) 2,503 2,509 2,512 2,512 2,512
Multiple dwelling (2) 213 335 354 354 354
Total 2,716 2,844 2,866 2,866 2,866Albion Dwelling house 589 590 591 591 591
Multiple dwelling 675 1,424 1,743 2,383 2,723
Total 1,264 2,014 2,334 2,974 3,314
A
Schedule 3 – Priority infrastructure plan mapping – Predicted existing and future private residential dwelling supply Effective 30 June 2014

Alderley Dwelling house 1,647 1,648 1,648 1,648 1,648
Multiple dwelling 885 1,165 1,168 1,168 1,168
Total 2,532 2,813 2,816 2,816 2,816
Algester Dwelling house 2,695 2,699 2,701 2,701 2,701
Multiple dwelling 709 1,023 1,023 1,023 1,023
Total 3,404 3,722 3,724 3,724 3,724
Annerley Dwelling house 2,232 2,222 2,230 2,230 2,230
Multiple dwelling 2,734 2,897 2,916 2,916 2,916
Total 4,966 5,119 5,146 5,146 5,146
Anstead
(SLA located completely outside the PIA)
Dwelling house - - - - -
Multiple dwelling - - - - -
Total - - - - -
Archerfield Dwelling house 226 226 227 227 227
Multiple dwelling 20 20 20 20 20
Total 246 246 247 247 247
Ascot Dwelling house 1,188 1,183 1,191 1,195 1,209
Multiple dwelling 1,296 2,627 2,631 2,637 2,645
Total 2,484 3,810 3,822 3,832 3,854
Ashgrove Dwelling house 3,860 3,877 3,885 3,885 3,885
Schedule 3 – Priority infrastructure plan mapping – Predicted existing and future private residential dwelling supply Effective 30 June 2014
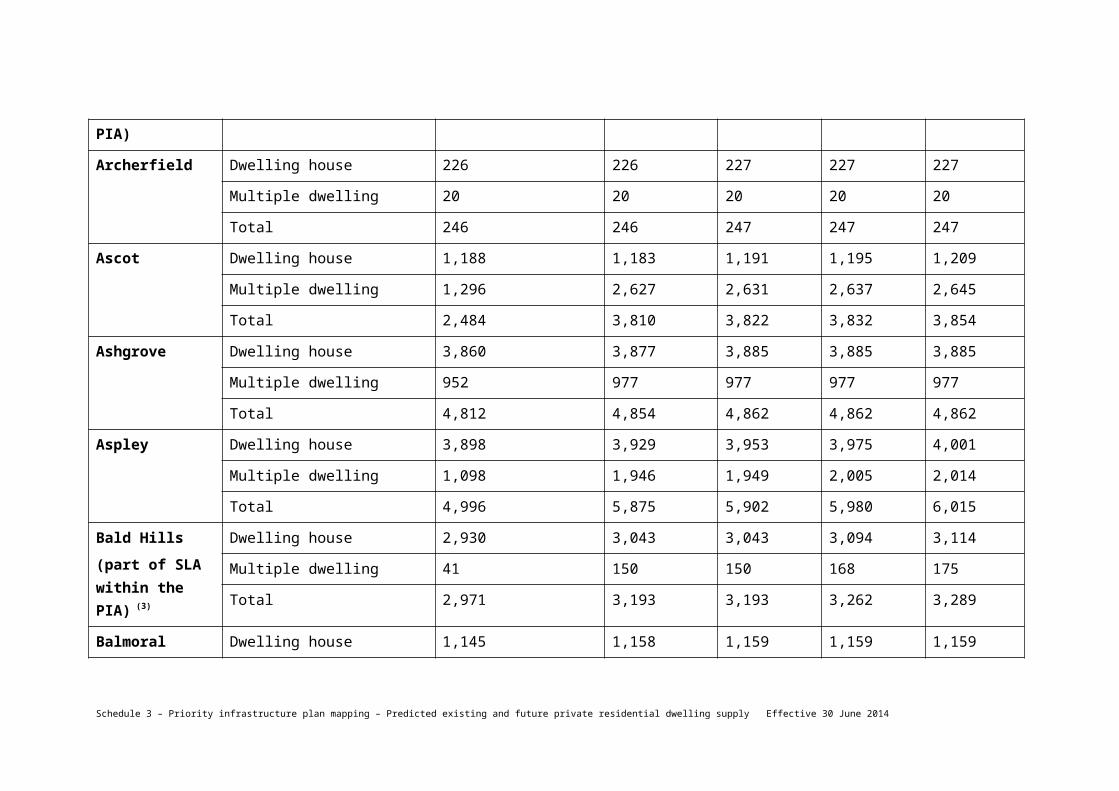
Multiple dwelling 952 977 977 977 977
Total 4,812 4,854 4,862 4,862 4,862
Aspley Dwelling house 3,898 3,929 3,953 3,975 4,001
Multiple dwelling 1,098 1,946 1,949 2,005 2,014
Total 4,996 5,875 5,902 5,980 6,015
Bald Hills
(part of SLA within the PIA) (3)
Dwelling house 2,930 3,043 3,043 3,094 3,114
Multiple dwelling 41 150 150 168 175
Total 2,971 3,193 3,193 3,262 3,289
Balmoral Dwelling house 1,145 1,158 1,159 1,159 1,159
Multiple dwelling 541 597 599 599 599
Total 1,686 1,755 1,758 1,758 1,758
Banyo Dwelling house 2,111 2,136 2,136 2,135 2,135
Multiple dwelling 138 138 138 183 183
Total 2,249 2,274 2,274 2,318 2,318
Bardon
(part of SLA within the PIA)
Dwelling house 3,144 3,214 3,219 3,227 3,237
Multiple dwelling 541 542 542 542 542
Total 3,685 3,756 3,761 3,769 3,779
Bellbowrie Dwelling house 1,699 1,804 1,804 1,804 1,804
Schedule 3 – Priority infrastructure plan mapping – Predicted existing and future private residential dwelling supply Effective 30 June 2014

(part of SLA within the PIA)
Multiple dwelling 121 195 195 195 195
Total 1,820 1,999 1,999 1,999 1,999
Belmont-Mackenzie
(part of SLA within the PIA)
Dwelling house 1,400 1,442 1,464 1,464 1,464
Multiple dwelling 119 119 119 119 119
Total 1,519 1,561 1,583 1,583 1,583
Boondall Dwelling house 3,037 3,071 3,080 3,118 3,145
Multiple dwelling 193 339 342 395 440
Total 3,230 3,410 3,422 3,513 3,585
Bowen Hills Dwelling house 91 90 90 90 89
Multiple dwelling 843 1,766 3,217 3,553 3,759
Total 934 1,856 3,307 3,643 3,848
Bracken Ridge
(part of SLA within the PIA)
Dwelling house 5,247 5,326 5,352 5,352 5,584
Multiple dwelling 649 720 788 788 1,259
Total 5,896 6,046 6,140 6,140 6,843
Bridgeman Downs
(part of SLA within the PIA)
Dwelling house 1,940 2,075 2,155 2,420 2,639
Multiple dwelling 277 315 499 854 1,348
Total 2,217 2,390 2,654 3,274 3,987
Brighton
(part of SLA within
Dwelling house 3,431 3,469 3,469 3,469 3,469
Multiple dwelling 179 214 214 214 214
Schedule 3 – Priority infrastructure plan mapping – Predicted existing and future private residential dwelling supply Effective 30 June 2014

the PIA)
Total 3,610 3,683 3,683 3,683 3,683
Brookfield (incl. Brisbane Forest Park)
(SLA located completely outside the PIA)
Dwelling house 445 447 447 447 447
Multiple dwelling 0 0 0 0 0
Total 445 447 447 447 447
Bulimba Dwelling house 1,523 1,544 1,622 1,622 1,622
Multiple dwelling 1,233 1,340 2,191 2,191 2,225
Total 2,756 2,884 3,813 3,813 3,847
Burbank
(SLA located completely outside the PIA)
Dwelling house - - - - -
Multiple dwelling - - - - -
Total - - - - -
Calamvale Dwelling house 3,797 3,937 4,053 4,053 4,086
Multiple dwelling 785 1,494 1,496 1,496 1,496
Total 4,582 5,431 5,549 5,549 5,582
Camp Hill Dwelling house 3,602 3,642 3,649 3,652 3,652
Multiple dwelling 644 719 719 724 724
Total 4,246 4,361 4,368 4,376 4,376
Schedule 3 – Priority infrastructure plan mapping – Predicted existing and future private residential dwelling supply Effective 30 June 2014

Cannon Hill Dwelling house 2,113 2,156 2,191 2,191 2,190
Multiple dwelling 203 519 1,107 1,107 1,141
Total 2,316 2,675 3,298 3,298 3,331
Carina Dwelling house 2,977 2,985 3,017 3,082 3,082
Multiple dwelling 1,451 1,600 1,631 1,631 1,631
Total 4,428 4,585 4,648 4,713 4,713
Carina Heights Dwelling house 1,650 1,650 1,651 1,651 1,665
Multiple dwelling 957 1,108 1,126 1,126 1,131
Total 2,607 2,758 2,777 2,777 2,796
Carindale Dwelling house 4,259 4,496 4,502 4,502 4,703
Multiple dwelling 509 522 580 580 590
Total 4,768 5,018 5,082 5,082 5,293
Carseldine Dwelling house 2,440 2,593 2,640 2,658 2,948
Multiple dwelling 518 859 1,688 1,737 2,446
Total 2,958 3,452 4,328 4,395 5,394
Chandler-Capalaba West
(SLA located completely outside the PIA)
Dwelling house - - - - -
Multiple dwelling - - - - -
Total - - - - -
Schedule 3 – Priority infrastructure plan mapping – Predicted existing and future private residential dwelling supply Effective 30 June 2014

Chapel Hill
(part of SLA within the PIA)
Dwelling house 3,595 3,659 3,679 3,679 3,679
Multiple dwelling 42 44 44 44 44
Total 3,637 3,703 3,723 3,723 3,723
Chelmer Dwelling house 941 960 966 966 966
Multiple dwelling 127 127 127 127 127
Total 1,068 1,087 1,093 1,093 1,093
Chermside Dwelling house 1,486 1,462 1,462 1,462 1,462
Multiple dwelling 2,739 3,559 4,784 5,715 6,016
Total 4,225 5,021 6,246 7,177 7,478
Chermside West Dwelling house 2,368 2,373 2,380 2,380 2,392
Multiple dwelling 26 52 52 52 56
Total 2,394 2,425 2,432 2,432 2,448
City - Inner Dwelling house 0 0 0 0 0
Multiple dwelling 2,201 2,631 2,631 2,631 2,631
Total 2,201 2,631 2,631 2,631 2,631
City - Remainder Dwelling house 400 400 400 400 400
Multiple dwelling 2,060 3,429 3,431 3,431 3,431
Total 2,460 3,829 3,831 3,831 3,831
Clayfield Dwelling house 1,938 1,947 1,956 1,956 1,966
Schedule 3 – Priority infrastructure plan mapping – Predicted existing and future private residential dwelling supply Effective 30 June 2014

Multiple dwelling 3,081 3,173 3,182 3,182 3,182
Total 5,019 5,120 5,138 5,138 5,148
Coopers Plains Dwelling house 1,568 1,597 1,605 1,605 1,624
Multiple dwelling 116 122 126 126 126
Total 1,684 1,719 1,731 1,731 1,750
Coorparoo Dwelling house 3,343 3,348 3,357 3,357 3,357
Multiple dwelling 3,633 3,747 3,785 4,123 4,387
Total 6,976 7,095 7,142 7,480 7,744
Corinda Dwelling house 1,375 1,389 1,399 1,399 1,399
Multiple dwelling 513 536 542 628 673
Total 1,888 1,925 1,941 2,027 2,072
Darra-Sumner Dwelling house 1,548 1,572 1,606 1,606 1,606
Multiple dwelling 122 218 253 253 253
Total 1,670 1,790 1,859 1,859 1,859
Deagon Dwelling house 1,457 1,481 1,481 1,481 1,481
Multiple dwelling 71 226 226 226 226
Total 1,528 1,707 1,707 1,707 1,707
Doolandella-Forest Lake
Dwelling house 6,489 6,628 6,717 6,717 6,717
Multiple dwelling 310 768 769 769 769
Schedule 3 – Priority infrastructure plan mapping – Predicted existing and future private residential dwelling supply Effective 30 June 2014

(part of SLA within the PIA)
Total 6,799 7,396 7,486 7,486 7,486
Durack
(part of SLA within the PIA)
Dwelling house 1,741 1,808 1,983 1,983 1,983
Multiple dwelling 445 507 518 518 518
Total 2,186 2,315 2,501 2,501 2,501
Dutton Park Dwelling house 356 355 363 363 363
Multiple dwelling 231 826 827 827 827
Total 587 1,181 1,190 1,190 1,190
East Brisbane Dwelling house 1,276 1,280 1,284 1,284 1,287
Multiple dwelling 1,321 1,430 1,432 1,590 1,972
Total 2,597 2,710 2,716 2,874 3,259
Eight Mile Plains Dwelling house 3,485 3,743 3,885 4,061 4,169
Multiple dwelling 1,165 1,786 1,787 1,817 1,838
Total 4,650 5,529 5,672 5,878 6,007
Ellen Grove Dwelling house 1,958 1,980 2,027 2,031 2,450
Multiple dwelling 158 205 255 1,118 1,341
Total 2,116 2,185 2,282 3,149 3,791
Enoggera Dwelling house 1,866 1,891 1,900 1,900 1,900
Multiple dwelling 1,386 1,482 1,489 1,489 1,489
Schedule 3 – Priority infrastructure plan mapping – Predicted existing and future private residential dwelling supply Effective 30 June 2014

Total 3,252 3,373 3,389 3,389 3,389
Everton Park Dwelling house 2,767 2,773 2,789 2,789 2,794
Multiple dwelling 888 1,245 2,530 2,530 2,530
Total 3,655 4,018 5,319 5,319 5,324
Fairfield Dwelling house 812 813 814 814 814
Multiple dwelling 355 411 411 411 411
Total 1,167 1,224 1,225 1,225 1,225
Ferny Grove Dwelling house 1,815 1,867 1,867 1,867 1,867
Multiple dwelling 196 237 237 237 237
Total 2,011 2,104 2,104 2,104 2,104
Fig Tree Pocket Dwelling house 1,228 1,353 1,353 1,353 1,353
Multiple dwelling 15 2 2 2 2
Total 1,243 1,355 1,355 1,355 1,355
Fortitude Valley Dwelling house 208 211 211 211 211
Multiple dwelling 3,204 4,833 6,943 7,761 8,373
Total 3,412 5,044 7,154 7,972 8,584
Geebung Dwelling house 1,642 1,653 1,653 1,653 1,658
Multiple dwelling 26 26 26 26 26
Total 1,668 1,679 1,679 1,679 1,684
Schedule 3 – Priority infrastructure plan mapping – Predicted existing and future private residential dwelling supply Effective 30 June 2014

Graceville Dwelling house 1,520 1,536 1,542 1,542 1,542
Multiple dwelling 183 183 183 183 183
Total 1,703 1,719 1,725 1,725 1,725
Grange Dwelling house 1,414 1,433 1,441 1,441 1,441
Multiple dwelling 205 207 207 207 207
Total 1,619 1,640 1,648 1,648 1,648
Greenslopes Dwelling house 1,811 1,807 1,815 1,815 1,815
Multiple dwelling 2,571 2,711 2,736 2,736 2,815
Total 4,382 4,518 4,551 4,551 4,630
Gumdale-Ransome
(part of SLA within the PIA)
Dwelling house 6 7 7 7 7
Multiple dwelling 0 0 0 0 0
Total 6 7 7 7 7
Hamilton Dwelling house 1,016 1,017 1,031 1,039 1,044
Multiple dwelling 1,384 2,739 3,062 3,142 3,226
Total 2,400 3,756 4,093 4,181 4,270
Hawthorne Dwelling house 1,279 1,293 1,298 1,298 1,298
Multiple dwelling 687 738 742 742 742
Total 1,966 2,031 2,040 2,040 2,040
Hemmant-Lytton Dwelling house 949 956 956 956 956
Schedule 3 – Priority infrastructure plan mapping – Predicted existing and future private residential dwelling supply Effective 30 June 2014

Multiple dwelling 65 65 65 65 65
Total 1,014 1,021 1,021 1,021 1,021
Hendra Dwelling house 1,584 1,626 1,701 1,701 1,701
Multiple dwelling 261 259 283 283 283
Total 1,845 1,885 1,984 1,984 1,984
Herston Dwelling house 370 373 373 373 375
Multiple dwelling 453 550 550 656 660
Total 823 923 923 1,029 1,035
Highgate Hill Dwelling house 1,072 1,069 1,071 1,070 1,068
Multiple dwelling 1,755 1,879 1,900 1,937 2,065
Total 2,827 2,948 2,971 3,007 3,133
Holland Park Dwelling house 2,774 2,793 2,798 2,798 2,798
Multiple dwelling 406 427 427 427 427
Total 3,180 3,220 3,225 3,225 3,225
Holland Park West Dwelling house 1,932 1,942 1,963 1,963 1,991
Multiple dwelling 640 884 884 884 940
Total 2,572 2,826 2,847 2,847 2,931
Inala Dwelling house 4,572 4,614 4,625 4,715 4,749
Multiple dwelling 366 366 369 631 654
Schedule 3 – Priority infrastructure plan mapping – Predicted existing and future private residential dwelling supply Effective 30 June 2014

Total 4,938 4,980 4,994 5,346 5,403
Indooroopilly Dwelling house 2,636 2,660 2,676 2,676 2,680
Multiple dwelling 2,361 2,388 2,393 2,699 3,071
Total 4,997 5,048 5,069 5,375 5,751
Jamboree Heights Dwelling house 1,261 1,261 1,262 1,262 1,262
Multiple dwelling 90 90 90 90 90
Total 1,351 1,351 1,352 1,352 1,352
Jindalee Dwelling house 1,868 1,873 1,877 1,877 1,877
Multiple dwelling 4 4 4 4 4
Total 1,872 1,877 1,881 1,881 1,881
Kangaroo Point Dwelling house 552 544 544 543 534
Multiple dwelling 4,011 4,559 4,601 4,762 5,194
Total 4,563 5,103 5,145 5,305 5,728
Karana Downs-Lake Manchester
(part of SLA within the PIA)
Dwelling house 900 904 904 904 904
Multiple dwelling 34 34 34 34 34
Total 934 938 938 938 938
Kedron Dwelling house 3,655 3,684 3,691 3,691 3,691
Multiple dwelling 2,065 2,186 2,205 2,205 2,248
Total 5,720 5,870 5,896 5,896 5,939
Schedule 3 – Priority infrastructure plan mapping – Predicted existing and future private residential dwelling supply Effective 30 June 2014

Kelvin Grove Dwelling house 1,089 1,083 1,084 1,084 1,086
Multiple dwelling 1,536 2,161 2,205 2,319 2,322
Total 2,625 3,244 3,289 3,403 3,408
Kenmore
(part of SLA within the PIA)
Dwelling house 3,190 3,253 3,264 3,264 3,319
Multiple dwelling 66 124 124 124 143
Total 3,256 3,377 3,388 3,388 3,462
Kenmore Hills
(part of SLA within the PIA)
Dwelling house 548 565 565 565 565
Multiple dwelling 125 155 155 155 155
Total 673 720 720 720 720
Keperra
(part of SLA within the PIA)
Dwelling house 2,582 2,592 2,592 2,592 2,592
Multiple dwelling 74 424 424 424 424
Total 2,656 3,016 3,016 3,016 3,016
Kuraby
(part of SLA within the PIA)
Dwelling house 2,075 2,103 2,124 2,226 2,294
Multiple dwelling 392 395 396 396 466
Total 2,467 2,498 2,520 2,622 2,760
Lota Dwelling house 1,185 1,203 1,203 1,203 1,217
Multiple dwelling 30 30 30 30 35
Total 1,215 1,233 1,233 1,233 1,252
Schedule 3 – Priority infrastructure plan mapping – Predicted existing and future private residential dwelling supply Effective 30 June 2014

Lutwyche Dwelling house 574 568 568 567 567
Multiple dwelling 949 1,046 1,049 1,153 1,153
Total 1,523 1,614 1,617 1,720 1,720
MacGregor Dwelling house 1,786 1,790 1,797 1,797 1,796
Multiple dwelling 183 292 299 299 336
Total 1,969 2,082 2,096 2,096 2,132
Manly Dwelling house 1,238 1,247 1,247 1,247 1,247
Multiple dwelling 506 541 541 541 541
Total 1,744 1,788 1,788 1,788 1,788
Manly West Dwelling house 3,555 3,679 3,725 3,790 3,859
Multiple dwelling 536 612 615 638 645
Total 4,091 4,291 4,340 4,428 4,504
Mansfield Dwelling house 3,436 3,443 3,444 3,444 3,444
Multiple dwelling 189 189 189 189 189
Total 3,625 3,632 3,633 3,633 3,633
McDowall Dwelling house 2,377 2,462 2,489 2,511 2,511
Multiple dwelling 157 244 250 257 257
Total 2,534 2,706 2,739 2,768 2,768
Middle Park Dwelling house 1,379 1,382 1,382 1,382 1,382
Schedule 3 – Priority infrastructure plan mapping – Predicted existing and future private residential dwelling supply Effective 30 June 2014

Multiple dwelling 56 56 56 56 56
Total 1,435 1,438 1,438 1,438 1,438
Milton Dwelling house 452 444 446 446 446
Multiple dwelling 628 1,735 1,738 1,911 2,441
Total 1,080 2,179 2,184 2,357 2,887
Mitchelton
(part of SLA within the PIA)
Dwelling house 2,741 2,811 2,818 2,818 2,818
Multiple dwelling 457 479 2,580 2,580 2,803
Total 3,198 3,290 5,398 5,398 5,621
Moggill
(part of SLA within the PIA)
Dwelling house 1,019 1,275 1,275 1,275 1,291
Multiple dwelling 26 18 18 18 24
Total 1,045 1,293 1,293 1,293 1,315
Moorooka Dwelling house 3,002 2,986 2,996 2,996 2,996
Multiple dwelling 1,531 1,670 1,693 1,693 1,693
Total 4,533 4,656 4,689 4,689 4,689
Moreton Island
(SLA located completely outside the PIA)
Dwelling house - - - - -
Multiple dwelling - - - - -
Total - - - - -
Morningside Dwelling house 2,313 2,320 2,342 2,342 2,360
Multiple dwelling 2,329 2,775 2,794 2,794 2,942
Schedule 3 – Priority infrastructure plan mapping – Predicted existing and future private residential dwelling supply Effective 30 June 2014

Total 4,642 5,095 5,136 5,136 5,302
Mount Gravatt Dwelling house 983 978 978 978 978
Multiple dwelling 365 657 657 657 706
Total 1,348 1,635 1,635 1,635 1,684
Mount Gravatt East Dwelling house 3,425 3,417 3,442 3,469 3,469
Multiple dwelling 886 1,018 1,460 1,656 1,731
Total 4,311 4,435 4,902 5,125 5,200
Mount Ommaney Dwelling house 633 650 691 691 691
Multiple dwelling 35 35 35 102 102
Total 668 685 726 793 793
Murarrie Dwelling house 913 923 927 927 927
Multiple dwelling 18 18 18 18 73
Total 931 941 945 945 1,000
Nathan Dwelling house 316 316 316 316 316
Multiple dwelling 74 74 75 75 75
Total 390 390 391 391 391
New Farm Dwelling house 1,268 1,271 1,275 1,275 1,275
Multiple dwelling 5,193 5,436 5,445 5,445 5,492
Schedule 3 – Priority infrastructure plan mapping – Predicted existing and future private residential dwelling supply Effective 30 June 2014

Total 6,461 6,707 6,720 6,720 6,767
Newmarket Dwelling house 1,154 1,151 1,155 1,155 1,160
Multiple dwelling 831 878 878 878 878
Total 1,985 2,029 2,033 2,033 2,038
Newstead Dwelling house 324 325 325 325 325
Multiple dwelling 2,742 3,918 5,473 6,202 6,554
Total 3,066 4,243 5,798 6,527 6,879
Norman Park Dwelling house 2,424 2,447 2,462 2,462 2,470
Multiple dwelling 682 708 708 708 712
Total 3,106 3,155 3,170 3,170 3,182
Northgate Dwelling house 1,213 1,226 1,232 1,232 1,232
Multiple dwelling 714 766 782 782 782
Total 1,927 1,992 2,014 2,014 2,014
Nudgee Dwelling house 1,093 1,162 1,162 1,162 1,195
Multiple dwelling 4 98 98 98 110
Total 1,097 1,260 1,260 1,260 1,305
Nundah Dwelling house 1,706 1,694 1,699 1,699 1,713
Multiple dwelling 3,691 4,362 4,427 4,641 4,949
Total 5,397 6,056 6,126 6,340 6,662
Schedule 3 – Priority infrastructure plan mapping – Predicted existing and future private residential dwelling supply Effective 30 June 2014
Oxley Dwelling house 2,369 2,587 2,648 2,648 2,679
Multiple dwelling 279 341 358 358 369
Total 2,648 2,928 3,006 3,006 3,048
Paddington Dwelling house 2,438 2,444 2,444 2,449 2,449
Multiple dwelling 1,246 1,264 1,265 1,271 1,271
Total 3,684 3,708 3,709 3,720 3,720
Pallara-Heathwood-Larapinta
(part of SLA within the PIA)
Dwelling house 1,214 1,307 1,307 1,477 1,769
Multiple dwelling 9 9 9 124 324
Total 1,223 1,316 1,316 1,601 2,093
Parkinson-Drewvale
Dwelling house 4,287 4,768 4,768 4,897 4,897
Multiple dwelling 341 491 491 491 491
Total 4,628 5,259 5,259 5,388 5,388
Pinjarra Hills
(SLA located completely outside the PIA)
Dwelling house - - - - -
Multiple dwelling - - - - -
Total - - - - -
Pinkenba-Eagle Farm
Dwelling house 137 163 163 163 163
Multiple dwelling 6 9 3,355 5,579 5,716
Total 143 172 3,518 5,742 5,879
Schedule 3 – Priority infrastructure plan mapping – Predicted existing and future private residential dwelling supply Effective 30 June 2014

Pullenvale
(SLA located completely outside the PIA)
Dwelling house - - - - -
Multiple dwelling - - - - -
Total - - - - -
Red Hill Dwelling house 1,686 1,692 1,697 1,697 1,708
Multiple dwelling 819 888 898 898 898
Total 2,505 2,580 2,595 2,595 2,606
Richlands Dwelling house 376 412 442 429 421
Multiple dwelling 195 964 1,934 6,966 7,739
Total 571 1,376 2,376 7,395 8,160
Riverhills Dwelling house 1,320 1,347 1,385 1,385 1,385
Multiple dwelling 185 185 185 185 185
Total 1,505 1,532 1,570 1,570 1,570
Robertson Dwelling house 1,286 1,312 1,330 1,330 1,330
Multiple dwelling 383 383 383 383 383
Total 1,669 1,695 1,713 1,713 1,713
Rochedale
(part of SLA within the PIA)
Dwelling house 209 776 776 1,443 2,510
Multiple dwelling 15 501 501 1,268 1,936
Total 224 1,277 1,277 2,711 4,446
Schedule 3 – Priority infrastructure plan mapping – Predicted existing and future private residential dwelling supply Effective 30 June 2014

Rocklea Dwelling house 619 622 632 632 632
Multiple dwelling 42 42 56 56 56
Total 661 664 688 688 688
Runcorn Dwelling house 3,550 3,582 3,936 4,011 4,057
Multiple dwelling 1,220 1,410 1,426 1,434 1,434
Total 4,770 4,992 5,362 5,445 5,491
Salisbury Dwelling house 2,200 2,229 2,241 2,241 2,241
Multiple dwelling 292 361 363 363 363
Total 2,492 2,590 2,604 2,604 2,604
Sandgate Dwelling house 2,046 2,070 2,070 2,070 2,070
Multiple dwelling 688 703 703 703 703
Total 2,734 2,773 2,773 2,773 2,773
Seventeen Mile Rocks
Dwelling house 2,898 2,920 2,966 2,992 3,033
Multiple dwelling 337 589 592 601 601
Total 3,235 3,509 3,558 3,593 3,634
Sherwood Dwelling house 1,537 1,545 1,548 1,548 1,548
Multiple dwelling 774 892 894 894 894
Total 2,311 2,437 2,442 2,442 2,442
Schedule 3 – Priority infrastructure plan mapping – Predicted existing and future private residential dwelling supply Effective 30 June 2014

South Brisbane Dwelling house 304 302 302 302 302
Multiple dwelling 2,675 3,772 7,913 8,994 9,836
Total 2,979 4,074 8,215 9,296 10,138
Spring Hill Dwelling house 433 434 434 434 434
Multiple dwelling 2,926 3,011 3,011 3,094 3,094
Total 3,359 3,445 3,445 3,528 3,528
St Lucia Dwelling house 1,458 1,462 1,466 1,468 1,465
Multiple dwelling 3,708 3,937 3,943 3,997 4,070
Total 5,166 5,399 5,409 5,465 5,535
Stafford Dwelling house 2,160 2,157 2,163 2,163 2,163
Multiple dwelling 564 889 892 892 892
Total 2,724 3,046 3,055 3,055 3,055
Stafford Heights Dwelling house 2,618 2,631 2,635 2,635 2,635
Multiple dwelling 126 126 126 126 126
Total 2,744 2,757 2,761 2,761 2,761
Stretton-Karawatha
(part of SLA within the PIA)
Dwelling house 1,313 1,418 1,517 1,517 1,517
Multiple dwelling 0 2 9 9 9
Total 1,313 1,420 1,526 1,526 1,526
Sunnybank Dwelling house 2,749 2,782 2,826 2,826 2,854
Schedule 3 – Priority infrastructure plan mapping – Predicted existing and future private residential dwelling supply Effective 30 June 2014

Multiple dwelling 303 307 308 308 318
Total 3,052 3,089 3,134 3,134 3,172
Sunnybank Hills Dwelling house 5,242 5,278 5,373 5,403 5,427
Multiple dwelling 771 779 818 896 962
Total 6,013 6,057 6,191 6,299 6,389
Taigum-Fitzgibbon Dwelling house 2,212 2,285 2,527 2,601 2,780
Multiple dwelling 1,632 2,141 3,548 3,763 4,203
Total 3,844 4,426 6,075 6,364 6,983
Taringa Dwelling house 1,235 1,238 1,243 1,243 1,243
Multiple dwelling 2,761 2,951 2,963 2,963 2,963
Total 3,996 4,189 4,206 4,206 4,206
Tarragindi Dwelling house 3,727 3,759 3,768 3,768 3,768
Multiple dwelling 121 121 121 121 121
Total 3,848 3,880 3,889 3,889 3,889
The Gap
(part of SLA within the PIA)
Dwelling house 5,490 5,572 5,573 5,604 5,631
Multiple dwelling 179 192 192 192 201
Total 5,669 5,764 5,765 5,796 5,832
Tingalpa Dwelling house 3,053 3,074 3,119 3,119 3,135
Schedule 3 – Priority infrastructure plan mapping – Predicted existing and future private residential dwelling supply Effective 30 June 2014

Multiple dwelling 492 523 540 540 545
Total 3,545 3,597 3,659 3,659 3,680
Toowong Dwelling house 2,793 2,797 2,801 2,804 2,806
Multiple dwelling 5,034 5,103 5,619 5,903 6,536
Total 7,827 7,900 8,420 8,707 9,342
Upper Kedron
(part of SLA within the PIA)
Dwelling house 977 1,326 1,749 1,749 1,786
Multiple dwelling 0 4 26 26 37
Total 977 1,330 1,775 1,775 1,823
Upper Mount Gravatt
Dwelling house 2,733 2,759 2,760 2,759 2,767
Multiple dwelling 977 1,135 2,596 3,405 4,241
Total 3,710 3,894 5,356 6,164 7,008
Virginia Dwelling house 807 819 819 819 819
Multiple dwelling 23 23 23 23 23
Total 830 842 842 842 842
Wacol
(part of SLA within the PIA)
Dwelling house 882 900 932 958 958
Multiple dwelling 72 72 72 81 81
Total 954 972 1,004 1,039 1,039
Wakerley
(part of SLA within
Dwelling house 2,248 2,430 2,589 2,589 2,589
Multiple dwelling 317 321 321 321 321
Schedule 3 – Priority infrastructure plan mapping – Predicted existing and future private residential dwelling supply Effective 30 June 2014

the PIA) Total 2,565 2,751 2,910 2,910 2,910
Wavell Heights Dwelling house 3,596 3,621 3,627 3,627 3,627
Multiple dwelling 293 313 313 313 313
Total 3,889 3,934 3,940 3,940 3,940
West End Dwelling house 1,377 1,370 1,372 1,372 1,372
Multiple dwelling 2,417 3,925 7,875 8,879 9,534
Total 3,794 5,295 9,247 10,251 10,906
Westlake Dwelling house 1,531 1,551 1,551 1,551 1,551
Multiple dwelling 22 22 22 22 22
Total 1,553 1,573 1,573 1,573 1,573
Willawong
(part of SLA within the PIA)
Dwelling house 15 118 118 195 225
Multiple dwelling 0 25 25 44 51
Total 15 143 143 239 276
Wilston Dwelling house 1,115 1,125 1,128 1,128 1,130
Multiple dwelling 492 510 510 510 513
Total 1,607 1,635 1,638 1,638 1,643
Windsor Dwelling house 1,788 1,788 1,795 1,795 1,795
Multiple dwelling 1,162 1,358 1,369 1,369 1,369
Total 2,950 3,146 3,164 3,164 3,164
Schedule 3 – Priority infrastructure plan mapping – Predicted existing and future private residential dwelling supply Effective 30 June 2014

Wishart Dwelling house 3,104 3,107 3,117 3,117 3,149
Multiple dwelling 714 714 714 714 725
Total 3,818 3,821 3,831 3,831 3,874
Woolloongabba Dwelling house 1,175 1,182 1,182 1,182 1,182
Multiple dwelling 1,084 1,433 5,076 5,990 6,187
Total 2,259 2,615 6,258 7,172 7,369
Wooloowin Dwelling house 1,571 1,572 1,588 1,588 1,593
Multiple dwelling 1,004 1,032 1,032 1,032 1,032
Total 2,575 2,604 2,620 2,620 2,625
Wynnum Dwelling house 4,192 4,270 4,270 4,270 4,275
Multiple dwelling 1,161 1,288 1,586 1,666 1,818
Total 5,353 5,558 5,856 5,936 6,093
Wynnum West Dwelling house 3,668 3,725 3,816 3,815 3,828
Multiple dwelling 777 1,012 1,016 1,163 1,167
Total 4,445 4,737 4,832 4,978 4,995
Yeerongpilly Dwelling house 664 674 677 677 677
Multiple dwelling 678 679 679 679 679
Total 1,342 1,353 1,356 1,356 1,356
Yeronga Dwelling house 1,410 1,418 1,422 1,422 1,439
Schedule 3 – Priority infrastructure plan mapping – Predicted existing and future private residential dwelling supply Effective 30 June 2014

Multiple dwelling 1,191 1,351 1,355 1,355 1,454
Total 2,601 2,769 2,777 2,777 2,893
Zillmere Dwelling house 2,422 2,402 2,408 2,408 2,408
Multiple dwelling 1,302 1,608 1,624 1,624 1,624
Total 3,724 4,010 4,032 4,032 4,032
Remainder
(part of SLA within the PIA)
Dwelling house 1 1 1 1 1
Multiple dwelling 171 171 171 171 171
Total 172 172 172 172 172
Total private residential dwelling supply within PIA
Dwelling house 292,880 298,985 302,439 304,703 308,633
Multiple dwelling 127,481 158,357 192,299 212,603 225,840
Total 420,361 457,342 494,738 517,306 534,473
Predicted existing and future residential dwelling supply for those SLAs partially or completely outside the priority infrastructure area
Anstead Dwelling house 367 371 371 371 371
Multiple dwelling 0 0 0 0 0
Total 367 371 371 371 371
Bald Hills
(part of SLA outside of the PIA) (4)
Dwelling house 27 27 27 27 27
Multiple dwelling 0 0 0 0 0
Total 27 27 27 27 27
Schedule 3 – Priority infrastructure plan mapping – Predicted existing and future private residential dwelling supply Effective 30 June 2014
Bardon
(part of SLA outside of the PIA)
Dwelling house 2 2 2 2 2
Multiple dwelling 0 0 0 0 0
Total 2 2 2 2 2
Bellbowrie
(part of SLA outside of the PIA)
Dwelling house 216 218 218 218 218
Multiple dwelling 0 0 0 0 0
Total 216 218 218 218 218
Belmont-Mackenzie
(part of SLA outside of the PIA)
Dwelling house 291 292 292 292 292
Multiple dwelling 0 0 0 0 0
Total 291 292 292 292 292
Bracken Ridge
(part of SLA outside of the PIA)
Dwelling house 4 4 4 4 4
Multiple dwelling 0 0 0 0 0
Total 4 4 4 4 4
Bridgeman Downs
(part of SLA outside of the PIA)
Dwelling house 234 237 237 237 237
Multiple dwelling 0 0 0 0 0
Total 234 237 237 237 237
Brighton
(part of SLA outside of the PIA)
Dwelling house 13 58 58 58 58
Multiple dwelling 0 0 0 0 0
Total 13 58 58 58 58
Brookfield (incl. Dwelling house 888 896 896 896 896
Schedule 3 – Priority infrastructure plan mapping – Predicted existing and future private residential dwelling supply Effective 30 June 2014

Brisbane Forest Park) Multiple dwelling 54 54 54 54 54
Total 942 950 950 950 950
Burbank Dwelling house 375 375 375 375 375
Multiple dwelling 1 1 1 1 1
Total 376 376 376 376 376
Chandler-Capalaba West
Dwelling house 474 476 476 476 476
Multiple dwelling 0 0 0 0 0
Total 474 476 476 476 476
Chapel Hill
(part of SLA outside of the PIA)
Dwelling house 3 3 3 3 3
Multiple dwelling 0 0 0 0 0
Total 3 3 3 3 3
Doolandella-Forest Lake
(part of SLA outside of the PIA)
Dwelling house 5 47 50 50 50
Multiple dwelling 0 0 0 0 0
Total 5 47 50 50 50
Durack
(part of SLA outside of the PIA)
Dwelling house 5 5 5 5 5
Multiple dwelling 0 0 0 0 0
Total 5 5 5 5 5
Gumdale-Ransome Dwelling house 475 475 475 475 475
Schedule 3 – Priority infrastructure plan mapping – Predicted existing and future private residential dwelling supply Effective 30 June 2014

(part of SLA outside of the PIA) Multiple dwelling 11 11 11 11 11
Total 486 486 486 486 486
Karana Downs-Lake Manchester
(part of SLA outside of the PIA)
Dwelling house 1,198 1,215 1,215 1,215 1,215
Multiple dwelling 4 4 4 4 4
Total 1,202 1,219 1,219 1,219 1,219
Kenmore
(part of SLA outside of the PIA)
Dwelling house 4 4 4 4 4
Multiple dwelling 0 0 0 0 0
Total 4 4 4 4 4
Kenmore Hills
(part of SLA outside of the PIA)
Dwelling house 229 231 231 231 231
Multiple dwelling 0 0 0 0 0
Total 229 231 231 231 231
Keperra
(part of SLA outside of the PIA)
Dwelling house 7 295 295 295 295
Multiple dwelling 0 152 152 152 152
Total 7 447 447 447 447
Kuraby
(part of SLA outside of the PIA)
Dwelling house 3 216 216 216 216
Multiple dwelling 0 0 0 0 0
Total 3 216 216 216 216
Mitchelton Dwelling house 0 1 1 1 1
Schedule 3 – Priority infrastructure plan mapping – Predicted existing and future private residential dwelling supply Effective 30 June 2014

(part of SLA outside of the PIA) Multiple dwelling 0 0 0 0 0
Total 0 1 1 1 1
Moggill
(part of SLA outside of the PIA)
Dwelling house 174 177 177 177 177
Multiple dwelling 2 2 2 2 2
Total 176 179 179 179 179
Moreton Island Dwelling house 236 237 237 237 237
Multiple dwelling 39 39 39 39 39
Total 275 276 276 276 276
Pallara-Heathwood-Larapinta
(part of SLA outside of the PIA)
Dwelling house 1 1 1 1 1
Multiple dwelling 0 0 0 0 0
Total 1 1 1 1 1
Pinjarra Hills Dwelling house 134 135 135 135 135
Multiple dwelling 0 0 0 0 0
Total 134 135 135 135 135
Pullenvale Dwelling house 1,033 1,046 1,046 1,046 1,046
Multiple dwelling 79 79 79 79 79
Total 1,112 1,125 1,125 1,125 1,125
Schedule 3 – Priority infrastructure plan mapping – Predicted existing and future private residential dwelling supply Effective 30 June 2014

Rochedale
(part of SLA outside of the PIA)
Dwelling house 104 104 104 104 104
Multiple dwelling 5 5 5 5 5
Total 109 109 109 109 109
Stretton-Karawatha
(part of SLA outside of the PIA)
Dwelling house 16 16 16 16 16
Multiple dwelling 0 0 0 0 0
Total 16 16 16 16 16
The Gap
(part of SLA outside of the PIA)
Dwelling house 130 136 136 136 136
Multiple dwelling 3 3 3 3 3
Total 133 139 139 139 139
Upper Kedron
(part of SLA outside of the PIA)
Dwelling house 44 44 44 44 44
Multiple dwelling 0 0 0 0 0
Total 44 44 44 44 44
Wacol
(part of SLA outside of the PIA)
Dwelling house 0 0 0 0 0
Multiple dwelling 0 0 0 0 0
Total 0 0 0 0 0
Wakerley Dwelling house 8 8 8 8 8
Multiple dwelling 32 32 32 32 32
Total 40 40 40 40 40
Willawong Dwelling house 63 378 378 378 378
Schedule 3 – Priority infrastructure plan mapping – Predicted existing and future private residential dwelling supply Effective 30 June 2014

(part of SLA outside of the PIA) Multiple dwelling 0 0 0 0 0
Total 63 378 378 378 378
Remainder
(part of SLA outside of the PIA)
Dwelling house 0 0 0 0 0
Multiple dwelling 0 0 0 0 0
Total 0 0 0 0 0
Total private residential dwelling supply outside PIA
Dwelling house 6,763 7,730 7,733 7,733 7,733
Multiple dwelling 230 382 382 382 382
Total 6,993 8,112 8,115 8,115 8,115
Total private residential dwelling supply Brisbane LGA
Dwelling house 299,643 306,715 310,172 312,436 316,366
Multiple dwelling 127,711 158,739 192,681 212,985 226,222
Total 427,354 465,454 502,853 525,421 542,588
Editor’s note—
(1) A dwelling house category includes separate houses only.
(2) A multiple dwelling category includes a dual occupancy, a dwelling unit and multiple dwellings. Multiple dwellings do not include non-private residential dwellings (residential welfare institutions such as nursing homes and student accommodation).
(3) If a statistical local area is denoted with ‘part of SLA within the PIA’, this means that only part of the statistical local area’s land surface area is located in the priority infrastructure area.
(4) If a statistical local area is denoted with ‘part of SLA outside of the PIA’, this means that only part of the statistical local area’s land surface area is located outside of the priority infrastructure area.
Schedule 3 – Priority infrastructure plan mapping – Predicted existing and future private residential dwelling supply Effective 30 June 2014