schaak jmatch cop spikes 011415 si rev
TRANSCRIPT

S1
ELECTRONIC SUPPLEMENTARY INFORMATION Highly Branched Cobalt Phosphide Nanostructures for
Hydrogen Evolution Electrocatalysis
Eric J. Popczun,† Christopher W. Roske,‡ Carlos G. Read,† J. Chance Crompton,‡ Joshua M. McEnaney,† Nathan S. Lewis,‡,* Raymond E. Schaak†,*
† Department of Chemistry and Materials Research Institute, The Pennsylvania State
University, University Park, PA 16802. ‡ Division of Chemistry and Chemical Engineering, California Institute of Technology, Pasadena, CA 91125.
E-‐mail: [email protected], [email protected]
Additional Experimental Details Quantitative Hydrogen Yield Measurements: Quantitative H2 yield measurements were performed in 0.50 M H2SO4 in a two-‐electrode experiment using a two-‐compartment cell. The two compartments, for the working and counter electrode, respectively, were separated by a Nafion® membrane (Fuelcellstore.com). A graduated cylinder was inverted above the working electrode to collect the H2(g) produced during the experiment. A constant (cathodic) current of -‐10 mA was maintained for 50 min (3000 s) on a ~0.2 cm2 electrode. The amount of H2(g) produced was 3.92 mL, as compared to the theoretical yield of 3.92mL, as calculated with Faraday’s law, Dalton’s law of partial pressures and the ideal gas law. In a control experiment, a platinum electrode produced an identical quantity of H2(g) when the same amount of charge was passed through the cathode. Estimation of turnover frequencies: The turnover frequency was calculated using an established method.1-‐3 First, the density of the sample was calculated using the CoP unit cell. Using the measured BET surface areas, the turnover frequencies are reported as turnovers per second per surface atom, analogous to prior reports for Ni-‐Mo,1 Ni2P,2 and CoP hollow nanoparticles.3 The Co and P surface atoms were counted separately. Calculation of TOF values Molar mass: 89.907 g/mol Density: 6.416 g/cm3 Molar Volume: 14.01 mL/mol BET Surface Area: 66.5 m2/g Current Density at 100 mV overpotential (1 mg cm-‐2 loading): –1.03 × 10-‐2 A/cm2
Electronic Supplementary Material (ESI) for Journal of Materials Chemistry A.This journal is © The Royal Society of Chemistry 2015

S2
Average surface atoms per 1 square centimeter:
2 ×6.022× 10!"𝑎𝑡𝑜𝑚𝑠1 𝑚𝑜𝑙 ×
1 𝑚𝑜𝑙14.0 𝑐𝑚!
!!= 2.45 ×10!"
𝑎𝑡𝑜𝑚𝑠𝑐𝑚!
Surface Atoms per tested area at 1 mg/cm2:
1 𝑚𝑔1 𝑐𝑚! (𝑓𝑜𝑖𝑙)×
6.65 ×10!𝑐𝑚! (𝑝𝑎𝑟𝑡𝑖𝑐𝑙𝑒)𝑚𝑔 ×
2.45 ×10!" 𝑎𝑡𝑜𝑚𝑠1𝑐𝑚! (𝑝𝑎𝑟𝑡𝑖𝑐𝑙𝑒) = 1.63 ×10!"
𝑎𝑡𝑜𝑚𝑠𝑡𝑒𝑠𝑡 ∙ 𝑐𝑚!
Turnover frequency at -‐100 mV overpotential (per surface atom):
1 𝑡𝑢𝑟𝑛𝑜𝑣𝑒𝑟 2 𝑒! ×
1.03 × 10!!𝐴1 𝑐𝑚! ×
1 𝑚𝑜𝑙96485 𝐶×
6.022 × 10!"𝑒!
1 𝑚𝑜𝑙 ×1 𝑡𝑒𝑠𝑡 ∙ 𝑐𝑚!
1.65×10!" 𝑎𝑡𝑜𝑚𝑠
= 𝟎.𝟎𝟏𝟗 𝒔!𝟏𝒂𝒕𝒐𝒎!𝟏
Supplementary Figures
Figure S1. Representative EDS spectrum of a sample of highly-‐branched CoP nanostructures. The Co/P ratio was 1/1. The Cu and Si impurities are due to the TEM grid and column, respectively, and were present in control samples of blank TEM grids.

S3
Figure S2. (Left) Powder X-‐ray diffraction data for a sample of highly branched CoP nanostructures deposited onto Ti foil then annealed at 450 °C under H2 (5%)/Ar(95%) for 30 min. Simulated XRD patterns for Ti and CoP are shown for comparison. The asterisks indicate a small Co2P impurity that was observed after annealing. (Right) SEM images of the same sample prior to and after annealing. We did not observe any crystallographic relationships between the interior cores and the branches. It is also difficult to capture the relevant early stages of the reactions that produce the branched CoP nanostructures because of the high temperatures involved.
Figure S3. Three distinct linear sweep voltammograms for hollow, pseudospherical CoP nanoparticles deposited on Ti foil at a loading density of ~0.8 mg cm-‐2 in 0.5 M H2SO4. The electrodes consistently required an overpotential of -‐100 mV to produce a current density of -‐10 mA cm-‐2. This value is lower than the overpotential of -‐117 mV required for the branched CoP nanostructures.
S4
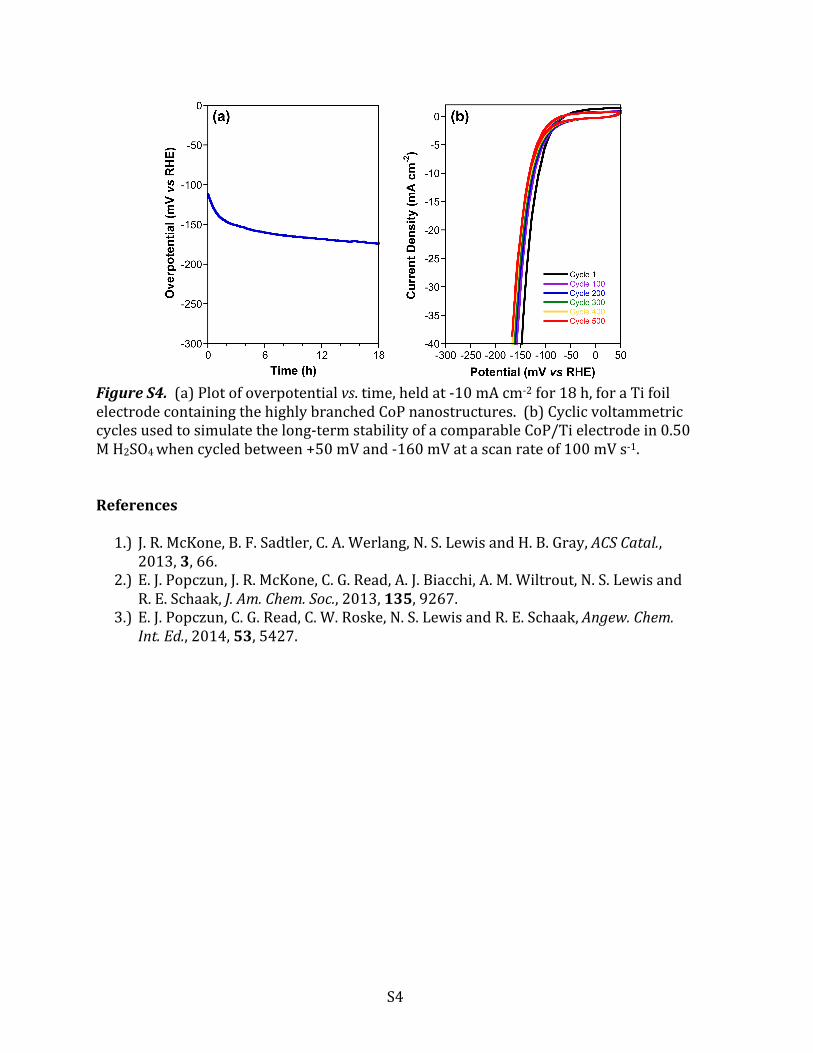
Figure S4. (a) Plot of overpotential vs. time, held at -‐10 mA cm-‐2 for 18 h, for a Ti foil electrode containing the highly branched CoP nanostructures. (b) Cyclic voltammetric cycles used to simulate the long-‐term stability of a comparable CoP/Ti electrode in 0.50 M H2SO4 when cycled between +50 mV and -‐160 mV at a scan rate of 100 mV s-‐1. References 1.) J. R. McKone, B. F. Sadtler, C. A. Werlang, N. S. Lewis and H. B. Gray, ACS Catal.,
2013, 3, 66. 2.) E. J. Popczun, J. R. McKone, C. G. Read, A. J. Biacchi, A. M. Wiltrout, N. S. Lewis and
R. E. Schaak, J. Am. Chem. Soc., 2013, 135, 9267. 3.) E. J. Popczun, C. G. Read, C. W. Roske, N. S. Lewis and R. E. Schaak, Angew. Chem.
Int. Ed., 2014, 53, 5427.