scenarios of changes in the spatial pattern of land use in china
TRANSCRIPT
Procedia Environmental Sciences 13 (2012) 590 – 597
1878-0296 © 2011 Published by Elsevier B.V. Selection and/or peer-review under responsibility of School of Environment, Beijing Normal University.doi:10.1016/j.proenv.2012.01.050
Available online at www.sciencedirect.com
Procedia Environmental
Sciences Procedia Environmental Sciences 8(2011) 591–598
www.elsevier.com/locate/procedia
* Corresponding author. Tel.: +0086-10-64889041; fax: +0086-1064889630. E-mail address: [email protected].
The 18th Biennial Conference of International Society for Ecological Modelling
Scenarios of changes in the spatial pattern of land use in China
XiaoFang Suna,b, TianXiang Yuea,*, ZeMeng Fana a Institute of Geographic Sciences and Natural Resources Research, Chinese Academy of Sciences, 11A, Datun Road, Anwai,
100101 Beijing, China bGraduateUniversity of ChineseAcademy of Sciences, Beijing 100049, China
Abstract
Land use changes affect many aspects of Earth System functioning, for example in impacting global carbon cycle, contributing to climate change, or increasing soil erosion. The simulation of land use change is important in environmental impact assessment and land use planning. We assessed the land use scenarios of China in the next 100 years based on the SMLC (surface modelling of land cover change) model and Dyna-CLUE (dynamic conversion of land use and its effects) model. Three SRES scenarios were evaluated: Global Economy (A1FI): lean government, strong globalization; Continental Markets (A2a): lean government, regional culture and economic development; Regional communities (B2a): much government intervention, regional cultural and economic development. Ten land cover types were simulated, which are cultivated land, woodland, grassland, built-up land, water area, wetland, nival area, desert, bare rock and desertification land. The SMLC model was used to calculate changes in area for each land use types in the future at country level while the spatially explicit land use model Dyna-CLUE was used to simulate land use pattern at 2 km2 resolution based on the country level areas demands for each land cover type. The results show that the cultivated land would decrease in all of the three scenarios, while in the A2a scenario, the cultivated land would decrease with the lowest rate because of the high population growth, high level of market protection and low agricultural efficiency; in the B2a scenario, it would decrease with the highest rate caused by the decreased population numbers and increased crop productivity. The nival area would decrease with the highest rate in the A1FI scenario since the rapid introduce of new technology and the energy system is fossil intensive, which would discharge more greenhouse gas than other two scenarios. The area of natural ecosystems such as wood land, grassland, water area and wet land would increase significantly in the B2a scenario because this scenario puts more weight on environmental sustainability. The land use spatial pattern in China under the B2a scenario is simulated. The results are important to identify hotspots of land use change that need specific attention by the governments and the researchers. © 2011 Published by Elsevier Ltd. © 2011 Published by Elsevier B.V. Selection and/or peer-review under responsibility of School of Environment, Beijing Normal University.
591XiaoFang Sun et al. / Procedia Environmental Sciences 13 (2012) 590 – 597592 Xiaofang Sun et al./ Procedia Environmental Sciences 8 (2011) 591–598
Keywords: land use change; scenarios; surface modeling; China; land use model
Introduction
Land cover change has important effects on climate change, biodiversity, biogeochemical cycling and socioeconomic situation [1-6]. Accurate land use change information is needed for land use policy making and scientific research. Therefore, scientists and policy makers realized the need to assess the land use change dynamics and related impacts. Scenarios provide a methodology for ordering perceptions about alternative future environments in which today’s decisions might be played out [7]. The foresight of land use change can provide useful advice for policy decisions.
Recently a large number of studies on future land use change have been conducted at regional or
national scale [8-13]. Verburg et al. [14] simulated future land use change for European union used global economic and integrated assessment models and a spatially explicit land use change model based on scenarios differ in worldview, ranging from enhanced global cooperation towards strong regionalization on one hand and strong to weak government intervention on the other. Results show that the impact of abandonment of agriculture land and urbanization on European landscape is large.Schulp et al. [15] assessed how future land use change can influence future carbon sequestration in the EU under four SRES scenarios used a high-resolution land use change model and a carbon bookkeeping approach. Their results show that clear differences are found in the spatial distributions of sinks and sources between the scenarios, illustrating that land use is an important factor in future carbon sequestration changes that cannot be ignored. Tappeiner et al. [16] analysed the effects of future scenarios of land use on the carbon stocks present in the vegetation.Verburg et al. [17] simulated the spatial pattern of land use conversions in China caused by urbanization, desertification and afforestation for a scenario based upon a trend analysis of present land use dynamics.
592 XiaoFang Sun et al. / Procedia Environmental Sciences 13 (2012) 590 – 597 Xiaofang Sun et al./ Procedia Environmental Sciences 8 (2011) 591–598 593
As mentioned above, a number of scenarios were developed and used in the study of future land use change. The most well-known examples include the Intergovernmental Panel on Climate Change (IPCC) Special Report on Emission Scenarios (SRES). The SRES is based on possible developments during the 21st century, which are arranged around the level of globalization and different values [18-19]. In this study, we assessed the land use change in Chinaunder three HadCM3 climatic scenarios in the next one hundred year.
1. Data and methods
1.1. HadCM3 climatic scenarios
The HadCM3 climatic scenarios used in this study were developed by A1FI, A2 and B2 experiments [20]. In the A1 scenario, increased productivity, increased production and rapid economic growth is expected. Global population peaks in mid-century and declines thereafter. New and more efficient technologies are introduced rapidly. The A1FI group in the A1 scenario describes that technological change in the energy system is fossil intensive [12]. In the A2 scenario, the world is very heterogeneous with high level of market protection; the population growth is more rapid than A1 but the economic growth is slower than A1. The B2 storyline describes a future world in which population number decrease and crop productivity increase. B2 assumes a relatively high level of regulation, including specific spatial and agricultural policies.
1.2. Surface modeling of land use scenario
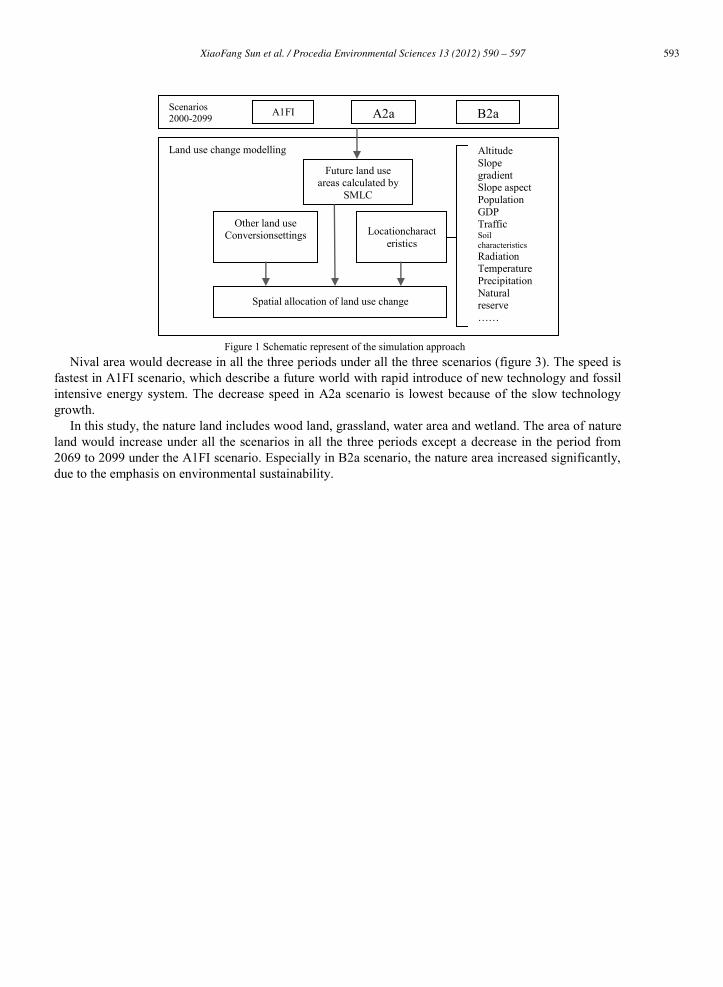
We assessed the spatial pattern of land use change in China between 2005 and 2099 for three scenarios. An overview of the methodology is shown in figure 1. Ten land cover types were estimated, which are cultivated land, woodland, grassland, built-up land, water area, wetland, nival area, desert, bare rock and desertification land. The land use classification was conducted by a combination of remote sensing data and geographic data sets [21]. The Changes in the required areas for the ten land use types at the national level are simulated using the SMLC model, the detailed description of the SMLC model is given in another paper [12]. The changes in national level land use claims are spatially allocated using the Dyna-CLUE model [22]. Dyna-CLUE model is a spatially explicit model which downscale the national scale land use requirements for different land use types to individual grid cells. The model has been widely used and validated in different studies [23-26]. The spatial allocation is based on the rules specified based on empirical analysis, user-specific decision rules and neighbourhood characteristics. The methodology of land use change allocation through is illustrated in more detail in [14, 22, 27].
2. Results
2.1. Area changes of land cover types
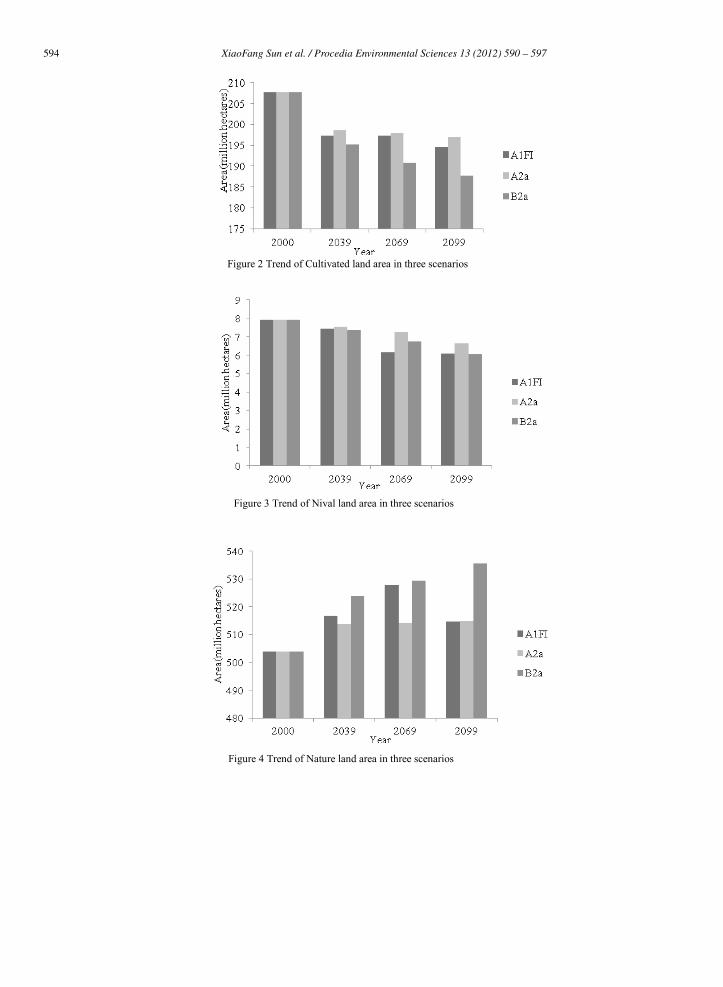
The area of cultivated land would decrease in all the periods from 2000 to 2039, from 2039 to 2069, and from 2069 to 2099 under all the three scenarios (figure 1). Under B2a Scenario, the cultivated land would decrease with the highest speed because of the population numbers decreased and the crop productivity increased. In the A1FI scenario, in combination with increased global trade of agricultural commodities the agricultural area also decreased significantly. The A2a scenario describes a future world of high population growth, high economic growth, high level of market protection and low agriculture efficiency, so the demand for cultivated land is high, which lead to the lowest speed of decrease.
593XiaoFang Sun et al. / Procedia Environmental Sciences 13 (2012) 590 – 597594 Xiaofang Sun et al./ Procedia Environmental Sciences 8 (2011) 591–598
Figure 1 Schematic represent of the simulation approach
Nival area would decrease in all the three periods under all the three scenarios (figure 3). The speed is fastest in A1FI scenario, which describe a future world with rapid introduce of new technology and fossil intensive energy system. The decrease speed in A2a scenario is lowest because of the slow technology growth.
In this study, the nature land includes wood land, grassland, water area and wetland. The area of nature land would increase under all the scenarios in all the three periods except a decrease in the period from 2069 to 2099 under the A1FI scenario. Especially in B2a scenario, the nature area increased significantly, due to the emphasis on environmental sustainability.
Scenarios 2000-2099 A1FI A2a B2a
Land use change modelling
Future land use areas calculated by
SMLC
Other land use Conversionsettings
Locationcharacteristics
Altitude Slope gradient Slope aspect Population GDP Traffic Soil characteristics Radiation Temperature Precipitation Natural reserve ……
Spatial allocation of land use change
594 XiaoFang Sun et al. / Procedia Environmental Sciences 13 (2012) 590 – 597 Xiaofang Sun et al./ Procedia Environmental Sciences 8 (2011) 593–600 595
Figure 2 Trend of Cultivated land area in three scenarios
Figure 3 Trend of Nival land area in three scenarios
Figure 4 Trend of Nature land area in three scenarios
595XiaoFang Sun et al. / Procedia Environmental Sciences 13 (2012) 590 – 597596 Xiaofang Sun et al./ Procedia Environmental Sciences 8 (2011) 593–600
2.2. Spatial distribution of land use types
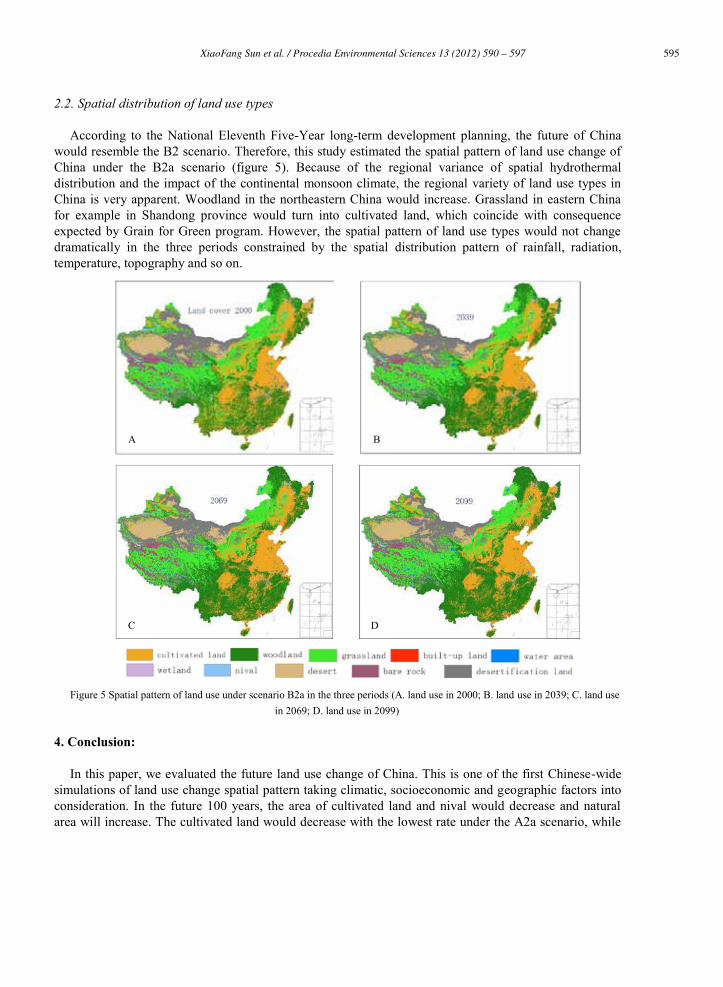
According to the National Eleventh Five-Year long-term development planning, the future of China would resemble the B2 scenario. Therefore, this study estimated the spatial pattern of land use change of China under the B2a scenario (figure 5). Because of the regional variance of spatial hydrothermal distribution and the impact of the continental monsoon climate, the regional variety of land use types in China is very apparent. Woodland in the northeastern China would increase. Grassland in eastern China for example in Shandong province would turn into cultivated land, which coincide with consequence expected by Grain for Green program. However, the spatial pattern of land use types would not change dramatically in the three periods constrained by the spatial distribution pattern of rainfall, radiation, temperature, topography and so on.
Figure 5 Spatial pattern of land use under scenario B2a in the three periods (A. land use in 2000; B. land use in 2039; C. land use
in 2069; D. land use in 2099)
4. Conclusion:
In this paper, we evaluated the future land use change of China. This is one of the first Chinese-wide simulations of land use change spatial pattern taking climatic, socioeconomic and geographic factors into consideration. In the future 100 years, the area of cultivated land and nival would decrease and natural area will increase. The cultivated land would decrease with the lowest rate under the A2a scenario, while
A B
C D
596 XiaoFang Sun et al. / Procedia Environmental Sciences 13 (2012) 590 – 597 Xiaofang Sun et al./ Procedia Environmental Sciences 8 (2011) 591–598 597
in the B2a scenario it would decrease with the highest rate. The nival area will decrease with the highest rate in A1FI. The nature ecosystem would increase significantly in the B2a scenario. Spatial pattern of land use change is simulated for the B2a scenario, which is most similar to the future of China. The results are important to identify hotspots of land use change that need specific attention by the governments and the researchers. The results of the simulation can also be used as a tool for estimating related effects of land use change. As an example, the results can be used to assess the effect of land use change on biomass, diversity, carbon sequestration and other ecosystem services.
Acknowledgements
The authors are thankful to Peter H. Verburgfor providing the Dyna-CLUE model and the assistance in running the model. This work is supported by China National Science Fund for Distinguished Young Scholars (40825003), by Major National Natural Science Fund of China (41023010), and by National Basic Research Priorities Program (2010CB950904) of Ministry of Science and Technology of the People’s Republic of China.
References
[1] Falcucci A, Maiorano L, Boitani L. Changes in land-use/land-cover patterns in Italy and their implications for biodiversity conservation. Landscape Ecol 2007; 22(4): 617-31.
[2] Feddema JJ, Oleson KW, Bonan GB, Mearns LO, Buja LE, Meehl GA, Washington WM. The importance of land-cover change in simulating future climates. Science 2005; 310(5754): 1674-78.
[3] Nagasaka A, Nakamura F. The influences of land-use changes on hydrology and riparian environment in a northern Japanese landscape. Landscape Ecol 1999; 14(6): 543-56.
[4] Shi J, Cui LL. Soil carbon change and its affecting factors following afforestation in China. Landscape Urban Plan 2010; 98(2): 75-85.
[5] Verburg PH, Neumann K, Nol L. Challenges in using land use and land cover data for global change studies. Global Change Biol 2011; 17(2): 974-89.
[6] Houghton RA. Revised estimates of the annual net flux of carbon to the atmosphere from changes in land use and land management 1850-2000. Tellus B 2003; 55(2): 378-90.
[7] Verburg PH, Veldkamp A, Rounsevell MDA. Scenario-based studies of future land use in Europe. Agr Ecosyst Environ 2006; 114(1): 1-6.
[8] de Nijs TCM, de Niet R, Crommentuijn L. Constructing land-use maps of the Netherlands in 2030. J Environ Manage 2004; 72(1-2): 35-42.
[9] Rounsevell MDA, Ewert F, Reginster I, Leemans R, Carter TR. Future scenarios of European agricultural land use II. Projecting changes in cropland and grassland. Agr Ecosyst Environ 2005; 107(2-3): 117-35.
[10] Verburg PH, van Berkel DB, van Doorn AM, van Eupen M, van den Heiligenberg H. Trajectories of land use change in Europe: a model-based exploration of rural futures. Landscape Ecol 2010; 25(2): 217-32.
[11] Cantarello E, Newton AC, Hill RA. Potential effects of future land-use change on regional carbon stocks in the UK. Environ Sci Policy 2011; 14(1): 40-52.
[12] Yue TX, Fan ZM, Liu JY. Scenarios of land cover in China. Global Planet Change 2007; 55(4): 317-42. [13] Yue TX, Fan ZM, Liu JY. Changes of major terrestrial ecosystems in China since 1960. Global Planet Change 2005; 48(4):
287-302. [14] Verburg PH, Schulp CJE, Witte N, Veldkamp A. Downscaling of land use change scenarios to assess the dynamics of
European landscapes. Agr Ecosyst Environ 2006; 114(1): 39-56.
597XiaoFang Sun et al. / Procedia Environmental Sciences 13 (2012) 590 – 597598 Xiaofang Sun et al./ Procedia Environmental Sciences 8 (2011) 591–598
[15] Schulp CJE, Nabuurs GJ, Verburg PH. Future carbon sequestration in Europe - Effects of land use change. Agr Ecosyst Environ 2008; 127(3-4): 251-64.
[16] Tappeiner U, Tasser E, Leitinger G, Cernusca A, Tappeiner G. Effects of Historical and Likely Future Scenarios of Land Use on Above- and Belowground Vegetation Carbon Stocks of an Alpine Valley. Ecosystems 2008; 11(8): 1383-400.
[17] Verburg PH, Veldkamp A, Fresco LO. Simulation of changes in the spatial pattern of land use in China. Appl Geophys 1999; 19(3): 211-33.
[18] Arnell NW, Livermore MJL, Kovats S, Levy PE, Nicholls R, Parry ML, Gaffin SR. Climate and socio-economic scenarios for global-scale climate change impacts assessments: characterising the SRES storylines. Global Environmental Change-Human and Policy Dimensions 2004; 14(1): 3-20.
[19] IPCC. Climate change. The IPCC third assessment report. Cambridge and New York: Cambridge University Press 2001: [20] Johns TC, Gregory JM, Ingram WJ, Johnson CE, Jones A, Lowe JA, Mitchell JFB, Roberts DL, Sexton DMH, Stevenson DS,
Tett SFB, Woodage MJ. Anthropogenic climate change for 1860 to 2100 simulated with the HadCM3 model under updated emissions scenarios. Clim Dynam 2003; 20(6): 583-612.
[21] Liu JY, Zhuang DF, Luo D, Xiao X. Land-cover classification of China: integrated analysis of AVHRR imagery and geophysical data. Int J Remote Sens 2003; 24(12): 2485-500.
[22] Verburg PH, Overmars KP. Combining top-down and bottom-up dynamics in land use modeling: exploring the future of abandoned farmlands in Europe with the Dyna-CLUE model. Landscape Ecol 2009; 24(9): 1167-81.
[23] Castella JC, Verburg PH. Combination of process-oriented and pattern-oriented models of land-use change in a mountain area of Vietnam. Ecol Model 2007; 202(3-4): 410-20.
[24] Verburg PH, Veldkamp T, Bouma J. Land use change under conditions of high population pressure: the case of Java. Global Environ Chang 1999; 9(4): 303-12.
[25] Verburg PH, Veldkamp A. The role of spatially explicit models in land-use change research: a case study for cropping patterns in China. Agr Ecosyst Environ 2001; 85(1-3): 177-90.
[26] Pontius RG, Boersma W, Castella JC, Clarke K, de Nijs T, Dietzel C, Duan Z, Fotsing E, Goldstein N, Kok K, Koomen E, Lippitt CD, McConnell W, Sood AM, Pijanowski B, Pithadia S, Sweeney S, Trung TN, Veldkamp AT, Verburg PH. Comparing the input, output, and validation maps for several models of land change. Annals of Regional Science 2008; 42(1): 11-37.
[27] Verburg PH, Soepboer W, Veldkamp A, Limpiada R, Espaldon V, Mastura SSA. Modeling the spatial dynamics of regional land use: The CLUE-S model. Environ Manage 2002; 30(3): 391-405.