scanner path planning with the control of overlap for part
TRANSCRIPT

HAL Id: hal-01815462https://hal.archives-ouvertes.fr/hal-01815462
Submitted on 14 Jun 2018
HAL is a multi-disciplinary open accessarchive for the deposit and dissemination of sci-entific research documents, whether they are pub-lished or not. The documents may come fromteaching and research institutions in France orabroad, or from public or private research centers.
L’archive ouverte pluridisciplinaire HAL, estdestinée au dépôt et à la diffusion de documentsscientifiques de niveau recherche, publiés ou non,émanant des établissements d’enseignement et derecherche français ou étrangers, des laboratoirespublics ou privés.
Scanner path planning with the control of overlap forpart inspection with an industrial robot
Nguyen Duy Minh Phan, Yann Quinsat, Sylvain Lavernhe, Claire Lartigue
To cite this version:Nguyen Duy Minh Phan, Yann Quinsat, Sylvain Lavernhe, Claire Lartigue. Scanner path planningwith the control of overlap for part inspection with an industrial robot. International Journal ofAdvanced Manufacturing Technology, Springer Verlag, In press, �10.1007/s00170-018-2336-8�. �hal-01815462�

Noname manuscript No.(will be inserted by the editor)
Scanner path planning with the control of overlap forpart inspection with an industrial robot
Nguyen Duy Minh Phan · Yann Quinsat ·Sylvain Lavernhe · Claire Lartigue
Received: date / Accepted: date
Abstract Automated inspection of manufactured parts is increasingly gettingattention as it helps to make a rapid decision on product conformity. In thiscontext, the aim of this paper is to present a new scanner path planning methodfor part inspection using an industrial 6-axis robot The novelty of the approach isto generate a scan path with the control of the overlap between 2 adjacent scanningpaths based on the use of the least-squares conformal maps, which stretches a 3Dmesh surface on a 2D plane. Equidistant paths calculated in the 2D space are thentransformed into equidistant paths in the 3D space. The effective performance ofcontrolling the overlap can improve digitizing quality and save digitizing time bymanaging the coverage of the laser beam. Furthermore, the digitizing quality isalso ensured by keeping a constant scanning distance and executing a continuouscontrol of the scanner orientation relatively to the part surface for all the drivenpoints of the scan path. An experimental application of this new approach isproposed for a laser-plane scanner mounted on an industrial robot with 6 degreesof freedom, which demonstrates the interest of such an approach.
Keywords Automated inspection · Robot · Laser-Scanner trajectory · Overlapcontrol
M. PhanLURPA, ENS Paris-Saclay, Univ. Paris-Sud, Universite Paris-Saclay, 94235 Cachan, FranceTel.: +33147402213Fax: +33147402220E-mail: [email protected]
Y. QuinsatE-mail: [email protected]
S. LavernheE-mail: [email protected]
C. LartiqueE-mail: [email protected]

2 Nguyen Duy Minh Phan et al.
1 Introduction
Inspection procedures increasingly rely on the use of laser-plane sensors due totheir great ability to measure part defects within a minimum amount of time.When mounted on industrial robots, sensors’ accessibility is largely increased; thisgives the sensor the possibility to scan an object from any direction even alongcurved paths [1]. Within this context, scan path planning remains a major chal-lenge to obtain a complete representation of the surface in a minimum amount oftime with a given scanning quality. Scan path can be defined as a set of scannerconfigurations (or view points), i.e. a set of driven points and associated orienta-tions (Figure 1). These configurations are classically obtained by imposing someconstraints to the sensor in relation to the part to be measured. In the literature,visibility and quality are the most usual constraints. Initially dedicated to sensorsmounted on Coordinate Measuring Machines (CMM), methods have evolved inthe last decade to adapt to robots equipped with optical sensors. For robots, addi-tional degrees of freedom give the sensor greater accessibility to the surfaces to bemeasured. It is thus possible to generate more complex and continuous scan paths,e.g. trajectories that leave the sensor orientation continually perpendicular to thesurface. Additional constraints, such as the control of scanning overlap can thus beintegrated in the trajectory calculation. Indeed, scanning overlap, if uncontrolled,may affect both measuring time and measuring quality. Within this context, wepropose a method of scan path planning with the control of overlap. The original-ity lies in the use of a conformal-map based method, which is usually rather usedin tool path planning for machining, or in gun path planning for painting. Here,the difficulty resides in taking into account laser-scanner specificities. The paperis organized as follows. Section 2 is dedicated to related works. Section details ourapproach which is then illustrated in section 4 through an example.
Fig. 1 Laser-scanner trajectory and parameters
2 Related works
2.1 Scan path planning
Determining view points based on the concept of visibility consists in finding thesurface portions that belong to the field of view (FOV) of the scanner. The FOV isthe part of the laser beam which is visible by the scanner camera ([11]). Considering

Title Suppressed Due to Excessive Length 3
the laser-scanner mounted on a CMM, Bernard and Veron [2] introduce threelevels of visibility (local, global and real) to generate a sensor trajectory well-adapted to the control of complex parts. Their approach relies on the unitarysphere or Gaussian sphere, which is tesselated using a STL format. The part is alsotessellated, and the local visibility is obtained when the angle between the normalvector to the part triangle and the normal vector to a triangle of the unitarysphere is lesser than a specific threshold. The global visibility is computed byfinding visibility directions that intersect with other triangles of the part. Finally,real visibility is obtained after achieving the collision test between the part andthe sensor. From the CAD model, Xi and Shu determine the optimal parametersof the scanner FOV to maximize the portion of scanned surface [3]. The surface isdivided into sections by cutting the CAD model using parallel cross-sections. Foreach section, the optimal position is obtained by aligning the top of the FOV withthe upper boundary of the surface profile. While ElMaraghy and Yang [4] havedeveloped an approach based on the surface decomposition into several patches.For each patch, a zigzag trajectory is defined in function of the viewing angle andthe depth of view (DOV). Then the total path is calculated by aggregating all thetrajectories. Derigent et al. propose to use the notion of global and local visibilitythrough 2D visibility maps [5]. The local visibility cone (LVC) of a face F consistsof the set of view directions for which the angle between the view direction andthe vector normal to F is lesser than the maximum view angle. The set of viewdirections that intersect with the part defines the occulatation cone (OC), andfinally, the boolean subtraction between LVC and OC gives the global visibilitycone. Lee and Park [6] define the locally accessible directions (LADs) at eachpoint of the surface mesh by respecting some constraints such as the view angle,the depth of the view, the check of collisions with the part or the scanner. Thesets of globally accessible directions (GAD) are obtained by performing Booleanintersection operations among LADs.In addition to visibility, some studies propose to define points of view accordingto quality criteria. Prieto et al. [7] propose to keep the scanner normal to thesurface, while obeying a quality criterion depending on both the scanning distanceand the sensor view angle. Mahmud et al. [9] build the scan path by limiting thenumber of orientations of the laser-scanner, and considering an optimal digitizingdistance defined as the middle of the scanner FOV. Yang and Ciarallo use a geneticalgorithm to obtain a set of viewing domains and a list of observable entities forwhich the errors are within an admissible tolerance [10]. The approach developedby Lartigue et al. [11] relies on the representation of the part surface as a voxelmap, for which the size of each voxel is defined according to the size of the scannerFOV. To each voxel, a unique point of view is associated according to visibilityand quality criteria. Those criteria are defined by admissible ranges of digitizingdistances and view angles so as to ensure the surface digitizing with a given quality.Martin et al. propose a method based on voxelization of the CAD model whichtakes into account various criteria: surface coverage, scanning quality and scanpath length [12]. The volume of the 3D box which surrounds the surface is dividedinto slices. The slice width is given by the laser stripe, and for each slice, a collisionfree scan path is generated. Consecutive paths are combined together accordingto a zig-zag strategy to define the final trajectory. Besides visibility and qualityconstraints, Son et al. include additional constraints such as the number of requiredscans and the checking of occlusions [13]. Mavrinac et al. [14] formalize the search of

4 Nguyen Duy Minh Phan et al.
sensor viewpoints under constraints for 3D inspection using an active triangulationsystem. Each viewpoint is assessed thanks to a performance function that resultsfrom the combination of constraint functions to be respected.
Raffaeli et al. [15] propose a view planning approach for an optical 3D scannermounted on robot arms. Their approach relies on a NURBS surface which is di-vided into portions that are included in the scanner field of view, and for which thevariations of the normal vectors do not exceed an angular limit. The points thatcan be seen from the same point of view are gathered according two conditions: themaximum distance between two points in the same cluster must be less than thescanner field of view, and the maximum angle between the normal vectors must beless than 90◦. Wu et al. [16] propose a method of sensor path planning for surfaceinspection on a 6 degree-of-freedom robot that automatically adapts its trajectoryto the complex shape of the object by continuously changing the viewing directionof the scanner mounted on the robot. Each viewpoint of the planned path musthowever satisfy several constraints: field of view, scanning distance, view angleand overlap. First, a wireframe representation of the CAD model is extracted asthe projection contour of the model in the main direction, which is computed asthe mean of all the normal vectors in the model. Next, the model is divided intoseveral digitizing regions using the rectangle whose dimensions are defined by theFOV of the scanner and the overlap constraint. Koutecky et al. [17] have recentlydescribed a method for a ATOS system mounted on a KUKA robot. The surfaceis divided into cubes, according to the FOV and to the scanner depth of view.Their approach consists in finding the orientations of the system in order to havethe greatest number of visible polygonal facets as possible. Larsson and Kjellanderpropose an approach for scan path planning using a laser-scanner mounted on arobot dedicated to unknown objects [1]. A first scan is made from four orthogo-nal directions; the scanner is positioned at the limits of the working space of therobot. From data acquired during this first scan, a shape scan step is performed toretrieve the approximate shape of the object. Mineo et al.[18] develop a MATLABtoolbox named RoboNDT in order to generate the raster scan paths for surfaceinspection by the 6-axis industrial robots. Starting from the triangular mesh im-ported from the CAD model, the idea is to generate a raster scan path defined asa succession of curves and associated normal vectors. A curve, parallel to one edgeof the surface, at a distance d from the edge, is calculated as the intersection of aplane and the meshed surface. Each point of the obtained curve lays on one of thetriangles of the mesh, and the perpendicular direction associated to each point isthus given by the normal vector of the relative triangle. The process is iterated togenerate equally spaced parallel lines.
Most of the methods previously detailed described the scan path as a discreteset of points of view, which are defined according to quality and visibility con-straints. Only a few studies address the issue of scanning overlap between twosuccessive passes. The overlap zone represents the surface portion covered by twoconsecutive passes (Figure 2), and may alter scanning time and quality.
2.2 Scanning overlap Control
To demonstrate the influence of scanning overlap on quality, a reference plane isscanned according to a zig-zag strategy for which the percentage of overlap is fixed

Title Suppressed Due to Excessive Length 5
Fig. 2 Definition of the overlap zone
to 25 of the laser-line width. Two different types of overlap are considered. Thefirst overlap zone (overlap 1 in Figure 2) results from two consecutive passes withthe same scanner orientation. For the second overlap zone (overlap 2 in Figure 2),two sensor orientations are used. Digitizing quality can be evaluated in terms ofdigitizing noise. To evaluate the digitizing noise, digitized point clouds are regis-tered to the nominal surface. For this purpose, the CAD model of the referenceplane is meshed. For each facet of the reference mesh, a cylinder is created, whosebasis is the triangle defining the facet. The set of digitized points belonging to thecylinder so defined corresponds to the actual digitized facet. For each facet, thedistances between the digitized points and the facet are calculated. The associatedstandard deviation represents the actual digitizing noise. The evolution of digitiz-ing noise over all the surface is shown in the Figure 3(a). The point density for theoverlap zones is always higher than in other zones and as a result, digitizing noisein overlap zones is greater than in non-overlap zones. This difference is particularlysignificant in the overlap zone 2 for which the sensor orientation has been modified.Figure 3(b) clearly highlights the superposition effect of the two point clouds lead-ing to a larger dispersion and, as a result, a higher value of noise. As the scanningis performed using a robot, the laser beam can be continuously reoriented duringthe measurement which is a source of possible non-quality. Moreover, Figure 3(b)shows a little trueness error. As a result, the control of scanning overlap becomesnecessary to control the scanning quality.
Overlapping control has been more studied in relation with gun-path planningfor painting with an industrial robot. Indeed, in such cases, the overlap control isessential to obtain the desired paint thickness and uniformity. In order to minimizetime cycles as well as to control paint thickness uniformity, painting path strategiesdesigned to control painting overlap have been proposed in some studies. In theirapproach, Andulkar et al. [19] calculated the optimal overlap distance betweentwo consecutive passes according to the distribution model of the paint. In [20],

6 Nguyen Duy Minh Phan et al.
(a) Digitizing noise evaluated on the reference plane
(b) Histogram of the geometrical deviations in zone 2
Fig. 3 Influence of scanning overlap on digitizing noise
the authors show that the generation of a spray gun trajectory that uniformlycovers the surface not only relies on the definition of the path orientations and thespacing between passes but also on the speed along the passes.
Controlling the overlap between two successive scanning passes also presentssimilarities with constant scallop-height tool path methods for milling. The iso-scallop tool path strategy can be used in machining to improve the machinedsurface quality and to minimize the machining time by scheduling the cutter pathsso that the scallop height left by the tool between two successive paths is constant.Tournier and Duc [21] proposed a method based on the machining surface conceptMS, which is the offset surface by R of the nominal surface, with R the toolradius. Each pass of the trajectory Ci belongs to MS. The envelope surface of thetool movement associated to Ci defines a pipe surface Pi whose radius is equal to

Title Suppressed Due to Excessive Length 7
R. Authors define the iso-scallop height surface SSh which is the offset surfaceby Sh, the expected scallop height, of the nominal surface. Then, to ensure aconstant scallop height, two adjacent tool paths Ci and Ci+1 are built so thatthe intersection curve (scallop curve) between the two pipe surfaces Pi and Pi+1
belongs to the iso-scallop-height surface SSh. Can and Unuvar [22] developed aniso-scallop tool path generation algorithm which calculates the iso-scallop cuttercontact points from the analysis of the B-spline surface. The cutter tool radius isadjusted to the surface curvature, and then side step is computed for a constantscallop height. A surface curvature analysis procedure is applied to the entiresurface to determine the minimum radius of curvature along the feed and the side-step directions. This gives the maximum allowable radius of a tool to be used formachining the given surface.
Some works propose an interesting approach based on the conformal map [23][24]. The 3D mesh of the surface is stretched onto a 2D plane using the conformalmap. The advantage of the conformal map is to locally preserve the shape: thedistances and the areas are only changed by a scaling factor [25]. Then, equidistantpasses calculated in the 2D space can be transformed into iso-scallop paths in 3Dspace by the inverse conformal map. The great advantage here is the simplificationof calculation to control the overlap, as the tool path generation is performedin the 2D space. In this paper, we propose an original approach to generate ascan path planning for a laser-plane scanner mounted on an industrial robot thattakes advantage of the conformal map to control the overlap between two adjacentscanning passes. A scanning path with the control of digitizing overlap allows themanagement of both the orientation and the coverage rate of the laser beam.
3 Iso-Overlap Scan-path method - ISOvScan
In our approach, the digitizing system consists of a laser-plane sensor mounted onan industrial robot. The sensor trajectory is defined as a set of ordered scannerconfigurations, i.e. a set of positions CE and orientations (VL; VC), with VL thedirector vector of the digitizing line, and VC the director vector of the light-beamaxis. The point CE positions the scanning laser line in the field of view: C0CE =d∗.VC, with d∗ the scanning distance (Figure 1). The proposed method to controldigitizing overlap is inspired by iso-scallop tool path methods more commonly usedfor machining. To simplify computation, the scanner trajectory is calculated in the2D space of the part surface, as proposed in [23]. Nevertheless, as the CAD modelof the surface is not a continuous surface model but a 3D mesh, it is necessary totransform the 3D mesh surface into a 2D parametric space, using the Least-SquareConformal Map method (LSCM). The method we developed, called ISOvScan forIso-Overlap Scan path, presents three main steps:
– stretching the 3D mesh surface on a 2D parametric surface using the LSCMmethod
– generating the view points ce in the 2D space, and transformation of ce intoCE in the 3D space by the inverse LSCM
– calculation of the scanner orientations for each view point according to qualityconstraints
Each step of the ISOvScan method is detailed next.

8 Nguyen Duy Minh Phan et al.
Table 1 3D and 2D parameters
3D mesh parameters 2D mesh parameters
ST set of n triangular facets st set of n triangular facetsTj facet j with Tj ∈ ST , j ∈ [1, n] tj facet j with tj ∈ st, j ∈ [1, n]Sv set of vertices in 3D sv set of vertices in 2DV kj one vertex of the facet Tj vkj one vertex of the facet tj
with k ∈ [1, 3] with k ∈ [1, 3](xk
j , ykj ) coordinates of the vertex V k
j (ukj , v
kj ) coordinates of the vertex vkj
ATjarea of the facet Tj atj area of the facet tj
nj normal vector to the facet Tj
3.1 Mapping between the 3D space and the 2D parametric space using LSCM
First, let us introduce the LSCM method. In complex analysis, a conformal mapis defined as a bijection that locally keeps the angles [26]. The transformation ofa 3D triangulated surface into a 2D space (u, v) can be considered as a complexfunction:
ψ(s) = u(x, y) + iv(x, y) (1)
with s = x+ iy, and (x, y) the coordinates in the local basis (Figure 4).
Fig. 4 A triangle provided with a local basis
A function is said to be conformal if it satisfies the Cauchy-Riemann conditions:{ ∂u∂x = ∂v
∂y∂u∂y = − ∂v
∂x
(2)
which can also be written as [27] :
∇v =
(0 −11 0
)∇u (3)
Considering notations defined in table 1, the facet Tj , of ST of the surface isprovided with the orthonormal basis (x, y) (Figure 4).

Title Suppressed Due to Excessive Length 9
In this basis, the function which maps a point (x, y) of the triangle to a point(u, v) in the parametric space yields:
{u(x, y) = λ1.u
1j + λ2.u
2j + λ3.u
3j
v(x, y) = λ1.v1j + λ2.v
2j + λ3.v
3j
(4)
where λ1, λ2, and λ3 denote the barycentric coordinates of the point (x, y), cal-culated as follows:
λ1λ2λ3
=1
2.Aj·
y2j − y3j x3j − x2j y3jx2j − y2jx3jy3j − y1j x1j − x3j y1jx3j − y3jx1jy1j − y2j x2j − x1j y2jx1j − y1jx2j
·xy1
(5)
Then, ∇u can be written as a function of the barycentric coordinates:
∇u =
(∂u∂x∂u∂y
)= MTj
·
u1ju2ju3j
(6)
with:
MTj=
1
2.Aj·(y2j − y3j y3j − y1j y1j − y2jx3j − x2j x1j − x3j x2j − x1j
)(7)
The condition of equation 3 leads to:
MTj·
v1jv2jv3j
−( 0 −11 0
)·MTj
u1ju2ju3j
=
(00
)(8)
As equation 8 can only be respected for developable surfaces, for general surfacesthe equation is verified in the least-squares sense. Let us denote ELSCM non-conformality. The least-squares method consists in searching the set of parameters(ukj ,vkj ) which minimize ELSCM :
ELSCM =∑
Tj∈ST
ATj·
∥∥∥∥∥∥MTj·
v1jv2jv3j
−( 0 −11 0
)·MTj
u1ju2ju3j
∥∥∥∥∥∥2
(9)
After the implementation of the LSCM algorithm, a facet Tj of the 3D surfaceis transformed into the facet tj in the 2D parametric space, and the set ST of ntriangular facets in the 3D space is then transformed into the set st of n triangularfacets in the 2D space (Figure 5).
The next step is the generation of the view points, or driven points, ce in the2D space, followed by the transformation of ce into CE in the 3D space by theinverse LSCM.

10 Nguyen Duy Minh Phan et al.
Fig. 5 A 3D surface transformed into a 2D surface by LSCM
3.2 Generation of the driven points
The scan path is generated in 2D considering a classical parallel-plane trajectory.The length of the rectangle that bounds the 2D surface defines the plane direction,and the driven points are determined by the intersection between parallel planesand the parametric surface. To control the overlap, parallel planes are equidistant,with I2D the distance between two successive parallel planes corresponding tothe distance between two successive passes in the 2D space. However, it is thedistance I3D between two successive passes in the 3D space that controls theoverlap. Therefore, a relationship between I2D and I3D is established consideringthat the ratio of both values is equal to the proportionality coefficient of similartriangles Tj and tj :
I3DI2D
=1
n
n∑j=1
√ATj
atj(10)
The coordinates of the driven points cei (ce1,ce2 , , ce3) in the 2D space arethus obtained. A driven point cei is transformed into its corresponding point CEi
by the inverse transformation (Figure 6).
Fig. 6 Calculation of the scanning trajectory
Once all driven points are calculated, the next step is to determine the sensororientations for each driven point. This is performed in two steps: first the director

Title Suppressed Due to Excessive Length 11
vector of the digitizing line VL is determined, before the light-beam axis VC iscalculated.
3.3 Determination of the director vector
In order to achieve good scanning quality for the entire surface, the digitizingdistance must belong to a range of admissible values, generally determined fromthe scanner assessment [28]. A constant scanning distance is first imposed to all thedriven points to ensure that the digitized surface at the driven point is visible in theFOV of the scanner, and also to ensure an expected digitizing quality. The widthof the laser line, denoted Lopt, associated to this digitizing distance, is constantwith respect to the scanned surface. In order to maximize the digitized surface, thelaser line must be perpendicular to the direction of displacement along the scannertrajectory in the 3D space. Then, the laser line must also be perpendicular to thedirection of displacement of the trajectory in the 2D space, denoted v (figure6). The laser-line width lopt in the 2D space is defined using the proportionalitycoefficient: lopt = Lopt.I2D/I3D. At each point cei, the laser-line is positionedperpendicularly to the path and centered at cei. The width lopt defines the two endpoints pi1 and pi2 of the laser line (Figure 6). The coordinates of the correspondingpoints Pi1 and Pi2 are calculated using the LSCM inverse transformation. Thus,the director vector of the digitizing line at driven point CEi is given by:
VLi =Pi1Pi2
‖Pi1Pi2‖(11)
Note that, such a mode of calculation imposes the digitizing distance to be fixedto a predefined value (the value leading to Lopt).
3.4 Determination of the light beam axis
The vector of light-beam axis VC is determined so that the scanning direction isalways perpendicular to the surface. We thus have to calculate the local normalvector to the surface at each driven point CEi. In this direction, the normal vectoris calculated as the mean value of all the normal vectors to the facets associatedto the laser line at CEi. It is worth noting that due to the LSCM transformation,the facets associated to the laser line in the 3D space are also the facets associatedto the laser line in the 2D space. These facets intersect with the laser line in the2D space, and intersection points are easy to calculate (Figure 7). Therefore, afterthe transformation in the 3D space, the local normal vector is given by:
nCEi=
∑mij=1
nj
ATj∥∥∥∑mij=1
nj
ATj
∥∥∥ (12)
where mi is the number of facets related to the laser line at point CEi, and nj,the normal vector to the facet Tj with (j = 1 to mi ). Finally, the director vectorof light-beam axis is defined at each driven point CEi by: VCi = nCEi
.The whole trajectory is thus obtained as a set of positions and orientations (CEi
; VLi ; VCi). The scan path planning method with overlap control ISOvScan is

12 Nguyen Duy Minh Phan et al.
Fig. 7 Identification of the facets associated to the laser line
implemented in Matlab c©. By modifying the value of the pass interval I3D, theoverlap zone can be controlled. Two examples are proposed in Figure 8.
3.5 Illustration on an industrial case
In order to illustrate the contribution of our approach, this section is dedicatedto the comparison of the ISOvScan method with a classical zig-zag method. Thechosen surface is a part of a ski mask mold (Figure 9).
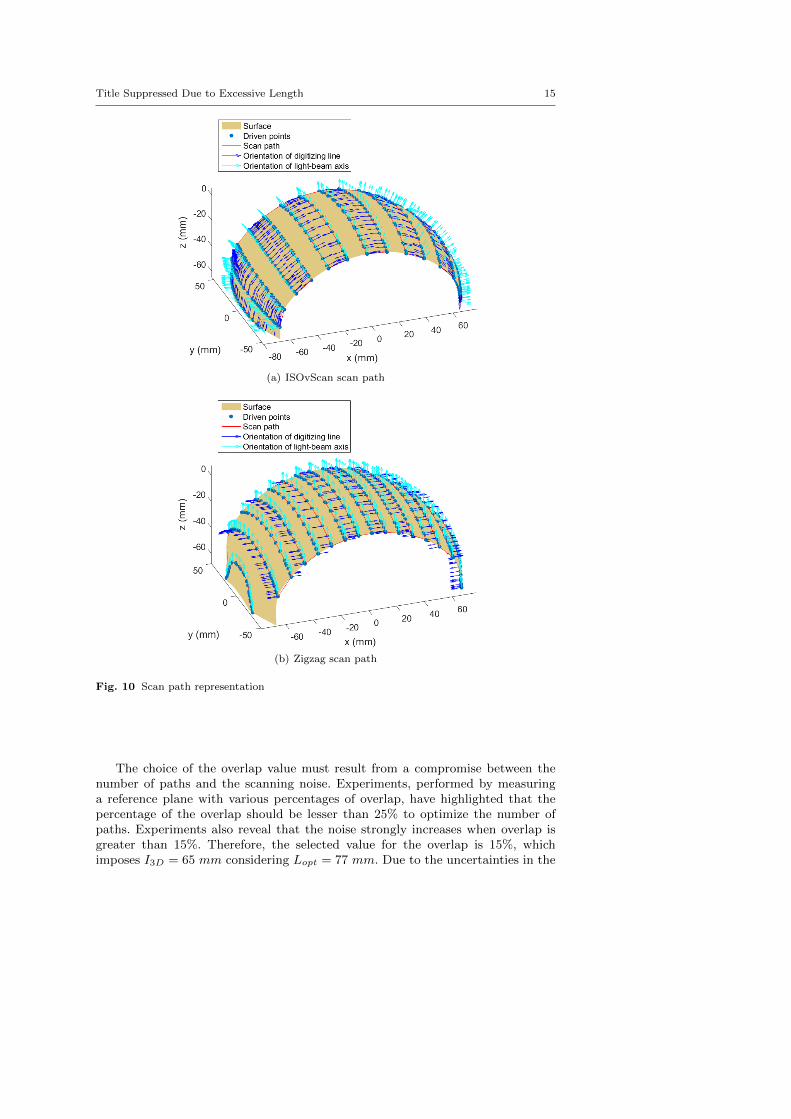
Two different methods are used to compute the scan path. On the one hand,the ISOvScan method is used. Considering Lopt = 18 mm, the value 14.5 mm ischosen for I3D, corresponding to an overlap of 20%. On the other hand, the scanpath is generated by a zig-zag parallel plane strategy with a constant transversalstep. For this case, the scanner orientation is constant for all the paths. In orderto be able to compare both methods, the transversal step is computed consideringthe angular variations between the local vector and the laser beam axis all surfacelong. The mean angle directly computed form the CAD model is equal to 48◦.Therefore, the transversal step is equal to I3D ∗ cos(48◦), which guarantees thatthe local mean value of the distance between paths on the 3D surface (as defined in[8])is equal to I3D. Paths generated by both methods are displayed in the Figures10(a) and 10(b).
Both scan paths have almost an equivalent length: the zig-zag trajectory isapproximately 6% longer. To enhance the relevancy of our method, the simulationof the scanning is carried out using a simulator previously developed [29]. Thescanning simulator relies on the analysis of the scanner configurations relativelyto the meshed part(Figures 11(a) and 11(b)). Green facets correspond to well dig-itized facets using only one configuration, yellow facets belong to overlap zones,whereas red areas correspond to not digitized facets. As expected, the ISOvS-can method (Figure 11(a)) has almost constant overlapping areas. The surface isalso completely digitized. Concerning the zig-zag trajectory (Figure 11(b)), as thetransversal step is constant, this implies that overlapping zones considerably vary.Minimal in the center of the part (where the slope is small), the width of theoverlapping zones is much larger on part sides. This suggests that the quality ofthe digitizing will be poorly controlled in these areas. Moreover, due to the con-stant orientation of the scanner, the flanks of the part with a deep slope are not

Title Suppressed Due to Excessive Length 13
(a) Pass interval I3D = 65 mm
(b) Pass interval I3D = 50 mm
Fig. 8 Examples of scanning trajectories for different pass intervals
digitized. This example clearly illustrates the interest of our approach to generatescan path with the control of quality, and the completeness of the measured data.
4 Application and experimentation using a test surface
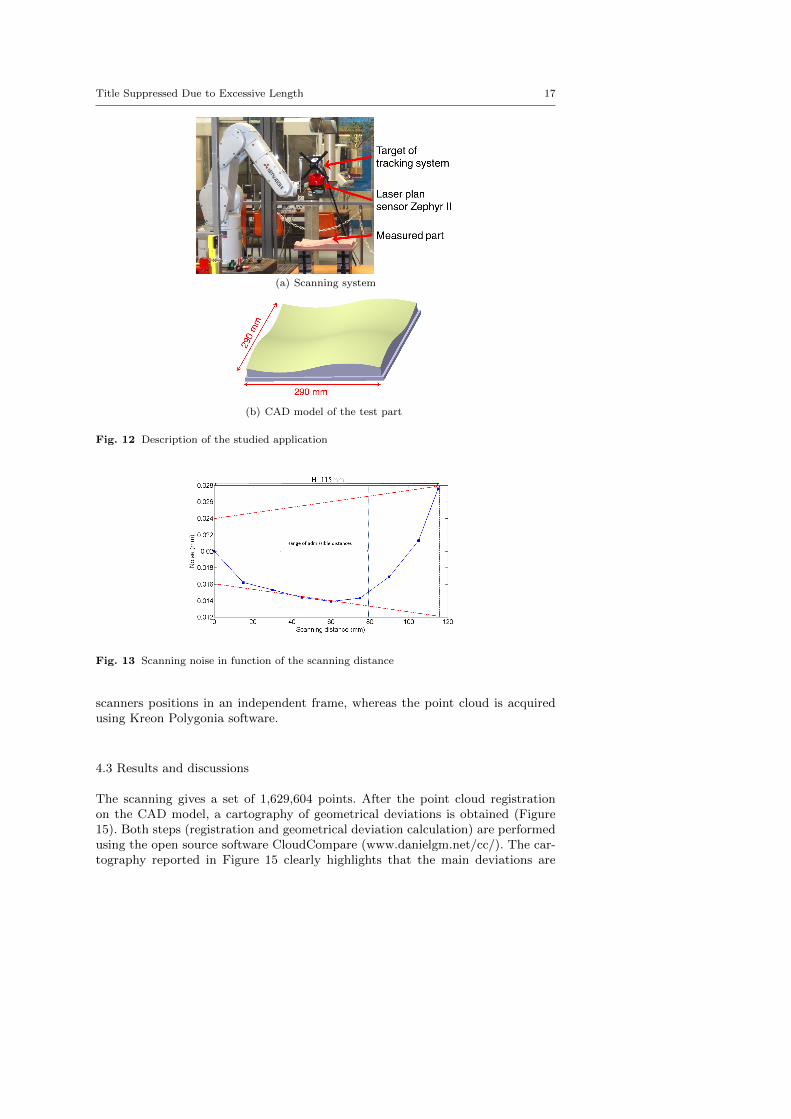
In order to assess the ISOvScan method, an application is proposed using a scan-ning system which consists of a laser-plan sensor Zephyr II (www.kreon3d.fr),mounted on an industrial Mitsubishi 6-axis robot and an optical tracker (Figure12(a)). To avoid the deviations of the effective laser position from the nominal onecaused by the path execution, this system provides an independent measurementof the scanner positions. Indeed, the optical tracking device can track the positionsof the scanner and the scanner’s movements are then directly synchronized withthe measurement. The proposed test part for this application is represented inFigure 12(b).

14 Nguyen Duy Minh Phan et al.
Fig. 9 Representation of the tudied surface
The ISOvScan method requires some scanner parameters, such as the dimen-sions of the FOV, and the admissible range of scanning distances which determinescanning quality. Therefore, a protocol of scanner assessment is applied to identifythe actual scanner parameters.
4.1 Scanner parameters
As previously mentioned, the method requires a good knowledge of the scannerFOV. More precisely, we need to evaluate the range of digitizing distances allow-ing a good scanning quality. This is performed using the protocol QUALIPSO,detailed in [28], by measuring a reference plane. Considering the laser-line as theintersection between the reference plane and the laser-beam, the depth H, whichcorresponds to the height of the FOV, is the height for which the laser-line isvisible in the CCD (Figure 13). The FOV is represented in red dotted-lines inthe figure. The value of H given by the experiment is 115 mm. The digitizingnoise is determined as the standard deviation between the measured points andthe associated Least-Square plane. The evolution of the noise according to thedigitizing distance displayed in Figure 13 is obtained by changing the scanningdistance every 15 mm from the top to the bottom of the FOV. The figure exhibitsa significant increase of the noise at the bottom position and the top positioncompared with the middle position. The admissible range of scanning distance isestablished considering a threshold for the noise. For our experiment, we set thisthreshold to 0.015 mm, giving the admissible range of distances [35 mm; 79 mm].If the surface scanned belongs to this range, this ensures a scanning with a noiselesser than δad = 0.015 mm. Furthermore, the figure points out that the minimumvalue of noise corresponds to the digitizing distance d∗ = 60 mm from the top ofthe FOV, giving the laser-line width Lopt = 77 mm. This digitizing distance istherefore adopted for the experiment.
Title Suppressed Due to Excessive Length 15
(a) ISOvScan scan path
(b) Zigzag scan path
Fig. 10 Scan path representation
The choice of the overlap value must result from a compromise between thenumber of paths and the scanning noise. Experiments, performed by measuringa reference plane with various percentages of overlap, have highlighted that thepercentage of the overlap should be lesser than 25% to optimize the number ofpaths. Experiments also reveal that the noise strongly increases when overlap isgreater than 15%. Therefore, the selected value for the overlap is 15%, whichimposes I3D = 65 mm considering Lopt = 77 mm. Due to the uncertainties in the

16 Nguyen Duy Minh Phan et al.
(a) ISOvScan simulation
(b) Zigzag simulation
Fig. 11 Scanning simulation representation
modelling of the FOV and in the position of the driven point, a value too smallcould lead to unmeasured areas which is not desirable.
4.2 Experiments
The proposed method is applied to the part defined in Figure 12(b) using theparameters defined in section 4.1. The calculated scan path is reported in Figure14(a). This scan path is first assessed by the scanning simulator previously devel-oped [29]. The scanning simulation shows an expected digitizing result in whichthe most facets on the surface are digitized with a good digitizing quality (in green)and the dimension of the overlap zones between the successive passes are nearlyconstant (in yellow).
The scan path so calculated is thus transmitted to the industrial robot whichsupports the scanner to be executed. Prior to the execution, the robot’s movementsare simulated using RoboDK c©(Figure 14(a)). The simulation gives the relativepositions and orientations of firstly, the surface to be scanned and the robot,and secondly the laser sensor and the 6th robot axis. The study of the robotjoint sollicitations assess the consistency of the trajectory in the robot coordinatesystem. The robot is equipped with an optical tracker system which acquires the
Title Suppressed Due to Excessive Length 17
(a) Scanning system
(b) CAD model of the test part
Fig. 12 Description of the studied application
Fig. 13 Scanning noise in function of the scanning distance
scanners positions in an independent frame, whereas the point cloud is acquiredusing Kreon Polygonia software.
4.3 Results and discussions
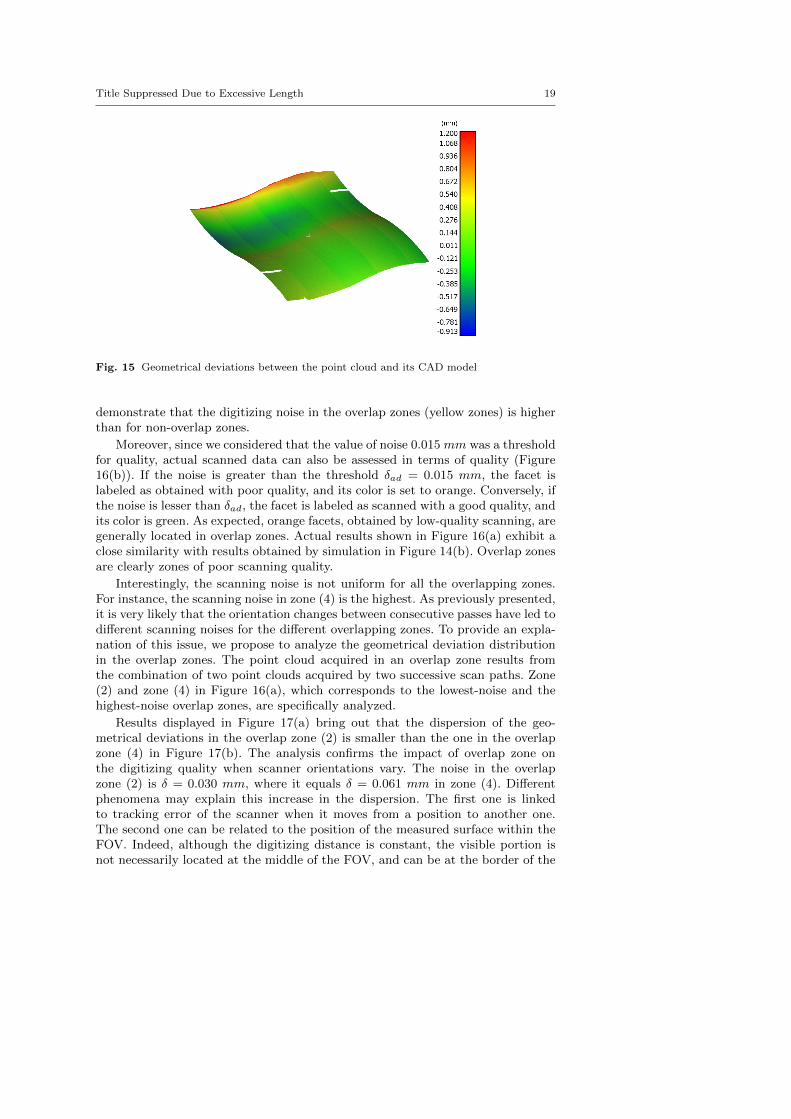
The scanning gives a set of 1,629,604 points. After the point cloud registrationon the CAD model, a cartography of geometrical deviations is obtained (Figure15). Both steps (registration and geometrical deviation calculation) are performedusing the open source software CloudCompare (www.danielgm.net/cc/). The car-tography reported in Figure 15 clearly highlights that the main deviations are

18 Nguyen Duy Minh Phan et al.
(a) Scan path generated by ISOvScan
(b) Overlap simulation (Yellow) [29]
Fig. 14 Calculated scan path and scanning simulation
located at one border of the surface, which is likely due to the measuring condi-tions. Some scanning holes are also present on the point cloud due to the instabilityof laser beam during the scanning process. Since the driven points in 2D space aregenerated from the intersection between the equidistant planes and the facets, thescan path is a set of driven points, some of which are closely spaced, others not soclose. Therefore, there is sudden change of scanner orientation when the scannermoves from one point to another. This may cause undesirable noise in some areason the surface.
The evolution of the actual scanning noise is reported in Figure 16(a), in whichthe scale of colors accounts for the scanning noise evolution. As expected, results
Title Suppressed Due to Excessive Length 19
Fig. 15 Geometrical deviations between the point cloud and its CAD model
demonstrate that the digitizing noise in the overlap zones (yellow zones) is higherthan for non-overlap zones.
Moreover, since we considered that the value of noise 0.015 mm was a thresholdfor quality, actual scanned data can also be assessed in terms of quality (Figure16(b)). If the noise is greater than the threshold δad = 0.015 mm, the facet islabeled as obtained with poor quality, and its color is set to orange. Conversely, ifthe noise is lesser than δad, the facet is labeled as scanned with a good quality, andits color is green. As expected, orange facets, obtained by low-quality scanning, aregenerally located in overlap zones. Actual results shown in Figure 16(a) exhibit aclose similarity with results obtained by simulation in Figure 14(b). Overlap zonesare clearly zones of poor scanning quality.
Interestingly, the scanning noise is not uniform for all the overlapping zones.For instance, the scanning noise in zone (4) is the highest. As previously presented,it is very likely that the orientation changes between consecutive passes have led todifferent scanning noises for the different overlapping zones. To provide an expla-nation of this issue, we propose to analyze the geometrical deviation distributionin the overlap zones. The point cloud acquired in an overlap zone results fromthe combination of two point clouds acquired by two successive scan paths. Zone(2) and zone (4) in Figure 16(a), which corresponds to the lowest-noise and thehighest-noise overlap zones, are specifically analyzed.
Results displayed in Figure 17(a) bring out that the dispersion of the geo-metrical deviations in the overlap zone (2) is smaller than the one in the overlapzone (4) in Figure 17(b). The analysis confirms the impact of overlap zone onthe digitizing quality when scanner orientations vary. The noise in the overlapzone (2) is δ = 0.030 mm, where it equals δ = 0.061 mm in zone (4). Differentphenomena may explain this increase in the dispersion. The first one is linkedto tracking error of the scanner when it moves from a position to another one.The second one can be related to the position of the measured surface within theFOV. Indeed, although the digitizing distance is constant, the visible portion isnot necessarily located at the middle of the FOV, and can be at the border of the

20 Nguyen Duy Minh Phan et al.
(a) Scanning noise evolution on the surface
(b) Categorization of scanning noise in terms of quality
Fig. 16 Scanning noise and quality
FOV which leads to a higher dispersion. Finally, as already discussed, variationsof orientations clearly affect the scanning quality. This result emphasizes how im-portant the overlap control in scan path generation is. Indeed, the scanning noisein overlap zones is always greater than in non-overlap zones. The scanning qual-ity and scanning time can be controlled by keeping a constant scanning distanceand executing a continuous control of the scanner orientation for all the drivenpoints of the scanning path. However, this experiment assesses the efficiency ofthe ISOvScan method for scan path planning with the control of overlap.

Title Suppressed Due to Excessive Length 21
(a) Overlap zone (2)
(b) Overlap zone (4)
Fig. 17 Scanning quality evaluation in overlap zones
4.4 Limitations
One limitation of the ISOvScan method is that the interval between the passesof the scan path in 3D space cannot be kept constant for all the scan path forhigh-curvature surfaces. In this case, the size of overlapping zones between passesis not uniform. This is due to errors made in the approximation of the conformaltransformation. Actually, the interval between two successive passes is establishedaccording to Equation 10. The transformation from 3D space to 2D space is carriedout for each facet of the surface, whereas the ratio I3D
I2Dis calculated as a mean
value of the proportionality coefficient of similar triangles Tj and tj . Due to theapproximation performed by LSCM, some errors exist in particular concerning theproportionality coefficient. Let us denote kj , the LSCM error which represents thedifference between the proportionality coefficient of two similar triangles Tj andtj and the ratio I3D
I2D. kj is given by:
ejLSCM =
∣∣∣∣kj − kk
∣∣∣∣ (13)

22 Nguyen Duy Minh Phan et al.
where kj =
√ATj
atj
k = I3DI2D
= 1n
∑nj=1
√ATj
atj
(14)
For the whole meshed surface:
eLSCM =1
n
n∑j=1
ejLSCM (15)
The LSCM error is calculated for two examples of surfaces with different levelof curvature variations. With a low-curvature variation surface, the interval be-tween two consecutive passes is almost the same for all the passes (Figure 18). Inthe case of a high-curvature variation surface (Figure 19) the interval cannot bemaintained uniformly in some zones on the surface. Obviously, the LSCM errorcorresponding to the high-curvature surface (3.14 %) is higher than the one forthe low-curvature surface (1.04 %). It is thus possible to predict if the methodwill provide equally overlap zones or not by evaluating the LSCM error. Despiteits limitation in the case of high-curvature surfaces, the ISOvScan can control theoverlapping zones in many cases by combining accordingly the interval betweenpasses and the laser width of the scanner. Nevertheless, it is worth noting that ourmethod is more efficient when the wavelength of the geometrical defects is greaterthan the laser width. If not, our positioning method becomes non-consistent, andmay cause visibility problems or may hinder overlap control as the visibility isonly analysed for the driven points, and not for the whole laser line. In furtherresearch, we suggest that an alternative method should be proposed, where thesensor orientation could not be defined as continuously perpendicular to the sur-face.
(a) Surface representation (b) Evolution of LSCM erroreLSCM = 1.04%
(c) Overlap simulation(Yellow)
Fig. 18 LSCM error for a low-curvature variation surface

Title Suppressed Due to Excessive Length 23
(a) Surface representation (b) Evolution of LSCM erroreLSCM = 3.14%
(c) Overlap simulation(Yellow)
Fig. 19 LSCM error for a high-curvature variation surface
5 Conclusion
In this paper, we have proposed a new method of scan path planning, ISOvScan,for automated inspection of manufactured part using an industrial robot. The orig-inality of the method is the control of the overlap between two successive scanningpasses. Actually, a scan path with the control of the overlap can control the ori-entation and the coverage rate of the laser beam. Therefore, digitizing quality, aswell as digitizing time, can be controlled by optimizing overlapping zones. Themethod relies on the use of the Least-Square Conformal Map to transform the 3Dsurface into a 2D space. Therefore, scan path calculation can be performed moresimply in the 2D space. The benefits of the ISOvScan method was assessed byresults obtained from a real experimentation using an industrial robot equippedwith a laser-scanner Zephyr. Nevertheless, the method has two main limitations.The first one concerns high-curvature variation surfaces for which the control ofoverlap turns out to be difficult. The second one is related to the way the drivenpoints are calculated in the 2D space. As driven points are generated from theintersection between the equidistant planes and the facets, they are not regularlyspaced, which may cause sudden changes of scanner orientation when the scannermoves from one point to another, and lead to undesirable noise in some areas onthe surface. To attempt to solve this issue, future work will focus on the scan pathsmoothing using B-spline approximation. The scan path as a polynomial curve isactually better adapted to the robot motion control.
Acknowledgements
This research was made possible by the equipment support from Kreon Technology.We gratefully acknowledge the help provided by Mr. Tom Ranger and Mr. DorianVerdel for their technical assistance in our experimental work.
References
1. S. Larsson and Johan AP Kjellander, Path planning for laser scanning with an industrialrobot, Robotics and Autonomous Systems, 56(7), pp. 615-624 (2008)

24 Nguyen Duy Minh Phan et al.
2. A. Bernard, M. Veron, Visibility theory applied to automatic control of 3D complex partsusing plane laser sensors, CIRP Annals-Manufacturing Technology, 49(1), pp. 113-118(2000)
3. F. Xi and C. Shu, CAD-based path planning for 3-D line laser scanning, Computer-AidedDesign, 31(7), pp. 473-479 (1999)
4. H. ElMaraghy and X. Yang, Computer-aided planning of laser scanning of complex ge-ometries, CIRP Annals-Manufacturing Technology, 52(1), pp. 411–414, (2003)
5. W. Derigent, E. Chapotot, G. Ris, S. Remy, and A. Bernard, 3D digitizing strategy plan-ning approach based on a CAD model, Journal of Computing Information Science andEngineering,7(1), pp. 10–19 (2007)
6. K. Lee and H. Park. Automated inspection planning of free-form shape parts by laserscanning, Robotics and Computer-Integrated Manufacturing, 16(4):pp. 201–210, (2000)
7. F. Prieto, H. Redarce, R. Lepage, and P. Boulanger, Range image accuracy improvementby acquisition planning. In Proceedings of the 12th conference on vision interface (VI99),Trois Rivieres, Quebec, Canada, pp.18-21 (1999)
8. Y. Quinsat and L. Sabourin, Optimal selection of machining direction for three-axis millingof sculptured parts. International Journal of Advanced Manufacturing Technologie, 27(1-12),pp. 11321139 (2006)
9. M. Mahmud, D. Joannic, M. Roy, A. Isheil, and J.-F. Fontaine, 3D part inspection pathplanning of a laser scanner with control on the uncertainty, Computer-Aided Design, 43(4),pp. 345-355 (2011)
10. C. Yang and F. Ciarallo, Optimized sensor placement for active visual inspection, Journalof Robotic Systems, 18(1), pp. 1-15 (2001)
11. C. Lartigue, Y. Quinsat, C. Mehdi-Souzani, A. Zuquete-Guaratoand S. Tabibian, Voxel-based path planning for 3D scanning of mechanical parts, Computer-Aided Design andApplications, 11(2), pp. 220-227 (2014)
12. R. Martins, G. Garca-Bermejo, Z. Casanova, R. Peran Gonzalez, Automated 3D surfacescanning based on CAD model, Mechatronics, 15, pp. 837–857 (2005)
13. S. Son, H. Park, and K. Lee, Automated laser scanning system for reverse engineering andinspection, International Journal of Machine Tools and Manufacture, 42(8), pp. 889-897(2002)
14. A. Mavrinac, X. Chen, and J. Alarcon-Herrera, Semiautomatic model-based view planningfor active triangulation 3-D inspection systems. IEEE/ASME Transactions on Mechatron-ics, 20(2), pp. 799-811 (2015)
15. R. Raffaeli, M. Mengoni, M. Germani, Context dependent automatic view planning: theinspection of mechanical components, Computer-Aided Design and Applications, 10(1),pp. 111–127 (2013)
16. Q. Wu, J. Lu, W. Zou, and D. Xu, Path planning for surface inspection on a robot-based scanning system , IEEE International Conference on Mechatronics and Automation(ICMA), pp. 2284-2289 (2015)
17. T. Koutecky, D. Palousek, and J. Brandejs, Sensor planning system for fringe projectionscanning of sheet metal parts, Measurement, 94, pp. 60-70 (2016)
18. C. Mineo, S. G. Pierce, P. I. Nicholson, and I. Cooper, Robotic path planning fornon-destructive testing–A custom MATLAB toolbox approach, Robot. Comput. Integr.Manuf., 37, pp. 1-12 (2016)
19. M. Andulkar, S. Chiddarwar, and A. Marathe, Novel integrated offline trajectory gen-eration approach for robot assisted spray painting operation, Journal of ManufacturingSystems, 37, pp. 201-216 (2015)
20. P. Atkar, D. Conner, A. Greenfield, H. Choset, and A. Rizzi, Uniform coverage of simplesurfaces embedded in R3 for auto-body painting, Workshop on algorithmic foundations ofrobotics, pp. 383-398 (2004)
21. C. Tournier and E. Duc, A surface based approach for constant scallop height tool-pathgeneration, International Journal of Advanced Manufacturing Technology, 19(5), pp. 318-324 (2002)
22. A. Can and A. Unuvar, A novel iso-scallop tool-path generation for efficient five-axismachining of free-form surfaces, International Journal of Advanced Manufacturing Tech-nology, 51(912), pp. 1083-1098, (2010)
23. W. Li, Z. Yin, Y. Huang, T. Wu, and Y. Xiong, Tool path generation for triangular meshesusing least-squares conformal map, International Journal of Production Research, 49(12),pp. 3653-3667 (2011)

Title Suppressed Due to Excessive Length 25
24. J. Zhao, Q. Zou, L. Li, and B. Zhou, Tool path planning based on conformal parameteri-zation for meshes, Chinese Journal of Aeronautics, 28(5), pp. 1555-1563 (2015)
25. S. Haker, S. Angenent, A. R. Tannerai, R. Kikinis, G. Sapiro, and M. Halle, Conformalsurface parameterization for texture mapping, IEEE Transactions on Visualization andComputer Graphics, 6(2), pp. 181–189 (2000)
26. B. Levy, S. Petitjean, N. Ray, and J. Maillot, Least squares conformal maps for automatictexture atlas generation, ACM Trans. Graph., 21(3), pp. 362-371 (2002)
27. K. Hormann, B. Levy, and A. Sheffer, Mesh parameterization: Theory and practice, ACMSIGGRAPPH, course notes, (2007)
28. C. Mehdi-Souzani, Y. Quinsat, C. Lartigue, and P. Bourdet, A knowledge database ofqualified digitizing systems for the selection of the best system according to the application,CIRP Journal of Manufacturing Science and Technology., 13, pp. 15–23 (2016)
29. M. Phan, Y. Quinsat, C. Lartigue, Simulation of Laser-Sensor Digitizing for On-MachinePart Inspection, Advances on Mechanics, Design Engineering and Manufacturing, Part ofthe series Lecture Notes in Mechanical Engineering pp. 301–311 (2016)