scanfil annual report 2014 · scanfil annual report 2014. ... customers launch new products more...
TRANSCRIPT

A N N U A L R E P O R T 2 0 1 4

V U O S I K E R TO M U S 2 0 1 4
3S C A N F I L A N N U A L R E P O R T 2 0 1 4

GENERAL
4 For shareholders
5 Scanfilinbrief
6 Keyfigures2014
7 CEO’sreview
8 Customers
10 Businessoperations
12 Globalfootprint
14 BoardofDirectorsandManagementTeam
16 Stockexchangereleases2014
FINANCIAL STATEMENTS
18 ReportofBoardofDirectors2014
21 Consolidatedincomestatement,IFRS
22 Consolidatedstatementoffinancialposition,IFRS
I N D E X
23 Consolidatedcashflowstatement,IFRS
24 Consolidatedstatementofchangesinequity,IFRS
25 Accountingprinciplesforconsolidatedfinancialstatements
30 Notestotheconsolidatedfinancialstatements,IFRS
48 Keyfinancialindicators
49 Keyratios
50 Parentcompanyincomestatement,FAS
51 Parentcompanybalancesheet,FAS
52 Parentcompanycashflowstatement,FAS
53 Notestotheparentcompanyfinancialstatements,FAS
57 Shares and shareholders
59 BoardofDirectors´proposalforthedistributionofprofit
60 Auditors’report
61 Corporategovernancestatement2014
3S C A N F I L A N N U A L R E P O R T 2 0 1 4

FOR SHAREHOLDERS
ments should be delivered in originals before the last date for registration.
Payment of dividend
The Board of Directors proposes to the Annual General Meeting that a dividend of EUR 0.07 be paid from the unre-stricted shareholders’ equity per share, for a total of EUR 4,041,130.73 The record date for payment of dividend shall be 10 April 2015 and the date of payment of dividend 17 April 2015. Dividend shall be paid to share-holders who on the record date are entered in the register of the company’s shareholders kept by the Euroclear Fin-land Ltd.
Financial information
In 2015, Scanfil plc will be publishing the following financial reviews: - Financial statement bulletin 24 February 2015 - Annual report week 11/2015 - Interim Report for January–March 29 April 2015 - Interim Report for January–June 10 August 2015
Annual General Meeting
The Annual General Meeting of Scanfil plc will be held on Wednesday 8 April 2015 at 1.00 p.m. in company’s main office, at the address Yritystie 6, Sievi, Finland. The shareholders’ meeting will examine the matters referred to in the summons to the meeting published in accordance with the Articles of Associa-tion, which are also presented in a stock market announcement and on the com-pany’s web site www.scanfil.com. Eligibility to attend the meeting shall be enjoyed by shareholders who were entered by 25 March 2015 at the latest as shareholders in the register of Scan-fil plc’s shareholders kept by Euroclear Finland Ltd. In order to be able to at-tend the Annual General Meeting, share-holders shall register with the company by 4 p.m. 31 March 2015 at the latest, either in writing to the address Scanfil plc, Yritystie 6, 85410 Sievi, Finland, by telephone, on + 358 – 8 – 4882 111 or by e-mail [email protected] When registering by post, the letter shall have arrived before the end of the registration period. Possible proxy docu-
- Interim Report for January– September 28 October 2015
The financial reviews will be appearing in Finnish and English, and be published on the company’s website at www.scanfil.com. The publications can also be ordered from the address Scanfil plc, Yritystie 6, 85410 Sievi, Finland and by telephone on + 358 – 8 – 4882 111.
Register of shareholders
Shareholders are requested to give no-tice of changes of name and address to the bank, bankers or Euroclear Finland Oy, which, as the account operator cho-sen by each shareholder, administers the shareholder’s book-entry securities ac-count.
4S C A N F I L A N N U A L R E P O R T 2 0 1 4
5S C A N F I L A N N U A L R E P O R T 2 0 1 4

Scanfil plc, an international contract manufacturing partner
SC ANFIL IN BRIEF
•Weoperateclosetoourcustomers•Speed,flexibilityandreliabilitythrough comprehensivesupplychainmanagementand verticallyintegratedmanufacturing•Goodfinancialstanding
STRATEGIC STRENGTHSMISSION
Scanfilhelpsitscustomersfindsuccessbyprovidingareliableandeffectivemanufacturingserviceandsupplychainimplementation.
VISION
Wearethepreferredmanufacturingpartnerforourcustomers.
Scanfil plc is a listed (NASDAQ OMX Helsinki, SCL1V) international contract manufacturer and system supplier. The company has nearly 40 years of experi-ence in demanding contract manufactur-ing. It is headquartered in Sievi, Finland. Scanfil has production operations in Fin-land, China, Germany, Hungary and Esto-
nia. Scanfil’s turnover in 2014 was EUR 214.5 million. At the end of the year, it em-ployed a total of 1,782 people, of which around 87% were based outside Finland. The key elements of Scanfil’s operations include a vertically integrated production system and the provision of services and supply chain management
to customers over the entire life cycle of the product. Its customers include in-ternational operators in the automation, energy, data transmission and health technology sectors, among other indus-tries, and companies operating in fields related to urbanisation. Typical products manufactured by Scanfil include equipment systems for mobile and telecommunication networks, automation system modules, frequency converters, lift control systems, analysers, game machines, self-service equipments and meteorological instruments.
4S C A N F I L A N N U A L R E P O R T 2 0 1 4
5S C A N F I L A N N U A L R E P O R T 2 0 1 4

KEY F IGURES
0
50
100
150
200
250
2012 2013 20140
5
10
15
20
2012 2013 2014
0
10
20
30
40
50
60
70
80
2012 2013 2014
0
5
10
15
20
2012 2013 2014
4,56,3
7,6
0,00
0,05
0,10
0,15
0,20
0,25
2012 2013 2014-10
-8
-6
-4
-2
0
2012 2013 2014
Turnover Return on investment
Solvency
Operating profit & operating profit %
Earnings per shareNet debt
Turnover by regional segment Personnel by region
meur %
%
meur %
eurmeur
60%
Europe
40%
Asia
767
Asia
1015
Europe
Group
6S C A N F I L A N N U A L R E P O R T 2 0 1 4
7S C A N F I L A N N U A L R E P O R T 2 0 1 4
KEY F IGURES
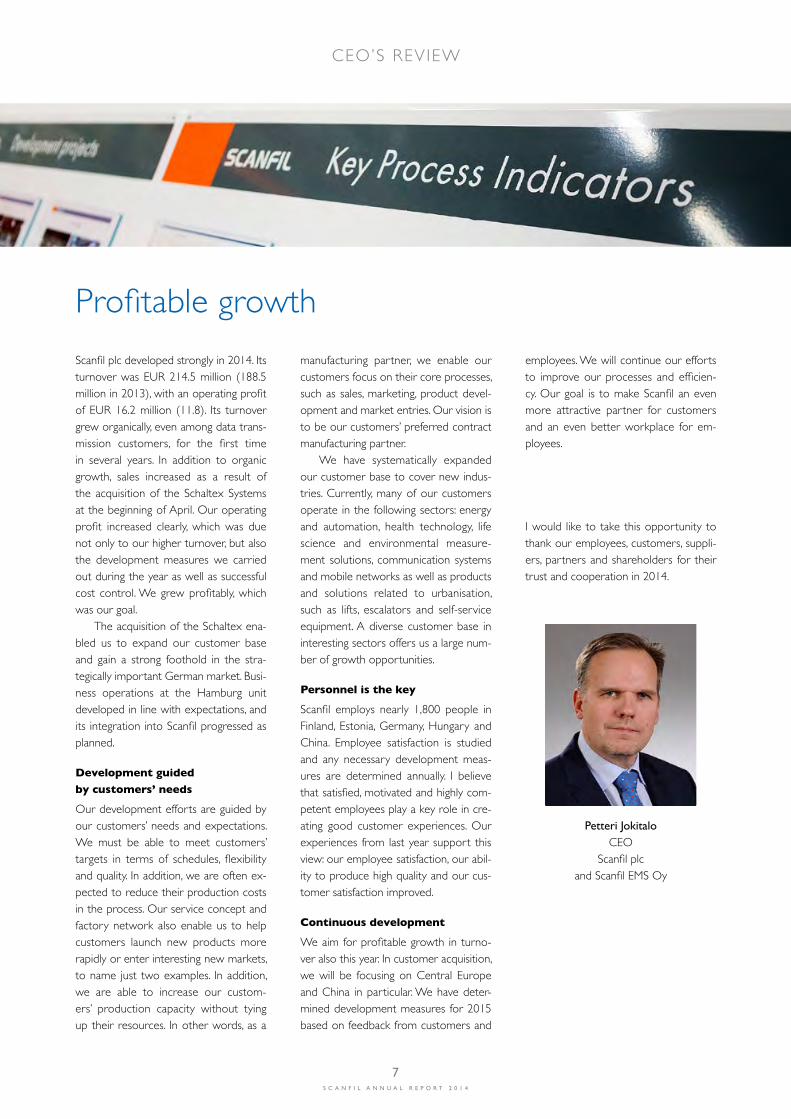
Profitable growth
CEO’S REVIEW
Group
Scanfil plc developed strongly in 2014. Its turnover was EUR 214.5 million (188.5 million in 2013), with an operating profit of EUR 16.2 million (11.8). Its turnover grew organically, even among data trans-mission customers, for the first time in several years. In addition to organic growth, sales increased as a result of the acquisition of the Schaltex Systems at the beginning of April. Our operating profit increased clearly, which was due not only to our higher turnover, but also the development measures we carried out during the year as well as successful cost control. We grew profitably, which was our goal. The acquisition of the Schaltex ena-bled us to expand our customer base and gain a strong foothold in the stra-tegically important German market. Busi-ness operations at the Hamburg unit developed in line with expectations, and its integration into Scanfil progressed as planned.
Development guided by customers’ needs
Our development efforts are guided by our customers’ needs and expectations. We must be able to meet customers’ targets in terms of schedules, flexibility and quality. In addition, we are often ex-pected to reduce their production costs in the process. Our service concept and factory network also enable us to help customers launch new products more rapidly or enter interesting new markets, to name just two examples. In addition, we are able to increase our custom-ers’ production capacity without tying up their resources. In other words, as a
manufacturing partner, we enable our customers focus on their core processes, such as sales, marketing, product devel-opment and market entries. Our vision is to be our customers’ preferred contract manufacturing partner. We have systematically expanded our customer base to cover new indus-tries. Currently, many of our customers operate in the following sectors: energy and automation, health technology, life science and environmental measure-ment solutions, communication systems and mobile networks as well as products and solutions related to urbanisation, such as lifts, escalators and self-service equipment. A diverse customer base in interesting sectors offers us a large num-ber of growth opportunities.
Personnel is the key
Scanfil employs nearly 1,800 people in Finland, Estonia, Germany, Hungary and China. Employee satisfaction is studied and any necessary development meas-ures are determined annually. I believe that satisfied, motivated and highly com-petent employees play a key role in cre-ating good customer experiences. Our experiences from last year support this view: our employee satisfaction, our abil-ity to produce high quality and our cus-tomer satisfaction improved.
Continuous development
We aim for profitable growth in turno-ver also this year. In customer acquisition, we will be focusing on Central Europe and China in particular. We have deter-mined development measures for 2015 based on feedback from customers and
employees. We will continue our efforts to improve our processes and efficien-cy. Our goal is to make Scanfil an even more attractive partner for customers and an even better workplace for em-ployees.
I would like to take this opportunity to thank our employees, customers, suppli-ers, partners and shareholders for their trust and cooperation in 2014.
PetteriJokitaloCEO
Scanfil plcand Scanfil EMS Oy
6S C A N F I L A N N U A L R E P O R T 2 0 1 4
7S C A N F I L A N N U A L R E P O R T 2 0 1 4

CUSTOMERS
Scanfil’smanufacturingservicesaresuitableformostproductcompaniesinvariousindustries.Regardlessoftheirfield,mostcompaniesincreasinglywanttofocusontheircustomersandproductdevelopmentandatthesametimeoutsourceproductionandsupplychainmanagementtopartnersspecialisingincontractmanufacturing.
Ourcustomergroupsare:
•EnergyandAutomation •Networks •Medtech,LifeScienceandEnvironmentalMeasurements •UrbanApplications
A diverse customer base Turnover by customer group, %
Total 100
Meditech, Life Science,Environmental Measurement
Networks
Energy and Automation
Urban Applications
Others
7,9
21,8
28,6
37,8
3,9
Turnover by customer group, %
Total 100
Meditech, Life Science,Environmental Measurement
Networks
Energy and Automation
Urban Applications
Others
7,9
21,8
28,6
37,8
3,9
8S C A N F I L A N N U A L R E P O R T 2 0 1 4
9S C A N F I L A N N U A L R E P O R T 2 0 1 4

Energy and Automation
• Key market trends: energy efficiency and renewable energy production in addition to urbanisation in emerging markets in particular, and a general increase in industrial automation to improve profitability• Examples of customers: Vacon (Danfoss), ABB, The Switch (Yaskawa), Metso • Examples of products: power production and electricity transmission systems, systems related to energy efficiency and process control systems, such as frequency converters, inverters, switches and automation systems• Sales to operators in this group in 2014: EUR 61,3 million (2013: 57,5)
Networks
• Key market trends: digitisation and the increasing significance of telecommunications in society as well as wireless solutions and the Industrial Internet• Examples of customers: Nokia, Ericsson, Alcatel-Lucent, Airbus, Teleste• Examples of products: broadband, communication and mobile network equipment and systems, such as base stations, exchanges and amplifiers • Sales to operators in this group in 2014: EUR 61,3 million ( 2013: 38,4)
Medtech, Life Science and Environmental Measurements
• Key market trends: population ageing, health-care needs in emerging markets and the need to predict weather phenomena as well as the monitoring of food, water and air quality • Examples of customers: Thermo Fischer Scientific, Planmeca, Vaisala• Examples of products: equipment related to health-care technology and climate and environmental monitoring, such as dental chairs, analysers, mass spectrometers and meteorological instruments• Sales to operators in this group in 2014: EUR 17,0 million in 2014 ( 2013: 4,4)
Urban Applications
• Key market trends: urbanisation, particularly in developing economies, and the increasing number of people with average income, particularly in Asia, as well as population ageing • Examples of customers: Kone, RAY, Photo-Me (KIS)• Examples of products: products and solutions related to urbanisation, such as lifts, escalators, game machines and self-service equipment • Sales to operators in this group in 2014: EUR 81,0 million (2013 81,7)
CUSTOMERS
8S C A N F I L A N N U A L R E P O R T 2 0 1 4
9S C A N F I L A N N U A L R E P O R T 2 0 1 4

BUSINESS OPERATIONS
Scanfilhasabroadserviceconcept:weoffertheentiresupplychainforcustomers’products,fromsupportingproductdesignandmanufacturingprototypestoprocuringmaterialsandcomponents,producingandtestingproductsandprovidinglogisticssolutions.
Competitive, high-quality service packages
Vertically integrated production is at the core of our manufacturing opera-tions. This means that most of the add-ed value work in the product manufac-turing chain is carried out in-house and is often centralised in one manufactur-ing location. The same plant can provide supply chain management, design and prototyping related to productisation, sheet metal mechanic components and electronics, such as assembled circuit and system boards, cable products and busbars, as well as the final assembly and testing of the product. We believe that this enables us to provide our cus-tomers with the best possible package
based on competitive pricing, fast deliv-eries, flexibility and reliable operations.
Added capacity through investments
Over the past year, Scanfil strength-ened its position in Germany by ac-quiring Schaltex Systems GmbH in Hamburg. The company – now called Scanfil GmbH – is an electronics con-tract manufacturer specialising in high-mix, low-volume production. It serves customers in the life sciences and ana-lyser markets, among other fields. The arrangement also enhances Scanfil’s growth strategy and its goal of expand-
ing its customer base in Central Europe.In 2014, Scanfil invested in production by increasing its electronics manufac-turing capacity using the latest technol-ogy in China, expanding its use of press technology in Hungary and deploying new coating technology for aluminium busbar products in Estonia. In Finland, the company invested in energy effi-ciency by renewing the air-conditioning and heating system at the Sievi plant and replacing some of the lighting with LED lights.
Training and development
During 2014, Scanfil strongly invested in Lean Six Sigma training. Lean Six Sigma is a development method for operational pro-cesses that combines the best qualities of Lean production technology and Six Sigma. Scanfil implements targeted process devel-opment and quality improvement projects to streamline its operations, create more value and reduce waste. Lean Six Sigma
10S C A N F I L A N N U A L R E P O R T 2 0 1 4
11S C A N F I L A N N U A L R E P O R T 2 0 1 4

BUSINESS OPERATIONSBUSINESS OPERATIONS
Personnel on average 2012-2014
0
500
1000
1500
2000
2012 2013 2014
Sukupuol i jakauma maitta in
0
20
40
60
80
100
naiset % miehet %
0
10
20
30
40
50
yht.naisetmiehet
KiinaUnkariViroSuomi
Keski- ikä maitta in
%
persons
Personnel on 31.12.2014
Finland
Estonia
Hungary
China
Germany
Total 1782
vuotta
KiinaUnkariViroSuomi
237
513
184
767
81
1669 16731773
Scanfil’sverticallyintegratedproductionsystem
INTEGRATION TESTING
Scanfil services
ENGINEERING PCBA
CABLE ASSEMBLY ENCLOSURE
Complete productSupply network
projects resulted in significant improve-ments in productivity in 2014. The devel-opment programme continues in 2015.At the end of 2014, Scanfil Group em-
ployed 1,782 people (1,667 in 2013), of whom 1,545 (1,426) worked in units lo-cated outside Finland. Employees outside Finland represented 87% of all employees
at the end of the year. The share of em-ployees working in China was 43%. The average number of employees at Scanfil Group was 1,773 (1,673) in 2014.
10S C A N F I L A N N U A L R E P O R T 2 0 1 4
11S C A N F I L A N N U A L R E P O R T 2 0 1 4

Sievi,Finland-sheetmetalmechanics-integration-personnel200-floorarea 26000m2
Pärnu,Estonia-sheetmetalmechanics-electronics-cableassemblies-copper/aluminium busbars,tinning-integration-personnel510-floorarea16000m2
Hamburg,Germany-integration-developmentof testprocedures-personnel80-floorarea3200m2
Budapest,Hungary-sheetmetal mechanics-integration-personnel180-floorarea16000m2
Suzhou,China-electronics-cableassemblies-integration-personnel400-floorarea21000m2
Hangzhou,China-sheetmetal mechanics-integration-personnel370-floorarea36500m2
PLANTS PLANTS
Scanfil operates globally. Factories in five countries optimize the quality and speed of production.
12S C A N F I L A N N U A L R E P O R T 2 0 1 4
13S C A N F I L A N N U A L R E P O R T 2 0 1 4

PLANTS
Scanfil operates globally. Factories in five countries optimize the quality and speed of production.
Sievi,Finland
Suzhou,China
Hangzhou,Chinaa
Budapest,Hungary
Pärnu,Estonia
Hamburg, Germany
12S C A N F I L A N N U A L R E P O R T 2 0 1 4
13S C A N F I L A N N U A L R E P O R T 2 0 1 4

BOARD OF DIRECTORS
Scanfilplc
Board of Directors
HarriTakanenChairman of the Board of Directors M.Sc. (Eng)born1968• Member of the Board of Directors since 2013• CEO of Sievi Capital plc since 1 April 2013 • CEO of Sievi Capital plc 2007–2011 and CEO of Scanfil plc and Scanfil EMS Oy 1 January 2012–31 March 2013• Chairman of the Board of Directors: Finelcomp Oy• Members of the Board of Directors: Jussi Capital Oy, Ionphase Oy, iLoq Oy• Holds 9 776 664 Scanfil plc shares (31 December 2014)
JormaJ.TakanenB.Sc. (Chemistry)born 1946• Member of the company’s Board of Directors since 2012• Founder of Sievi Capital plc and CEO during 1976 – 2005 and 2012-2013, Group CEO of Sievi Capital Group 2006 - 2011• Chairman of the Board of Directors: Foundation of Riitta and Jorma J. Takanen• Member of the Board of Directors: iLoq Ltd, Hapella Oy• Deputy member of the Board of Directors: Sievi Capital Oyj• Member of the Supervisory Board: Varma Mutual Pension Insurance Company• Holds 5,879,305 Scanfil plc shares (31 December 2013)
RiittaKotilainenB.Sc. (Eng)born 1958• Member of the company’s Board of Directors since 2013• Managing Director of E. Kotilainen Oy and Varikot Oy • Chairman of the Board of Directors: Varikot Oy• Member of the Supervisory Board: POP Sievin Osuuspankki• Holds 11 000 Scanfil Scanfil plc shares (31 December 2014)
ChristerHärkönenMSc (Eng.)born 1957• Member of Board since 2014. A full time Member of the Board and facilitator of Fibox Oy Ab. Director of Sandvik Mining and Construction in Sweden and Holland 2010-2013, RFID business Director of UPM Oyj 2005 – 2010, Executive positions in Elcoteq Oyj 1996 – 2005 • Chairman of Board of Directors: Voyantic Ltd• Member of Board of Directors: Fibox Oy Ab, Beddit Oy
JarkkoTakanenB.Sc. (Industrial Management) and a Commercial College Diploma in Management Accountancyborn 1967• Member of the company’s Board of Directors since 2012• Managing Director of Jussi Capital Oy, worked in Sievi Capital Group in different managerial duties 1995–2004, Managing Director of the Belgian subsidiary Scanfil N.V. 2003 – 2004• Member of the Board of Directors: Efore Oyj• deputy Member of the Board of Directors: Jussi Real Estate Oy, Pilot Business Park Oy• Holds 8,251,169 Scanfil plc shares (31 December 2014)
14S C A N F I L A N N U A L R E P O R T 2 0 1 4
15S C A N F I L A N N U A L R E P O R T 2 0 1 4
MANAGEMENT TEAM
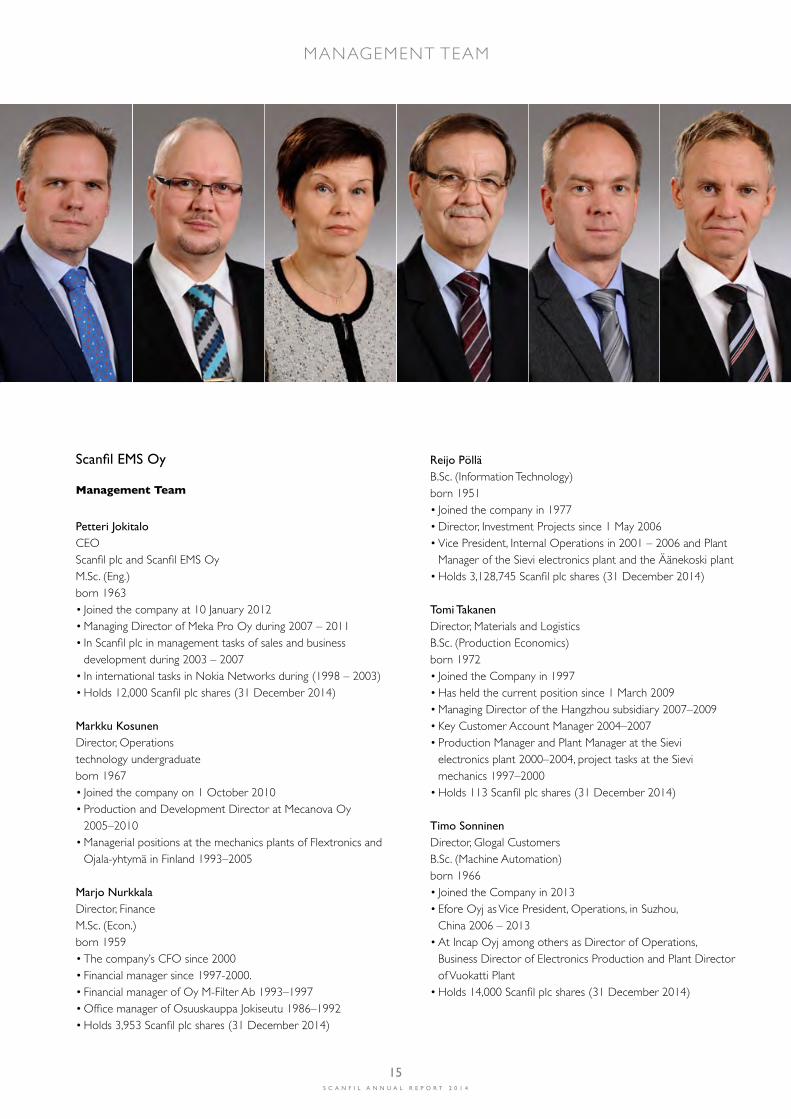
ScanfilEMSOy
Management Team
PetteriJokitaloCEOScanfil plc and Scanfil EMS Oy M.Sc. (Eng.)born 1963• Joined the company at 10 January 2012 • Managing Director of Meka Pro Oy during 2007 – 2011• In Scanfil plc in management tasks of sales and business development during 2003 – 2007• In international tasks in Nokia Networks during (1998 – 2003)• Holds 12,000 Scanfil plc shares (31 December 2014)
MarkkuKosunenDirector, Operationstechnology undergraduateborn 1967• Joined the company on 1 October 2010• Production and Development Director at Mecanova Oy 2005–2010• Managerial positions at the mechanics plants of Flextronics and Ojala-yhtymä in Finland 1993–2005
MarjoNurkkalaDirector, FinanceM.Sc. (Econ.)born 1959• The company’s CFO since 2000• Financial manager since 1997-2000.• Financial manager of Oy M-Filter Ab 1993–1997• Office manager of Osuuskauppa Jokiseutu 1986–1992• Holds 3,953 Scanfil plc shares (31 December 2014)
ReijoPölläB.Sc. (Information Technology)born 1951• Joined the company in 1977• Director, Investment Projects since 1 May 2006 • Vice President, Internal Operations in 2001 – 2006 and Plant Manager of the Sievi electronics plant and the Äänekoski plant • Holds 3,128,745 Scanfil plc shares (31 December 2014)
TomiTakanenDirector, Materials and LogisticsB.Sc. (Production Economics)born 1972• Joined the Company in 1997• Has held the current position since 1 March 2009• Managing Director of the Hangzhou subsidiary 2007–2009• Key Customer Account Manager 2004–2007• Production Manager and Plant Manager at the Sievi electronics plant 2000–2004, project tasks at the Sievi mechanics 1997–2000• Holds 113 Scanfil plc shares (31 December 2014)
TimoSonninenDirector, Glogal CustomersB.Sc. (Machine Automation)born 1966• Joined the Company in 2013• Efore Oyj as Vice President, Operations, in Suzhou, China 2006 – 2013• At Incap Oyj among others as Director of Operations, Business Director of Electronics Production and Plant Director of Vuokatti Plant• Holds 14,000 Scanfil plc shares (31 December 2014)
14S C A N F I L A N N U A L R E P O R T 2 0 1 4
15S C A N F I L A N N U A L R E P O R T 2 0 1 4
STOCK EXCHANGE RELEASES
18.12.2014 Scanfilplc’sfinancialinformationandAnnualGeneralMeetingin2015
05.11.2014 ClosureofstatutorynegotiationsatSieviplantofScanfilplc’ssubsidiaryScanfilEMSOy
29.10.2014 ScanfilGroup’sinterimreport1January–30September2014
22.10.2014 ScanfiltoadjustproductionatitsSieviplanttodemand
25.09.2014 DecisionofScanfilplc’sboardofdirectorsonstockoptionplan
15.09.2014 Scanfilplc’schangestheoutlookfortheyear2014
05.08.2014 ScanfilGroup’sinterimreport1January–30June2014
30.04.2014 ScanfilGroup’sinterimreport1January–31March2014
16S C A N F I L A N N U A L R E P O R T 2 0 1 4
17S C A N F I L A N N U A L R E P O R T 2 0 1 4

STOCK EXCHANGE RELEASES
08.04.2014 Scanfilplc’sannualgeneralmeeting,8April2014
01.04.2014 ScanfilEMSOyacquiresschaltexsystemsGmbH
21.03.2014 Scanfilplc’sannualreport,financialstatementsandcorporategovernancestatementhavebeenpublished
11.03.2014 NoticetotheAnnualGenerelMeeting11.03.2014
10.03.2014 Correction:ScanfilGroup’sfinancialstatementsforfinancialperiod1January-31December2013
25.02.2014 ScanfilGroup’sfinancialstatementsfor1January–31December2013
24.02.2014 TuomoLähdesmäkiresingsfromtheBoardofDirectorsofScanfilplc
16S C A N F I L A N N U A L R E P O R T 2 0 1 4
17S C A N F I L A N N U A L R E P O R T 2 0 1 4

Scanfil plc is a listed (NASDAQ OMX Helsinki, SCL1V) interna-tional contract manufacturer and system supplier. The company has nearly 40 years of experience in demanding contract manu-facturing. It is headquartered in Sievi, Finland. Scanfil has produc-tion operations in Finland, China, Germany, Hungary and Estonia. The key elements of Scanfil’s operations include a vertical-ly integrated production system and the provision of services and supply chain management to customers over the entire life cycle of the product. Its customers include international operators in the automation, energy, data transmission and health technology sectors, among other industries, and com-panies operating in fields related to urbanisation.
Groupstructure
Scanfil Group is comprised of the parent company Scanfil plc and a subgroup called Scanfil EMS Oy, which is engaged in contract manufacturing. Scanfil EMS Oy’s subsidiaries are the Chinese subsidiaries Scanfil (Suzhou) Co., Ltd. and Scanfil (Hangzhou) Co., Ltd., the Hungarian subsidiaries Scanfil Kft. (Budapest) and Rozália Invest Kft. (Budapest), German subsidiary Scanfil GmbH (Hamburg) as well as the Estonia-based Scanfil Oü (Pärnu). The Group’s share of ownership in all of its subsidiaries is 100%. Scanfil EMS Group also includes the associated company Greenpoint Oy (holding 40%).
Year 2014
Its full-year turnover increased by nearly 14% to EUR 214.5 million, and its full-year operating profit was EUR 16.2 million, or 7.6% of turnover. In addition to organic growth, its turn-over increased as a result of the acquisition of the German contract manufacturer Schaltex Systems GmbH (now Scanfil GmbH) in early April. The growth of Scanfil’s operating profit was driven by increased turnover and successful productivity improvement and cost control as well as other development measures, such as the deployment of a new ERP system. Scanfil has actively expanded its customer base to cover various industries, which serves to reduce cyclical fluctuations. During the review period, Scanfil strengthened its position in Germany by acquiring Schaltex Systems GmbH in Ham-burg. The company is an electronics contract manufacturer
specialising in high-mix, low-volume production. It serves cus-tomers in the life sciences and analyser markets, among other fields. The arrangement enhances Scanfil’s growth strategy and goal of expanding its customer base in Central Europe. Statutory employee negotiations were launched at the Sievi plant of Scanfil EMS Oy, a subsidiary of Scanfil Oyj, in the fourth quarter of 2014. During the negotiations, decisions were made on temporary lay-offs in January–April 2015.
Financialdevelopment
The Group’s turnover for January–December was EUR 214.5 million (188.5), representing an increase of 13.8% from the previous year. The breakdown of turnover by regional segment was as follows: Europe 60% (58%) and Asia 40% (42%). Operating profit for the Group during the review period was EUR 16.2 (11.8) million, representing 7.6% (6.3%) of turn-over. Earnings for the review period amounted to EUR 12.3 (8.2) million. Earnings per share were EUR 0.21 (0.14) and return on investment was 16.5% (11.4%).
Financingandcapitalexpenditure
The Group’s financial position continued to improve during 2014 and remains strong. The consolidated balance sheet to-talled EUR 134.0 (125.6) million. Liabilities amounted to EUR 39.4 (45.1) million, EUR 30.1 (26.8) million of which were non-interest-bearing and EUR 9.3 (18.3) million interest-bear-ing. The equity ratio was 70.6% (64.1%) and gearing -10.5% (-12.2%). The equity per share was EUR 1.64 (1.39). Liquid cash assets totalled EUR 19.2 (28.2) million. Its cash flow from operating activities for the review period was EUR 11.0 million (13.2) positive. The change in working capital during the review period was EUR -5.2 mil-lion (-0.6). A total of EUR 47.1 million (35.6) was tied up in net working capital at the end of the year. Net working capital increased as a result of business growth and the acquisition of a subsidiary. Cash flow from investing activities was EUR -8.0 million (+5.8), of which EUR 5.8 million is related to the acqui-sition of a subsidiary in 2014. In 2013, EUR 9.8 million of the investments were related to the maturing of a deposit with a maturity of more than three months, which was classified as an investment. Cash flow from financing activities was EUR
REPORT OF BOARD OF DIRECTORS 2014
18S C A N F I L A N N U A L R E P O R T 2 0 1 4
19S C A N F I L A N N U A L R E P O R T 2 0 1 4

-13.0 million (-11.2). This includes the payment of dividends, loan repayments and the use of a bank credit facility. Gross investments in January – December in fixed assets totalled EUR 8.2 (4.0) million, which is 3.8% (2.1%) of turno-ver. Investments include an acquisition cost of EUR 5.8 million related to the shares of Schaltex Systems GmbH. Other in-vestments were mainly related to the acquisition of machinery and equipment. Depreciation totalled EUR 4.6 million (4.4).
BoardofDirectors’authorisation
The Extraordinary General Meeting on 19 April 2012 au-thorised the Board of Directors to decide on the transfer of treasury shares in accordance with the Board’s proposals. The authorisation is valid for three years. The Annual General Meeting on 18 April 2013 author-ised the Board of Directors to decide on the issuance of op-tion rights to certain key employees of the company and its subsidiaries. The maximum total number of option rights is 750,000, and they entitle the key employees to subscribe for a maximum of 750,000 of the company’s new shares or shares in its possession. The Annual General Meeting on 8 April 2014 authorised the Board of Directors to decide on the acquisition of treas-ury shares with distributable funds. The authorisation is valid for 18 months. The Board of Directors has no existing share issue au-thorisations or authorisations to issue convertible bonds with warrants.
Optionschemes
Based on the authorisation by the General Meeting, the Board of Directors of Scanfil plc decided on 25 September 2014 to grant the CEO and the CFO of Scanfil plc and three key persons at the Company’s subsidiary Scanfil EMS Oy option rights for 225,000 shares.
Ownshares
The company does not own its own shares.
Personnel
At the end of the financial year, the Group employed 1,782 (1,667) people, of whom 1,545 (1,426) in the company’s units outside Finland. The proportion of employees working in Chi-na was 43% (46%) at the end of the year. In all, 87% (86%) of the Group’s personnel were employed by subsidiaries outside Finland on 31 December 2014. Scanfil Group’s personnel aver-aged 1,773 (1,673) employees during the review period.
Personnel by country on 31 December 2014:Finland 237, Estonia 513, Hungary 184, China 767 and Ger-many 81.
Sharetradingandshareperformance
The highest trading price during the year was EUR 2.74 and the lowest EUR 1.30, the closing price for the period standing at EUR 2.46. A total of 5,131,328 shares were traded dur-ing the period, corresponding to 8.9% of the total number of shares. The market value of the shares on 31 December 2014 was EUR 142,0 million.
TheBoardofDirectorsandCEO
Scanfil plc’s Annual General Meeting held on 8 April 2014 elected the following Board members:Jorma J. Takanen, Riitta Kotilainen, Jarkko Takanen, Christer Härkönen ja Harri Takanen. At its organizing meeting held on 8 April 2014 the new Board of Directors elected Harri Takanen as the Chairman of the Board of Directors
M.Sc. (Eng) Petteri Jokitalo has acted as the company’s CEO during 1 Jaunary – 31 December 2014.
Riskmanagement
The Board of Directors of Scanfil plc is responsible for ensur-ing the appropriate organisation of the Group’s risk manage-ment and internal control and audit.
REPORT OF BOARD OF DIRECTORS 2014
18S C A N F I L A N N U A L R E P O R T 2 0 1 4
19S C A N F I L A N N U A L R E P O R T 2 0 1 4

Risk management is based on a risk management policy ap-proved by the Board, aiming to manage risks in a comprehen-sive and proactive manner. The assessment of risks is part of the strategy and business planning process. There is no separate risk management organisation; risk management is incorporated into the business processes and the management system. Risk management aims to observe and analyse factors that might have a negative impact on the achievement of the company’s goals and to take measures to mitigate or completely eliminate the risks. The operative units report on business risks in accord-ance with the management and reporting system. A weakening of the global economy and a decrease in the international demand for capital goods could have a negative effect on the development of the business operations of Scan-fil’s customers and could subsequently reduce demand in the contract manufacturing market. In addition, Scanfil is exposed to risks resulting from exchange rate fluctuations in its busi-ness operations. For a description of financial risk management in the Scan-fil Group, please refer to note 29 to the consolidated financial statements. Risks and risk management are described in greater detail on the company’s website under Corporate Governance and the Corporate Governance Statement at www.scanfil.com.
Researchanddevelopment
Owing to the nature of the company’s business, product de-velopment was mainly in cooperation with customers and Scanfil’s in-house product development program was not a significant part of the company’s cost structure.
Qualityandenvironment
Year 2014 Scanfil (Suzhou) receive Occupational health and safety OHSAS 18001 management system certificate. New certified system fulfills existing ISO 9001 and ISO 14001 man-agement system family. OHSAS 18001 system helps Scanfil improve health and safety performance. OHSAS 18001 sys-tem development will continue at Asia at coming year. Scanfil advanced manufacturing technologies, new ways of operating and early involvement at customer design phase
ensure high quality, cost effective and environmentally-friendly way of manufacturing throughout the product life cycle. Scanfil drives responsible management of environmental issues by evaluating environmental aspects and creating envi-ronment program yearly basis in order to reduce the amount environmental impact and usage of non-renewable resources.
Boardofdirector’sproposalstotheAnnualGeneralMeeting
Scanfi plc’s Annual General Meeting will be held on 8 April 2015 at the company’s head office in Sievi, Finland.
Dividend for 2014The parent company’s distributable funds are 14,873,027.32 EUR. The Board of Directors proposes to the Annual General Meet-ing that a dividend of EUR 0.07 be paid from the unrestricted shareholders’ equity per share, for a total of EUR 4,041,130.73. The dividend matching day is 10 April 2015. The dividend will be paid to those shareholders who, on the matching day, are entered in the Company’s Register of Shareholders, kept by Euroclear Fin-land Ltd. The dividend payment day is 17 April 2015. No significant changes have taken place in the company’s financial position since the end of the financial year. In the view of the Board of Directors, the proposed dividend pay-out will not put the company’s liquidity at risk.
Futureprospects
Scanfil expects its turnover to increase by 2–8% in 2015. This growth in turnover will come in the second half of the year. The company is expecting its turnover to decrease slightly in the first half of the year, and particularly in the second quarter, compared to 2014. Its operating profit before non-recurring items for 2015 is expected to be EUR 12–17 million.
CorporateGovernanceStatement
The Corporate Governance Statement is provided as a sep-arate report and published in conjunction with the financial statements.
REPORT OF BOARD OF DIRECTORS 2014
20S C A N F I L A N N U A L R E P O R T 2 0 1 4
21S C A N F I L A N N U A L R E P O R T 2 0 1 4

CONSOLIDATED INCOME STATEMENT, IFRS 1000 EUR Note 1.1.-31.12.2014 1.1.-31.12.2013 Turnover 1 214 507 188 514 Other operating income 2 298 294Changes in inventories of finished goods and work in progress -194 1 248Manufacturing for own use 4 Use of materials and supplies 3 -144 062 -130 950Employee benefit expenses 4 -32 081 -26 969Depreciation and amortization 5 -4 636 -4 418Other operating expenses 6 -17 627 -15 886 Operatingprofit 16205 11838 Financial income 7 549 583Financial expense 8 -849 -1 230Share of profit or loss of associates -577 Profitbeforetax 15905 10614 Income tax 9 -3 607 -2 379 Netprofitfortheperiod 12298 8235 Attributable to: Shareholders of the parent company undiluted and diluted earnings per share 10 0,21 0,14 CONSOLIDATED STATEMENT OF COMPREHENSIVE INCOME Netprofitfortheperiod 12298 8235 Othercomprehensiveincome,netoftax Items that may later be recognized in profit or loss Translation differences 4 628 -722 Derivative Financial Instrument 117 273Other comprehensive income, net of tax 4 745 -449 Totalcomprehensiveincome 17043 7786
CONSOLIDATED INCOME STATEMENT, IFRS
20S C A N F I L A N N U A L R E P O R T 2 0 1 4
21S C A N F I L A N N U A L R E P O R T 2 0 1 4
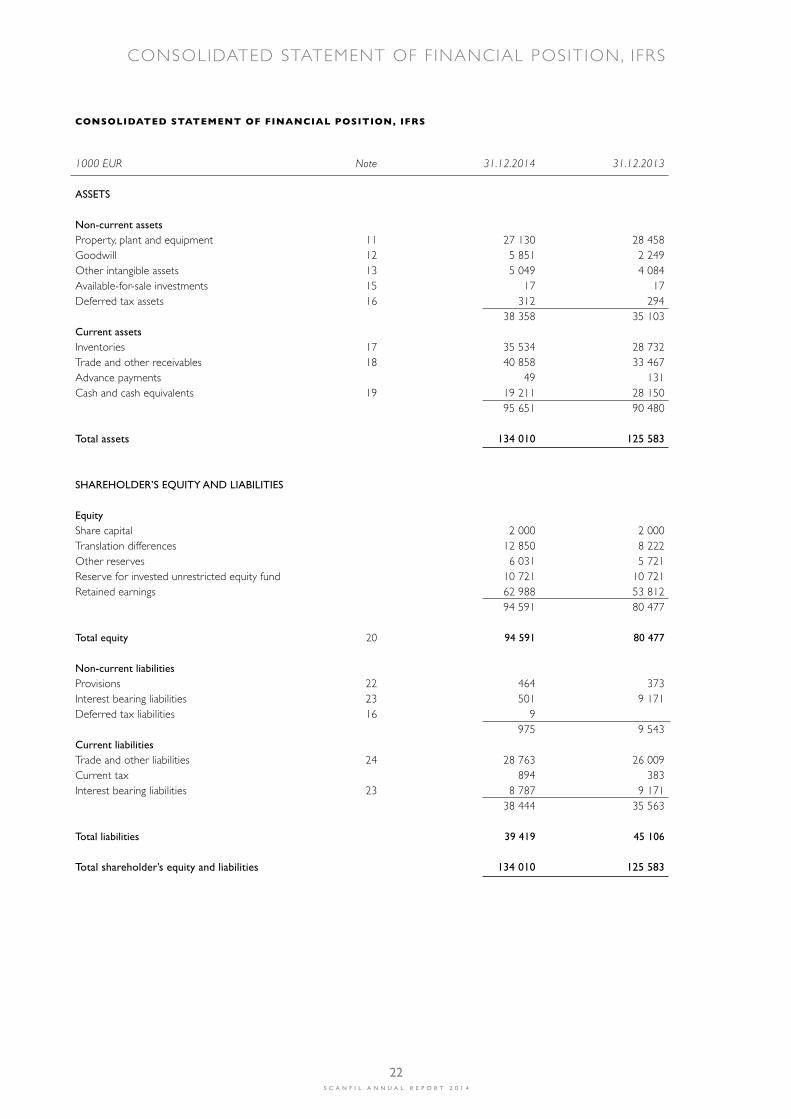
CONSOLIDATED STATEMENT OF FINANCIAL POSITION, IFRS 1000 EUR Note 31.12.2014 31.12.2013
ASSETS
Non-currentassets Property, plant and equipment 11 27 130 28 458Goodwill 12 5 851 2 249Other intangible assets 13 5 049 4 084Available-for-sale investments 15 17 17Deferred tax assets 16 312 294 38 358 35 103Currentassets Inventories 17 35 534 28 732Trade and other receivables 18 40 858 33 467Advance payments 49 131Cash and cash equivalents 19 19 211 28 150 95 651 90 480 Totalassets 134010 125583
SHAREHOLDER’SEQUITYANDLIABILITIES Equity Share capital 2 000 2 000Translation differences 12 850 8 222Other reserves 6 031 5 721Reserve for invested unrestricted equity fund 10 721 10 721Retained earnings 62 988 53 812 94 591 80 477 Totalequity 20 94 591 80 477 Non-currentliabilities Provisions 22 464 373Interest bearing liabilities 23 501 9 171Deferred tax liabilities 16 9 975 9 543Currentliabilities Trade and other liabilities 24 28 763 26 009Current tax 894 383Interest bearing liabilities 23 8 787 9 171 38 444 35 563
Totalliabilities 39419 45106 Totalshareholder’sequityandliabilities 134010 125583
CONSOLIDATED STATEMENT OF F INANCIAL POSITION, IFRS
22S C A N F I L A N N U A L R E P O R T 2 0 1 4
23S C A N F I L A N N U A L R E P O R T 2 0 1 4

CONSOLIDATED C ASH FLOW STATEMENT, IFRS
CONSOLIDATED CASH FLOw STATEMENT, IFRS
1000 EUR Note 1.1.-31.12.2014 1.1.-31.12.2013 Cashflowfromoperatingactivities Net profit 12 298 8 235Adjustments for the net profit 25 7 456 8 160Change in net working capital 25 -5 225 -560Paid interests and other financial expenses -405 -601Interest received 161 492Taxes paid -3 332 -2 504Netcashfromoperatingactivities 10953 13222 Cashflowfrominvestingactivities The acquisition of a subsidiary less cashand cash equivalents at the time of acquisition 33 -5 756 Investments in tangible and intangible assets -2 335 -4 216Sale of tangible and intangible assets 71 177Purchase of investments -1Proceeds from other investments 9 790 Capital transfer tax refund 54 Repayment of granted loans 34Netcashfrominvestingactivities -8021 5838 Cashflowfromfinancingactivities Repayment of long-term loans -10 530 -8 889Proceeds from long-term loans 407 Paid dividends -2 887 -2 309Netcashfromfinancingactivities -13010 -11198 Netincrease/decreaseincashandcashequivalents -10078 7862Cash and cash equivalents at beginning of period 28 150 20 472Changes in exchange rates 1 138 -184Cashandcashequivalentsatendofperiod 19 19 211 28 150
22S C A N F I L A N N U A L R E P O R T 2 0 1 4
23S C A N F I L A N N U A L R E P O R T 2 0 1 4

STATEMENT OF CHANGES IN EQUITY, IFRS
EquITy ATTRIBuTABLE TO EquITy HOLDERS OF THE PARENT COMPANy
Share Share premium Other Translation Retained Equity 1000 EUR capital account reserves differences earnings total
Equity1.1.2014 2000 10721 5721 8222 53812 80477 Comprehensiveincome Net profit for the period 12 298 12 298Other comprehensive income, net of tax Translation differences 4 628 4 628 Derivative Financial Instrument 117 117Totalcomprehensiveincome 117 4628 12298 17043Fund transfer 194 -194 0Option scheme -42 -42Paid dividends -2 887 -2 887Equity31.12.2014 2000 10721 6031 12850 62988 94591 Equity1.1.2013 2000 10721 5342 8944 47999 75007
Comprehensiveincome Net profit for the period 8 235 8 235Other comprehensive income, net of tax Translation differences -722 -722 Derivative Financial Instrument 273 273Totalcomprehensiveincome 273 -722 8235 7786Fund transfer 106 -106 0Option scheme -6 -6Paid dividends -2 309 -2 309Equity31.12.2013 2000 10721 5721 8222 53812 80477
ACCOUNTING PRINCIPLES FOR CONSOLIDATED FINANCIAL STATEMENTS
24S C A N F I L A N N U A L R E P O R T 2 0 1 4
25S C A N F I L A N N U A L R E P O R T 2 0 1 4
Basic information of the Group
Scanfil plc is a Finland-based public limited company domi-ciled in Sievi. The parent company Scanfil plc and the sub-group Scanfil EMS Oy make up the Scanfil Group (here-inafter ‘Scanfil’ or ‘the Group’). The shares of the parent company Scanfil plc have been quoted on the Main List of the NASDAQ OMX Helsinki since 2 January 2012. Scanfil Group is an international contract manufacturer for the telecommunications and professional electronics industries, with more than 35 years of experience in de-manding contract manufacturing operations. The company is a systems supplier that offers its products and services to international telecommunications systems and profes-sional electronics manufacturers. Typical products include equipment systems for mobile and telecommunications networks, automation systems, frequency transformers, lift control systems, equipment and systems for electricity production and transmission, analysers, slot machines and different meteorological instruments. The company has production facilities in China, Estonia, Hungary, German and Finland.
General
Scanfil’s consolidated financial statements have been pre-pared in accordance with International Financial Reporting Standards (IFRS), applying the IAS and IFRS standards ef-fective on 31 December 2014 as well as the SIC and IFRIC interpretations. “IFRS” refers to the standards and their in-terpretations in the Finnish Accounting Act and the provi-sions issued thereunder in accordance with the Regulation (EC) No 1606/2002 of the European Parliament and of the Council on the application of international accounting standards within the Community. The notes to the consoli-dated financial statements are also in compliance with Finn-ish accounting and corporate legislation. The financial statements are presented in thousands of euros, and the information is based on historical costs un-less otherwise stated in the accounting principles. Individual figures and totals shown in the financial state-ments have been rounded to the nearest thousand euros, which is why individual figures do not always add up to the totals.
Principles of consolidation
SubsidiariesSubsidiaries are companies controlled by the Group. Con-trol emerges when the Group holds more than one half of the votes or otherwise has control. The Group has con-trolling interest in an entity when it has the right and abil-ity to control significant operations in the entity and when it is exposed to or has the right to variable returns from the entity through its power over the entity. The existence of potential voting rights is also taken into account when estimating the criteria for control when the instruments entitling to potential voting rights can be realized at the time of the assessment.
Intra-group shareholdings have been eliminated using the acquisition cost method. Consideration transferred and the identifiable assets and assumed liabilities of the acquired company are measured at fair value at the time of the ac-quisition. Acquisition-related expenses, apar t from expens-es related to the issue of debt or equity securities, have been recorded as expenses. Consideration transferred does not include business operations handled separately from the acquisition. Their impact has been taken into ac-count in connection with the acquisition through profit or loss. Any conditional additional purchase price is measured at fair value at the time of the acquisition and classified as either debt or equity. Additional purchase price classified as debt is measured at fair value at the balance sheet date of each repor ting period, and the resulting profit or loss is recognised through profit or loss. Additional purchase price classified as equity is not re-valued. Acquired subsidiaries are consolidated from the mo-ment the Group has gained control, and divested subsidi-aries until control ceases to exist. All intra-group trans-actions, receivables, liabilities and unrealised gains and internal profit distribution are eliminated upon preparing the consolidated financial statements. Unrealised losses are not eliminated when the loss is due to impairment. Share-holders’ equity attributable to non-controlling interest is presented as a separate item under shareholders’ equity in the balance sheet. Currently there are no non-controlling shareholders in the Group. Should the Group lose control of a subsidiary, the remaining holding is measured at fair value on the date of losing control, and the resulting dif-ference is recognised through profit or loss. Acquisitions made prior to 1 January 2010 are handled in accordance with the regulations effective at the time.
AssociatedcompaniesAssociated companies are companies over which the Group exercises considerable influence. As a rule, con-siderable influence emerges when the Group holds more than 20% of votes in the company or the Group other-wise has considerable influence, but not control. Associ-ated companies are consolidated in the consolidated fi-nancial statements using the equity method. If the Group’s share of the losses of an associated company exceeds the carrying amount of the investment, the investment is recorded on the balance sheet at zero value and losses exceeding the carrying amount are not consolidated un-less the Group has committed to fulfilling the associated companies’ obligations. An investment in an associated company includes the goodwill resulting from its acquisi-tion. The propor tion of the associated companies’ results for the period based on the Group’s holding is presented as a separate item after operating profit. Correspondingly, the Group’s propor tion of changes recognised under the associated company’s other comprehensive income is rec-ognised under the Group’s other comprehensive income. The Group’s associated company did not have such items.
ACCOUNTING PRINCIPLES FOR CONSOLIDATED FINANCIAL STATEMENTS
24S C A N F I L A N N U A L R E P O R T 2 0 1 4
25S C A N F I L A N N U A L R E P O R T 2 0 1 4

ACCOUNTING PRINCIPLES FOR CONSOLIDATED FINANCIAL STATEMENTS
Transactions in foreign currencies
The figures concerning the result and financial position of Group units are measured in the currency that is the currency of each unit’s main operating environment (the operating currency). The consolidated financial statements are presented in euros, which is the operating and repor t-ing currency of the Group’s parent company. Foreign currency-denominated transactions are re-corded in the operating currency using the foreign ex-change rates on the transaction date. In practice, a rate that is sufficiently close to the rate of the transaction date is often used. The resulting exchange rate differences have been included in the net profit or loss. Foreign exchange gains and losses are handled as adjustments on sales and purchases. Rate differences in financing are presented as net amounts under financial income and expenses. In the consolidated financial statements, the income statements of foreign Group companies are translated into euros using the average annual rates published by the Eu-ropean Central Bank, calculated on the basis of end-of-month rates. The companies’ balance sheets are translated into euros using the rates in force on the date of the finan-cial statements. Translation differences owing to the different exchange rates used in the income statement and balance sheet as well as translation differences attributable to the use of the acquisition cost method and equity balances accrued after the acquisition have been recorded in Group equity, and the change in translation difference is presented in the statement of comprehensive income.
Revenue recognition
Revenue arising from the sale of goods is recognised when the significant risks and rewards of ownership, right of pos-session and actual control of the products sold have been transferred to the buyer. Exchange rate gains and losses re-lated to the sales as well as any cash discounts have been entered as adjustment items on sales. The delivery costs of goods sold are included in other operating expenses. Interest income is recognised on an accrual basis and dividend income when the right to a dividend has emerged.
Government grants
Government grants related to tangible and intangible as-sets are deducted from an asset’s acquisition cost, and the net acquisition cost is capitalised on the balance sheet. Other economic assistance is recognised as income within other operating income.
Business segments
The Group’s repor ting is based on the business segments Asia and Europe.
Employee benefits
Post-employmentbenefitsThe Group has different kinds of pension arrangements according to local practices. The statutory pension cover of the Group’s Finnish employees is provided through in-surance policies. Foreign subsidiaries have arranged the pension cover of their employees in accordance with local legislation. The pension cover of the Group’s employees is provid-ed through external pension insurance companies. Pension expenses are recognised as expenses for the year during which they are accrued. The Group does not have defined-benefit schemes in use.Share-basedpaymentsThe Group has an option scheme in use. Option rights are valued at their fair value at the time they were granted and recognised as an expense in the income statement under employee benefits in equal por tions during the vesting pe-riod. The expense defined at the time the options were granted is based on the Group’s estimate of the amount of options assumed to be vested at the end of the vesting period The fair value of options has been defined based on the Black-Scholes pricing model. Assumptions concerning the final amount of options are updated on each repor t-ing date. Changes in the estimates are recognised in profit or loss. When option rights are exercised, proceeds from share subscriptions, adjusted with potential transaction costs, are entered under equity.
Leases
A lease is classified as a finance lease if it substantially transfers the risks and rewards incidental to ownership to the Group. Assets acquired through finance leases are re-corded in the consolidated balance sheet under assets and liabilities. Their depreciation is performed in the same way as for owned assets. Finance lease payments are recorded as financial expenses and reduction in liability. Leases where the risks and rewards incidental to own-ership remain with the lessor are processed as other leas-es, and the leases are recognised in the income statement as expenses over the lease period.
Property, plant and equipment
The main items included in this category are buildings, ma-chinery, equipment, fixtures and fittings. They are stated in the balance sheet at historical cost less depreciation and any impairment losses. Depreciation is calculated from his-torical cost on a straight-line basis over the expected use-ful lives of the assets. The assets’ residual values and useful lives are reviewed annually and adjusted, if appropriate, to indicate changes in expected economic benefits. An item of proper ty, plant and equipment will no long-er be depreciated when such an item is considered as be-
26S C A N F I L A N N U A L R E P O R T 2 0 1 4
27S C A N F I L A N N U A L R E P O R T 2 0 1 4

ACCOUNTING PRINCIPLES FOR CONSOLIDATED FINANCIAL STATEMENTS
ing held for sale in accordance with IFRS 5 Non-current Assets Held for Sale and Discontinued Operations.
The depreciation periods are:
Buildings and structures 10 – 25 Machines and equipment 3 – 10 Other tangible assets 5 – 10
Goodwill and other intangible assets
GoodwillGoodwill arising in the consolidation of business opera-tions is measured at the amount by which the considera-tion transferred, non-controlling interest in the target of acquisition and previous holding combined exceed the Group’s propor tion of the fair value of the acquired net assets. Acquisitions that have taken place between 1 Janu-ary 2004 and 31 December 2009 have been recognised in accordance with the previous IFRS standards (IFRS 3 (2004)). Goodwill arising from the consolidation of busi-ness operations prior to 2004 corresponds to the carry-ing amount pursuant to the previous standards on financial statements, used as the deemed cost pursuant to IFRS. The acquisition completed in 2014 is recognised in accord-ance with IFRS 3 (2009) as it stands. No depreciation is recorded for goodwill and other intangible assets with un-limited financial useful lives, but they are tested annually for impairment. For this purpose, goodwill is allocated to cash-generating units, or in the case of associated com-panies, goodwill is included in the acquisition cost of the associated company in question. Goodwill is measured at historical cost less impairment.
ResearchanddevelopmentcostsResearch and development costs are recognised as ex-penses through profit or loss. Development costs as per IAS 38 Intangible Assets are capitalised and amor tised over their useful lives. The Group has no capitalised devel-opment costs.
OtherintangibleassetsIntangible assets are recorded at historical cost on the bal-ance sheet if the cost can be reliably determined and it is likely that the financial benefit from the asset is beneficial to the Group. Intangible assets are recorded using straight-line depreciation on the income statement within their es-timated useful life. Other intangible assets include software’s and the land use right of the subsidiaries in China. The depreciation pe-riod for intangible assets is 5–10 years, except for the land use right in China, for which it is 50 years.
Impairment of tangible and intangible assets
The Group’s operations have been divided into cash-gen-erating units (CGU) which are smaller than segments. The
need for impairment is assessed regularly at the CGU lev-el. The impairment test is conducted for the lowest CGU that is largely independent of other units and whose cash flows can be separated from other cash flows. To determine the need for impairment of assets, the capital employed by the unit is compared against the dis-counted future cash flows expected to be derived from the unit or against the net selling price, whichever is higher. An impairment loss is recorded when the carrying amount of an asset exceeds its recoverable amount. Impairment losses are recognised in the income statement. If the im-pairment loss is related to a cash-generating unit, it is first allocated to reduce the goodwill allocated to the cash-generating unit and thereafter to reduce the other asset items of the unit pro rata. An impairment loss related to proper ty, plant and equipment and other intangible as-sets, excluding goodwill, is reversed if there has been a change in the estimates used to determine the recover-able amount. An impairment loss is reversed only to the extent that the asset’s carrying amount does not exceed the carrying amount that would have been determined, net of depreciation, if no impairment loss had been recog-nised. An impairment loss for goodwill is not reversed.
Non-current assets held for sale and discontinued operations
The assets and liabilities of major operations that have been sold or are classified as held for sale or to be discontinued are presented separately in the balance sheet. The net op-erating result for discontinued operations and the net result arising from their sale or discontinuation are shown in the income statement separately from the profit or loss for con-tinued operations. Non-current assets classified as held for sale or groups of assets to be disposed of are measured at the lower of carrying amount and fair value less costs to sell.
Inventories
Inventories are stated at the lower of cost and net realis-able value. Cost is determined on a weighted-average basis. The cost of finished goods and work in progress includes raw materials, direct labour costs and other direct expenses and proportion of fixed costs. The net realisable value is the estimated selling price less sale-related costs.
Financial assets and liabilities
The Group’s financial assets are classified according to IAS 39 into the following classes: financial assets at fair value through profit or loss, investments held to maturity, loans and other receivables, and available-for-sale financial assets. The classification is made in connection with the initial ac-quisition according to the purpose of use of the financial assets. Financialassetsatfairvaluethroughprofitorloss in-clude financial assets acquired to be held for trading or clas-sified as items recognised at fair value during initial recogni-
26S C A N F I L A N N U A L R E P O R T 2 0 1 4
27S C A N F I L A N N U A L R E P O R T 2 0 1 4

ACCOUNTING PRINCIPLES FOR CONSOLIDATED FINANCIAL STATEMENTS
tion. The Group did not have any financial assets at fair value through profit or loss during the financial period 2014. Investmentsheldtomaturity are financial assets not in-cluded in derivative assets for which the payments are fixed or can be determined, which mature at a certain date and which the Group has a firm intention and ability to hold until the maturity date. They are valued at amortised cost using the effective interest method. The Group did not have any in-vestments held to maturity during the financial period 2014. Loans andother receivables are assets not included in derivative assets for which the payments are fixed or can be determined and which are not quoted in an ac-tive market. This entry includes sales and other receiva-bles. Accounts receivable are measured at cost less any impairment losses. The amount of uncer tain receivables is evaluated on a case-by-case basis. Impairment losses are recorded as expenses in the income statement. Loans and other receivables also include time deposits with maturity exceeding three months. Time deposits are valued at am-or tised cost using the effective interest method. Available-for-sale financial assets are assets not in-cluded in derivative assets specifically classified in this group, or not classified in any other group. Available-for-sale financial assets consist of shares. Quoted shares are measured at fair value, which is the market price of the date of the financial statement. Changes in fair value are recognised under other comprehensive income and pre-sented in the fair value reserve included in “Other re-serves” under equity with tax consequence considered until the investment is traded or otherwise transferred, at which point the changes in fair value are recorded in the income statement. If the impairment of a share is deter-mined, the change included in the fair value reserve will be transferred to be recognised through profit or loss. In-vestments in non-quoted shares are stated at the lower of historical cost and probable realisable value because their fair values cannot be determined reliably. On the date of the financial statements, the Group’s financial assets are evaluated to see if there are indications that the value of any of the assets might be impaired. Cash and cash equivalents include cash at bank and in hand as well as shor t-term bank deposits, which can easily be exchanged for an amount known in advance and for which there is little risk of changes in value. Items classified as cash and cash equivalents have a maximum maturity of three months from the time of acquisition. Cash and cash equivalents are classified in the group “Loans and other receivables”, and they are presented at amortised cost on the balance sheet. TheGroup’sfinancial liabilities are recognised at am-or tised cost.
Derivative financial instruments and hedge accounting
Derivative financial instruments are initially recognised in accounting with the fair value on the date when the Group
becomes a par ty to the related contract and later fur ther valued at fair value. For derivative financial instruments for which hedge accounting is not applied, changes in value are immediately recognised in profit or loss. For derivative financial instruments for which hedge accounting is applied and which are considered effective hedging instruments, the impact on the result of changes in value is presented according to the hedge accounting model employed. The Group applies cash flow hedge accounting for the interest rate and currency swap used to hedge the variable-rate loan in SEK. When initiating hedge account-ing, the Group documents the relationship between the hedged item and the hedging instruments, together with the Group’s risk management objectives and hedging strategy. When initiating hedging and at least every time when preparing financial statements and interim financial statements, the Group documents and evaluates the ef-fectiveness of the hedging relationships by examining the ability of the hedging instrument to negate changes in the fair value or cash flows of the hedged item. Any change in the fair value of the effective por tion of derivative fi-nancial instruments fulfilling the conditions of a cash flow hedge is recognised under other comprehensive income and presented in equity hedging reserve with tax conse-quence considered (included in “Other reserves”). Profits and losses accumulated from the hedging instrument to equity are recognised in profit or loss when the hedged item affects profit or loss. In addition, the Group has forward exchange contracts for purposes other than hedging. Changes in the fair values of these contracts are recognised through profit or loss.
Provisions
A provision is recognised when a past event has created an obligation that will probably be realised and when the amount of the obligation can be estimated reliably.
Income taxes and deferred taxes
The taxes of the consolidated income statement include taxes based on the results of the Group companies and calculated in accordance with local tax laws and tax rates. The taxes in the income statement also include the change in deferred tax assets and liabilities. Deferred tax assets or liabilities are calculated on tem-porary differences between taxation and financial state-ments and differences due to Group eliminations based on tax rates for the following year confirmed by the repor ting date. Temporary differences arise from intercompany prof-its on inventories, depreciation differences and provisions, among others. Deferred tax liabilities are recognised in full. Deferred tax assets are recognised only when it is probable that the assets can be utilised against the taxable profit of future financial periods.
28S C A N F I L A N N U A L R E P O R T 2 0 1 4
29S C A N F I L A N N U A L R E P O R T 2 0 1 4

ACCOUNTING PRINCIPLES FOR CONSOLIDATED FINANCIAL STATEMENTS
Operating profit
IAS 1 Presentation of Financial Statements does not speci-fy the concept of operating profit. The Group has defined it as follows: operating profit is the net sum of turnover plus other operating income less acquisition costs adjust-ed for the change in inventories of finished goods and work in progress as well as costs arising from production for own use, less employee benefit expenses, deprecia-tion and any impairment losses and other operating ex-penses. All of the items in the income statement apar t from those specified above are presented under operat-ing profit. Exchange rate differences are included in the operating profit if they arise from operations-related items; otherwise, they are recognised in financial items.
Dividend
The dividend proposed to the Annual General Meeting by the Board of Directors has not been deducted from dis-tributable equity prior to the AGM’s approval.
use of estimates
The preparation of financial statements in accordance with international accounting standards requires the company’s management to make estimates and assumptions that af-fect the contents of the financial statements. The estimates and assumptions made are based on previous experience and assumptions, which in turn are based on the circum-stances prevailing at the time the financial statements are prepared and future prospects. Even though the estimates are based on the most recent information available and the management’s best judgment, the actual outcome may differ from the estimates. The following lists the most significant items that re-quire the management’s assessment. The Group annually performs testing for impairment of goodwill and other intangible rights. The recoverable amounts for cash-generating units have been determined with calculations based on value in use. These calculations require the use of estimates from the management. More information on impairment testing of goodwill is available in Note 12, “Goodwill”. Potential obsolescence included in the value of inven-tories is regularly examined and, if necessary, the value of inventories is depreciated to match their net realisable value. These examinations require estimates on the future demand for products.
Estimates are also required when assessing the amount of provisions associated with business operations. Note 22, “Provisions”, presents the provisions made within the Group.
New and amended standards applied during the financial year
Scanfil Group has observed the following new and amend-ed standards from the beginning of 2014:
• IFRS 10 Consolidated Financial Statements and its amendments
• IFRS 11 Joint Arrangements and its amendments
The new standards and their amendments did not have an effect on Scanfil Group’s consolidated financial statements.
New and amended standards and interpretations to be applied
Scanfil Group has taken account of the new standards is-sued by the IASB at an earlier date. However, these stand-ards – such as IFRS 9 Financial Instruments and IFRS 15 Revenue from Contracts with Customers as well as amend-ments to IAS 28 Investments in Associates and Joint Ventures, IAS 38 Intangible Assets and IFRIC 21 Levies – have not been applied to the financial statements for 2014. The Group will adopt them as of the effective date of each standard and interpretation, or if the effective date is not the first day of the financial period, as of the beginning of the first financial period after the effective date. According to the current estimate, new and amended standards do not have any significant impact on the consolidated finan-cial statements.
28S C A N F I L A N N U A L R E P O R T 2 0 1 4
29S C A N F I L A N N U A L R E P O R T 2 0 1 4

NOTES TO THE CONSOLIDATED F INANCIAL STATEMENTS, IFRS
1. SEGMENT INFORMATION
The Group reports geographically operating segments: Asia and Europe. The segment information is based on internal reporting by the management, prepared according to the principles of IFRS standards. All of the Group’s business operations are managed from Finland. The Group has manufacturing units in the EU in Finland, Germany, Hungary and Estonia. In Asia, the Group has two subsidiaries in China. The Asian production
is primarily sold to the Asian market and other Group companies. An operating segment’s assets include all assets used in the segment’s business operations, primarily consisting of cash and cash equivalents, receivables, inventories and property, plant and equipment. An operating segment’s liabilities include all liabilities related to operations, consisting mainly of financing loans, accounts payable, outstanding taxes and accrued liabilities.
Operating segments, 1000 EUR 2013 Europe Asia Group Segment turnover 112 177 79 630 191 808 Intersegment turnover -2 323 -971 -3 294 Totalturnover 109 855 78 659 188 514
Operatingprofit 5 238 6 600 11 838
Financialincome 37 546 583 Financialexpense -1 114 -117 -1 230 Shareofprofitorlossofassociates -577
Profitbeforetaxes 10614
Segment assets 67 786 55 548 123 334 Goodwill 2 249 2 249 Investment assets 0 0 Totalassets 125583
Segment liabilities and provisions 31 601 13 505 45 106 Totalliabilities 45106
Capital expenditure 2 311 1 727 4 038 Depreciation 2 421 1 996 4 417
Operating segments, 1000 EUR 2014 Europe Asia Group Segment turnover 131 936 86 780 218 716Intersegment turnover -2 923 -1 286 -4 209Totalturnover 129 013 85 494 214 507 Operatingprofit 7 885 8 320 16 205 Financialincome 412 137 549Financialexpense -719 -130 -849 Profitbeforetaxes 15905 Segment assets 64 913 63 245 128 158Goodwill 5 851 5 851Totalassets 134 010 Segment liabilities and provisions 24 440 14 978 39 419Totalliabilities 39 419 Capital expenditure 7 274 962 8 235Depreciation 2 432 2 205 4 636
NOTES TO THE CONSOLIDATED F INANCIAL STATEMENTS, IFRS
30S C A N F I L A N N U A L R E P O R T 2 0 1 4
31S C A N F I L A N N U A L R E P O R T 2 0 1 4

Turnover by location of customers, 1000 EUR 2014 2013
Finland 76 422 79 844Rest of Europe 58 939 35 217Asia 72 327 69 897USA 5 419 2 480 Other 1 400 1 077Total 214507 188514 Largestcustomersthataccountformorethan10%oftheGroup’sincome Sales to the largest customer amounted to EUR 52 (47) million, 24 % (25 %), to the second largest EUR 23 (28) million, 11% (15 %) and to the third largest EUR 22 (17) million, 10 % (9 %).
2. OTHER OPERATING INCOME, 1000 EuR 2014 2013
Proceeds from sale of property, plant and equipment 22 70Invoiced administrational services from Sievi Capital plc 46 83Varma Mutual Pension Insurance Company’s grant for the development of well-being at work 9 16Valuation of forward exchange contracts 43 Other 178 125Total 298 294
3. uSE OF MATERIALS AND SuPPLIES, 1000 EuR 2014 2013
Materials, supplies and goods Purchases during the period 146 042 128 858 Change in inventories -1 980 2 092Total 144062 130950
4. PERSONNEL ExPENSES, 1000 EuR 2014 2013 Salaries, wages and fees 26 472 21 751Pension costs – defined-contribution schemes 3 414 3 277Other indirect employee expenses 2 195 1 940Total 32081 26969 Information on outstanding stock options is presented in Note 21, “Share-based Payment”. Management’s employee benefits are reported in Note 34, “Related party transactions”. AveragenumberofGroupemployeesduringtheperiod Clerical employees Europe 204 184 Asia 177 176 381 360Employees Europe 807 728 Asia 585 585 1 392 1 313
Total 1773 1673
NOTES TO THE CONSOLIDATED F INANCIAL STATEMENTS, IFRS
30S C A N F I L A N N U A L R E P O R T 2 0 1 4
31S C A N F I L A N N U A L R E P O R T 2 0 1 4

NOTES TO THE CONSOLIDATED F INANCIAL STATEMENTS, IFRS
5. DEPRECIATION AND AMORTIzATION, 1000 EuR 2014 2013 Depreciationbyassetclass Intangibleassets Intangible rights 321 164 Other long-term expenses 113 69Total 434 233 Property,plantandequipment Buildings 1 402 1 244 Machinery and equipment 2 735 2 916 Other tangible assets 65 25Total 4202 4185 Totaldepreciationandamortization 4636 4418
6. OTHER OPERATING ExPENSES, 1000 EuR 2014 2013
Otheroperatingexpensesincludethefollowingsignificantexpenseitems: External services 2 771 1 760Sales freight 2 321 2 588Other variable expenses 4 844 5 286Rent and maintenance expenses 1 618 1 292Travel, marketing and vehicle expenses 1 254 1 006Other employee expenses 1 278 1 134Other operating expenses 3 540 2 821Total 17627 15886 The increase in other operating expenses is mainly due to costs related to the German subsidiary, which was acquired on 31 March 2014. Other operating expenses include EUR 0.3 million decreases of value of associated company Greenpoint Oy’s account receivables in the corresponding year. Auditor’sremunerationAudit fees 134 71Tax consulting 8 Other services 207 9Total 348 80 7. FINANCING INCOME, 1000 EuR 2014 2013 Interest income from investments held to maturity 64 436Exchange rate gains 403 63Other financial income 82 85Total 549 583
Exchange rate gains and losses have arisen from the translation of transactions and monetary items in foreign currency into euros.
32S C A N F I L A N N U A L R E P O R T 2 0 1 4
33S C A N F I L A N N U A L R E P O R T 2 0 1 4

NOTES TO THE CONSOLIDATED F INANCIAL STATEMENTS, IFRS
8. FINANCING ExPENSES, 1000 EuR 2014 2013 Interest expenses from financial liabilities 383 602Exchange rate losses 430 324Impairment of loan recaivables 300Other financial expenses 36 5Total 849 1230
In addition, the operating profit includes exchange rate losses of EUR 624 thousand net in total. More information on the impairment of loan assets is provided in Note 14, “Shares in associated companies”.
9. INCOME TAxES, 1000 EuR 2014 2013 Current tax 3 504 2 142Tax expense of previous years 132 Deferred taxes -29 238Total 3607 2379 Reconciliationoftaxexpenseintheincomestatementandtaxescalculatedat thedomestictaxrateof20%(year201324.5%): Earnings before taxes 15 905 10 614 Taxes calculated at domestic tax rate 3 181 2 600Different tax rates of foreign subsidiaries -68 -355Tax at source on dividends paid in China 258 146Share of associated companies profit and loss 141Other items 104 -154Taxes from previous years 132 Taxesinincomestatement 3607 2379 10. EARNINGS PER SHARE, 1000 EuR 2014 2013 Net profit for the period attributable to equity holders of the parent company 12 298 8 235 Earnings per share, undiluted, EUR 0,21 0,14Earnings per share, diluted, EUR 0,21 0,14 Number of shares, undiluted (1,000 pcs) 57 730 57 730Number of shares, diluted (1,000 pcs) 58 180 57 955 When calculating the diluted earnings per share, the parent company’s average number of shares during the period has been adjusted with the dilutive effect of additional shares from the assumed exercise of options. The exercise of options is not considered when calculating earnings per share if the option exercise price of the share exceeds the average market value of the shares during the period.
32S C A N F I L A N N U A L R E P O R T 2 0 1 4
33S C A N F I L A N N U A L R E P O R T 2 0 1 4

NOTES TO THE CONSOLIDATED F INANCIAL STATEMENTS, IFRS
11. PROPERTy, PLANT AND EquIPMENT, 1000 EuR Advance Other payments and Tangible Buildings and Machinery and tangible constructions assets Land constructions equipments assets in progress total
Acquisition cost at 1 Jan. 827 25 062 48 875 541 1 75 305 Additions 483 1 221 59 1 163 2 926 Business combinations 221 45 265 Deductions -920 -1 -1 158 -2 079 Exchange rate differences -25 772 1 853 12 2 612Acquisitioncostat31Dec. 802 26317 51250 655 5 79030 Accumulated depreciations at 1 Jan. -7 433 -38 956 -458 -46 847 Depreciations -1 402 -2 735 -65 -4 202 Deductions 880 880 Exchange rate differences -301 -1 404 -25 -1 730Accumulateddepreciationsat31Dec. -9136 -42216 -548 -51900 Carrying amount at 1 Jan. 827 17 629 9 919 82 1 28 458Carryingamountat31Dec. 802 17180 9034 107 5 27130 Undepreciated acquisition cost of production machinery and equipment is EUR 8,681 thousand. Advance Other payments and Tangible Buildings and Machinery and tangible constructions assets Land constructions equipments assets in progress total
Acquisition cost at 1 Jan. 834 24 995 48 487 467 1 023 75 805 Additions 317 3 572 76 983 4 948 Deductions -2 896 -2 004 -4 900 Exchange rate differences -7 -250 -288 -2 -1 -548Acquisitioncostat31Dec. 827 25062 48875 541 1 75305 Accumulated depreciations at 1 Jan. -6 259 -38 638 -435 -45 332 Depreciations -1 244 -2 916 -25 -4 185 Deductions 2 370 2 370 Exchange rate differences 70 229 2 300Accumulateddepreciationsat31Dec. -7433 -38956 -458 -46847 Carrying amount at 1 Jan. 834 18 736 9 849 31 1 023 30 473Carryingamountat31Dec. 827 17629 9919 82 1 28458 Undepreciated acquisition cost of production machinery and equipment is EUR 9,712 thousand.
12. GOODwILL, 1000 EuR 2014 2013 Cost at 1 Jan. 2 249 2 249 Additions 3 602 Costat31Dec. 5851 2249Carryingamountat31Dec. 5851 2249 Allocationofgoodwillandgoodwillonconsolidationtocash-generatingunits Scanfil Kft, Hungary 2 138 2 138 Scanfil Oü, Estonia 111 111 Scanfil GmbH, Germany 3 602 Total 5851 2249
34S C A N F I L A N N U A L R E P O R T 2 0 1 4
35S C A N F I L A N N U A L R E P O R T 2 0 1 4

NOTES TO THE CONSOLIDATED F INANCIAL STATEMENTS, IFRS NOTES TO THE CONSOLIDATED F INANCIAL STATEMENTS, IFRS
Impairment testing A test concerning the impairment of goodwill and other assets was carried out at Scanfil Group on 31 December 2014. On each reporting date, the Group evaluates whether there are indications that the value of any of the assets might be impaired. If such indications exist, the recoverable amount for the asset in question is estimated. In addition, the recoverable amount for goodwill is estimated annually regardless of whether there are indications of impairment. Goodwill is tested every year, and indications of potential impairment of other assets are regu-larly evaluated within the Group. GoodwillimpairmenttestingThe recoverable amounts for cash-generating units have been determined based on value in use. Goodwill has been tested by measuring the Group’s recoverable amount. Recoverable amount is based on the value in use of a cash-generating unit, which is the present value of the future cash flows expected to be derived from the cash-generating unit. The determination of value in use is based on the conditions and expectations in force at the time of testing. Future cash flows have been determined for a five-year forecast period, and for the period follow-ing that, a growth rate of 1% has been assumed for cash flows for the sake of prudence. The amount of goodwill at the Group level is EUR 5.9 million. Of the goodwill, EUR 3.6 million is subject to the acquired business operations in Germany in 2014 and EUR 2.1 million concerns the business in Hungary. For Germany, the balance sheet value to be tested within the Group is EUR 7.9 million and for Hungary, the balance sheet value to be tested is EUR 13.1 million Preparing impairment testing calculations requires estimates of future cash flows. The assumptions used for the impairment tests are based on the management’s view of development in the coming years on the reporting date. Forecasts and assumptions are regularly reviewed and may be changed. The weighted average cost of capital (WACC) for the cash-generating unit has been used as the discount rate for cash flows. In impair-ment testing carried out on 31 December 2014, the discount rate before taxes was 6.5% for Germany and 11.2% for Hungary (9.5% for Hungary in 2013). Based on the impairment testing carried out on 31 December 2014, the Hungarian unit’s value in use exceeds its book value by EUR 1.7 million (EUR 2.9 million in 2013), or 12.8% (20.1%). The Germany unit’s value in use exceeds its book value by EUR 20.5 million, or 260%. No need for impairment of goodwill was detected based on the impermanent testing.
SensitivityanalysisforimpairmenttestingSensitivity analysis for impairment testing shows for the key variables of the impairment test the amount by which the value used for a key assumption needs to change to make the recoverable amount of the cash-generating unit equal to its book value. A change of +1.2% in the discount rate for Hungary (+1.5% in 2013) and a change of +12.7% for Germany would cause the recover-able amount of the unit to be equal to its book value. A change of -0.7% in EBITDA (%) for Hungary (-1.1% in 2013) and a change of -4.7% for Germany for all quarters included in the forecast period and in the terminal period would cause the recoverable amount of the unit to be equal to its book value. A change of -1.9% in terminal growth for Hungary (2.3% in 2013) and a change of -32.0% for Germany would cause the recoverable amount of the unit to be equal to its book value.
13. OTHER INTANGIBLE ASSETS, 1000 EuR Other Intangible Intangible long-term Advance assets rights expenses payments total Acquisition cost at 1 Jan. 5 620 915 553 7 088 Additions 605 458 49 1 112 Business combinations 433 433 Deductions -634 -453 -1 087 Exchange rate differences 371 20 391Acquisitioncostat31Dec. 6395 1393 150 7937 Accumulated depreciations at 1 Jan. -2 403 -601 -3 004 Depreciations -321 -113 -434 Deductions 634 634 Exchange rate differences -68 -16 -84Accumulateddepreciationsat31Dec. -2158 -730 -2888 Carrying amount at 1 Jan. 3 217 314 553 4 084Carryingamountat31Dec. 4237 663 150 5049
34S C A N F I L A N N U A L R E P O R T 2 0 1 4
35S C A N F I L A N N U A L R E P O R T 2 0 1 4

Other Intangible Intangible long-term Advance assets rights expenses payments total Acquisition cost at 1 Jan. 5 345 585 5 930 Additions 328 332 553 1 213 Exchange rate differences -53 -2 -55Acquisitioncostat31Dec. 5620 915 553 7088 Accumulated depreciations at 1 Jan. -2 249 -534 -2 782 Depreciations -164 -69 -233 Exchange rate differences 9 2 11Accumulateddepreciationsat31Dec. -2403 -601 -3004 Carrying amount at 1 Jan. 3 096 52 3 148Carryingamountat31Dec. 3217 314 553 4084
FINANCE LEASES, EuR
Intangible assets include assets acquired through finance leases as follows: Intangible rights total
Business combinations 1.4 405 405 Depreciations -89 -89 Carryingamountat31Dec. 316 316
14. INVESTMENTS IN ASSOCIATED COMPANIES, 1000 EuR 2014 2013
Total at beginning of period 632 Capital transfer tax refund -54 Impairment -577 Totalatendofperiod 0 The business operations of Scanfil EMS Oy’s associated company Greenpoint Oy have not developed as planned, and Scanfil has estimated that the possibilities of the associated company to fulfil its obligations are poor. In its financial statements for 2013, Scanfil EMS Oy recognised an impairment of its shares in the associated company and loan and trade receivables. Information of Group’s associated companies Group owner- 2014 Domicile ship (%) Assets Liabilities Turnover Loss Greenpoint Oy Pori 40,00 Financial Statement from period 1.7.2013 - 30.6.2014 is not available. 2013 Greenpoint Oy Pori 40,00 498 1 074 1 406 -374 Financial Statement 1.2.2012 - 30.6.2013
NOTES TO THE CONSOLIDATED F INANCIAL STATEMENTS, IFRS
15. AVAILABLE-FOR-SALE INVESTMENTS, 1000 EuR 2014 2013 Cost at 1 Jan. 17 16 Additions 1Costat31Dec. 17 17Carryingamountat31Dec. 17 17 Available for sale investments are golf shares.
36S C A N F I L A N N U A L R E P O R T 2 0 1 4
37S C A N F I L A N N U A L R E P O R T 2 0 1 4

NOTES TO THE CONSOLIDATED F INANCIAL STATEMENTS, IFRS
16. DEFERRED TAx ASSETS AND RECEIVABLES, 1000 EuR
Changes of deferred taxes during year 2014 Recognised Recognised through under other profitand comprehensive 1.1.2014 loss income 31.12.2014 Deferredtaxassets: Related to inventories 108 117 225 Related to derivative financial instrument 61 -43 18 Other 125 -56 69Total 294 61 -43 312 Deferredtaxliabilities: Other 0 -9 -9Total 0 -9 -9
Changes of deferred taxes during year 2013 Recognised Recognised through under other profitand comprehensive 1.1.2013 loss income 31.12.2013 Deferredtaxassets: Related to inventories 219 -111 108 Related to derivative financial instrument 150 -89 61 Taxation loss 187 -187 0 Other 90 34 125Total 645 -263 -89 294 Deferredtaxliabilities: Accumulated depreciation difference -23 23 0Total -23 23 0
17. INVENTORIES, 1000 EuR 2014 2013 Materials and supplies 26 233 21 156Work in progress 3 658 3 039Finished goods 5 643 4 538Total 35534 28732 No significant write-downs were required for the value of inventories during the financial periods 2013 and 2014.
18. TRADE AND OTHER RECEIVABLES, 1000 EuR 2014 2013 Trade receivables 38 703 31 385Accrued income 530 556Other 1 624 1 526Total 40858 33467 Other receivables are mainly value-added tax receivables.
36S C A N F I L A N N U A L R E P O R T 2 0 1 4
37S C A N F I L A N N U A L R E P O R T 2 0 1 4

NOTES TO THE CONSOLIDATED F INANCIAL STATEMENTS, IFRS
19. CASH AND CASH EquIVALENTS, 1000 EuR 2014 2013 Deposits 3 317 9 875Cash and cash equivalents 15 893 18 276 Total 19211 28150 Deposits are fixed term deposits with maturities in a maximum of three months.
20. EquITy, 1000 EuR SharesandsharecapitalScanfil plc has a total of 57,730,439 shares. The company’s registered share capital is EUR 2,000,000.00. The company has one series of shares, and all shares belong to the same class. Each share entitles the holder to one vote and the equal right to receive dividends. The share has no nominal value. Scanfil plc’s shares are quoted on NASDAQ OMX Helsinki Oy. The trading code of the shares is SCL1V. The shares are entered in the book-entry securities system administered by Euroclear Finland Ltd. TranslationdifferencesTranslation differences include differences arising from the conversion of the financial statements of foreign companies. OtherreservesOther reserves includes a reserve comprising of transfers from retained earnings in accordance with the Articles of Association of foreign companies and the fair value reserve comprising of accumulated changes in the value of exchange rate-hedging of the currency swap. 2014 2013 Reserves according to the Articles of Association 6 103 5 909Fair value reserve -71 -188Total 6031 5721 ReserveforinvestedunrestrictedequityfundThe fund of invested, available equity includes other equity investments and the stock issue price when it is not entered in the stock capital according to an express decision. DividendIn year 2014 distributed a dividend of EUR 0.05/share, total of EUR 2,886,521.95. After the reporting date, the Board of Directors has pro-posed a dividend of EUR 0.07 per share to be distributed, totalling EUR 4,041,130.73.
21. SHARE BASED PAyMENTS Optionschemefor2013 The Annual General Meeting accepted on 18 April 2013 Scanfil plc’s option scheme for 2013 (A) – (C). A maximum of 750,000 option rights can be granted, and they entitle the holders to subscribe for a maximum total of 750,000 of the company’s new shares or shares in its possession. Based on the authorisation granted by the Annual General Meeting, the Board of Directors decided on 18 September 2013 and 25 September 2014 to grant 450,000 option rights in total to the CEO and the CFO of Scanfil Oyj and three key employees of Scanfil EMS Oy, a subsidiary of Scanfil Oyj. The option rights will be marked 2013A and 2013B. Each option right enables its holder to subscribe for one new share issued by Scanfil Oyj or one share held by Scanfil Oyj. The subscription period for the 2013A option rights will be from 1 May 2016 to 30 April 2018, and the subscription period for the 2013B option rights will be from 1 May 2017 to 30 April 2019. will not be implemented if the production and financial goals and conditions specifically determined by the Board for using the option rights are not met. If the goals are not met, option rights will expire as determined by the Board. The share subscription price for the 2013A option rights is EUR 0.87, which is the volume-weighted average price of the share at NASDAQ OMX Helsinki Oy between 1 March and 31 March 2013. The share subscription price for the 2013B option rights is EUR 1.41, which is the volume-weighted average price of the share between 1 March and 31 March 2014. The expense recognition of the option scheme was EUR 42 thousand (2013 EUR 6 thousand).
Optionarrangement 2013B 2013AGrant date 25.9.2014 18.9.2013Amount of granted instruments (pcs) 225 000 225 000Subscription price (EUR) 1,41 0,87Fair value (EUR) 1,17 0,66Share price at time of granting (EUR) 2,31 1,34Term of validity (years) 4,5 4,5
38S C A N F I L A N N U A L R E P O R T 2 0 1 4
39S C A N F I L A N N U A L R E P O R T 2 0 1 4

NOTES TO THE CONSOLIDATED F INANCIAL STATEMENTS, IFRS
22. PROVISIONS, 1000 EuR Unemployment Reclamation pension provisions deductibles Other Total 1.1.2014 188 185 373Additions 261 81 342Used provisions -138 -85 -223Cancellation of unused provisions -28 -2831.12.2014 311 72 81 464 The complaint and warranty provision includes the estimated cost of repairing defective products that is related to customer complaints. The unemployment security provision includes any excesses for employment security for employees laid off as a result of statutory employee negotiations. Other provisions consist of any supplier and customer bonuses. 23. FINANCIAL LIABILITIES, 1000 EuR 2014 2013
Longtermliabilitiesrecognisedatamortisedcost Financial Institutions 407 9 171Finance Lease 94 Total 501 9171 Shorttermliabilitiesrecognisedatamortisedcost Financial Institutions 8 649 9 171Finance Lease 138 Total 8787 9171
The Group has one interest-bearing financing loan, taken out by Scanfil EMS Oy in 2010 in SEK, originally equivalent to EUR 40.0 million. Term of the loan is five years, and the last instalment will be paid on 8 December 2015. Interest of the loan may vary between 2.21% and 2.56% due to the fulfilment of interest covenant terms. The interest rate of the loan was 2.21% in 2014. The loan is associated with termination covenants, which are not in danger of being broken. The company has an interest rate and currency swap related to the hedging of credit in foreign currency. The purpose of the hedge is to protect against the impact of changes in cash flows related to credit in foreign currency (credit and foreign exchange risks). The hedge is used to swap the capital and cash flows of instalments and interest payments for a variable-rate loan in SEK into EUR and fixed interest. The objecti-ve of the hedge follows the Group’s risk management principles. Effectiveness of the hedge can be reliably measured, and the hedge is expected to remain fully effective throughout the term of the hed-ging relationship. Effectiveness is evaluated every quarter year. The nominal amount of the interest rate and currency swap was SEK 81.2 million on 31 December 2014 (SEK 162.5 million on 31 December 2013) and it will mature on 8 December 2015. The fair value of the derivative was EUR - 328,723 (EUR 314,440 on 31 December 2013). The cash flows of the derivative will be realised at the same time as the cash flows of the loan so that cash flows in SEK obtained from the derivative fully cover the cash flows payable for the loan. The end result is that the company will pay instalments and inter-est flows in euros according to the schedule in Note 29. Items recorded in the fair value reserve and in profit or loss for the derivative were as follows (in thousands of euros): 2014 2013
Fair value reserve 117 273Transferred to profit or loss 4 -6
38S C A N F I L A N N U A L R E P O R T 2 0 1 4
39S C A N F I L A N N U A L R E P O R T 2 0 1 4

NOTES TO THE CONSOLIDATED F INANCIAL STATEMENTS, IFRS
24. NON-CuRRENT LIABILITIES, 1000 EuR 2014 2013
Tradeandotherpayables Trade payables 20 973 19 657 Accrued liabilities 6 603 5 121 Advance payments received 38 Other creditors 1 186 1 192Total 28763 26009 The most significant items included in accrued liabilities: Employee expenses 5 346 4 536 Interests 13 24 Other accrued liabilities 1 244 561Total 6603 5121
Other accrued liabilities include a valuation item of EUR 0.3 million of a derivative receivable related to a foreign currency loan.
Financeleasematurities 2014 2013
Grossfinancialdebt -Minimumrentsbytimeofmaturity Within one year 142 In one to five years 96Total 238 Future financing expenses accrued -6Currentvalueoffinancingleasedebt 232
Thecurrentvalueoffinancingleasedebtwillmatureasfollows: Within one year 138 In one to five years 94Total 232
40S C A N F I L A N N U A L R E P O R T 2 0 1 4
41S C A N F I L A N N U A L R E P O R T 2 0 1 4
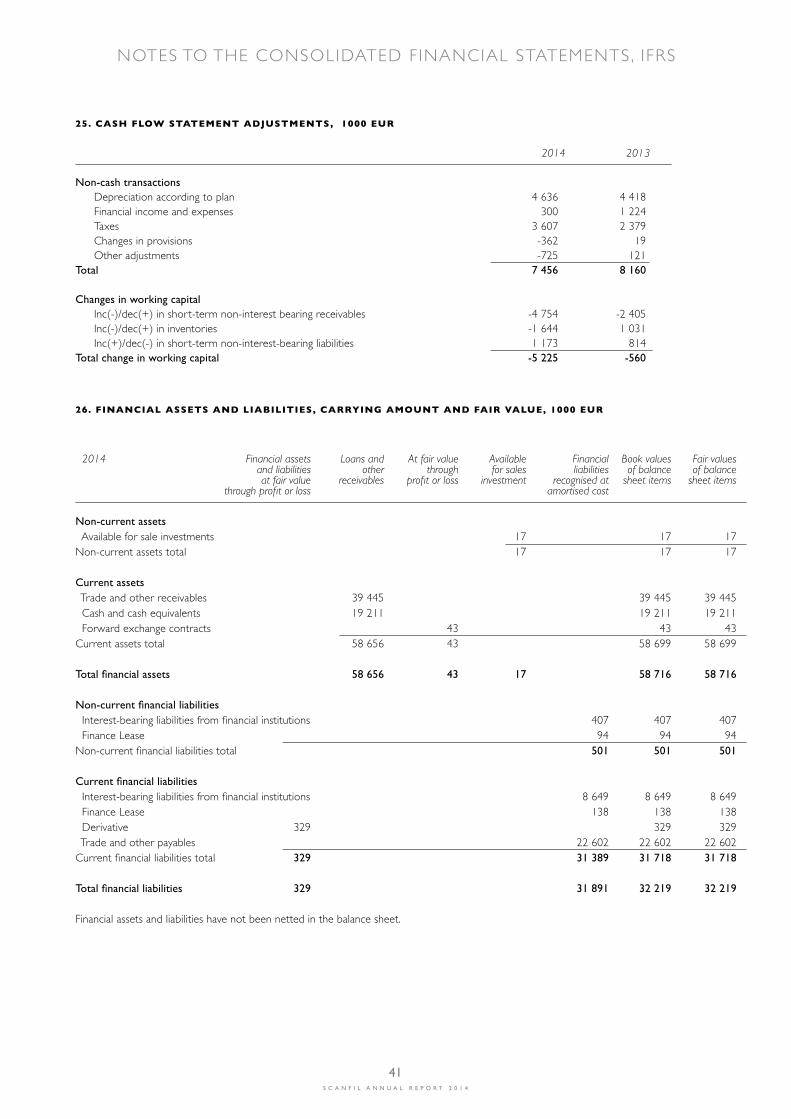
NOTES TO THE CONSOLIDATED F INANCIAL STATEMENTS, IFRS
25. CASH FLOw STATEMENT ADjuSTMENTS, 1000 EuR
2014 2013
Non-cashtransactions Depreciation according to plan 4 636 4 418 Financial income and expenses 300 1 224 Taxes 3 607 2 379 Changes in provisions -362 19 Other adjustments -725 121Total 7456 8160 Changesinworkingcapital Inc(-)/dec(+) in short-term non-interest bearing receivables -4 754 -2 405 Inc(-)/dec(+) in inventories -1 644 1 031 Inc(+)/dec(-) in short-term non-interest-bearing liabilities 1 173 814 Totalchangeinworkingcapital -5225 -560
26. FINANCIAL ASSETS AND LIABILITIES, CARRyING AMOuNT AND FAIR VALuE, 1000 EuR 2014 Financial assets Loans and At fair value Available Financial Book values Fair values and liabilities other through for sales liabilities of balance of balance atfairvalue receivables profitorloss investment recognisedat sheetitems sheetitems throughprofitorloss amortisedcost
Non-currentassets Available for sale investments 17 17 17Non-current assets total 17 17 17 Currentassets Trade and other receivables 39 445 39 445 39 445 Cash and cash equivalents 19 211 19 211 19 211 Forward exchange contracts 43 43 43Current assets total 58 656 43 58 699 58 699 Totalfinancialassets 58656 43 17 58716 58716 Non-currentfinancialliabilities Interest-bearing liabilities from financial institutions 407 407 407 Finance Lease 94 94 94Non-current financial liabilities total 501 501 501 Currentfinancialliabilities Interest-bearing liabilities from financial institutions 8 649 8 649 8 649 Finance Lease 138 138 138 Derivative 329 329 329 Trade and other payables 22 602 22 602 22 602Current financial liabilities total 329 31 389 31 718 31 718 Totalfinancialliabilities 329 31891 32219 32219
Financial assets and liabilities have not been netted in the balance sheet.
40S C A N F I L A N N U A L R E P O R T 2 0 1 4
41S C A N F I L A N N U A L R E P O R T 2 0 1 4

NOTES TO THE CONSOLIDATED F INANCIAL STATEMENTS, IFRS
2013 Financial assets Loans and At fair value Available Financial Book values Fair values and liabilities other through for sales liabilities of balance of balance atfairvalue receivables profitorloss investment recognisedat sheetitems sheetitems throughprofitorloss amortisedcost
Non-currentassets Available for sale investments 17 17 17Non-current assets total 17 17 17 Currentassets Trade and other receivables 32 085 32 085 32 085 Cash and cash equivalents 28 150 28 150 28 150Current assets total 60 235 60 235 60 235 Totalfinancialassets 60235 17 60253 60253 Non-currentfinancialliabilities Interest-bearing liabilities from financial institutions 9 171 9 171 9 171 Derivative 157 157 157Non-current financial liabilities total 157 9 171 9 328 9 328 Currentfinancialliabilities Interest-bearing liabilities from financial institutions 9 171 9 171 9 171 Derivative 157 157 157 Trade and other payables 20 217 20 217 20 217Current financial liabilities total 157 29 388 29 545 29 545 Totalfinancialliabilities 314 38559 38873 38873
Financial assets and liabilities have not been netted in the balance sheet.
27. FAIR VALuE HIERARCHy 2014 Level 1 Level 2 Level 3
Assetsmeasuredatfairvalue Derivative 329 Available-for-sale investments Equity investments 17Trading derivatives Forward exchange 43 Liabilitiesmeasuredatfairvalue Liabilities recognised at amortised cost Financing loan 9 057 Finance Lease 232 2013 Level 1 Level 2 Level 3
AssetsmeasuredatfairvalueAvailable-for-sale investments Equity investments 17 Liabilitiesmeasuredatfairvalue Derivative 314Liabilitiesrecognisedatamortisedcost Financing loan 18 341
42S C A N F I L A N N U A L R E P O R T 2 0 1 4
43S C A N F I L A N N U A L R E P O R T 2 0 1 4

NOTES TO THE CONSOLIDATED F INANCIAL STATEMENTS, IFRS
The fair values of level 2 instruments are to a significant extent based on data that can be observed either directly (i.e. as price) or indirectly (derived from the prices) for the asset or liability in question. In determining the fair value of these instruments, the Group utilises generally accepted measurement models whose input data, however, is significantly based on verifiable market data. The fair values of level 3 instruments are based on input data concerning the asset or liability that is not based on observable market data but to a significant extent on estimates of the management and their use in generally accepted measurement models. Level 3 items are unlisted shares
28. DERIVATIVE INSTRuMENTS
Derivative instruments used by the Group are discussed in Note 25: ‘‘Interest-bearing Liabilities’’. The Group has forward exchange contracts for purposes other than hedging. Changes in the fair values of these contracts have been recognised through profit or loss and the valuation is included in accrued income. 29. FINANCIAL RISk MANAGEMENT The Group’s treasury operations and financial risks are managed centrally in the parent company based on the principles approved by the Board. Subsidiaries are financed through intercompany loans or local bank loans. The goal is cost-efficient risk management and optimisation of cash flows. Currency riskThe Group’s currency risks consist of • transaction risks related to trade receivables and payables • translation risks related to foreign subsidiaries • financial risks related to exchange rate changes Currency risks are mainly the result of changes in the EUR/USD exchange rates. Currency risks can be hedged with forward exchange contracts or interest rate and currency swaps. The parent company of the Group is responsible for all hedging actions. The financial statements of 31 December 2014 include an interest rate and currency swap for hedging a foreign currency loan and a EUR/USD forward exchange contract for a purpose other than hedging.
Below, the net positions associated with cash and cash equivalents, accounts receivable and accounts payable are shown in euros for the main currencies of the Group. Transaction risk, 1000 EUR 2014
Foreign currency USD USD EUR HUF Reporting currency: EUR RMB RMB EUR Cash and cash equivalents 3 372 402 1 171 12 Trade receivables 28 5 121 3 241 25 Trade payables -804 -1 319 -925 -43 Hedges -390
Balance sheet net risk 2 206 4 204 3 487 -6
Transaction risk, 1000 EUR 2013
Foreign currency USD USD EUR HUF Reporting currency: EUR RMB RMB EUR Cash and cash equivalents 3 670 420 645 68 Trade receivables 4 2 288 3 435 31 Trade payables -881 -1 028 -1 323 -38
Balance sheet net risk 2 793 1 680 2 757 61
Below, the impact of a change of 10% in the exchange rate of a foreign currency relative to EUR is shown from the point of view of net for-eign exchange position for the Group’s result and equity. Tax consequence has not been considered. Foreign currency change in USD USD EUR HUF Reporting currency: currency, % EUR RMB RMB EUR Year 2014 +/- 10 +/- 220 +/- 420 +/- 349 +/- 1 Year 2013 +/- 10 +/- 279 +/- 168 +/- 276 +/- 6
42S C A N F I L A N N U A L R E P O R T 2 0 1 4
43S C A N F I L A N N U A L R E P O R T 2 0 1 4

NOTES TO THE CONSOLIDATED F INANCIAL STATEMENTS, IFRS
Translation riskA weakening of 10% of the Chinese yuan would decrease the Group’s shareholders’ equity by approximately EUR 4 million. The Chinese currency is strongly linked to the US dollar. The exposure is not fixed; it varies with the result and dividends paid. In Hungary, the property company Rozália Invest Kft has a euro-denominated loan of EUR 4.4 million from the parent company. This loan includes a currency risk if the local currency (HUF) weakens. The accounting currency of other subsidiaries is EUR. Investments in foreign subsidiaries have not been hedged. Financial riskThe changes in exchange rates should not have a significant effect on the long term competitiveness of the company. With most customers pricing is adjusted either monthly or quarterly cycles. Some fixed prices are agreed, but no longer than for a one year period. Interest rate riskThe yield of the financial investments and interest-bearing liabilities carry an interest rate risk. The Group has considerable cash assets, and changes in interest rates may have an effect on the Group’s result, but their impact is not significant on the whole. The Group invests its cash funds in bank deposits, and only accepts banks with a high credit rating as counterparties. The interest rate risk of loans can be controlled with the proportion between variable rate and fixed-interest loans. The Group only has one interest-bearing loan whose interest rate has been fixed through an interest swap agreement for a loan period of five years. The interest covenant term range is 2.21% - 2.56%. The interest rate in 2014 was 2.21%. Interest expenses were EUR 53 thousands higher if the interest rate would have been 2.56% throughout the year.
Credit riskThe credit risks of accounts receivable are the responsibility of operative business units. The monitoring of accounts receivable is a continuous activity according to the Group guidelines. According to the view of the Group’s management, the company does not have any significant concentration of credit risk. The sales of the three largest customers is 45 % of the Group’s turnover. The largest customers have good credit ratings. Agedistributionoftradereceivables,1000EUR 2014 2013 Unmatured 33 038 29 399 Matured 1 - 30 days 3 233 1 395 31 - 90 days 2 019 476 91 - 180 days 305 29 181 - 365 days 85 51 more than 1 year 23 35
Total 38703 31385
During the financial year, the Group has recorded a total of EUR 4 thousand (EUR 327 thousand in 2013) of credit losses for accounts receivable. The credit losses of the previous year are due to accounts receivable of the associated company Greenpoint Oy. The matter is presented in Notes 14. Liquidity risk Considering the Group’s balance sheet structure, the liquidity risk is small. The Group’s liquid assets on 31 December 2014 were EUR 19.2 million (EUR 28.2 million in 2013). In addition, the Group has a credit limit for EUR 8.0 million. The Group’s bank loans include regular loan covenant terms. During the financial year 2014, the Group fulfilled the covenant terms associated with the loans and they are not at risk of rupture. MaturityanalysisbasedondebtagreementsThe figures are undiscounted, including both interest payments and capital repayments. 31.12.2014 balancesheetvalue cashflow 0-6months 6months-1year 1-2years 2-5years morethan5yearsLoans from financial institutions 8 649 9 038 4 544 4 494 Finance lease 232 238 83 60 93 3 Overdraft facility 407 407 407Trade payables and other liabilities 28 763 28 763 28 763 Total 38052 38039 33390 4554 93 3 407 31.12.2013 Loans from financial institutions 18 341 18 275 4 643 4 593 9 038 Trade payables and other liabilities 26 009 26 009 26 009 Total 44350 44283 30652 4593 9038 “Loans from financial institutions” consist of a loan in Swedish kronor, which has been converted into euros through an interest rate and currency swap. Instalments and interest flows obtained from the derivative in Swedish kronor fully cover the instalments and interest flows payable for the loan. The end result is that the company will pay instalments and interest flows in euros as described above. Payment basis installments defer from the loans book value, as the book value also includes the value of the derivative.
44S C A N F I L A N N U A L R E P O R T 2 0 1 4
45S C A N F I L A N N U A L R E P O R T 2 0 1 4
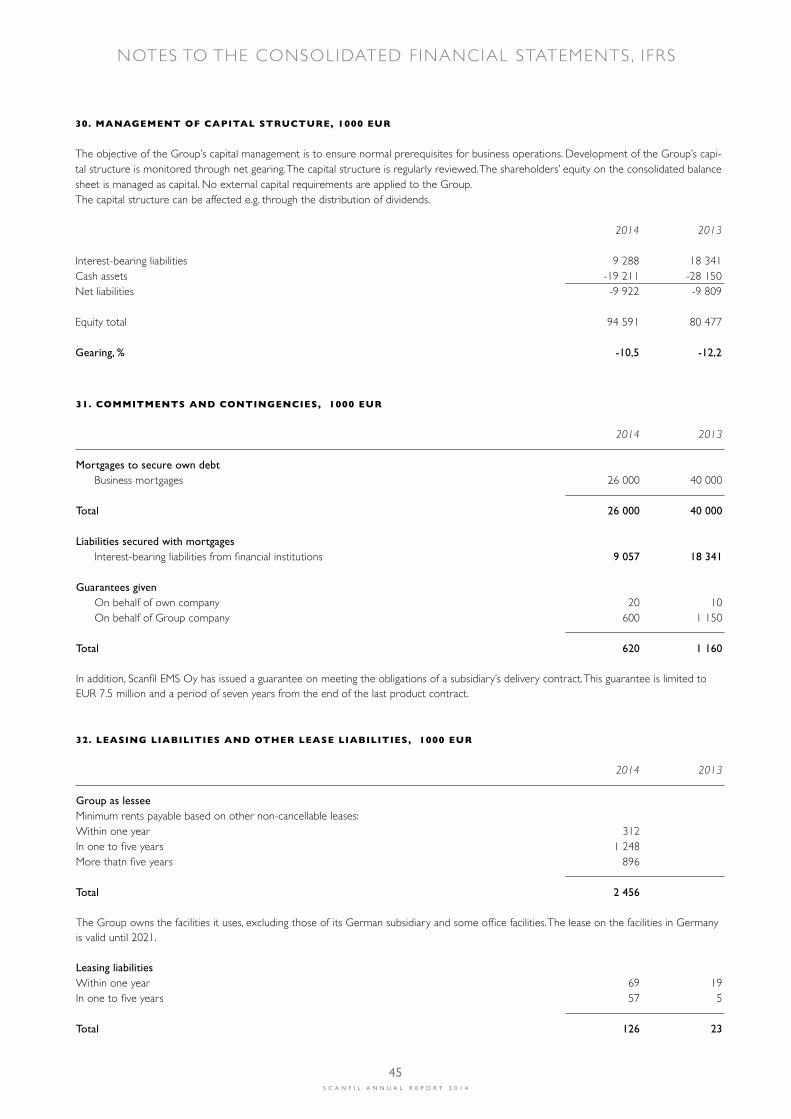
NOTES TO THE CONSOLIDATED F INANCIAL STATEMENTS, IFRS
30. MANAGEMENT OF CAPITAL STRuCTuRE, 1000 EuR The objective of the Group’s capital management is to ensure normal prerequisites for business operations. Development of the Group’s capi-tal structure is monitored through net gearing. The capital structure is regularly reviewed. The shareholders’ equity on the consolidated balance sheet is managed as capital. No external capital requirements are applied to the Group. The capital structure can be affected e.g. through the distribution of dividends. 2014 2013 Interest-bearing liabilities 9 288 18 341Cash assets -19 211 -28 150Net liabilities -9 922 -9 809 Equity total 94 591 80 477 Gearing,% -10,5 -12,2
31. COMMITMENTS AND CONTINGENCIES, 1000 EuR 2014 2013
Mortgagestosecureowndebt Business mortgages 26 000 40 000
Total 26000 40000 Liabilitiessecuredwithmortgages Interest-bearing liabilities from financial institutions 9 057 18 341 Guaranteesgiven On behalf of own company 20 10 On behalf of Group company 600 1 150
Total 620 1160
In addition, Scanfil EMS Oy has issued a guarantee on meeting the obligations of a subsidiary’s delivery contract. This guarantee is limited to EUR 7.5 million and a period of seven years from the end of the last product contract.
32. LEASING LIABILITIES AND OTHER LEASE LIABILITIES, 1000 EuR 2014 2013
Groupaslessee Minimum rents payable based on other non-cancellable leases:Within one year 312In one to five years 1 248More thatn five years 896
Total 2456
The Group owns the facilities it uses, excluding those of its German subsidiary and some office facilities. The lease on the facilities in Germany is valid until 2021.
Leasingliabilities Within one year 69 19In one to five years 57 5
Total 126 23
44S C A N F I L A N N U A L R E P O R T 2 0 1 4
45S C A N F I L A N N U A L R E P O R T 2 0 1 4
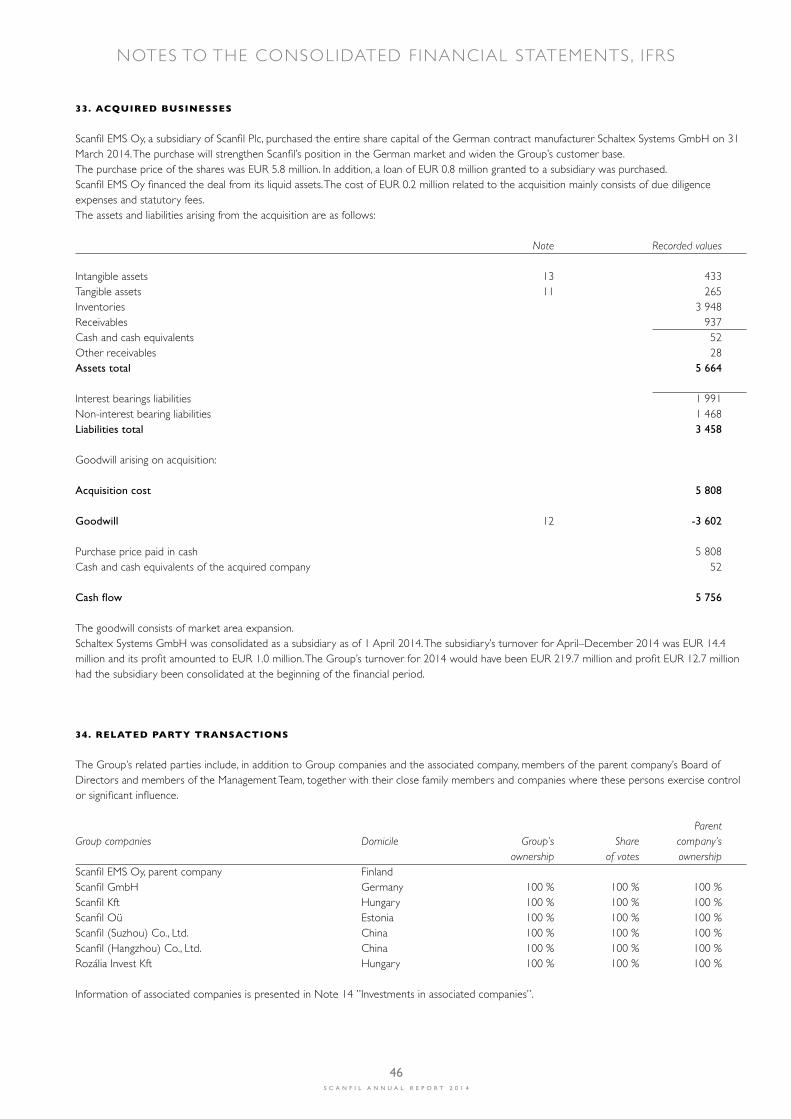
NOTES TO THE CONSOLIDATED F INANCIAL STATEMENTS, IFRS
34. RELATED PARTy TRANSACTIONS The Group’s related parties include, in addition to Group companies and the associated company, members of the parent company’s Board of Directors and members of the Management Team, together with their close family members and companies where these persons exercise control or significant influence. ParentGroup companies Domicile Group’s Share company’s ownership of votes ownershipScanfil EMS Oy, parent company Finland Scanfil GmbH Germany 100 % 100 % 100 %Scanfil Kft Hungary 100 % 100 % 100 %Scanfil Oü Estonia 100 % 100 % 100 %Scanfil (Suzhou) Co., Ltd. China 100 % 100 % 100 %Scanfil (Hangzhou) Co., Ltd. China 100 % 100 % 100 %Rozália Invest Kft Hungary 100 % 100 % 100 % Information of associated companies is presented in Note 14 ”Investments in associated companies”.
33. ACquIRED BuSINESSES Scanfil EMS Oy, a subsidiary of Scanfil Plc, purchased the entire share capital of the German contract manufacturer Schaltex Systems GmbH on 31 March 2014. The purchase will strengthen Scanfil’s position in the German market and widen the Group’s customer base. The purchase price of the shares was EUR 5.8 million. In addition, a loan of EUR 0.8 million granted to a subsidiary was purchased. Scanfil EMS Oy financed the deal from its liquid assets. The cost of EUR 0.2 million related to the acquisition mainly consists of due diligence expenses and statutory fees. The assets and liabilities arising from the acquisition are as follows: Note Recorded values
Intangible assets 13 433Tangible assets 11 265Inventories 3 948Receivables 937Cash and cash equivalents 52Other receivables 28Assetstotal 5664 Interest bearings liabilities 1 991Non-interest bearing liabilities 1 468Liabilitiestotal 3458 Goodwill arising on acquisition: Acquisitioncost 5808 Goodwill 12 -3 602 Purchase price paid in cash 5 808Cash and cash equivalents of the acquired company 52 Cashflow 5756
The goodwill consists of market area expansion. Schaltex Systems GmbH was consolidated as a subsidiary as of 1 April 2014. The subsidiary’s turnover for April–December 2014 was EUR 14.4 million and its profit amounted to EUR 1.0 million. The Group’s turnover for 2014 would have been EUR 219.7 million and profit EUR 12.7 million had the subsidiary been consolidated at the beginning of the financial period.
46S C A N F I L A N N U A L R E P O R T 2 0 1 4
47S C A N F I L A N N U A L R E P O R T 2 0 1 4

NOTES TO THE CONSOLIDATED F INANCIAL STATEMENTS, IFRS
Relatedpartytransactions,1000EUR Sales Interest income 31.12.2014 Greenpoint Oy 4 31.12.2013 Greenpoint Oy 126 2 Scanfil plc’s subsidiary Scanfil EMS Oy has rented an office space from Kiinteistö Oy Pilot 1, which head owners are Jorma Takanen, Harri Takanen, Jarkko Takanen and Reijo Pöllä. Rental costs in 2014 were EUR 19 thousand (2013 EUR 15 thousand). BusinesstransactionsandopenbalanceswithSieviCapitalplc After a partial division at the beginning of year 2012, Scanfil Oyj and Sievi Capital Oyj have the same main owners. Scanfil plc and the subsidia-ry Scanfil EMS Oy have offered administrative services to Sievi Capital plc.
Sales Receivables Ostot
31.12.2014 Administrative service fees 46 20 31.12.2013 Administrative service fees 83 23
Employeebenefitsformembersofthemanagement,EUR 2014 2013 Salaries and other short-term employee benefits 923 692Post-employment benefits 2 2Option scheme 42 6
Total 967 700 The management includes the parent company’s Board of Directors, CEO and Management Team members. 2014 2013 SalariespaidtothePresident Petteri Jokitalo since 1 April 2013 255 93Harri Takanen up to 31 March 2013 0 62 Statutorypensionexpenditure,TYEL Harri Takanen 11Petteri Jokitalo 47 17
Harri Takanen has a voluntary pension insurance policy with a projected pension of some EUR 1 thousand per month. The pension period is 1 September 2026 – 31 August 2033. SalariespaidtotheBoardmembers Jorma J. Takanen 18 17Jarkko Takanen 18 17Harri Takanen since 18 April 2013 24 15Riitta-Liisa Kotilainen since 18 April 2013 18 11Tuomo Lähdesmäki up to 24 February 2014 3 17Christer Härkönen since 8 April 2014 12 Päivi Marttila up to 18 April 2013 6
TotalsalariesoftheBoardMembers 92 83 The salary information is payment-based.
46S C A N F I L A N N U A L R E P O R T 2 0 1 4
47S C A N F I L A N N U A L R E P O R T 2 0 1 4

Keyfinancialindicators 2014 2013 2012 2011 2010 Turnover, EUR m 214.5 188.5 180.9 210.8 219.3Turnover, growth from previous year, % 13.8 4.2 -14.2 -3.9 11.1Operating profit, EUR m 16.2 11.8 8.1 9.1 11.0Operating profit, % of turnover 7.6 6.3 4.5 4.3 5.0Profit/loss for the period, EUR m 12.3 8.2 5.7 6.3 6.8Profit/loss for the period, % of turnover 5.7 4.4 3.2 3.0 3.1 Return on equity, % 14.0 10.6 7.9 9.7 12.6Return on investment, % 16.5 11.4 8.1 9.5 11.4Interest-bearing liabilities, EUR m 9.3 18.3 28.4 36.5 42.8Gearing, % -10.5 -12.2 -2.4 1.9 43.1Equity ratio, % 70.6 64.1 57.7 53.6 41.6Gross investments in fixed assets, EUR m 8.2 4.0 7.2 3.8 10.1Gross investments in fixed assets, % of turnover 3.8 2.1 4.0 1.8 4.6Average number of employees for the period 1 773 1 673 1 669 2 024 1 989
Keyindicatorspershare Earnings per share, EUR 0.21 0.14 0.10 0.11 (* 0.12 (*Shareholders’ equity per share, EUR 1.64 1.39 1.30 1.20 (* 1.03 (*Dividend per share, EUR 0.07 0.05 0.04 Dividend per earnings, % 32.9 35.1 40.5 Effective dividend yield, % 2.85 3.70 4.88 Price-to-earnings ratio (P/E) 11.5 9.5 8.3 Sharetrading No. of shares traded, thousands 5 131 2 864 8 982Percentage of total shares, % 8.88 4.96 15.6 Shareperformance Lowest price for year, EUR 1.30 0.82 0.60Highest price for year, EUR 2.74 1.47 1.10Average price for year, EUR 1.95 1.11 0.76Price at the end of year, EUR 2.46 1.35 0.82Market value of share capital at the end of the year/period, EUR m 142.0 77.9 47.3 Share-issueadjustednumberofshares At the end of the period, thousands 57 730 57 730 57 730 57 730 57 730On average during the period, thousands 57 730 57 730 57 730 57 730 57 730 (* The number of shares is based on the number of shares held by Scanfil plc
KEY F INANCIAL INDIC ATORS
48S C A N F I L A N N U A L R E P O R T 2 0 1 4
49S C A N F I L A N N U A L R E P O R T 2 0 1 4

Return on equity, % Net profit for the period x 100 Shareholders’ equity (average)
Return on investment, % (Profit before taxes + interest and other financial expenses) x 100 Balance sheet total - non-interest-bearing liabilities (average)
Gearing (%) (Interest-bearing liabilities - cash and other liquid financial assets) x 100 Shareholders’ equity Equity ratio (%) Shareholders’ equity x 100 Balance sheet total - advance payments received
Earnings per share Net profit for the period Average adjusted number of shares during the year
Shareholders’ equity per share Shareholders’ equity Adjusted number of shares at the end of the financial period
Dividend per share Dividend to be distributed for the period (Board’s proposal) Number of shares at the end of year
Dividend per earnings (%) Dividend per share x 100 Earnings per share
Effective dividend yield (%) Dividend per share x 100 Share price at the end of year
Price-to-earnings ratio (P/E) Share price at the end of year Earnings per share
Average share price Total share turnover Number of shares traded
Market capitalisation Number of shares x last trading price of the financial period
KEY RATIOS
48S C A N F I L A N N U A L R E P O R T 2 0 1 4
49S C A N F I L A N N U A L R E P O R T 2 0 1 4

INCOME STATEMENT, FAS
1000 EUR Note 1.1.-31.12.2014 1.1.-31.12.2013 Other operating income 807 405 Personnel expenses 1 -1 008 -564Other operating expenses 2 -207 -207 Operatingprofit -409 -366 Financial income 3 3 822 2 216Financial expenses 3 -21 -15 Profitbeforeextraordinaryitems 3392 1835 Extra-ordinary items 4 400 1 200 Profitbeforeappropriationsandtaxes 3 792 3 035 Income taxes 5 -18 Netprofitfortheperiod 3792 3017
50S C A N F I L A N N U A L R E P O R T 2 0 1 4
51S C A N F I L A N N U A L R E P O R T 2 0 1 4

BALANCE SHEET, FAS
1000 EUR Note 31.12.2014 31.12.2013
ASSETS Non-currentassets Investments Holdings in Group companies 6 12 621 12 621 12 621 12 621 Totalnon-currentassets 12621 12621 Currentassets Short-termreceivables Account receivables 15 15Receivables from Group companies 7 4 285 3 459Accrued income 2 4 300 3 476 Cashandcashequivalents 8 1 789 2 095 Totalcurrentassets 6 089 5 572 Totalassets 18710 18193 SHAREHOLDER’SEQUITYANDLIABILITIES Equity Share capital 2 000 2 000Reserve for invested unrestricted equity fund 10 721 10 721Retained earnings 360 229Profit for the period 3 792 3 017 TotalEquity 9 16 873 15 967 Short-termliabilities Trade payables 13 13Liabilities to Group companies 10 1 393 1 845Other creditors 54 67Accrued liabilities 11 379 300 1 837 2 225 Totalliabilities 1837 2225 Totalequityandliabilities 18710 18193
50S C A N F I L A N N U A L R E P O R T 2 0 1 4
51S C A N F I L A N N U A L R E P O R T 2 0 1 4
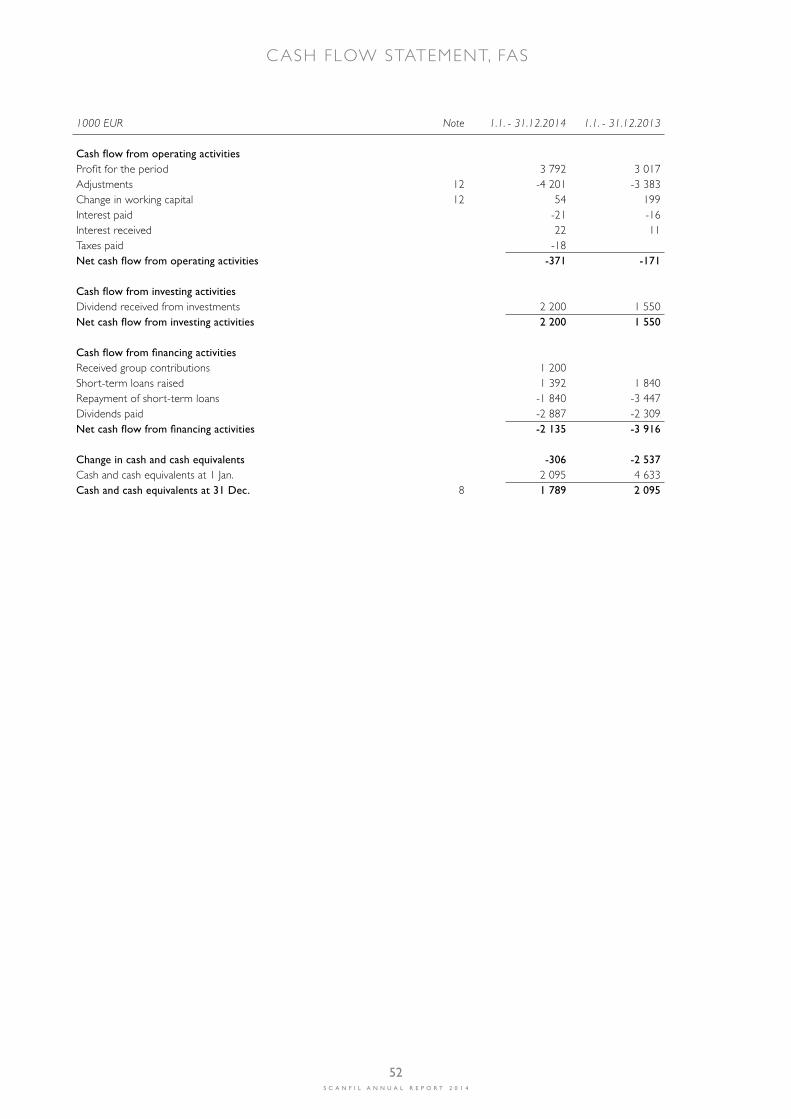
C ASH FLOW STATEMENT, FAS
1000 EUR Note 1.1. - 31.12.2014 1.1. - 31.12.2013
Cashflowfromoperatingactivities Profit for the period 3 792 3 017Adjustments 12 -4 201 -3 383Change in working capital 12 54 199Interest paid -21 -16Interest received 22 11Taxes paid -18 Netcashflowfromoperatingactivities -371 -171 Cashflowfrominvestingactivities Dividend received from investments 2 200 1 550Netcashflowfrominvestingactivities 2200 1550 Cashflowfromfinancingactivities Received group contributions 1 200 Short-term loans raised 1 392 1 840Repayment of short-term loans -1 840 -3 447Dividends paid -2 887 -2 309Netcashflowfromfinancingactivities -2135 -3916 Changeincashandcashequivalents -306 -2537Cash and cash equivalents at 1 Jan. 2 095 4 633Cashandcashequivalentsat31Dec. 8 1 789 2 095
52S C A N F I L A N N U A L R E P O R T 2 0 1 4
53S C A N F I L A N N U A L R E P O R T 2 0 1 4

C ASH FLOW STATEMENT, FAS NOTES TO THE F INANCIAL STATEMENTS, FAS
Companysaccountingpolicies Scanfil plc is a Finland-based public limited company domiciled in Sievi. Scanfil plc was established in the demerger of Sievi Capital plc on 1 January 2012. Scanfils plc’s shares are quoted on NASDAQ OMX Helsinki Oy. The financial statements of Scanfil plc have been prepared in accordance with the Finnish Accounting Act and other regulations in force in Finland (FAS). The consolidated financial statements have been prepared under the IFRS. The parent company’s financial statements comply with IFRS principles wherever possible. With regard to Scanfil plc, the mainly Finnish accounting practice and IFRS-compliant accounting policies are congruent with each other, so the key accounting policies can be read from the accounting policies for consolidated financial statements. 1. PERSONNEL ExPENSES, 1000 EuR 2014 2013 Salaries, wages and fees 831 482Pension costs 149 70Other indirect employee expenses 28 12Total 1008 564 The pension costs are based on defined-contribution schemes. Management’s employee benefits presented in Note 14. Averagenumberofemployeesduringtheperiod Clerical employees 9 4Total 9 4 2. OTHER OPERATING ExPENSES, 1000 EuR 2014 2013
Otheroperatingexpensesincludethefollowing significantexpenseitems: Other operating expenses 207 207Total 207 207 Auditor’sremuneration Auditor’s remunerations of the Chartered Accountants 17 21Other services 1 4Total 19 25 3. FINANCING INCOME AND ExPENSES, 1000 EuR 2014 2013 IncomefromsharesfromGroupcompanies 3800 2200 Otherinterestandfinancialincome To group companies 21 16 Other 1 0Total 22 16 Interestexpensesandotherfinancialexpenses To group companies Other -21 -15Total -21 -15 Totalfinancialincomeandexpenses 3801 2201 Itemsotherinterestandfinancialincomeandinterestexpensesand otherfinancialexpensesincludesexchangerategainsandlosses(net) 0 0
52S C A N F I L A N N U A L R E P O R T 2 0 1 4
53S C A N F I L A N N U A L R E P O R T 2 0 1 4

NOTES TO THE F INANCIAL STATEMENTS, FAS
4. ExTRAORDIANRy ITEMS, 1000 EuR 2014 2013 Group contributions from Scanfil EMS Oy 400 1 200Total 400 1200 5. INCOME TAxES, 1000 EuR 2014 2013 Income taxes from extra ordinary items 80 294Income taxes from actual operations -80 -276Total 0 18
6. HOLDINGS IN GROuP COMPANIES, 1000 EuR 2014 2013
Total at beginning of period 12 621 12 621Totalatendofperiod 12621 12621Carryingamountat31Dec. 12621 12621 Parent Parent Group company companyGroup companies Domicile share % share % book value
Scanfil EMS Oy Finland 100 100 12 621 12 621
7. RECEIVABLES FROM GROuP COMPANIES, 1000 EuR 2014 2013
Short-termreceivables Dividend receivable from Scanfil EMS Oy 3 800 2 200Contribution receivable from Scanfil EMS Oy 400 1 200Other receivables from Scanfil EMS Oy 85 59Total 4285 3459
8. CASH AND CASH EquIVALENT, 1000 EuR 2014 2013 Cash and bank balances 1 789 2 095Total 1789 2095
9. EquITy, 1000 EuR 2014 2013
Sharecapital Share capital at 1 Jan. 2 000 2 000Sharecapitalat31Dec. 2000 2000 Totalrestrictedshareholder’sequity 2000 2000 Reserveforinvestedunrestrictedequityfund Reserve for invested unrestricted equity fund at 1 Jan. 10 721 10 721Reserveforinvestedunrestrictedequityfundat31Dec. 10721 10721
54S C A N F I L A N N U A L R E P O R T 2 0 1 4
55S C A N F I L A N N U A L R E P O R T 2 0 1 4

NOTES TO THE F INANCIAL STATEMENTS, FAS NOTES TO THE F INANCIAL STATEMENTS, FAS
2014 2013
Retainedearnings Retained earning at 1 Jan. 3 246 2 539 Paid dividends -2 887 -2 309 Retainedearningsat31Dec. 360 229 Profitfortheperiod 3792 3017 Totalunrestrictedequity 14873 13967 Totalequity 16873 15967 Calculationofdistributablefundsat31Dec. Reserve for invested unrestricted equity fund 10 721 10 721Retained earnings 360 229 Profit for the period 3 792 3 017Total 14873 13967
10. LIABILITIES TO GROuP COMPANIES, 1000 EuR 2014 2013
Short-termliabilitiestoGroupcompanies Trade payables to Group 1 5 Liquid assets of the Group account 1 392 1 840Total 1393 1845
11. ACCRuED LIABILITIES, 1000 EuR 2014 2013
Themostsignificantitemsincludedinaccruedliabilities Employee expenses 368 272Other accrued liabilities 11 28Total 379 300
12. CASH FLOw STATEMENT ADjuSTMENTS, 1000 EuR 2014 2013
Adjustments Financial income and expenses -3 801 -2 201Other adjustments -400 -1 182Total -4201 -3383 Changesinworkingcapital Inc(-)/dec(+) in short-term non-interest-bearing receivables -24 -64Inc(+)/dec(-) in short-term non-interest-bearing liabilities 79 263Totalchangeinworkingcapital 54 199
13. COMMITMENTS AND CONTINGENCIES, EuR Scanfil Plc has a credit limit associated with the Group account for EUR 5.0 million, which Scanfil EMS Oy can use and for which it has provi-ded security. Scanfil plc has granted Nordea Bank Finland Plc an absolute guarantee for the payment of Scanfil EMS Oy’s loan of originally EUR 40 million and the resulting obligations to pay. Capital of the loan on Scanfil EMS Oy’ balance sheet (FAS) on 31 December 2014 is EUR 8.9 million. Scanfil Plc has granted Nordea Bank Finland Plc an absolute guarantee for the payment of Group companies Scanfil Kft´s 1.0 million and Scanfil GmbH´s 2.0 million credit limits. Scanfil Plc has also granted Siemens Finance GmbH 0.4 million for Scanfil GmbH´s leasing liabilities. 54
S C A N F I L A N N U A L R E P O R T 2 0 1 4
55S C A N F I L A N N U A L R E P O R T 2 0 1 4

14. MANAGEMENT’S EMPLOyMENT-RELATED BENEFITS
2014 2013
Salariesandothershort-termemployeebenefits,1000EUR
SalariesandbonusesofthePresident,1000EUR Petteri Jokitalo since 1 April 2013 255 93Harri Takanen up to 31 March 2013 62 SalariesandbonusesoftheBoardmembers,1000EUR Jorma J. Takanen 18 17Jarkko Takanen 18 17Harri Takanen since 18 April 2013 24 15Riitta-Liisa Kotilainen since 18 April 2013 18 11Tuomo Lähdesmäki up to 24 February 2014 3 17Christer Härkönen since 8 April 2014 12 Päivi Marttila up to 18 April 2013 6TotalsalariesandbonusesoftheBoardmembers 92 83
NOTES TO THE F INANCIAL STATEMENTS, FAS
56S C A N F I L A N N U A L R E P O R T 2 0 1 4
57S C A N F I L A N N U A L R E P O R T 2 0 1 4

NOTES TO THE F INANCIAL STATEMENTS, FAS SHARES AND SHAREHOLDERS
Sharesandsharecapital
Scanfil plc has a total of 57,730,439 shares. The company’s registered share capital is EUR 2,000,000. The company has one series of shares, and each share entitles the holder to one vote and an equal right to receive dividends. Scanfil plc’s shares are quoted on NASDAQ OMX Hel-sinki Ltd. The shares have been publicly traded since 1 January 2012. The trading code of the shares is SCL1V. The shares are included in the book-entry securities system maintained by Euroclear Finland Ltd.
Board’sauthorisationsinforce
At the end of the financial period, the Board of Directors of Scanfil plc did not have any share issue authorisations or au-thorisations to issue convertible bonds or bonds with warrants. The Extraordinary General Meeting on 19 April 2012 au-thorised the Board of Directors to decide on the transfer of treasury shares in accordance with the Board’s proposals. The authorisation is valid for three years. The Annual General Meeting on 18 April 2013 author-ised the Board of Directors to decide on the issuance of op-tion rights to certain key employees of the company and its subsidiaries. The maximum total number of option rights is 750,000, and they entitle the key employees to subscribe for a maximum of 750,000 of the company’s new shares or shares in its possession. The Annual General Meeting on 8 April 2014 authorised the Board of Directors to decide on the acquisition of treas-ury shares with distributable funds. The authorisation is valid for 18 months.
Ownshares
The company does not own its own shares.
Dividenddistributionpolicy
The company aims to pay a dividend annually. The level of divi-dends paid and the date of payment are affected, inter alia, by the Group’s result, financial position, need for capital and oth-er possible factors. The aim is to distribute approximately one-third of the Group’s annual profit as dividend to shareholders.
Dividend
The Board of Directors proposes to the Annual General Meeting that a dividend of EUR 0.07 be paid per share, for a total of EUR 4,041,130.73.
Sharepricedevelopment,tradingandmarketvalue
In 2014, the number of Scanfil plc shares traded on NASDAQ OMX Helsinki Ltd was 5,131,328, which accounts for 8.9% of all shares. The value of shares traded was EUR 10.0 million and the average price EUR 1.95. Market capitalisation was EUR 142,0 million at the end of 2014. The highest trading price was EUR 2.74 and the lowest EUR 1.30. The closing price was EUR 2.46.
56S C A N F I L A N N U A L R E P O R T 2 0 1 4
57S C A N F I L A N N U A L R E P O R T 2 0 1 4
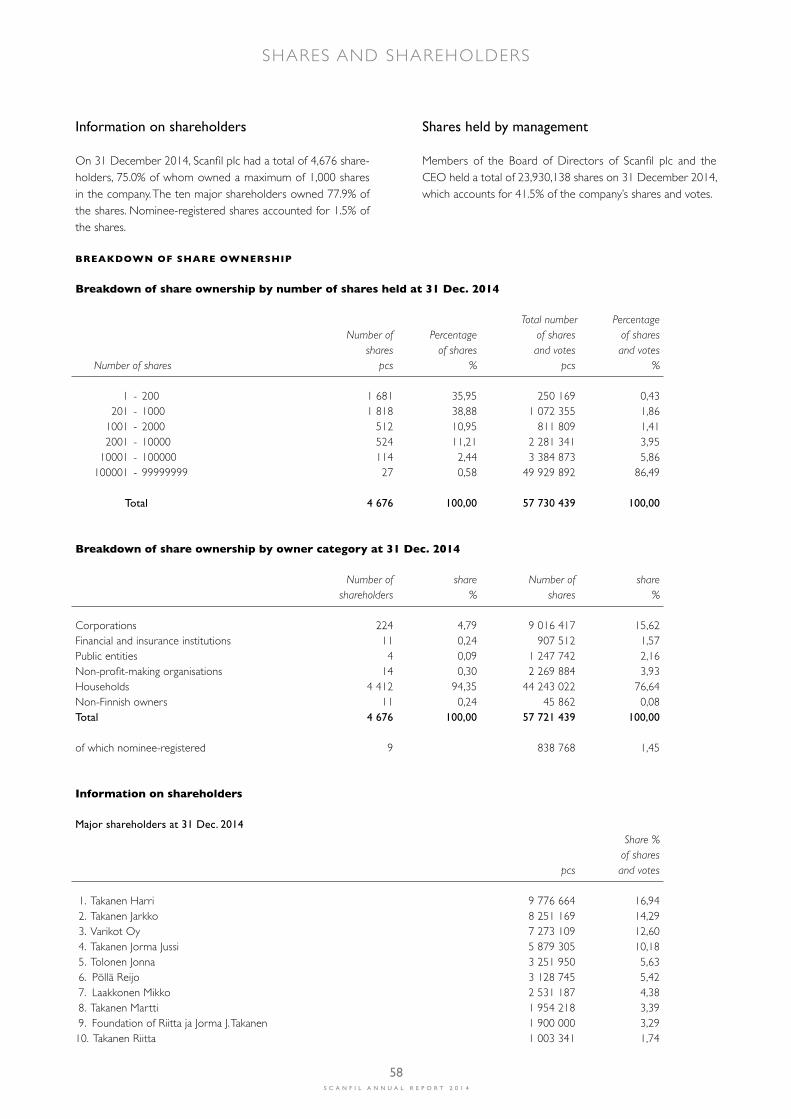
SHARES AND SHAREHOLDERS
Informationonshareholders
On 31 December 2014, Scanfil plc had a total of 4,676 share-holders, 75.0% of whom owned a maximum of 1,000 shares in the company. The ten major shareholders owned 77.9% of the shares. Nominee-registered shares accounted for 1.5% of the shares.
Sharesheldbymanagement
Members of the Board of Directors of Scanfil plc and the CEO held a total of 23,930,138 shares on 31 December 2014, which accounts for 41.5% of the company’s shares and votes.
BREAkDOwN OF SHARE OwNERSHIP Breakdown of share ownership by number of shares held at 31 Dec. 2014 Total number Percentage Number of Percentage of shares of shares shares of shares and votes and votes Number of shares pcs % pcs % 1 - 200 1 681 35,95 250 169 0,43 201 - 1000 1 818 38,88 1 072 355 1,86 1001 - 2000 512 10,95 811 809 1,41 2001 - 10000 524 11,21 2 281 341 3,95 10001 - 100000 114 2,44 3 384 873 5,86 100001 - 99999999 27 0,58 49 929 892 86,49 Total 4676 100,00 57730439 100,00
Breakdown of share ownership by owner category at 31 Dec. 2014 Number of share Number of share shareholders % shares % Corporations 224 4,79 9 016 417 15,62Financial and insurance institutions 11 0,24 907 512 1,57Public entities 4 0,09 1 247 742 2,16Non-profit-making organisations 14 0,30 2 269 884 3,93Households 4 412 94,35 44 243 022 76,64Non-Finnish owners 11 0,24 45 862 0,08Total 4676 100,00 57721439 100,00 of which nominee-registered 9 838 768 1,45
Information on shareholders Majorshareholdersat31Dec.2014 Share % of shares pcs and votes 1. Takanen Harri 9 776 664 16,94 2. Takanen Jarkko 8 251 169 14,29 3. Varikot Oy 7 273 109 12,60 4. Takanen Jorma Jussi 5 879 305 10,18 5. Tolonen Jonna 3 251 950 5,63 6. Pöllä Reijo 3 128 745 5,42 7. Laakkonen Mikko 2 531 187 4,38 8. Takanen Martti 1 954 218 3,39 9. Foundation of Riitta ja Jorma J. Takanen 1 900 000 3,2910. Takanen Riitta 1 003 341 1,74
58S C A N F I L A N N U A L R E P O R T 2 0 1 4
59S C A N F I L A N N U A L R E P O R T 2 0 1 4

BOARD OF DIRECTORS’ PROPOSAL FOR THE DISTRIBUTION OF PROFIT
BoardofDirectors’ProposalfortheDistributionofProfit
The parent company’s distributable funds total EUR 14,873,027.32 euro.
The Board of Directors proposes to the Annual General Meeting that a dividend of EUR 0.07 per share be paid for the financial period ended 31 December 2014, for a total of EUR 4,041,130.73.
BoardofDirectors’ProposalfortheDistributionofProfit
Sievi, 24 February 2015
HarriTakanen JormaJ.TakanenChairman of the Board
JarkkoTakanen Riitta-LiisaKotilainen
ChristerHärkönen PetteriJokitalo CEO
58S C A N F I L A N N U A L R E P O R T 2 0 1 4
59S C A N F I L A N N U A L R E P O R T 2 0 1 4

TotheAnnualGeneralMeetingofScanfilplc
We have audited the accounting records, the financial state-ments, the report of the Board of Directors, and the adminis-tration of Scanfil plc for the year ended 31 December, 2014. The financial statements comprise the consolidated statement of financial position, statement of comprehensive income, statement of changes in equity and statement of cash flows, and notes to the consolidated financial statements, as well as the parent company’s balance sheet, income statement, cash flow statement and notes to the financial statements.
Responsibility of the Board of Directors and the Managing Director
The Board of Directors and the Managing Director are re-sponsible for the preparation of consolidated financial state-ments that give a true and fair view in accordance with Inter-national Financial Reporting Standards (IFRS) as adopted by the EU, as well as for the preparation of financial statements and the report of the Board of Directors that give a true and fair view in accordance with the laws and regulations govern-ing the preparation of the financial statements and the report of the Board of Directors in Finland. The Board of Directors is responsible for the appropriate arrangement of the control of the company’s accounts and finances, and the Managing Di-rector shall see to it that the accounts of the company are in compliance with the law and that its financial affairs have been arranged in a reliable manner.
Auditor’s Responsibility
Our responsibility is to express an opinion on the financial statements, on the consolidated financial statements and on the report of the Board of Directors based on our audit. The Auditing Act requires that we comply with the requirements of professional ethics. We conducted our audit in accordance with good auditing practice in Finland. Good auditing prac-tice requires that we plan and perform the audit to obtain reasonable assurance about whether the financial statements and the report of the Board of Directors are free from mate-rial misstatement, and whether the members of the Board of Directors of the parent company or the Managing Director are guilty of an act or negligence which may result in liability in damages towards the company or have violated the Limited Liability Companies Act or the articles of association of the company.
An audit involves performing procedures to obtain audit evidence about the amounts and disclosures in the financial statements and the report of the Board of Directors. The pro-cedures selected depend on the auditor’s judgment, including the assessment of the risks of material misstatement, wheth-er due to fraud or error. In making those risk assessments, the auditor considers internal control relevant to the entity’s preparation of financial statements and report of the Board of Directors that give a true and fair view in order to design au-dit procedures that are appropriate in the circumstances, but not for the purpose of expressing an opinion on the effective-ness of the company’s internal control. An audit also includes evaluating the appropriateness of accounting policies used and the reasonableness of accounting estimates made by manage-ment, as well as evaluating the overall presentation of the fi-nancial statements and the report of the Board of Directors. We believe that the audit evidence we have obtained is suffi-cient and appropriate to provide a basis for our audit opinion.
Opinion on the consolidated financial statements
In our opinion, the consolidated financial statements give a true and fair view of the financial position, financial perfor-mance, and cash flows of the group in accordance with Inter-national Financial Reporting Standards (IFRS) as adopted by the EU.
Opinion on the company’s financial statements and the report of the Board of Directors
In our opinion, the financial statements and the report of the Board of Directors give a true and fair view of both the con-solidated and the parent company’s financial performance and financial position in accordance with the laws and regulations governing the preparation of the financial statements and the report of the Board of Directors in Finland. The information in the report of the Board of Directors is consistent with the information in the financial statements.
Oulu, March 9, 2015
KPMG Oy Ab
AnttiKääriäinenAuthorised Public Accountant
AUDITOR’S REPORT
60S C A N F I L A N N U A L R E P O R T 2 0 1 4
61S C A N F I L A N N U A L R E P O R T 2 0 1 4
AUDITOR’S REPORT CORPORATE GOVERNANCE STATEMENT 2014
Scanfil plc is a publicly listed company, managed in accordance with the company’s Articles of Association, the Finnish Compa-nies Act, and other legislation relating to the company. In addition, the company follows the Finnish Corporate Governance Code issued by the Securities Market Association on 15 June 2010, but issues exceptions to the following recommendations as a result of an evaluation of the independence of the members of the Board: Recommendation 14 (Number of independent mem-bers), Recommendation 26 (Independence of the members of the audit committee) and Recommendation 29 (Members of the nomination committee and their appointment). This statement has been reviewed by Scanfil plc’s Board of Directors. Scanfil plc’s auditing firm has verified that the sum-mary description of the internal control and risk management associated with the financial reporting process is consistent with the financial statements. This Corporate Governance Statement is available on the company Website www.scanfil.com under Investors, and it complies with recommendation 54 of the Finnish Corporate Governance Code. The Finnish Corporate Governance Code is available to the public at www.cgfinland.fi.
BOARDOFDIRECTORS
Under the Companies Act, the Board of Directors is responsi-ble for the management of the company and proper organisa-tion of operations. The members of the Board of Directors are elected by the Annual General Meeting. According to the Articles of Association, Scanfil plc’s Board of Directors shall include a minimum of three and a maximum of seven regu-lar members. The Board of Directors elects a Chairman from among its members. The Board of Directors is responsible for deciding on the business strategy, significant matters related to investments, organisation and finance, as well as supervis-ing the company’s management and operations. The Board of Directors shall also ensure that supervision of the company’s accounts and asset management is properly organised.
Board composition
Scanfil plc’s General Meeting held on 8 April 2014 elected the following Board members:
HarriTakanenChairman of the Board of Directors Born 1968, M.Sc. (Engineer-ing). Member of the Board of Directors of Scanfil plc since 18 April 2013. CEO of Sievi Capital plc. Not independent of the company and significant shareholders.
JormaJ.TakanenMember of the Board of Directors since 1 January 2012. Born 1946, B.Sc. (Chemistry). Professional Board Member. Not in-dependent of the company and significant shareholders.
RiittaKotilainenMember of the Board of Directors since 18 April 2013. Riitta Kotilainen (born 1958), President and CEO of E.Kotilainen Oy
and Varikot Oy. Not independent of the company and major shareholders.
JarkkoTakanenMember of the Board of Directors since 1 January 2012. Born 1967, B.Sc. (Production Economics), holds a Commercial Col-lege Diploma in Management Accountancy. Managing Director, Jussi Capital Oy. Independent of the company.
ChristerHärkönenMember of the Board since 8 April 2014 b. 1957, M.Sc. (Tech.) Member of the Board and Facilitator for the Future at Fibox Oy Ab. Independent of the company and major shareholders.
The term of office of the Board members expires at the close of the first Annual General Meeting following the one at which they were elected.
Independence of Board members
Based on an evaluation of independence carried out by the Board, one of its members, Christer Härkönen, is independ-ent of the company and its major shareholders, and one of its members, Jarkko Takanen, is independent of the company. Harri Takanen, a Board member not independent of the company, is the company’s largest shareholder. Jarkko Takanen is its second largest shareholder, and Jorma J. Takanen is its fourth largest shareholder. Riitta Kotilainen is President and CEO of Varikot Oy, which is Scanfil’s third largest shareholder. In ad-dition, she has a part-time employment contract with Scanfil EMS Oy. Due to the entrepreneurship and financial risk related to ownership, it is justifiable that the members not independent of the company and major shareholders attend to the share-holders’ interests in the Board and its committees. In addi-tion, Jorma J. Takanen, Jarkko Takanen and Harri Takanen have extensive experience in the contract manufacturing business. Through their work in the Board and its committees, this expe-rience can be used for the benefit of the company as a whole and for all of its shareholders.
Activity of the Board
The Board of Directors had a total of 14 meetings in 2014, some of which were telephone meetings. The average attend-ance rate at Board meetings was 97%. The duties and responsibilities of the Board of Directors of Scanfil plc are defined based on the Limited Liability Compa-nies Act, other applicable legislation, the Articles of Association, good governance recommendations and the Board’s charter. The Board carries out an annual review of its operations and regular reviews of the work of the CEO and the Management Team. The main duties of the Board of Directors of Scanfil plc include the following:
• Confirming the company’s business strategy and monitoring its implementation
60S C A N F I L A N N U A L R E P O R T 2 0 1 4
61S C A N F I L A N N U A L R E P O R T 2 0 1 4
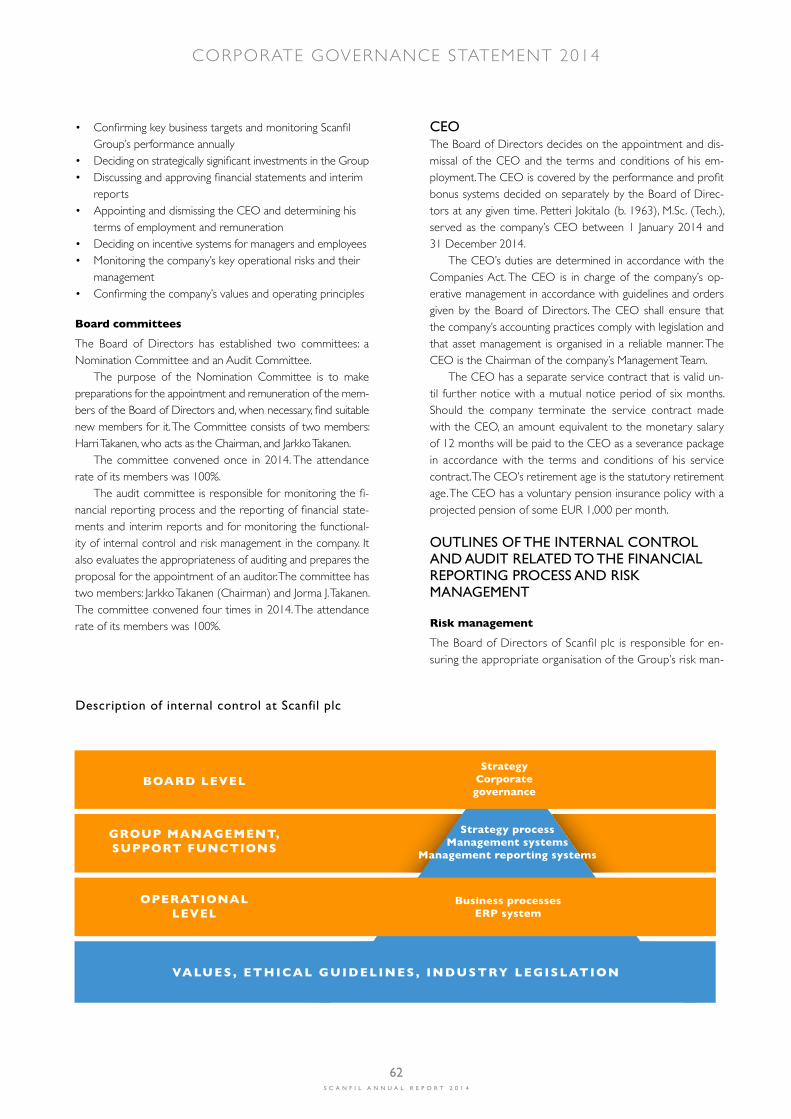
CORPORATE GOVERNANCE STATEMENT 2014
• Confirming key business targets and monitoring Scanfil Group’s performance annually • Deciding on strategically significant investments in the Group • Discussing and approving financial statements and interim reports • Appointing and dismissing the CEO and determining his terms of employment and remuneration • Deciding on incentive systems for managers and employees • Monitoring the company’s key operational risks and their management • Confirming the company’s values and operating principles
Board committees
The Board of Directors has established two committees: a Nomination Committee and an Audit Committee. The purpose of the Nomination Committee is to make preparations for the appointment and remuneration of the mem-bers of the Board of Directors and, when necessary, find suitable new members for it. The Committee consists of two members: Harri Takanen, who acts as the Chairman, and Jarkko Takanen. The committee convened once in 2014. The attendance rate of its members was 100%. The audit committee is responsible for monitoring the fi-nancial reporting process and the reporting of financial state-ments and interim reports and for monitoring the functional-ity of internal control and risk management in the company. It also evaluates the appropriateness of auditing and prepares the proposal for the appointment of an auditor. The committee has two members: Jarkko Takanen (Chairman) and Jorma J. Takanen. The committee convened four times in 2014. The attendance rate of its members was 100%.
CEOThe Board of Directors decides on the appointment and dis-missal of the CEO and the terms and conditions of his em-ployment. The CEO is covered by the performance and profit bonus systems decided on separately by the Board of Direc-tors at any given time. Petteri Jokitalo (b. 1963), M.Sc. (Tech.), served as the company’s CEO between 1 January 2014 and 31 December 2014. The CEO’s duties are determined in accordance with the Companies Act. The CEO is in charge of the company’s op-erative management in accordance with guidelines and orders given by the Board of Directors. The CEO shall ensure that the company’s accounting practices comply with legislation and that asset management is organised in a reliable manner. The CEO is the Chairman of the company’s Management Team. The CEO has a separate service contract that is valid un-til further notice with a mutual notice period of six months. Should the company terminate the service contract made with the CEO, an amount equivalent to the monetary salary of 12 months will be paid to the CEO as a severance package in accordance with the terms and conditions of his service contract. The CEO’s retirement age is the statutory retirement age. The CEO has a voluntary pension insurance policy with a projected pension of some EUR 1,000 per month.
OUTLINES OF THE INTERNAL CONTROL ANDAUDITRELATEDTOTHEFINANCIALREPORTINGPROCESSANDRISKMANAGEMENT
Risk management
The Board of Directors of Scanfil plc is responsible for en-suring the appropriate organisation of the Group’s risk man-
BOARD LEVEL
GROuP MANAGEMENT,SuPPORT FuNCTIONS
Business processesERP system
OPERATIONALLEVEL
VALuES , ETHICAL GuIDELINES , INDuSTRy LEGISLATION
DescriptionofinternalcontrolatScanfilplc
Strategy processManagement systems
Management reporting systems
StrategyCorporate governance
62S C A N F I L A N N U A L R E P O R T 2 0 1 4
63S C A N F I L A N N U A L R E P O R T 2 0 1 4

100 %
Scanfil plc
Scanfil EMS Oy
Scanfil (Suzhou)Co. Ltd.
Scanfil (Hangzhou)
Co. Ltd.
Scanfil kft
RozáliaInvest kft
Scanfil Oü
100 % 100 % 100 % 100 % 100 % 100 %
ScanfilGmbH
CORPORATE GOVERNANCE STATEMENT 2014
agement and internal control and audit. Risk management is based on a risk management policy approved by the Board, aiming to manage risks in a com-prehensive and proactive manner. The assessment of risks is part of the annual strategy and business planning process. There is no separate risk management organisation; risk management is incorporated into the business processes and the management system. Risk management aims to ob-serve and analyse factors that might have a negative im-pact on the achievement of the company’s goals and to take measures to mitigate or completely eliminate the risks. The operative units report on business risks in accordance with the management and reporting system.
Internal control
Scanfil’s internal control is a continuous process to ensure profitable and uninterrupted operation. Control aims to mini-mise risks by ensuring the reliability of reporting and compli-ance with laws and regulations. Internal control is based on the Group’s shared values, eth-ical guidelines and industry legislation from which the operating principles and guidelines followed are derived. The guidelines cover procedures for core operations. Group and unit man-agement hold the responsibility for the company’s internal control system. Internal control forms an active part of the company’s management and administration. The Group’s oper-ational management holds the responsibility for developing the harmonised business processes included in the control system.
The Group’s financial administration supports and coordinates the financial management of the Group. The controls contained in Scanfil’s operating processes form the basis of the company’s financial control. They enable the company to swiftly identify and react to any deviations from the norm. The management’s monthly reporting is a fun-damental part of financial control. It includes rolling forecasting, the result of business operations carried out, and an analysis of the differences between the forecast and actual result. The indicators monitored in monthly reporting have been set so as to support the achievement of shared Group-level and unit-specific targets and to identify issues that require control meas-ures. An auditing firm supports the performance of financial control. The interpretation and application of accounting standards is carried out centrally by the Group’s financial administration. These standards form the basis for the Group’s shared rec-ognition principles and reporting and accounting standards. In order to ensure reliable financial reporting, core functions are conducted using a globally harmonised ERP system and shared reporting tools. The use of standardised tools enables continu-ous control and successful change management.
Internal audit
Considering the Group’s structure and extent, the compa-ny does not have a separate internal audit organisation. The company’s controller function is responsible for the duties of internal audit, reporting regularly to the CEO and the Board of Directors.
ThegroupstructureofScanfilplc2014
62S C A N F I L A N N U A L R E P O R T 2 0 1 4
63S C A N F I L A N N U A L R E P O R T 2 0 1 4

STA
TII
VI.
FI
Yritystie685410SIEVIFINLAND
Tel.+35884882111Fax+35884882250
www.scanfil.com