scan inter public company limited - dcs-digital.com · system installation of ngv ... pipeline...
TRANSCRIPT

Scan Inter Public Company Limited
opportunity day
16 March 2015
1

2
Contents
I
II
Business Overview
Financial

I. Business Overview
3

4
Major Developments
Strong relationship with Thailand’s
major gas supplier and distributor
and global partners 2003-2009
Expansion into fully integrated of
gas-related business
2010-2014
Early establishment in Thailand
energy market
1988-2002
Introductory to the Market
Being Recognized in Thailand as Gas-Related
Industry with Global Partners
Become One of the Leaders in the Country
Gas-Related Business
“One of the leaders in Thai energy business with over 27 years of experience in gas-related business"our vision is to become the leader in energy technology in Asia Pacific
Initiate iCNG into Thai market
2015-PresentBecome the first trader & leader in iCNG
business

5
Natural Gas Pipeline

6
Natural Gas-Related Business Overview
Distribution Pipeline
Private Mother Station (PMS) Daughter Stations
Conventional Station
Car, Bus and Truck
Design, Construction,
Installation and Maintenance
NGV Station and Related Gas
System
Installation of NGV
and LPG Conversion
System in Vehicles
Other NGV Stations
NGV Station
Natural Gas
Transportation (TPL)
3
2
4
1
5

7
Design, Construction, Installation and Maintenance
NGV Station and Related Gas System

8
Natural Gas-Related Business Overview
Distribution Pipeline
Private Mother Station (PMS) Daughter Stations
Conventional Station
Car, Bus and Truck
Design, Construction,
Installation and Maintenance
NGV Station and Related Gas
System
Installation of NGV
and LPG Conversion
System in Vehicles
Other NGV Stations
NGV Station
Natural Gas
Transportation (TPL)
3
2
4
1
5

9
Private Mother Station (PMS)

10
Natural Gas-Related Business Overview
Distribution Pipeline
Private Mother Station (PMS) Daughter Stations
Conventional Station
Car, Bus and Truck
Design, Construction,
Installation and Maintenance
NGV Station and Related Gas
System
Installation of NGV
and LPG Conversion
System in Vehicles
Other NGV Stations
NGV Station
Natural Gas
Transportation (TPL)
3
2
4
1
5

11
Natural Gas Transportation (TPL)

12
Natural Gas-Related Business Overview
Distribution Pipeline
Private Mother Station (PMS) Daughter Stations
Conventional Station
Car, Bus and Truck
Design, Construction,
Installation and Maintenance
NGV Station and Related Gas
System
Installation of NGV
and LPG Conversion
System in Vehicles
Other NGV Stations
NGV Station
Natural Gas
Transportation (TPL)
3
2
4
1
5

13
Private Brand Station (PBS)

14
Natural Gas-Related Business Overview
Distribution Pipeline
Private Mother Station (PMS) Daughter Stations
Conventional Station
Car, Bus and Truck
Design, Construction,
Installation and Maintenance
NGV Station and Related Gas
System
Installation of NGV
and LPG Conversion
System in Vehicles
Other NGV Stations
NGV Station
Natural Gas
Transportation (TPL)
3
2
4
1
5
15
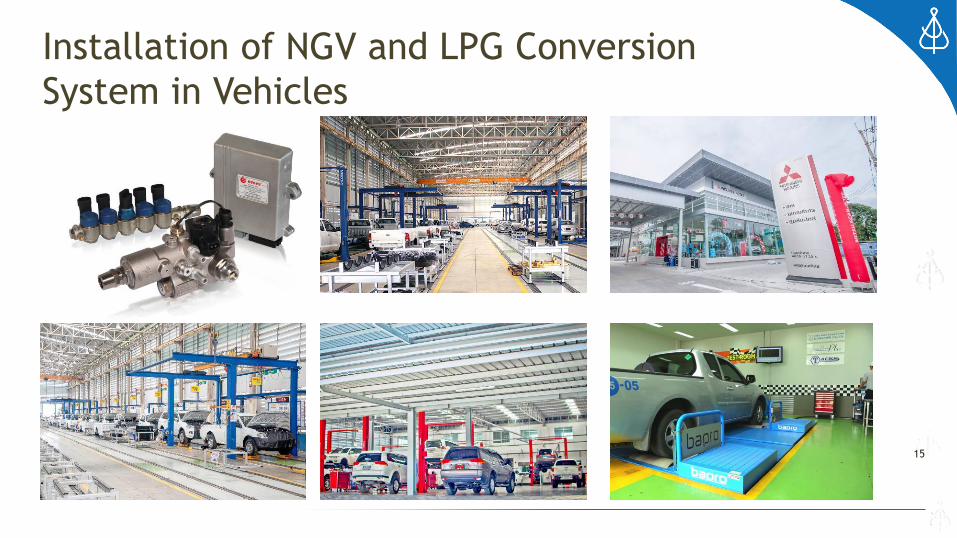
Installation of NGV and LPG Conversion
System in Vehicles

16
Future Growth NGV
Current NGV price is 13.00 Baht
PRICE
TON/DAY
0
1000
2000
3000
4000
5000
6000
7000
8000
9000
2546 2547 2548 2549 2550 2551 2552 2553 2554 2555 2556 2557
7 7.5 8.5 8.5 8.5 8.5 8.5 8.5 8.5 10.5 10.5 12
16 28 43 102 166 303 391 428 469 483 490 49738 85 153 260
652
2057
3740
5055
6415
77338542 8809
NGV Growth
PRICE STATION TON/DAY

17
Natural Gas-Related Business Overview
Distribution Pipeline
Private Mother Station (PMS) Daughter Stations
Conventional Station
Car, Bus and Truck
Design, Construction,
Installation and Maintenance
NGV Station and Related Gas
System
Installation of NGV
and LPG Conversion
System in Vehicles
Other NGV Stations
NGV Station
Natural Gas
Transportation (TPL)
Compressor Station for Project CNG for Industry
Factory
Natural gas
transportation
Future Project
3
2
4
1
5
6

18
Pressure Reducing System (PRS)
5
19
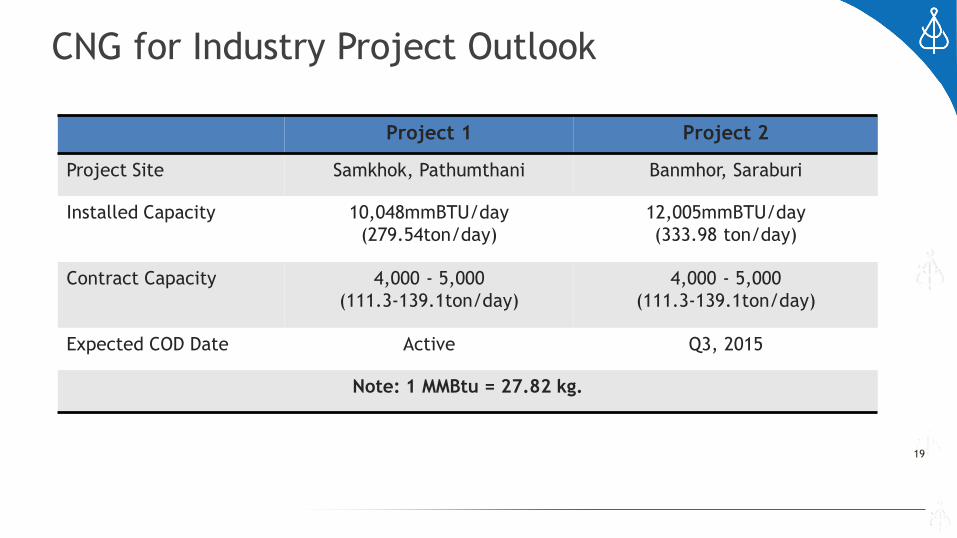
CNG for Industry Project Outlook
5
Project 1 Project 2
Project Site Samkhok, Pathumthani Banmhor, Saraburi
Installed Capacity 10,048mmBTU/day
(279.54ton/day)
12,005mmBTU/day
(333.98 ton/day)
Contract Capacity 4,000 - 5,000
(111.3-139.1ton/day)
4,000 - 5,000
(111.3-139.1ton/day)
Expected COD Date Active Q3, 2015
Note: 1 MMBtu = 27.82 kg.

20
iCNG VS Fuel Oil Price VS LPG Price
0.00
100.00
200.00
300.00
400.00
500.00
600.00
700.00
2012 2013 2014
iCNG Factor
FO
LPG
• iCNG is the price formula which is directly
related to Singapore Fuel Oil price and
exchange rate of US/THB and inversely
related to the consumption of each customer
• FO is the average fuel oil price in Thailand
SCN has researched
• LPG is the average LPG for industry price in
Thailand SCN has researched
• The graph shows that iCNG is the lowest cost of all three fuels

21
iCNG Entry Barrier
5
Pipeline Compressor Logistic PRS Factory
iCNG Mother Station
Need to be familiar with CNG equipment CNG compressor & high pressure equipment.
SCN strength • Low capacity investment
due to in house production of CNG Compressor and all relate equipment
• 27 years experiences with petro station
• The first company to be involve with NGV (CNG) since it’s first introductory in Thailand
Logistic
Need to be experience with hazardous product & petroleum fuel transportation.
SCN strength • Low capital investment due
to in house production of CNG trailer
• Highly experience by being one of the first company providing CNG logistic for PTT
Decompress
Need to find a method to reduce the pressure of CNG from 3600psi to the pipeline pressure(200psi) at a continuous rate.
SCN strength • The only patent holder for
the pressure reducing system(PRS), the essential component of the iCNGproject
Catalyze
Need to understand the construction and gas utilization rules and regulation.
SCN strength • Well experienced in NGV
and petro station construction(27 years experience )

II Financial
22

23
Strong Financial Performance with Distinguished Character
Continuous Revenue Growth with Sound Profitability
Revenue Growth Gross Profit Margin & Net Profit Margin
SCN’s revenue has increased continuously from THB1,542.5M in 2011 to THB2,112M or 17.01% of CAGR
It has been driven by growth in revenue of PMS, TPL, PBS, and newly established auto dealer business in the end of 2012
The Company’s 2014 profit margin shows impressively improvement:
– Gross profit margin increases from 15.9% in 2013 to 21.9% in 2014
– Net profit margin increases from 5.0% in 2013 to 10.8% in 2014
Improvement in 2014 gross profits are due to (1) Higher utilization rate from 73.5% into 87.8% of PMS (2) High margin on a high value project under construction & MA project
Profit margin has been adversely
effect by accountingreclassification and provision on
slow moving items in 2012 - 2013
1,542.5 1,592.3
2,119.7 2,112.0
-
500.0
1,000.0
1,500.0
2,000.0
2,500.0
Mil
lion T
HB
2011 2012 2013 2014 2011 2012 2013 2014
32.5%
21.9%
15.9%
21.9%
9.7%
5.9% 5.0%
10.8%
0.0%
5.0%
10.0%
15.0%
20.0%
25.0%
30.0%
35.0%
Gross Profit Margin Net Profit Margin

24
Strong Financial Performance with Distinguished Character
Continuing Revenue Growth with Sound Profitability (Cont’)
Note (1) The figure in 2014 excludes profit from disposing solar power plant(2) On September 26, 2015, SCN signed share purchase agreement to sell99.9% of SFEE’s shares to a listed company. Consequently, SCN will no longer receive revenue and profit from solar power plant
EBITDA Growth Net Profit Growth
Since 2012 EBITDA and net profit have risen substantially
SCN’s EBITDA has risen from THB303.7M to THB464.9M in 2013 or
23.7% of CAGR
Since 2012 SCN’s net profit, excluding profit from disposing solar power plant, has substantially increased from THB94.1mm to THB241.2mm in 2014 or 60.1% of CAGR
It has been driven by revenue growth from PMS and TPL in 2013 – 2014 and by revenue growth & higher margin in construction & MA business in 2014
410.5
303.7
351.5
464.9
0
50
100
150
200
250
300
350
400
450
500
2011 2012 2013 2014
TH
B M
M
149.0
94.1 104.9
241.2
0.0
50.0
100.0
150.0
200.0
250.0
300.0
2011 2012 2013 2014
TH
B M

25
Strong Financial Performance with Distinguished Character
Sizable Recurring Revenue with Potential Upside on Revenue from Construction & MA Projects
Recurring Revenue Recurring Revenue vs Construction & Maintenance Revenue
Stream of recurring revenue, which is generated from PMS, TPL, NGV Retail and R&M Contracts (Repair & Maintenance),
has strongly grown from 2011 – 2014
– Recurring revenue has risen from THB383.6M in 2011 to THB837.5M in 2014 or 30% of CAGR
– Compared 2013 to 2014, recurring revenue has also increased from THB637.6M to THB837.5M, or 31.36% of growth
The healthy growth results from significantly increase demand in PMS , TPL, R&M Contracts
Recurring revenue in a range of 24.9% - 39.7% of total revenue in 2011 – 2014
Beyond the recurring revenue, SCN’s performance is considerably enhanced by performance of construction & MA business
24.9% 33.5% 30.1% 39.7%
124.7 194.1 203.3 204.9 123.3
184.0 209.5 226.1 135.6
154.8 204.5 237.7
-
-
20.3
168.8
-
100.0
200.0
300.0
400.0
500.0
600.0
700.0
800.0
900.0
2011 2012 2013 2014
NGV Retail TPL PMS R&M Contract
383.6
532.9
637.6
837.5
567.3
464.3 388.01
641.79
-
100.0
200.0
300.0
400.0
500.0
600.0
700.0
800.0
900.0
2011 2012 2013 2014
Recurring R. Construction

26
Healthy Revenue Growth
Sizable Recurring Revenue with Potential Upside on Revenue from Construction & MA Projects
Between 2011 and 2014, SCN experienced healthy revenue growth with CAGR of 17.01% driven by an increase in revenue of PMS, TPL, PBS as well as auto
dealer business which commenced its operation in December 2012
Revenue from gas related business remained the biggest source of income contributing 56.4% and 71.5% of 2013 and 2014 total revenue respectively
Total Revenue Total Revenue Structure
1,542.5 1,592.3
2,119.7 2,112.0
-
500.0
1,000.0
1,500.0
2,000.0
2,500.0
Mil
lion T
HB
2011 2012 2013 2014
89.80% 87.10%
56.40%71.50%
6.10%
32.70%
22.70%
0.20% 2.70%1.60%9.30% 5.20% 7.10% 4.20%
0.90% 1.40% 1.10% 1.60%
0%
10%
20%
30%
40%
50%
60%
70%
80%
90%
100%
2011 2012 2013 2014
Gas Related Business Auto Dealer Business Solar Power Plant
Other Business Other Revenue

27
Recovering of Gross Profit in Gas Related Business
A decline in GPM of gas related business between 2011 and 2013 resulted from
I. Accounting reclassification of depreciation expenses from administration expenses to COGS
II. Provision for slow moving inventory of THB33.13 mm in 2012 and THB24.26 mm in 2013
III. Provision for warranty of THB9.10 mm and THB2.13 mm in 2012 and 2013 respectively
IV. Rising of wage & salary according to government policy to promote minimum wage to be THB300/day
For 2014, SCN witnessed a significant improvement of GPM as the Company realized revenue from NGV cylinders installation work; a project with high
margin
Sale & Service Revenue – Gas-Related Business Gross Profit vs. GPM – Gas-Related Business
Profit margin has been adversely
effect by accounting
reclassification and provision on
slow moving items in 2012 - 2013
135.6 154.8 204.5 237.7123.3
184209.5 226.1124.7
194.1203.3 198.3
567.3464.3
408.3
810.6434.3 389.2
169.8
63.8
0
200
400
600
800
1000
1200
1400
1600
1800
2011 2012 2013 2014
TH
B M
PMS TPL
PBS Construction and Maintenanceof NGV Instruments
Installation of NGV and LPG Conversion System
1,386.4
1,195.4
1,536.51,385.2
471
311.4
216.3
377.5
34%
22.5%
18.10%
24.60%
0%
5%
10%
15%
20%
25%
30%
35%
40%
0
50
100
150
200
250
300
350
400
450
500
2011 2012 2013 2014
TH
B M
Gross Profit (LHS) GPM (RHS)

28
Most of Investment Already Incurred
The assets mainly consists of PPE, inventory and trade and other receivables
Since 2012, total assets continuously decreased. This was due mainly to a
decrease in inventory as the Company introduced Enterprise Resource
Planning (ERP) system for more efficient inventory management
On the other hand, PPE increased during 2011 to 2014 as a result of
business expansion. Particularly for 2014, SCN made an investment in
land, machinery and building for its CNG for Industry projects at Samkhok
and Banmhor
Asset Composition
CAPEX
1.0x
Liabilities Composition
2.4x 2.0x(IBD/E)
(THB M)1.4x
82.1 63.3 139.6 98.5
1215 1195.3 995.8672.2
1,093.70 1,036.90 1,148.40 1,489.70
247.1 368.7 368.7 419.10 197.5 190.8 194.5185.6
209.3 223.5 143.6
0
500
1000
1500
2000
2500
3000
3500
2011 2012 2013 2014
TH
B M
Cash InventoryPPE Trade and other receivablesFinance lease receivable Others
3,071 3,067 3,017.
62,823
332.3
206.2 231.8
434
0
50
100
150
200
250
300
350
400
450
500
2011 2012 2013 2014
TH
B M
756.71,215 958.9
538.2
528.7
478.5
483.2
326.5
506.6
341.1627.9
522.4
59.8 105.5
292.4
57.9
246.729.1
84.9
0
500
1000
1500
2000
2500
2011 2012 2013 2014
OD&ST Loan AP&Payable LT Loan Fin. Lease Others

29
Surging of Return & Sound Capital Structure
For 2014, the Company’s ROE&ROA increase to 21.6% and 7.5% respectively
D/E ratio and IBD/E ratio increased between 2011 and 2012 from an increase of long-term loan from financial institutions to support auto dealer business
and solar power plant
During 2011 to 2014, D/E ratio and IBD/E ratio continued to decrease due to repayment of overdraft, short-term loan and long-term loan from financial
institutions
D/E Ratio vs. IBD/E RatioROE & ROA
Note: (1) annualized figure, excluding profit from disposing solar power plant
17.7
11.213.1
21.6
6.1
3.2 3.4
7.5
0
5
10
15
20
25
2011 2012 2013 2014
%
ROE ROA
2.0
3.2
2.6
1.41.4
2.4
2.0
1.1
0.0
0.5
1.0
1.5
2.0
2.5
3.0
3.5
2011 2012 2013 2014
Tim
es
D/E Ratio IBD/E