scalasca: a scalable portable integrated performance
TRANSCRIPT

Scalasca:
A Scalable Portable Integrated
Performance Measurement and
Analysis Toolset
CEA Tools 2012 | Bernd Mohr
CEA Tools 2012 JSC 2
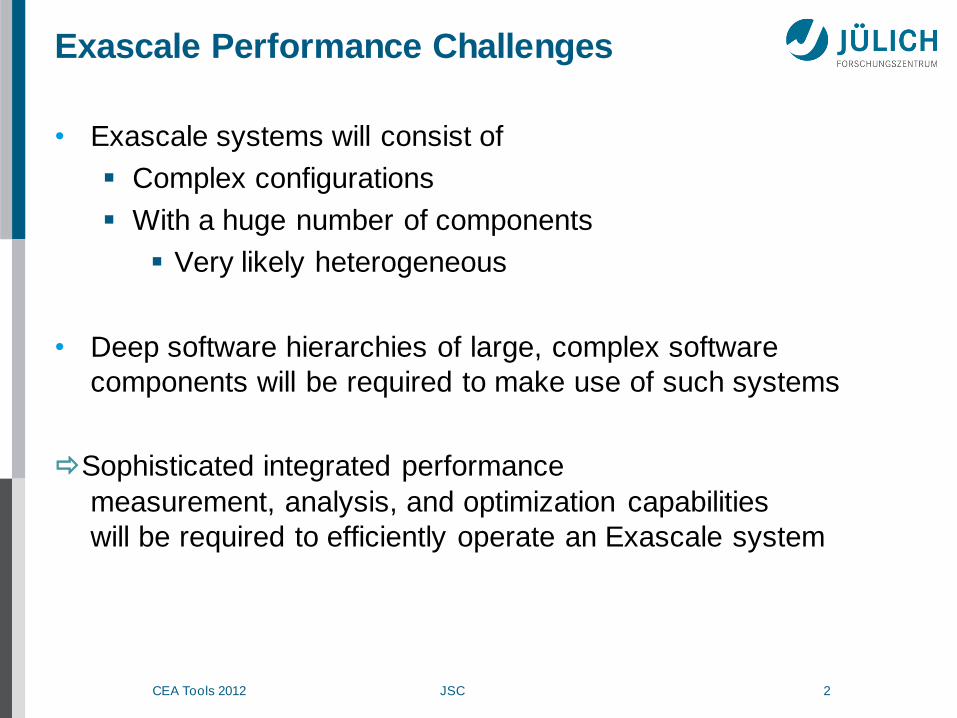
Exascale Performance Challenges
• Exascale systems will consist of
Complex configurations
With a huge number of components
Very likely heterogeneous
• Deep software hierarchies of large, complex software
components will be required to make use of such systems
Sophisticated integrated performance
measurement, analysis, and optimization capabilities
will be required to efficiently operate an Exascale system

CEA Tools 2012 JSC 3
Cross-Cutting Considerations
• Performance-aware design, development and deployment of
hardware and software necessary
• Integration with OS, compilers, middleware and runtime
systems required
• Support for performance observability in HW and SW (runtime)
needed
• Enable performance measurement and optimization in case of
HW and SW changes due to faults or power adaptation
CEA Tools 2012 JSC 4
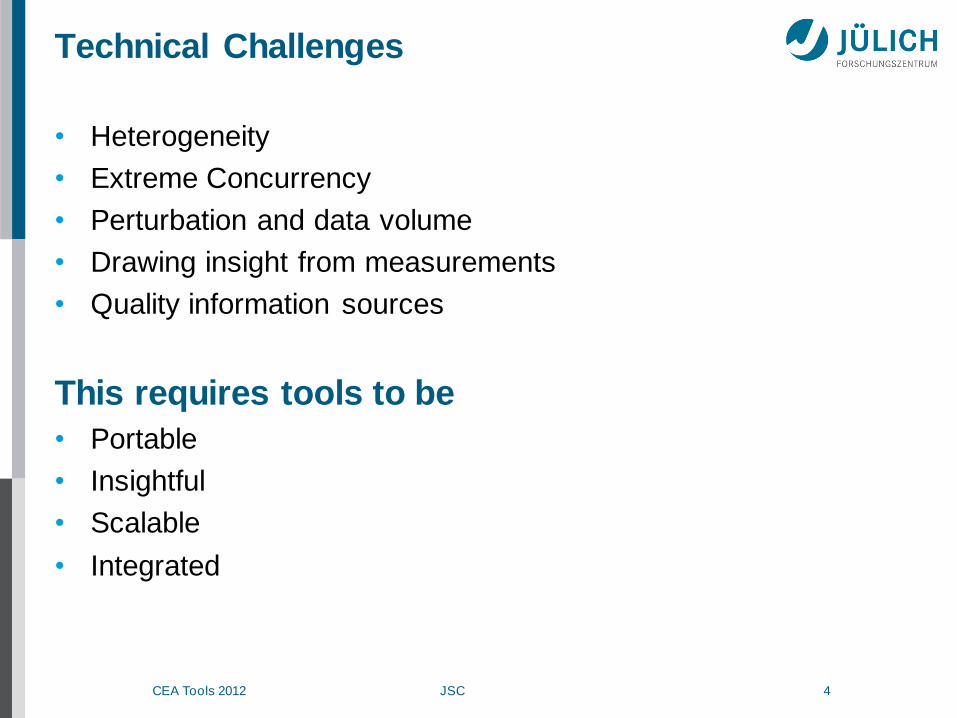
Technical Challenges
• Heterogeneity
• Extreme Concurrency
• Perturbation and data volume
• Drawing insight from measurements
• Quality information sources
This requires tools to be
• Portable
• Insightful
• Scalable
• Integrated

CEA Tools 2012 JSC 5
PORTABILITY
Run everywhere
CEA Tools 2012 JSC 6
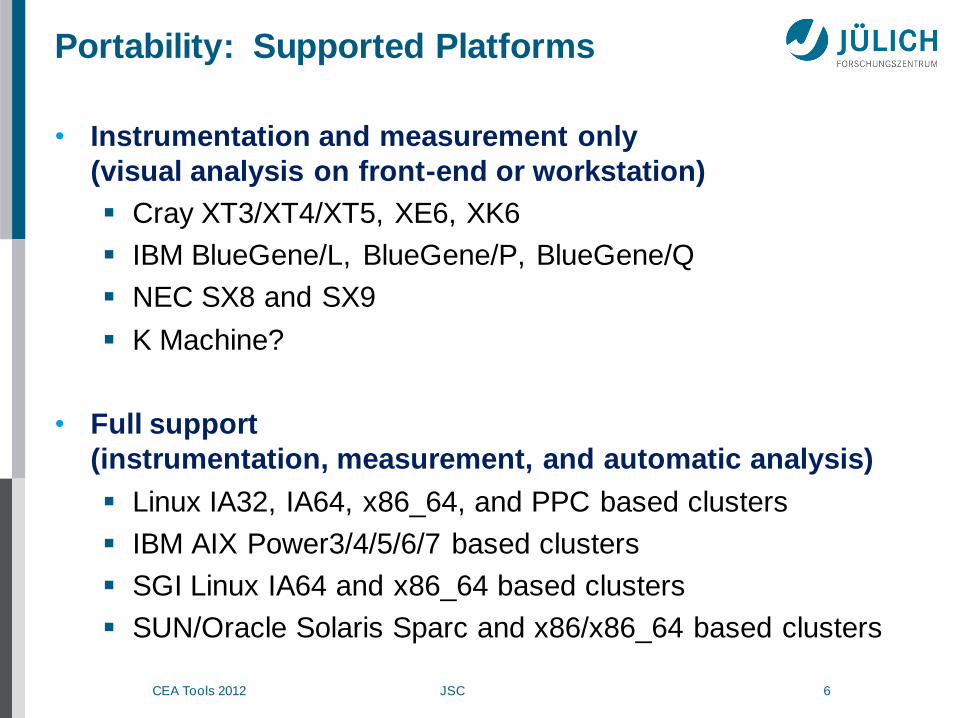
Portability: Supported Platforms
• Instrumentation and measurement only
(visual analysis on front-end or workstation)
Cray XT3/XT4/XT5, XE6, XK6
IBM BlueGene/L, BlueGene/P, BlueGene/Q
NEC SX8 and SX9
K Machine?
• Full support
(instrumentation, measurement, and automatic analysis)
Linux IA32, IA64, x86_64, and PPC based clusters
IBM AIX Power3/4/5/6/7 based clusters
SGI Linux IA64 and x86_64 based clusters
SUN/Oracle Solaris Sparc and x86/x86_64 based clusters

CEA Tools 2012 JSC 7
Known Installations of Scalasca
Companies
Bull (France)
Dassault Aviation (France)
EDF (France)
GNS (Germany)
MAGMA (Germany)
RECOM (Germany)
Shell (Netherlands)
Sun Microsystems (USA)
Qontix (UK)
Research / HPC Centres
ANL (USA)
BSC (Spain)
CEA (France)
CERFACS (France)
CINECA (Italy)
CSC (Finland)
CSCS (Switzerland)
Research / HPC Centres (cont.)
DLR (Germany)
DKRZ (Germany)
EPCC (UK)
HLRN (Germany)
HLRS (Germany)
ICHEC (Ireland)
IDRIS (France)
JSCC (Russia)
LLNL (USA)
LRZ (Germany)
MSU (Russia)
NCAR (USA)
NCSA (USA)
NSCC (China)
ORNL (USA)
PSC (USA)
RZG (Germany)
Research / HPC Centres (cont.)
SARA (Netherlands)
SAITC (Bulgaria)
TACC (USA)
Universities
RPI (USA)
RWTH (Germany)
TUD (Germany)
UOregon (USA)
UTK (USA)
DoD Computing Centers (USA)
AFRL DSRC
ARL DSRC
ARSC DSRC
ERDC DSRC
Navy DSRC
MHPCC DSRC
SSC-Pacific

CEA Tools 2012 JSC 8
INSIGHTFULNESS
More than numbers and diagrams

CEA Tools 2012 JSC 9
“A picture is worth 1000 words…”
• “Real world” example • MPI ring program

CEA Tools 2012 JSC 10
“What about 1000’s of pictures?” (with 100’s of menu options)

CEA Tools 2012 JSC 11
Example Automatic Analysis: Late Sender

CEA Tools 2012 JSC 12
Scalasca: Example MPI Patterns
time
pro
ce
ss
ENTER EXIT SEND RECV COLLEXIT
(a) Late Sender time
pro
ce
ss
(b) Late Receiver
time
pro
ce
ss
(d) Wait at N x N time
pro
ce
ss
(c) Late Sender / Wrong Order

CEA Tools 2012 JSC 13
The Scalasca Project
• Scalable Analysis of
Large Scale Applications
• Approach
Instrument C, C++, and Fortran parallel applications
Based on MPI, OpenMP, SHMEM, or hybrid
Option 1: scalable call-path profiling
Option 2: scalable event trace analysis
Collect event traces
Search trace for event patterns
representing inefficiencies
Categorize and rank inefficiencies found
• Supports MPI 2.2 (P2P, collectives, RMA, IO)
and OpenMP 3.0 (exception: nesting)
http://www.scalasca.org/

CEA Tools 2012 JSC 14
Instr.
target
application
Measurement
library
HWC
Parallel wait-
state search Wait-state
report
Local event
traces
Summary
report
Optimized measurement configuration
Instrumenter
compiler /
linker
Instrumented
executable
Source
modules
Re
po
rt
ma
nip
ula
tio
n
Which problem? Where in the
program?
Which
process?

CEA Tools 2012 JSC 15
Scalasca Example: CESM Sea Ice Module Late Sender Analysis

CEA Tools 2012 JSC 16
Scalasca Example: CESM Sea Ice Module Late Sender Analysis + Application Topology

CEA Tools 2012 JSC 17
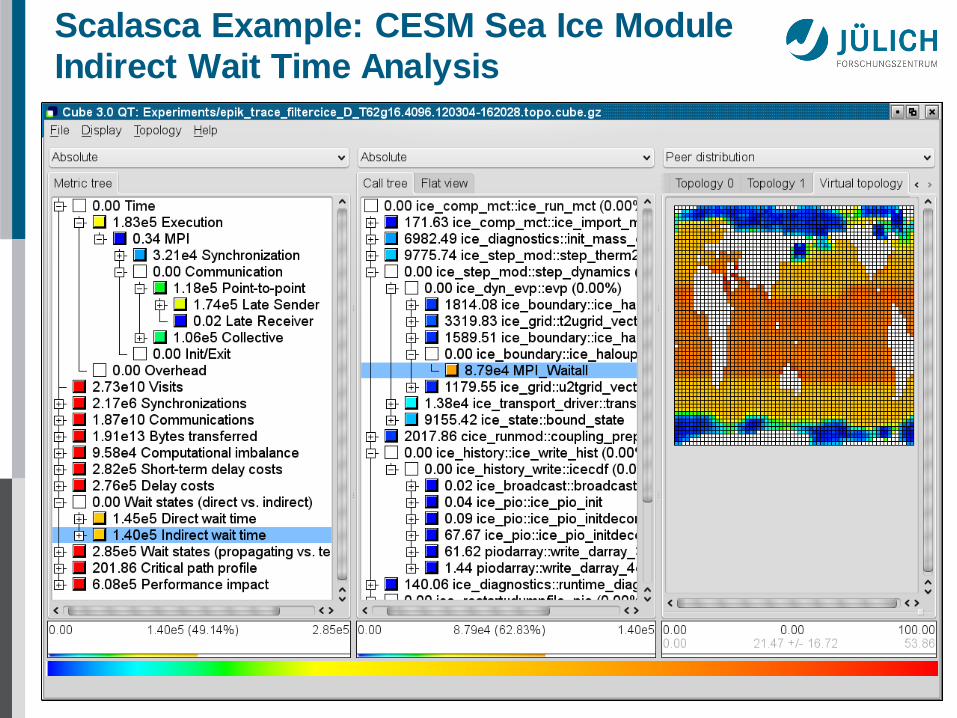
Scalasca Root Cause Analysis
• Root-cause analysis
Wait states typically caused
by load or communication imbalances earlier in the
program
Waiting time can also
propagate (e.g., indirect waiting time)
Goal: Enhance performance
analysis to find the root
cause of wait states
• Approach
Distinguish between direct
and indirect waiting time
Identify call path/process
combinations delaying other
processes and causing first
order waiting time
Identify original delay
Recv
Send
Send
foo
foo
foo
bar
bar Recv
A
B
C
time
cause
Recv
Recv
Direct wait Indirect wait
Recv
bar DELAY

CEA Tools 2012 JSC 18
Scalasca Example: CESM Sea Ice Module Direct Wait Time Analysis
CEA Tools 2012 JSC 19
Scalasca Example: CESM Sea Ice Module Indirect Wait Time Analysis

CEA Tools 2012 JSC 20
Scalasca Example: CESM Sea Ice Module Delay Costs Analysis
CEA Tools 2012 JSC 21
EXTREME CONCURRENCY
CEA Tools 2012 JSC 22
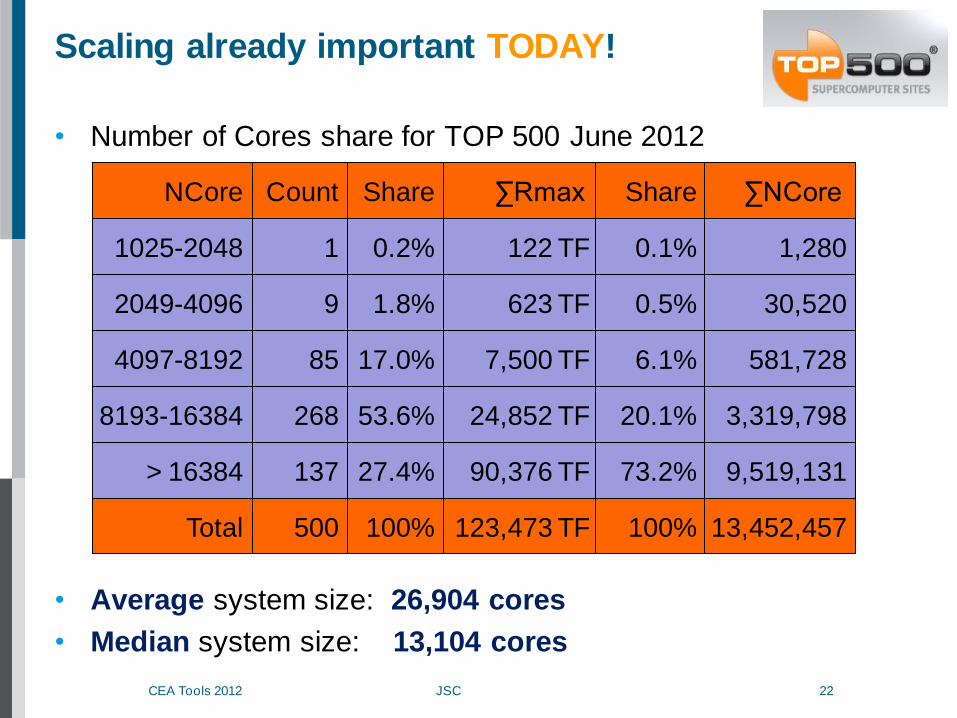
Scaling already important TODAY!
• Number of Cores share for TOP 500 June 2012
• Average system size: 26,904 cores
• Median system size: 13,104 cores
1025-2048
2049-4096
4097-8192
8193-16384
> 16384
NCore
1
9
85
268
137
Count
0.2%
1.8%
17.0%
53.6%
27.4%
Share
122 TF
623 TF
7,500 TF
24,852 TF
90,376 TF
∑Rmax
Total 500 100% 123,473 TF
0.1%
0.5%
6.1%
20.1%
73.2%
Share
100%
1,280
30,520
581,728
3,319,798
9,519,131
∑NCore
13,452,457

CEA Tools 2012 JSC 23
Roads to Scalability
• Scalable data collection and reduction
Parallel based on MPI and parallel I/O
• Scalable parallel data analysis
Parallelized
pattern search
delay analysis
critical-path analysis
• Scalable visualizations
Hierarchical browsers
Topology displays
3D displays (via TAU paraprof)

CEA Tools 2012 JSC 24
Scalasca trace analysis sweep3D@294,912 BGP
• 10 min
sweep3D
runtime
• 11 sec
replay
• 4 min
trace data
write/read
(576 files)
• 7.6 TB
buffered
trace data
• 510 billion
events B. J. N. Wylie, M. Geimer,
B. Mohr, D. Böhme,
Z.Szebenyi, F. Wolf : Large-
scale performance analysis
of Sweep3D with the
Scalasca toolset. Parallel
Processing Letters,
20(4):397-414, 2010.

CEA Tools 2012 JSC 25
CUBE: > 3D Folding (e.g. AB-CDE-CT)

CEA Tools 2012 JSC 26
CUBE: > 3D Folding (e.g. AB-CDE-CT)

CEA Tools 2012 JSC 27
CUBE: > 3D Folding (e.g. ABC-DECT)

CEA Tools 2012 JSC 28
CUBE: > 3D Selecting (e.g. A,B,C,D1,E1,C6,T0)

CEA Tools 2012 JSC 29
Scalasca trace analysis bt-mz@524,288 BGQ

CEA Tools 2012 JSC 30
INTEGRATION
CEA Tools 2012 JSC 31
Integration
• Need integrated tool (environment)
for all levels of parallelization
Inter-node (MPI)
Intra-node (OpenMP, task-based programming)
Accelerators (CUDA, OpenCL)
• Integration with performance modeling and prediction
• No tool fits all requirements
Interoperability of tools
Integration via open interfaces

CEA Tools 2012 JSC 32
Scalasca TAU VAMPIR Paraver
X
Scalasca Trace
Analyzer
CUBE3
profile
CUBE3
Presenter
EPILOG
trace
TAU
−EPILOG
TAU
−PROFILE
TAU
profile PARAPROF
PerfDMF
TAU
−TRACE
TAU
trace
gprof / mpiP
profile
R R
Paraver PRV
trace Extrae
VAMPIR Vampir
Trace
OTF / VTF3
trace
X
X
X
X
X
X
TAU
−VT
Status End 2011

CEA Tools 2012 JSC 33
Scalasca TAU VAMPIR Paraver
Score-P Scalasca
Trc Analyzer
CUBE4
profile
CUBE4
Presenter
OTF2
trace
TAU
−SCOREP
TAU
−PROFILE
TAU
profile PARAPROF
PerfDMF gprof / mpiP
profile
R R
Paraver PRV
trace Extrae
VAMPIR
X
X
Status End 2012 ?

CEA Tools 2012 JSC 34
Tool Integration: Score-P Objectives
• Mainly funded by SILC, PRIMA, LMAC projects
• Make common part of Periscope, Scalasca, TAU, and Vampir
a community effort
Score-P measurement system
• Functional requirements
Performance data: profiles (CUBE4), traces (OTF2)
Initially direct instrumentation, later also sampling
Offline and online access
Metrics: time, communication metrics and hardware counters
Initially MPI 2 and OpenMP 3, later also CUDA and OpenCL
• Current release: V1.1rc2 of Sep 2012 (1.1 very soon)
http://www.score-p.org
CEA Tools 2012 JSC 35
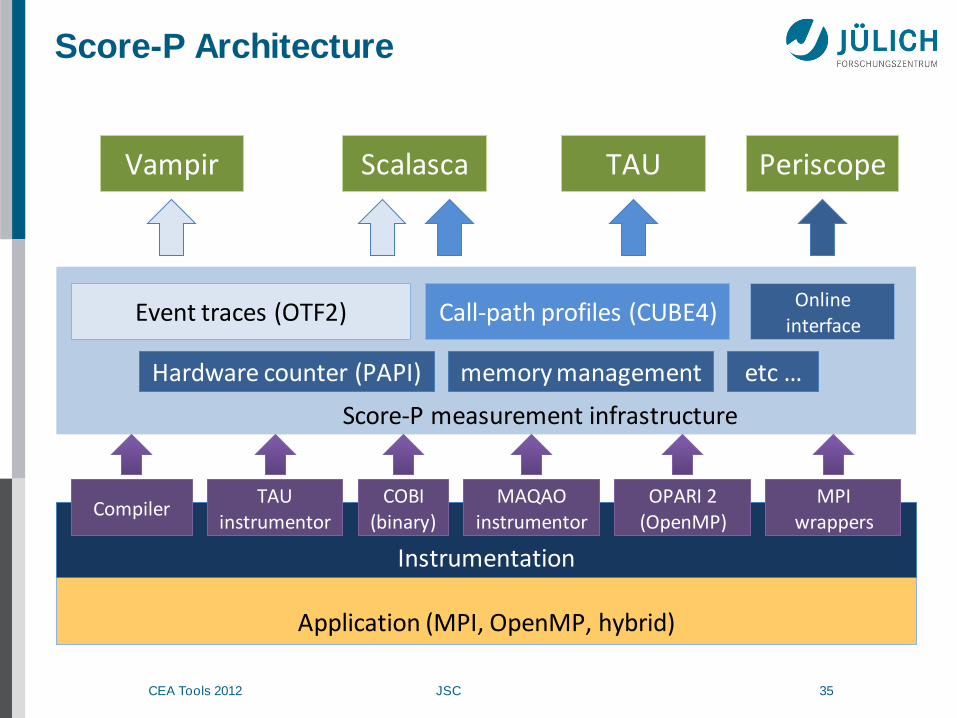
Score-P Architecture
Application (MPI, OpenMP, hybrid)
Score-P measurement infrastructure
Online interface
Event traces (OTF2)
Vampir Scalasca Periscope TAU
Hardware counter (PAPI)
Instrumentation
Call-path profiles (CUBE4)
Compiler TAU
instrumentor OPARI 2
(OpenMP) COBI
(binary) MAQAO
instrumentor
memory management etc …
MPI wrappers

CEA Tools 2012 JSC 36
Score-P Partners
• Forschungszentrum Jülich, Germany
• German Research School for Simulation Sciences,
Aachen, Germany
• Gesellschaft für numerische Simulation mbH
Braunschweig, Germany
• RWTH Aachen, Germany
• Technische Universität Dresden, Germany
• Technische Universität München, Germany
• University of Oregon, Eugene, USA
CEA Tools 2012 JSC 37
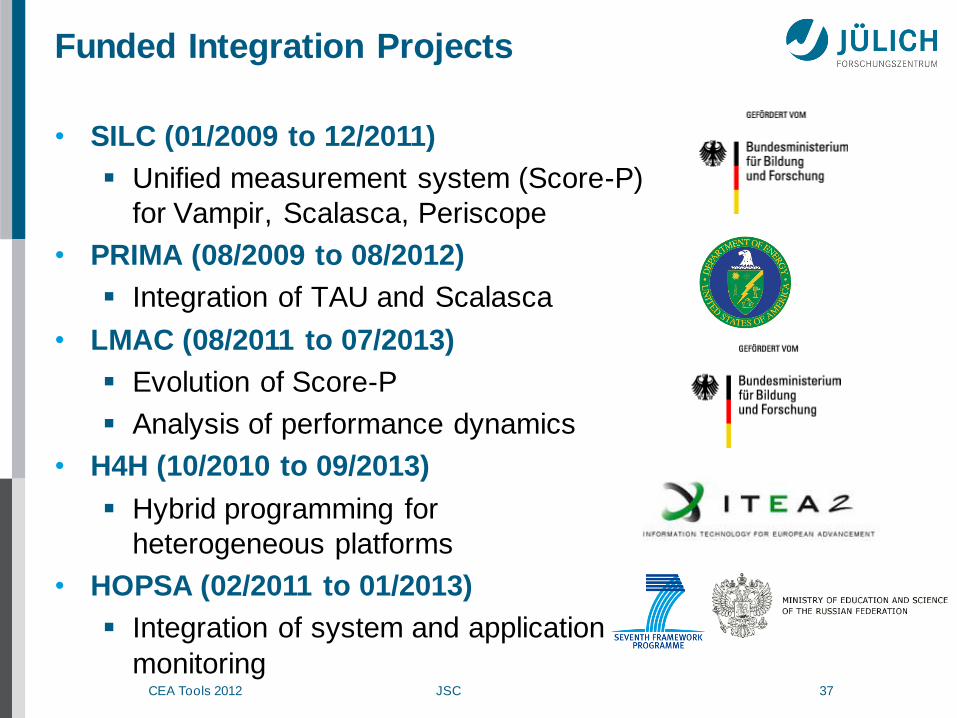
Funded Integration Projects
• SILC (01/2009 to 12/2011)
Unified measurement system (Score-P)
for Vampir, Scalasca, Periscope
• PRIMA (08/2009 to 08/2012)
Integration of TAU and Scalasca
• LMAC (08/2011 to 07/2013)
Evolution of Score-P
Analysis of performance dynamics
• H4H (10/2010 to 09/2013)
Hybrid programming for
heterogeneous platforms
• HOPSA (02/2011 to 01/2013)
Integration of system and application
monitoring
CEA Tools 2012 JSC 38
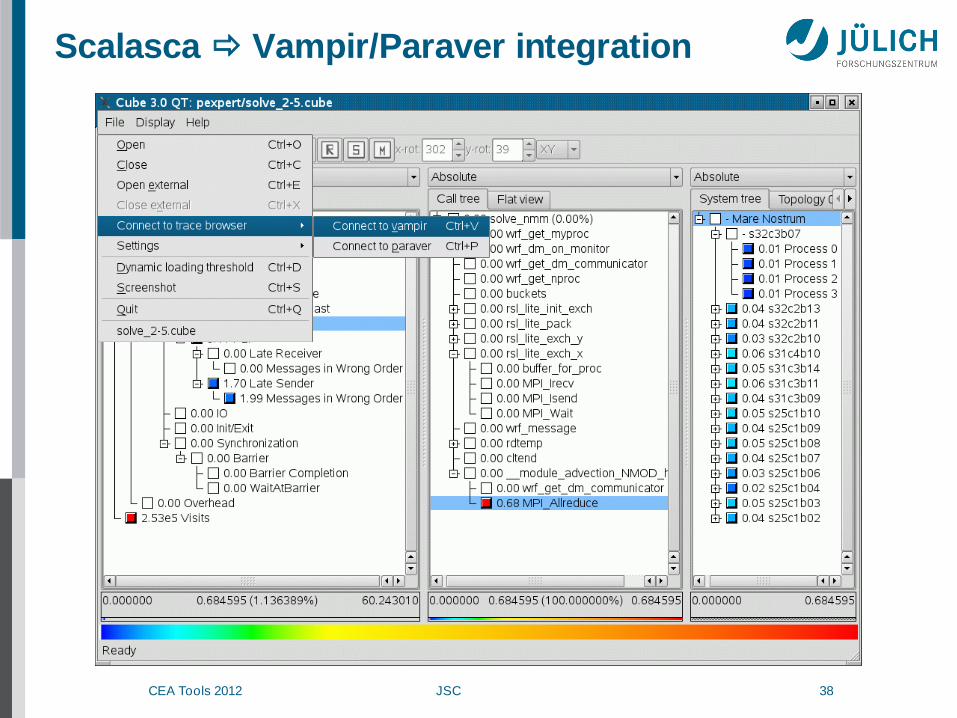
Scalasca Vampir/Paraver integration

CEA Tools 2012 JSC 39
Scalasca Vampir/Paraver integration

CEA Tools 2012 JSC 40
Scalasca Vampir/Paraver integration
CEA Tools 2012 JSC 41
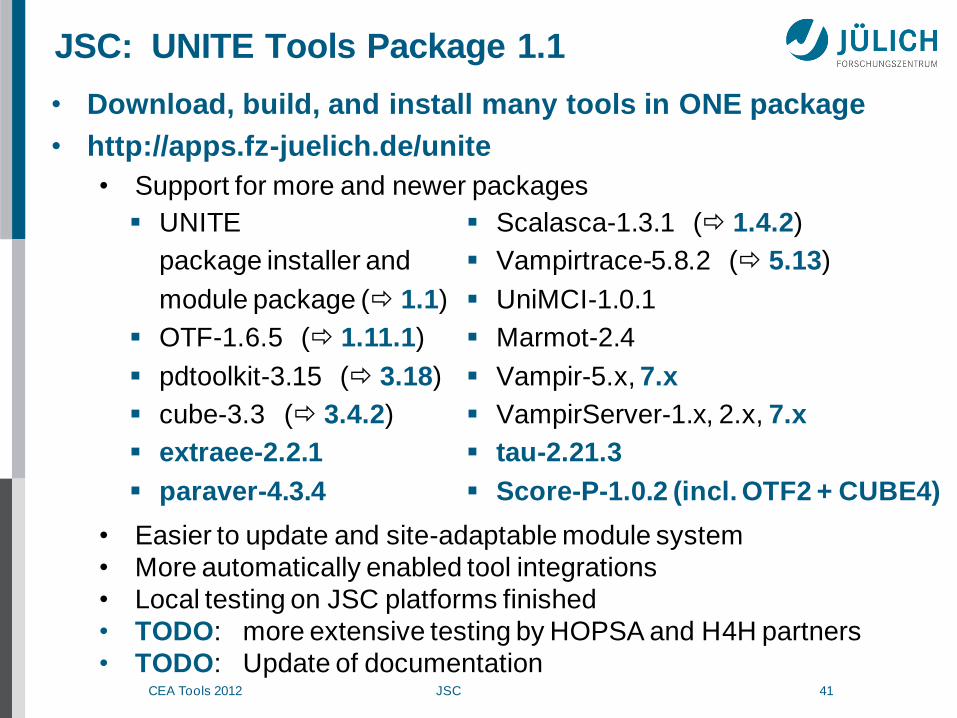
JSC: UNITE Tools Package 1.1
• Download, build, and install many tools in ONE package
• http://apps.fz-juelich.de/unite
• Support for more and newer packages
• Easier to update and site-adaptable module system
• More automatically enabled tool integrations
• Local testing on JSC platforms finished
• TODO: more extensive testing by HOPSA and H4H partners
• TODO: Update of documentation
UNITE
package installer and
module package ( 1.1)
OTF-1.6.5 ( 1.11.1)
pdtoolkit-3.15 ( 3.18)
cube-3.3 ( 3.4.2)
extraee-2.2.1
paraver-4.3.4
Scalasca-1.3.1 ( 1.4.2)
Vampirtrace-5.8.2 ( 5.13)
UniMCI-1.0.1
Marmot-2.4
Vampir-5.x, 7.x
VampirServer-1.x, 2.x, 7.x
tau-2.21.3
Score-P-1.0.2 (incl. OTF2 + CUBE4)

CEA Tools 2012 JSC 42
OPEN ISSUES
Future Work

CEA Tools 2012 JSC 43
Open Issues
• How to handle asynchronous non-deterministic
executions?
Currently favored programming model at node-level
Breaks measure-analyze-optimize cycle
Potential solution
Use traditional tools only at inter-node level
Use auto-tuning smart runtime systems inside node
• Further factors to non-determinism
Failing components and recovery actions
Components operating on varying speeds to save energy

CEA Tools 2012 JSC 44
Acknowledgements
• Scalasca team (JSC) (GRS)
• Sponsors
Michael
Knobloch
Bernd
Mohr
Peter
Philippen
Markus
Geimer
Daniel
Lorenz
Christian
Rössel
David
Böhme
Marc-André
Hermanns
Pavel
Saviankou
Marc
Schlütter
Ilja
Zhukov
Alexandre
Strube
Brian
Wylie
Aamer
Shah
Felix
Wolf
Anke
Visser
Christian
Heinrich
Monika
Lücke
Alexandru
Calotoiu