scalable computing practiceand experience - scpe.org · boleslaw karl szymanski, rensselaer...
TRANSCRIPT

SCALABLE COMPUTING
Practice and Experience
Special Issue: Grid and Cloud Computing
and their Application
Editors: Ewa Deelman, Norbert Meyer, Dana Petcu,and Marcin Paprzycki
Volume 11, Number 2, June 2010
ISSN 1895-1767
UU
NIVERSITATEA DE VEST
DIN TIMISOARA

Editor-in-Chief
Dana PetcuComputer Science DepartmentWestern University of Timisoaraand Institute e-Austria TimisoaraB-dul Vasile Parvan 4, 300223Timisoara, [email protected]
Managinig andTEXnical Editor
Alexander DenisjukElbląg University of Humanities andEconomyul. Lotnicza 282-300 Elbląg, [email protected]
Book Review Editor
Software Review Editor
Hong ShenSchool of Computer ScienceThe University of AdelaideAdelaide, SA [email protected]
Domenico TaliaDEISUniversity of CalabriaVia P. Bucci 41c87036 Rende, [email protected]
Editorial Board
Peter Arbenz, Swiss Federal Institute of Technology, Zurich,[email protected]
Dorothy Bollman, University of Puerto Rico,[email protected]
Luigi Brugnano, Universita di Firenze,[email protected]
Bogdan Czejdo, Fayetteville State University,[email protected]
Frederic Desprez, LIP ENS Lyon, [email protected]
David Du, University of Minnesota, [email protected]
Yakov Fet, Novosibirsk Computing Center, [email protected]
Ian Gladwell, Southern Methodist University,[email protected]
Andrzej Goscinski, Deakin University, [email protected]
Emilio Hernadez, Universidad Simon Bolıvar, [email protected]
Jan van Katwijk, Technical University Delft,[email protected]
Vadim Kotov, Carnegie Mellon University, [email protected]
Janusz S. Kowalik, Gdansk University, [email protected]
Thomas Ludwig, Ruprecht-Karls-Universitat Heidelberg,[email protected]
Svetozar D. Margenov, IPP BAS, Sofia,[email protected]
Marcin Paprzycki, Systems Research Institute, Polish Academyof Science, [email protected]
Lalit Patnaik, Indian Institute of Science, [email protected]
Shahram Rahimi, Southern Illinois University,[email protected]
Siang Wun Song, University of Sao Paulo, [email protected]
Boleslaw Karl Szymanski, Rensselaer Polytechnic Institute,[email protected]
Roman Trobec, Jozef Stefan Institute, [email protected]
Carl Tropper, McGill University, [email protected]
Pavel Tvrdık, Czech Technical University,[email protected]
Marian Vajtersic, University of Salzburg,[email protected]
Lonnie R. Welch, Ohio University, [email protected]
Janusz Zalewski, Florida Gulf Coast University,[email protected]
SUBSCRIPTION INFORMATION: please visit http://www.scpe.org

Scalable Computing: Practice and Experience
Volume 11, Number 2, June 2010
TABLE OF CONTENTS
Special Issue Papers:
Introduction to the Special Issue iDana Petcu, Ewa Deelman, Norbert Meyer, and Marcin Paprzycki
VOFS: A Secure Churn-Tolerant Grid File System 99Leif Lindback, Vladimir Vlassov, Shahab Mokarizadeh andGabriele Violino
Matching Jobs with Resources: an application-driven approach 109A. Clematis, A. Corana, D. D’Agostino, A. Galizia, and A. Quarati
Prediction and Load Balancing System for Distributed Storage 121Renata S lota, Darin Nikolow, Stanis law Polak, Marcin Kuta,Mariusz Kapanowski, Kornel Ska lkowski, Marek Pogoda,and Jacek Kitowski
Distributed Data Integration and Mining Using ADMIRE Technology 131Ondrej Habala, Martin Seleng, Viet Tran, Ladislav Hluchy,Martin Kremler, and Martin Gera
Ultra-fast Carrier Transport Simulation on the Grid. Quasi-RandomApproach 137
Emanouil Atanassov, Todor Gurov, and Aneta Karaivanova
Management of High Performance Scientific Applications using MobileAgents based Services 149
Salvatore Venticinque, Rocco Aversa, Beniamino Di Martino,Renato Donini, Sergio Briguglio, and Gregorio Vlad
Vine Toolkit—Towards portal based production solutions for scientificand engineering communities with grid-enabled resources support 161
Dawid Szejnfeld, Piotr Dziubecki, Piotr Kopta, Michal Krysinski, TomaszKuczynski, Krzysztof Kurowski, Bogdan Ludwiczak, Tomasz Piontek,Dominik Tarnawczyk, Ma lgorzata Wolniewicz, Piotr Domagalski,Jaroslaw Nabrzyski, and Krzysztof Witkowski
Fast Multi-objective Rescheduling of Workflows to ConstrainedResources Using Heuristics and Memetic Evolution 173
Wilfried Jakob, Florian Moser, Alexander Quinte, Karl-Uwe Stucky,and Wolfgang Suß
VieSLAF Framework: Facilitating Negotiations in Clouds by applyingservice mediation and negotiation bootstrapping 189
Ivona Brandic, Dejan Music, and Schahram Dustdar
Large Scale Problem Solving Using Automatic Code Generation andDistributed Visualization 205
Andrei Hutanu, Erik Schnetter, Werner Benger, Eloisa Bentivegna,Alex Clary, Peter Diener, Jinghua Ge, Robert Kooima, Oleg Korobkin,Kexi Liu, Frank Loffler, Ravi Paruchuri, Jian Tao, Cornelius Toole,Adam Yates, and Gabrielle Allen
c© SCPE, Timisoara 2010


Scalable Computing: Practice and ExperienceVolume 11, Number 2, pp. i–ii. http://www.scpe.org
ISSN 1895-1767c© 2010 SCPE
INTRODUCTION TO THE SPECIAL ISSUE: GRID AND CLOUD COMPUTING ANDTHEIR APPLICATIONS
Dear SCPE Reader,We present a Special Issue on Grid and Cloud Computing and their Applications (http://www.scpe.org/
?a=cfp_si&id=8). The first six papers included in this issue are modified and extended versions of paperspresented at the 8th International Conference on Parallel Processing and Applied Mathematics, PPAM 2009(http://www.ppam.pl), which took place on September 13–16, 2009 in Wroc law, Poland. These papers havebeen selected from contributions originally accepted in the frame of two workshops: the 4th Grid Applicationsand Middleware Workshop, GAMW’2009 (http://www.ppam.pl/?page=gamw) and the 5th Workshop on LargeScale Computations on Grids, LaSCoG’09 (http://lascog09.info.uvt.ro/). The remaining four papers wereselected from the responses to an Open Call for Papers.
The selected papers are addressing a large variety of current research topics related to the call: distributedfile systems, scheduling, load balancing, data mining, simulations, mobile agents, scientific portals, workflows,service negotiations or distributed visualization.
The first paper, “VOFS: A Secure Churn-Tolerant Grid File System” presents a specially designed secure filesystem that allows the members of a virtual organization to share files. A decentralized common file namespaceis proposed to avoid a single point of failure. The proposed software stack includes a P2P system of file serversand can operate in a dynamic Grid environment
The second paper, “Matching Jobs With Resources: an Application-Driven Approach” proposes a dis-tributed matchmaker, named GREEN, which provides Grid users with features for easy submission of jobexecution requests containing performance requirements. GREEN relies on a two-level benchmarking method-ology: resources are characterized by means of their performance evaluated through the execution of low-leveland application-specific benchmarks.
In the third paper, “Prediction and Load Balancing System for Distributed Storage,” the application of acommon mass storage system model in a national distributed storage system has been described. The predictionand load balancing subsystem, which provides advanced monitoring functionalities is discussed. The proposedsystem makes use of replication techniques to increase availability and performance of data access.
The fourth paper “Distributed Data Integration and Mining Using Admire Technology” presents the dataintegration engine for environmental data. The proposed software is being developed in the scope of the AD-MIRE project. The proposed platform allows for integration of data from distributed, heterogeneous resources.It also allows users to construct reusable application processing elements specified in a DMIL, a language fordata mining and integration.
The fifth paper “Ultra-Fast Carrier Transport Simulation on the Grid. Quasi-Random Approach” stud-ies quasi-random number generation in a Grid-enabled package named Stochastic ALgorithms for Ultra-fastTransport in sEmiconductors (SALUTE). The performance of the corresponding algorithms on the Grid is alsodiscussed. A large number of tests are reported on the EGEE and the SEEGRID Grid infrastructures.
In the sixth paper, “Management of High Performance Scientific Applications Using Mobile Agents BasedServices,” an explanation of how programmers can extend their applications to exploit services on heterogeneousand distributed platforms is provided. A native console is implemented, using mobile agents to control theapplication life-cycle. Moreover, software agents implement a mobile service that supports check-pointing,suspension, resuming, cloning and migration of managed applications.
The seventh paper “Vine Toolkit—Towards Portal Based Production Solutions For Scientific and Engi-neering Communities With Grid-Enabled Resources Support” addresses the challenge of synchronization ofdistributed workflows, and establishing a community driven Grid environment for the seamless results sharingand collaboration. The proposed toolkit offers user interface web components to be embedded in the existingportals, integration with a workflow engine, Grid security, and a built-in meta-scheduling mechanism allowingautomatic load balancing among data centers to meet peak demands.
The eight paper “Fast Multi-Objective Rescheduling of Workflows to Constrained Resources Using Heuris-tics and Memetic Evolution” describes GORBA, a global optimising resource broker and allocator, which isdesigned to be used in a static planning environment. Several heuristics for rescheduling are introduced andtheir contribution to the overall planning process is studied.
The ninth paper “VieSLAF Framework: Facilitating Negotiations in Clouds by Applying Service Mediationand Negotiation Bootstrapping” presents a novel framework for the specification and management of service level
i
ii Introduction to the Special Issue
agreement (SLA) mappings and meta-negotiations facilitating service mediation, negotiation and bootstrappingin Cloud computing environments. The users may specify, manage, and apply SLA mappings without a-prioriknowledge about negotiation protocols, required security standards or negotiated terms.
Finally, the tenth paper “Large Scale Problem Solving Using Automatic Code Generation and DistributedVisualization” presents a new approach to solving four important scalability challenges: programming produc-tivity, scalability to large numbers of processors, I/O bandwidth, and interactive visualization of large data. Theapproach uses the Cactus framework, automated code generation, and numerical methods. A demonstration ofthe proposed system was awarded first place in the IEEE SCALE 2009 Challenge.
We would like to express our gratitude to all referees who have worked to help authors to improve thequality of papers selected to be published in this Special Issue.
Dana Petcu,Ewa Deelman,Norbert Meyer,Marcin Paprzycki.Special Issue Editors
Scalable Computing: Practice and ExperienceVolume 11, Number 2, pp. 99–108. http://www.scpe.org
ISSN 1895-1767c© 2010 SCPE
VOFS: A SECURE CHURN-TOLERANT GRID FILE SYSTEM∗†
LEIF LINDBACK‡, VLADIMIR VLASSOV‡, SHAHAB MOKARIZADEH‡, AND GABRIELE VIOLINO§
Abstract. A Grid computing environment allows forming Virtual Organizations (VOs) to aggregate and share resources. Wepresent a VO File System (VOFS) which is a secure VO-aware distributed file system that allows VO members to share files withina VO. VOFS supports access and location transparency by maintaining a common file namespace, which is decentralized to avoida single point of failure in order to improve robustness of the file system. VOFS includes a P2P system of file servers, a VOmembership service and a policy and role based security mechanism that protects the VO files from unauthorized access. VOFScan be mounted to a local file system in order to access files using a standard POSIX file API. VOFS can operate in a dynamic Gridenvironment (e.g. desktop Grids) since it is able to tolerate unplanned resource arrival and departure (churn) while maintaining asingle uniform namespace. It supports transparent disconnected operations that allow the user to work on cached files while beingdisconnected. Furthermore, VOFS is a user level technique, and the current WebDAV-based VOFS prototype can operate underany operating system that has WebDAV mount support.
Key words: grid file system, virtual organization, peer-to-peer, security, namespace
1. Introduction. A Grid computing environment allows forming Virtual Organizations (VOs). A VO isa virtualised collection of users or institutions that pools their resources into a single virtual administrativedomain, for some common purpose. A VO File System (VOFS) aggregates data objects (files, directories anddisk space) exposed by VO members. Expose here means a VOFS operation to assign a data object (a directoryor a file on a VO member’s computer) a logical name in the VOFS namespace and make it accessible via aVOFS server.
One major challenge in such a file system is namespace management. The namespace should allow uniformand globally unique path names to be associated with data objects wherever they are located in the Grid [1].Uniform here means access and location transparency of exposed data objects, and the same view of the filesystem at all nodes. This requires mapping a logical name of a file in VOFS namespace to its physical location.The global nature of grids enforces logical names to be uniform across different administrative domains.
In this work we consider ad-hoc grids built of resources voluntarily donated by VO members. VOFS containsdifferent types of data objects exposed by VO members to be shared within a VO. This paper proposes a user-level solution for implementation of VOFS that allows exposing data objects, transparent access to the objects,and maintains the uniform namespace in the presence of resource churn (node leaves, joins and failures). Theproposed VOFS has the following features that make it useful in ad-hoc Grids to create and maintain workspaces by exposing and sharing data objects by different applications and VO members.
1. VOFS includes a security mechanism that protects exposed data objects from unauthorized access. Itsupports VO membership management, authentication and role-based authorization according to VOpolicies including validity periods in access rights;
2. VOFS maintains a uniform namespace despite of unplanned resource churn;3. The user-level technique of VOFS allows ordinary applications (file clients) to access the VOFS using
a standard POSIX file API, i. e. the applications do not need to be modified to access files exposed toVOFS;
4. VOFS is easy to use for non-experienced users;5. VOFS can operate under any operating system that has WebDAV [2] mount support, e.g. MS Windows,
Linux, Mac OS X;6. VOFS supports transparent disconnected operations that allow the user to work offline on cached files
while being disconnected.
2. Overview. This work builds on our previous work presented in [3] that proposed three ways of main-taining the namespace: a centralized name service; a distributed directory; and a DHT-based name service.In [3] we have presented VOFS with the centralized name service that has the major disadvantage to induce a
∗This paper is an extended version of the paper presented at GAMW 2009 in conjunction with the PPAM 2009 [17].†This work was supported by the FP6 Project Grid4All funded by the European Commission (Contract IST-2006-034567).‡School of Information and Communication Technology (ICT), Royal Institute of Technology (KTH), P.O. Box Forum 120,
SE-164 40 Kista, Sweden. E-mails: leifl, vladv, [email protected]§Net Result AB, Stockholm, Sweden. E-mail: [email protected]. Gabriele Violino was at the Royal Institute of
Technology (KTH) while doing this work.
99

100 L. Lindback, V. Vlassov, S. Mokarizadeh, and G. Violino
Fig. 2.1. Schematic view of VOFS architecture
single point of failure and a potential performance bottleneck. In this paper, we propose to build VOFS with anamespace maintained as a distributed directory where the namespace information is distributed among peersso that a peer knows location of at least those remote files which are exposed under directories hosted by thepeer. In this VOFS design every peer can potentially learn the entire namespace (i. e. location of exposed dataobjects) via a gossiping mechanism.
In the current VOFS design we consider files and directories as data objects. The data objects can beexposed to any path in VOFS. An exposed directory offers disk space which is used by VO members to createnew objects.
Exposing of a file or directory from the local node makes the data object accessible for VO members.Each peer runs a file server that provides and controls access to data objects exposed from the local node, seefigure 2.1. Access to the exposed objects is achieved by mounting the local VOFS peer to a mount point, e.g. alocal path. We use the WebDAV protocol [2] to access and transfer files between peers. Use of WebDAV allowsaccessing VOFS through any mount utility supporting WebDAV, e.g davfs2 [4] which offers a POSIX complaintAPI. Once mounted, access to VOFS is no different from access to local file system.
3. VOFS Namespace and File Tree. VOFS is formed as an ordinary hierarchical file tree by exposingdata objects in to the VOFS tree, i. e. by assigning them paths in VOFS. The VOFS namespace is a set ofmappings of logical names to physical locations. When a user exposes1 a data object (a file or a directory) tothe VOFS namespace, hence the VOFS file tree, the exposed file is assigned a logical name, which is a path inVOFS. The path may include names of virtual directories. A virtual directory is not hosted by any peer, i. e.it does not really exist. Thus, VOFS consists of exposed real data objects (directories and files) and virtualdirectories that may contain other virtual directories and exposed real data objects.
Initially, the VOFS tree contains only the root, which is initially virtual. The VOFS namespace, hence theVOFS tree, is formed explicitly and gradually as a result of exposing and unexposing data objects.
Virtual directories help to maintain the namespace, namely, to avoid possible namespace partitioning thatmight be caused by unexpose operations. If to assume that all directories in the VOFS tree are real (i. e.physically exist), then unexposing a real directory may cause partitioning of the tree as the data objects underthe unexposed directory can not be properly identified by a path in the single-rooted VOFS tree. This motivatesintroducing virtual directories. The unexposed real directory becomes virtual; and names of all objects underit remain unchanged.
1The expose operation is described in Section 4.1
VOFS: A Secure Churn-Tolerant Grid File System 101
When looking up location of an object given its fully-specified VOFS path, a longest prefix match is done.The object can be accessed if the exposing peer is online despite of whether other peers are online or not.
Mappings of logical names to physical locations are the major metadata of VOFS. The metadata associatesexported data objects with paths in the VOFS namespace. The same metadata are kept at every node intwo tables: remote.db, which stores location information of data objects exposed by other peers; and local.dbthat stores location information of objects exposed by this peer. When a data object is exposed, the exposingpeer adds a pair of local file system path and VOFS path to the local.db table while all other peers adds apair of VOFS path and physical host address to their remote.db table. When a data object is unexposed, thisinformation is removed from all peers. The namespace changes only when peers perform expose or unexposeoperations. Peers communicate metadata by gossiping as explained below. All peers know the entire namespace,i.e which data objects are exposed and who exposes them.
3.1. Design Options for Avoiding Namespace Partitioning. When designing VOFS, we have con-sidered the following three possible design options to manage objects (and their metadata) located under anunexposed directory in VOFS.
1. Unexpose all descendant data objects located under the unexposed directory;2. Unexpose all data objects located under the unexposed directory that belong to the owner of the
directory, keep objects of other owners;3. Unexpose all data objects located under the unexposed directory that belong to the owner of the
directory, and keep the unexposed directory as a virtual directory in the VOFS tree, if there are objectsthat belong to other owners.
Supporting the first design option (i. e. unexposing all objects under the unexposed directory), might berather expensive, and might also cause violation of ownership of objects located under the unexposed directory.Note that in the second and the third option, all data objects under the unexposed directory, which do notbelong to the owner of the directory, remain. However, the second design option results in a partitioned VOFStree, i. e. a forest of trees, that complicates maintaining of the file system and its namespace. Remind thatVOFS must tolerate frequent changes in its resources like node joins, leaves, and failures, and support frequentexposing and unexposing data objects in a rather convenient way without partitioning of the VOFS tree. Basedon the above considerations, we have chosen the third above option, i. e. to keep an unexposed directory asvirtual when needed (i. e. when it contains data objects that should remain in the tree) in order to avoid VOFStree partitioning.
3.2. Algorithm for Namespace Updates. To transfer namespace updates between peers we use agossip algorithm based on the lazy probabilistic broadcast algorithm described in [6]. When a peer updates thenamespace it sends an update message to all or some of its neighbors. Each peer that receives an update messageforwards it to all or some of its neighbours. There will be no loops since a peer never sends the same messagetwice.
There are no acknowledgements; instead the following recovery mechanism is used when messages are lost.Original sender id and a sequence number are attached to each message. Since there is FIFO delivery of messages,if a peer receives a message with a sequence number larger than the previous number plus one, it knows thatsome messages were lost. It will then send a require message to a subset of its neighbours. The require messageindicates which message was lost and which peer is requiring it. A peer, which receives the require messagechecks if it has the required message. If yes, it sends the required update message to the requiring peer. If not,it forwards the require message to a subset of its neighbours. Require messages are forwarded only a specifiednumber of times. Each peer maintains information about transmitted messages on its hard disk.
Note that the gossip algorithm described above is used only for namespace updates. All other communica-tion, e.g. file transfer, involve only two peers.
Due to gossiping, there is no need to search for data objects since each peer maintains its own view of thenamespace. The namespace view is almost the same as views of other peers even though there might be someinconsistencies between views caused by update latency.
4. VOFS Peers. Each user who exposes data objects must run a VOFS peer on her computer; while auser accessing VOFS does not need to run a VOFS peer. However, in the latter case, the user must know anaddress of any VOFS peer to be able to mount it and to access the VOFS. If the user runs a VOFS peer, thenthat local peer, loopback adapter, can be mounted to become the entry point to VOFS. In this case, there isno need to keep addresses of well-known mount points like in for example AFS [5]. Every of the VOFS peers

102 L. Lindback, V. Vlassov, S. Mokarizadeh, and G. Violino
Fig. 5.1. Interaction between security components
provides the same set of the services that includes (un)expose, join, mount, cache. The services can be accessedby the user through the GUI of the VOFS peer. The services are described below.
4.1. (Un)Expose. A user (un)exposes data objects using an (un)expose client provided with a GUI inthe current VOFS prototype. When exposing, the user defines a data object to be exposed and specifies itsVOFS path. The expose service stores the logical-to-physical name mapping in the local table and initiates theupdate gossip algorithm. If the specified path does not exist, virtual directories are introduced in order to allowtraversing the tree from root to the exposed data object. The root of VOFS is always /. It always exists atleast virtually, but may also be mapped to a real directory. Name collision occurs when the user tries to assigna VOFS name which is already taken. In the current VOFS, the name collision is resolved as follows: if thedata object to be exposed is a file, its mapping overrides the mapping of the object previously exposed with thesame name; in case of directories exposed with the same name, their contents are merged.
4.2. Join. When a user starts a VOFS peer, the peer joins the P2P VOFS system. At startup, the peerdownloads a list of all VO peers from the VO Membership Service (VOMS)2. Then the peer connects to someother peers selected from the list. The chosen peers and the new peer become neighbours. In the current VOFSprototype, selection of neighbours is random, but it could be done in a sophisticated way. They also exchangetheir VOFS views stored in their local and remote metadata tables described earlier. It is possible for the userto manually edit a peer’s neighbour list through the GUI of the VOFS peer.
4.3. Mount. The user can mount VOFS with any mount utility supporting WebDAV used in the currentVOFS; therefore we have not developed any special mount utility; instead, we use davfs [4] on Linux andNetDrive [7] on MS Windows. VOFS has not been tested on other OSs but Mac OS X has WebDAV supportbuilt in.
Once the VOFS is mounted, all POSIX file API is supported for manipulating data objects (provided themount utility offers a POSIX API). The mount utility will translate the POSIX calls to WebDAV calls to theVOFS peer.
4.4. Cache. Each VOFS peer maintains a file cache. Read and write latency over network is compensatedby the caching mechanism, which also allows offline work. VOFS uses last write wins reconciliation policy (atraditional file system policy for concurrent writes), which, if needed, can be replaced by a more sophisticatedreconciliation policy implemented using, for example, Telex [8]. The cached copy is checked for update (comparedto the master copy) when the file is read. When a file is written the new content is both stored in the cache andsent to the exposing peer, which informs all other peers who cached the file about the update. Also directorylistings are cached, but unlike files they have an expiry time.
5. VOFS Security. VOFS includes a policy-based security, which ensures that only VO members canaccess files in VOFS. Access rights in VOFS confirm to VO policies set by resource (file and directory) owners.
2described in Section 5.1
VOFS: A Secure Churn-Tolerant Grid File System 103
The security infrastructure used in VOFS to protect exposed data objects from unauthorized access isbased on the XACML authorization model [9]. The VOFS security allows to define and to enforce VO ac-cess control policies. Its goal is to provide authentication and authorization according to VO security poli-cies. When authenticating the user’s credentials are checked and the user gets a token which can be usedto prove her identity in authorization checks. Authorization guarantees that users can only access resourcesto which they have right according to VO policies. Authorization is policy-based, policies are expressed inXACML.
5.1. Security Components. The VOFS security infrastructure is built of the following components.
Virtual Organization Membership Service, VOMS keeps a database of users and roles in the VO. It hasa web based management interface for updating this data. This interface is protected by a PEP. TheVOMS is also responsible for authenticating users.
Policy Enforcement Point, PEP protects a resource (VOFS peer, VOMS, PAP). Each resource has a localPEP, which is called whenever access rights shall be checked. On each request, the PEP forms anauthorization request to PDP (or to its local cache) that includes the following three parameters.
1. Subject, which is the single sign-on identifier of the user accessing the data object. This identifierwas returned by the VOMS when the user signed on;
2. Action, which specifies a name of an action (e.g. open) to be performed on the resource;3. Resource, which is the target resource (file or directory) identifier in the form of a file path.
The PEP sends authorization requests to the PDP, and, upon receiving an authorization responsefrom PDP, it enforces the authorization decision that can be either Permit or Deny. PEP caches theanswers from PDP for further use. Caching of PDP responses at PEPs reduces security overhead. ThePEP cache is invalidated by PDP when the access policies are changed. In order to further improveperformance, the PDP answers not only to the request sent by the PEP, but to requests with the samesubject and resource with all existing actions.
Policy Decision Point, PDP evaluates requests from PEPs according to the policies in PR, it makes theauthorization decisions, and returns them to the requesting PEPs as authorization responses. A PDPresponse includes one of the following possible results:
1. Permit, this means that access is granted;2. Deny, this means that access is rejected;3. NotApplicable, this means that there was no matching policy;4. Indeterminate, this means that no decision could be taken. For example there might be several
contradicting policies.5. Error, which means that policies could not be checked because of some exception, for example the
communication link might be broken.For efficiency, the PDP maintains a cache of policies (policy objects), which are loaded from the PolicyRepository. Invalidation of the PDP’s cache also invalidates all PEP’s caches.
Policy Information Point, PIP contacts VOMS to validate the requester’s identifying token and get therequester’s roles. The answer from VOMS is cached, together with the lifetime of the token.
Policy Repository, PR stores the policies as XACML files.Policy Administration Point, PAP is a server that makes updates to PR. The PAP is protected by a PEP.
VOFS prototype includes a PAP client that allows the user to set an access control list for a givendata object (directory) in a way similar to AFS [5], i. e. by issuing the setact command or via theclient GUI for a given directory for a given role (user). The access rights set by the PAP client areapplied to all data objects (files and directories) under the specified directory. The PAP client allowsalso specifying time and date for validity periods in access rights. The access rights set by the PAPclient are stored in XACML policy files in the Policy Repository accessed by PDP. For example, thefollowing commandsetacl -dir @/se/kth -acl teacher rwid -time 01:00:00 13:00:00
gives the specified role teacher permissions to read, write, insert and delete (specified as rwid) underthe directory @/se/kth. The permissions are valid from 1 AM to 1 PM.
We suppose that except for PEP there will be only one instance of each component per VO. Each PEPshould be placed on the same host as the resource the PEP protects.

104 L. Lindback, V. Vlassov, S. Mokarizadeh, and G. Violino
5.2. Scenario of Interaction with Security Components. A typical scenario of interactions betweensecurity components and VOFS peers is depicted in Figure 5.1. We distinguish four different phases: creatingusers and roles, creating security policies, authentication and access control.Creating users and roles (1) The VO administrator uses the VO Membership Service, VOMS to create users
and roles.Setting policies (2) The administrator uses the Policy Administration Point, PAP to create policies. (3) The
PAP stores the policies in the Policy Repository, PR. The PAP will invalidate the Policy Decision Point,PDP’s cache. It can be specified in a policy when it is valid. This can be specified as time, date andday of week ranges and any combination of these.
Authentication (4) The requester logs in to the VOMS, using a web based interface. If the requester isauthenticated, VOMS returns a token that is stored on the requesters’s computer.
VOFS access (5) The requester uses an application that accesses VOFS. The mount utility sends the tokenalong with the call to VOFS. The call is intercepted by the PEP which protects the VOFS peer. (6)The PEP asks the PDP whether the requester is allowed to access the peer. (7) The PDP asks thePolicy Information Point, PIP for the requesters’s roles. (8) The PIP contacts the VOMS to check ifthe token is valid and to get the user’s roles. (9) The PDP evaluates the policies stored in PR. (10) Ifaccess was granted, the call is let through to the VOFS peer.
5.3. Secure Communication. The goals of secure communication are1. To guarantee that PEPs get answers from the correct PDP;2. To guarantee that PDP gets answer from the correct VOMS;3. To guarantee that the token identifying a user is not stolen. If it is stolen it can be used to impersonate
that user.The first two goals can be met using certificates to identify PDP and VOMS. Regarding the third goal,
there are the following risks that the token is stolen:1. During transfer (this risk is eliminated with encrypted communication);2. From the user’s computer;3. By a malicious node pretending to be a VOFS peer;4. By another VOFS peer.
The second risk can be reduced if the VOMS encrypts the token with the user’s public key. Before thetoken is passed to another peer it is decrypted with the user’s private key. This means it is not possible to stealthe token from a file in the user’s local file system, unless also the user’s private key is stolen.
The third risk is that someone writes a program that is not a VOFS peer but can issue correct commandsto join the VOFS. If other peers believe it is part of the VOFS and communicates with it, it will get tokens ofother users. This risk is eliminated if peers only communicate with other peers that can prove they are allowedby VOMS to take part in VOFS. To achieve this it is necessary that all peers can prove their identity usinga certificate signed by a trusted certificate authority, CA. Such a certificate will contain the host address ofthe peer and will be issued by the VOMS that runs the trusted CA. Each peer will get its certificate from theVOMS at startup, VOMS maintains a list of allowed peers.
The fourth risk is that a trusted VOFS peer is compromised by a malicious user that changes it to reportcalling peer’s tokens. This risk can not be eliminated since the purpose of passing the token is to let thereceiving peer impersonate the user of the calling peer. The risk can be reduced in the same way as it is reducedusing proxy certificates [10], by restricting the life time of the token and by delegating only a subset of thedelegator’s rights.
None of the above solutions require the user to be aware that certificates are used. This makes the VOFSeasy to use also for non-experienced users.
6. Implementation of VOFS prototype. The VOFS prototype is implemented using Java Servlets,hence it can be executed on all platforms supporting Java Servlets. The prototype is bundled with ApacheTomcat. All that is needed to start it is to specify the PDP location and to start tomcat.
Figure 6.1 shows main components of the VOFS prototype briefly described below.PEP is a servlet filter that intercepts all incoming requests. It translates the WebDAV method of the call to
a VOFS operation and calls PDP (not shown in the figure) to check if the operation is permitted. Ifnot, an HTTP 403 (forbidden) code is returned.
WebdavServlet is the access point for remote peers and the local mount utility.

VOFS: A Secure Churn-Tolerant Grid File System 105
Fig. 6.1. VOFS implementation
ClientStub is a component that receives requests from WebdavServlet and forwards them to the correctcomponent.
MetaDataModule keeps meta-data, see section 3, and offers the longest prefix matching engine.LocalFileSystemStorage is a component that provides access to exposed files and directories.Cache caches remote data objects. If a searched object is not in the cache the call is forwarded to the remote
peer hosting it. The returned object is cached.WebDAV client API is used (responsible) for contacting remote peers to read or write data objects.ReconciliationMonitor is a component that continuously monitors the cache to see if an item in the cache
is newer than the master, if so updates the master.
7. Related Work. Sprite Network File System [11] is a distributed file system similar in some aspects toVOFS. Meta-data (location information) in VOFS with decentralized name service is handled in a similar wayto Sprite. However; the scopes of the two file systems are different: Sprite is designed to operate within LANs;whereas VOFS should operate over WANs. A main difference between VOFS and Sprite is that Sprite doesnot handle partitioning of the file tree since lookup for a file starts from root and proceeds downwards; whereasin VOFS longest prefix match is done on the entire path. VOFS allows virtual directories for keeping VOFSoperational while at least one real object is in the tree. This feature and support for disconnected operationmakes VOFS churn tolerant. Moreover, in Sprite every node exports resources under predefined prefixes andspecific sub-directories in the tree while in VOFS a node can expose anywhere in the tree.
There exist peer-to-peer (P2P) file systems, e.g. OceanStore [12], which were developed as a file storage(data store) for file sharing. A typical P2P file system is used to store/retrieve files without support for neitherPOSIX file API access (i. e. the systems are not mountable), nor security. Grid file systems in contrast to P2Pfile sharing systems strongly require authentication and authorization to protect files from unauthorized access.VOFS allows the VO members to define and set VO security policies to be enforced by the VOFS securityinfrastructure.
Examples of Grid file systems include gLite file catalogs [13], Gfarm [14], and Distributed File Services,DFS [15]. The gLite file catalogue service [13] is used to maintain location information about files and theirreplicas. In contrast to VOFS, gLite catalogue service is centralized and is a single point of failure. The Gfarmfile system [14] uses a virtual tree and virtual directories mapped to physical files by a metadata server, like thecentralized solution described in [3]. Gfarm is designed to be very scalable; however, its metadata server canbecome a bottleneck and is a single point of failure since it is not replicated in contrast to VOFS. DFS [15] isa P2P file and storage system that can be integrated with a Grid security mechanism. DFS, in contrast to thepresented VOFS, has no hierarchical namespace, but instead offers two P2P networks: one for storage space

106 L. Lindback, V. Vlassov, S. Mokarizadeh, and G. Violino
Fig. 8.1. Setup of performance test
and one for names and metadata. DFS is implemented using FUSE [16] that limits its usage only to Linux,while the WebDAV-based VOFS can run on multiple (if not all) operating system, e.g. MS Windows, Linux,Mac OS X.
Recently a number of cloud service providers and developers of cloud environments offer storage cloud so-lutions, which, in particular, provide storage (e.g. Amazons S3 [18]) and storage services based on that storage(e.g. Dropbox [19]) that allow to store, access and share files for many users for a reasonable price at anytime from anywhere, with high-quality of service guarantees. The cloud-based storage is an attractive stor-age solution for end-users, and it can also be integrated and used in Grids. However there are certain issues(common for any cloud solutions) to be considered when storing data on a cloud environment, namely, trustand a single vendor lock-in, as data are stored in the cloud storage provided by a cloud provider, rather thanon the computers of data owners or data sharers. In contrast to a cloud-based storage service, e.g. Drop-box, VOFS is formed of and builds on resources (storage) donated by VO members, and therefore one canexpect that members of the VO trust each other in providing a secure file system. From security perspective,Amazon S3 API provides both bucket (fine grained) and object level (coarse grained) access controls, whileVOFS does not support the notion of bucket level data management, hence; only provides object level ac-cess. Obviously, security mechanism in VOFS is not comparable with Amazon S3 API as file system space inVOFS is provided by volunteer collaboration between VO members which can not prevent back-door (unau-thorized) access to data stored in a host machine or cached on a VOFS peer. However this undesired situ-ation can be alleviated as we consider an implicit trust relationship between VO members. Also, it shouldbe clear that a VO member without permission to see a particular file will never be able to download thatfile. Hence, files are only stored on computers of members who are allowed to see the files. Finally, an ad-vantage of the VOFS security model is that files are never stored on a server. Files will only exist on thecomputers of the file owner and the VO members who are allowed to see the file. It is also worth noting thatVOFS is open and free (no vendor lock-in and only the members resources are used,) and that the VOFS isa file system, not just a storage area, that is the VOFS maintains a file tree built by its users data own-ers.
8. Performance. In order to evaluate performance of the VOFS prototype, we have performed a numberof evaluation experiments on the setup shown in Figure 8.1. The nodes used in the evaluation experiments arePCs with 1.86 GHz Intel Centrino CPUs and 1 GB RAM on a dedicated 100 Mbps LAN. We have evaluatedperformance of namespace updates, file transfer and file lookup.
We have done two measurements of the namespace update algorithm (see Fig. 8.2). The first measurementconcerns updates without lost messages. It shows how long time it takes for an update message to reach a nodethat is one, two, four and eight network hops away from the updating node. The second measurement showsrecovery of missed namespace update messages due to a node being disconnected from the node performing theupdates. Figure 8.2 shows how long it takes to get information about all namespace updates performed whilethe node was disconnected. This is measured with one, two, four and eight missed update messages. The timeis reduced if all lost messages are required and resent with one message, now there is one require and one resendper lost message. Figure 8.2 shows that the algorithm scales well.

VOFS: A Secure Churn-Tolerant Grid File System 107
Fig. 8.2. Namespace update performance.
Fig. 8.3. Lookup performance.
Figure 8.3 shows how long time it takes to find out which node exposes a given file. This is a local operation,since all nodes have information about the entire namespace. The lookup time is about 0.7 ms per file no matterhow many files are looked up.
The read test copies 100 files from a remote peer to the local file system (outside VOFS). The file cache isbig enough to contain all files. The results are presented in Fig. 8.4. The figure also depicts timings for copyingfiles within the local file system in order to compare performances of the local file system and VOFS. Bandwidthwhen transferring smaller files is lower because overhead takes proportionally more time. The overhead is mainlydue to that the mount utility (davfs2) reads file properties before transferring files.
The write test copies 100 files from the local file system (outside VOFS) to a remote peer. Results of writetest are in Fig. 8.4. Cache does not speed up performance since file content is written both to cache and toremote peer.
9. Conclusion. We have presented a churn tolerant VOFS that maintains a uniform namespace in adynamic environment, that is when nodes frequently join or leave the VOFS. The VOFS provides a sharedworkspace for VO members and it is easy to use. It includes VO membership management, authentication andauthorization. The VOFS Prototype is available at http://www.isk.kth.se/~leifl/vofs/.
Acknowledgments. Special thanks to Chen Xing ([email protected]) who implemented the first versionof the VOMS and the gossip based protocol.
REFERENCES
[1] O.T. Anderson et al: Global namespace for files, IBM systems Journal Vol 43, No 4 (2004)[2] WebDAV Community, http://www.webdav.org/[3] Hamid Reza Mizani, Liang Zheng, Vladimir Vlassov, Konstantin Popov: Design and Implementation of Virtual Organization
File System for Dynamic VOs. Proceedings of the 2008 11th IEEE International Conference on Computational Scienceand Engineering - Workshops - Volume 00, pp 77-82 (2008)
[4] davfs2, mount utility for WebDAV on Linux, http://dav.sourceforge.net/[5] Howard, John H: An Overview of the Andrew File System. Winter 1988 USENIX Conference Proceedings, pp. 23-26 (1988)[6] Rachid Guerraoui, Luıs Rodrigues: Introduction to Reliable Distributed Programming. Springer-Verlag, Berlin Heidelberg
(2006)

108 L. Lindback, V. Vlassov, S. Mokarizadeh, and G. Violino
Fig. 8.4. File transfer performance.
[7] NetDrive, mount utility for WebDAV and FTP on MS Windows, http://www.netdrive.net/[8] Lamia Benmouffok, Jean-Michel Busca, Joan Manuel Marqus, Marc Shapiro, Pierre Sutra, Georgios Tsoukalas: Telex: Princi-
pled System Support for Write-Sharing in Collaborative Applications. Research Rapport, INRIA RR-6546 (2008)[9] Bo Lang, Ian Foster, Frank Siebenlist, Rachana Ananthakrishnan, Tim Freeman: A Multipolicy Authorization Framework for
Grid Security. in Proceedings of the Fifth IEEE Symposium on Network Computing and Application, pp 269-272 (2006)[10] Von Welch, Ian Foster, Carl Kesselman, Olle Mulmo, Laura Pearlman, Steven Tuecke, Jarek Gawor, Sam Meder, Frank
Siebenlist: X.509 Proxy Certificates for Dynamic Delegation. In Proceedings of the 3rd Annual PKI R&D Workshop(2004)
[11] Brent Welch, John Ousterhout: Prefix Tables: A Simple Mechanism for Locating Files in a Distributed System. Report No.UCB/CSD 56/261, Computer Science Division, University of California, Berkeley, California (1985)
[12] Sean Rhea, Patrick Eaton, Dennis Geels, Hakim Weatherspoon, Ben Zhao, and John Kubiatowicz: Pond: the OceanStorePrototype. Proceedings of the 2nd USENIX Conference on File and Storage Technologies, San Francisco, pp 1-14 (2003)
[13] gLite, middleware for grid computing, http://glite.web.cern.ch/glite/[14] Osamu Tatebe, Satoshi Sekiguchi, Youhei Morita, Noriyuki Soda, Satoshi Matsuoka: GFARM V2: A Grid File System that
Supports High-Performance Distributed and Parallel Data Computing. Computing in High Energy Physics and NuclearPhysics, Interlaken, Switzerland, pp.1172 (2004)
[15] Antony Chazapis, Georgios Tsoukalas, Georgios Verigakis, Kornilios Kourtis, Aristidis Sotiropoulos, Nectarios Koziris: Global-scale peer-to-peer file services with DFS. Grid Computing, 2007 8th IEEE/ACM International Conference on, pp 251-258(2007)
[16] FUSE: Filesystem in Userspace, http://fuse.sourceforge.net/[17] Leif Lindback, Vladimir Vlassov, Shahab Mokarizadeh, and Gabriele Violino: Churn Tolerant Virtual Organization File System
for Grids, the 4th Grid Applications and Middleware Workshop (GAMW’2009) in conjunction with PPAM 2009, Wroclaw,Poland, September 13-16, 2009—to appear.
[18] Amazon Simple Storage Service (Amazon S3), http://aws.amazon.com/s3/[19] Dropbox - Home - Online backup, file sync and sharing made easy, https://www.dropbox.com/
Edited by: Ewa DeelmanReceived: March 30, 2010Accepted: May 25, 2010

Scalable Computing: Practice and ExperienceVolume 11, Number 2, pp. 109–120. http://www.scpe.org
ISSN 1895-1767c© 2010 SCPE
MATCHING JOBS WITH RESOURCES: AN APPLICATION-DRIVEN APPROACH
A. CLEMATIS†, A. CORANA‡, D. D’AGOSTINO†, A. GALIZIA†, AND A. QUARATI†
Abstract. We present a distributed matchmaking methodology based on a two-level (low-level and application-level) bench-marking, that allows the specification of both syntactic and performance requirements. In particular, we point out how the use ofapplication-level benchmarks gives a more accurate characterization of resources, so enabling a better exploitation of Grid power.The proposed methodology relies on the use of standard description languages at both application and resource sides, to fosterinteroperability. Moreover, the proposed tool is independent of the underlying middleware, and its distributed structure supportsscalability.
Key words: grid platforms, benchmark-driven resource matchmaking, job submission languages extensions, interoperability
1. Introduction. Grid platforms supply users with a very large number of different resources to executedemanding applications. To exploit at best Grid power, efficient query and discovery tools are needed, able toprovide a good matching of user requirements with resource characteristics. Unfortunately, Grid middlewareoffer only basic services for the retrieving of information about single resources, and thus they are often inad-equate to describe more detailed and specific user requirements. So, usually, a matchmaking component (e.g.broker, matchmaker) manages over the middleware this supply-demand coupling process [1].
Some general criteria must be followed to provide a suitable and effective Grid matchmaker: a concise butas complete as possible description of application needs and resource properties, grounded on a common andshared basis, to assure interoperability; the management of both syntactic and performance requirements; theindependence of the underlying middleware; a distributed structure, to allow scalability.
During past years we developed the tool GEDA (Grid Explorer for Distributed Applications), based on adistributed approach for Grid resource discovery, which combines a structured view of resources (single machines,homogeneous and heterogeneous clusters) at the Physical Organization (PO) level with an overlay networkconnecting the various POs [2, 3]. The GEDA architecture is modular and independent of the particular Gridmiddleware, although we worked with Globus Toolkit 4 [4]. The system is particularly suitable for discoveringresources for structured parallel applications on large Grids.
To enhance the efficiency of the tool we develop a methodology to improve the matchmaking process basedon information about performance of resources. Our aim is to supplement the basic information available viathe Grid Information and Monitoring services by annotating resources with both low-level and application-specific performance metrics. These relevant aspects of resources could be examined by a broker to filter outthe solutions that best fit application requirements.
Indeed, benchmarking is a widespread method to measure and evaluate performance of computer platforms[5]. Particularly, application-specific benchmarks are widely acknowledged tools in the High-Performance Com-puting (HPC) domain, to measure the performance of resources stressing simultaneously several aspects of thesystem. Notwithstanding, so far application benchmarks have not been extensively considered on the Grid,owing to various problems, such as very diversified types of applications, architectural complexity, dynamicGrid behavior, and heavy computational costs [6].
On this basis, we design GREEN (GRid Environment ENabler), a Grid service which represents an enhancedversion of GEDA, whose main improvement is the management of benchmarks for a more precise characterizationof resources. GREEN is a distributed matchmaker which complies with the above specifications, useful bothfor Grid administrators and users. It assists administrators in the insertion of benchmark information relatedto every PO composing the Grid, and provides users with features which a) facilitate the submission of jobexecution requests, by specifying both syntactic and performance requirements on resources; b) support theautomatic discovery and selection of the most appropriate resources. The aim of GREEN is the discovery ofthe resources that satisfy user requirements and their ordering by performance ranking. The selection phase isleft to a (meta)scheduler, allowing to apply the preferred scheduling policies to meet specific purposes.
An important point of our work is the use of both low-level and application-level benchmarks. Indeed, oftenit can occur that the rankings of resources based on low-level and application-level benchmarks are different,
†IMATI-CNR, Via De Marini 6, 16149 Genova, Italy‡IEIIT-CNR, Via De Marini 6, 16149 Genova, Italy
109

110 A. Clematis, A. Corana, D. D’Agostino, A. Galizia and A. Quarati
with the second one usually closer to the effective performance obtainable by the user application. In this sensethe use of application-level benchmarks allows a better exploitation of Grid resources.
Another important design goal of GREEN is interoperability. To this end, a unique standard language,namely JSDL (Job Submission Description Language) [7], is used to express job submission requirements, and aninternal translation to the job submission languages used by the various middleware is performed. Middlewareindependence is pursued through an extension of JSDL in conformity with the GLUE (Grid Laboratory fora Uniform Environment) schema v. 2.0 [8]. Moreover, since we are interested in the execution of parallelapplications, we borrowed from JSDL SPMD [9] some extensions to JSDL related to concurrency aspects.
This paper summarizes design principles, and provides an extended and modified version of the work [10];main extensions regard the presentation of some experimental data on two different high performance platforms,and some preliminary results highlighting the usefulness of the proposed approach in a Grid environment.
The paper is organized as follow. Section 2 gives a brief overview on the state of the art about matchmakingand benchmarking on the Grid; Section 3 discusses the main contributions in the field of job and resourcecharacterization languages. Section 4 briefly outlines the two-level benchmarking methodology, while Section 5reports some preliminary experimental data collected on two parallel machines enlightening the usefulness of ourapproach. Section 6 gives a proof of concept of its adoption. Section 7 describes the design issues of GREEN,and an analysis of the extensions operated to existing languages. Section 8 gives some concluding remarks.
2. Related Works. The implementation of an efficient and automatic mechanism for the effective discov-ery of the resource that best suits a user job is one of the major problems in present Grids.
An important requirement is scalability, that is assured avoiding centralized structures; for example in [11]the Vigne tool is proposed, whose main features are a simple abstract view of resources, an application managerwhich selects resources using a resource allocator based on scalable and distributed discovery, and a decentralizedoverlay network. However, the tool does not support benchmark information.
The Globus toolkit does not provide a resource matchmaking/brokering as a core service, but the GridWaymetascheduler [12, 13] was included as an optional high-level service since June 2007. GridWay provides dy-namic scheduling, performance slowdown detection, opportunistic and on request migration, and fault recoverymechanisms. The main drawback of GridWay is that it allows users to specify only a fixed and limited set ofresource requirements, most of them related to the queue policies of the underlying batch job systems. Thischoice limits the ranking of resources, and benchmarks are not considered at all.
On the contrary, gLite has a native matchmaking/brokering service that takes into account a richer set ofrequirements, including benchmark values [14]. However, this service is based on a semi-centralized approach,and may result in long waiting time in the job execution. Moreover, at the moment only the SPEC benchmarksuite is considered, which mainly evaluates CPU performance; thus, the description of resources is partial, andcan be inadequate to specific application requirements.
Work Binder [15] is a tool developed for the gLite middleware, based on the use of pilot jobs and aimedat assuring to incoming applications a fast access to computing resources; the tool is specifically designed tosupport interactive applications and on-demand computing, and can be adapted for different middleware.
A way to improve the efficiency of resource discovery, is to drive the search towards resources that showngood performance in the execution of jobs with similar or known behaviour. As explained in Section 3, thecharacterization of Grid resources based on pre-computed benchmarks seems a valid strategy to follow. Theimportance of benchmarking to evaluate resources in a Grid environment is largely acknowledged together withthe criticalities that this task implies [16]. Actually, besides the set of interesting parameters to measure (e.g.CPU speed, memory size) different factors have to be taken into account when considering the execution of abenchmark suite on a Grid.
Several works proposed tools to manage and execute benchmarking on Grid. The Grid Assessment Probes[17] attempt to provide an insight into the stability, robustness, and performance of the Grid. The probes aredesigned to serve as simple Grid application exemplars and diagnostic tools. They test and measure performanceof basic Grid functions, including file transfer, remote execution, and Grid Information Services (ISs) response.
The GridBench [18] is a modular tool aimed at exploring large-scale Grids in a interactive manner, takinginto account performance aspects, adding new metrics to the basic ones supplied by middleware. It providesa graphical interface to define, execute and administrate benchmarks, also considering interconnection perfor-mance and resource workload. GridBench makes use of plug-ins to assure interoperability with the variousmiddleware (currently Globus and gLite).
Matching Jobs With Resources 111
The NAS Grid Benchmark (NGB) suite [19] is defined by NASA, and represents typical activities of Compu-tational Fluid Dynamics applications. It provides a set of computationally intensive benchmarks representativeof scientific, post-processing and visualization workloads, and tests the Grid capabilities to manage and executedistributed applications. It uses four kinds of data-flow graphs according to parallel paradigms extracted fromreal applications in NASA.
All tools described above do not provide mechanisms for the submission of jobs and for their matchingwith resources. A brokering mechanism based on benchmarking of Grid resources is proposed in [20]. However,the scope of that broker is focused on the ARC middleware and the NorduGrid and SweGrid productionenvironments, and it adopts xRSL, an extension of RSL (Resource Specification Language), to submit user’sjobs. As a consequence, this approach lacks in generality and interoperability.
3. Resource and Job Characterization. To accomplish the matchmaking task, a proper description ofresources is required at resource/owner and job/user side. To this end, different projects and research groupshave proposed different languages.
At the resource side, adequate information is required to advertise resource’s static (e.g. OS, number ofprocessors) and dynamic (e.g. number of executing tasks, amount of free memory) properties. Actually, themain efforts in the direction of a standard resource description language come from the GLUE Working Group,which deployed the GLUE schema [8]. It is a conceptual model of Grid entities comprising a set of informationspecifications for Grid resources; an implementation through an XML Schema is given in [21]. As the schemahas evolved during years, different versions have been used by various middleware, leading to the GLUE 2.0specification. It allows the benchmarking characterization of resources by specifying the Benchmark t complextype referencing benchmarks of type defined by BenchmarkType t. Through the latter, declared as an open andextensible enumeration type, it is possible to specify a benchmark amongst a list of six values (e.g. specint2000,specfp2000, cint2006). However, other values compatible with the string type and with the recommended syntaxare allowed.
At the user side, a job submission request expressed via a Job Submission Language (JSL), in addition tostating the application-related attributes (e.g. name and location of source code, input and output files), shouldexpress syntactic requirements (e.g. number of processors, main memory) and ranking preferences (if any) toguide and constraint the matching process on resources.
The Job Description Document (JDD) [22], introduced by Globus Alliance with the Web Services versions ofthe Globus Toolkit, defines an XML language closer to the XMLish dialects used in the Web Services ResourceFramework (WSRF) family. The main purpose of a JDD document is to set the parameters for the correctexecution of a job. The selection of the facilities to use has to be performed in advance by interacting with theWS MDS services of the available resources. In the JDD schema, it is possible to specify only few requirements,as the minimum amount of memory, or to set useful information as the expected maximum amount of CPUtime. It is however possible to extend the schema with user-defined elements.
The European Data Grid Project proposed the Job Description Language (JDL), afterwards adopted bythe EGEE project [23]. A JDL document contains a flat list of argument-value pairs, specifying two classes ofjob properties: job specific attributes and resources-related properties (e.g. Requirements and Ranks) used toguide the matching process towards the most appropriate resources. These values can be arbitrary expressionsusing the fields published by the resources in the MDS, and are not part of the predefined set of attributes forthe JDL, as their naming and meaning depend on the adopted Information Service schema. In this way, JDLis independent of the resources information schema adopted.
The Job Submission Description Language (JSDL) developed by the JSDL- Working Group [7] of theGlobal Grid Forum, aims to synthesize consolidated and common features available in other JSLs, obtaininga standard language for the Grid. JSDL contains a vocabulary and normative XML Schema facilitating thedeclaration of job requirements as a set of XML elements. Likewise JDL, job attributes may be grouped in twoclasses. The JobIdentification, Application and DataStaging elements describe job-related properties. TheResources element lists some of the main attributes used to constraint the selection of the feasible resources(e.g. CPUArchitecture, FileSystem, TotalCPUTime). Since only a rather reduced set of these elements isstated by the JSDL schema, an extension mechanism is foreseen. Examples of JSDL extensions able to capturea more detailed description of the degree of parallelism of jobs are presented in [9, 24].
In Section 7 we present our proposal aimed at extending GLUE and JSDL with elements capable of ac-counting for the association of benchmarks data at both user and resource sides.

112 A. Clematis, A. Corana, D. D’Agostino, A. Galizia and A. Quarati
4. A Two-Level Benchmarking Methodology. To describe Grid resources, we propose a two-levelmethodology aimed at giving a useful enriched description of resources, and at facilitating the matchmakingprocess. Our methodology considers two approaches: I) the use of micro-benchmarks to supply a basic de-scription of resource performance; II) the deployment of application-driven benchmarks to get a closer insightinto the behavior of resources under more realistic conditions of a class of applications. Application-drivenbenchmarks can consist of:
a) the application itself, often in a light version obtained choosing a reference input data set and spe-cific parameters to avoid long executions, obtaining in the meantime a representative run of the realapplication;
b) a suitable benchmark or benchmark suite belonging to the same class of the application of interest (e.g.the LINPACK benchmark for the class of linear algebra applications).
Through application-driven benchmarks, it is possible to add an evaluation of the resources on the basis of thesystem indicators that are more stressed by an application. Our present aim is to provide a proper descriptionof each Grid resource in isolation, i. e. without considering complexity aspects of Grid environments. Futuredevelopments of our work foreseen to address more complex scenarios.
4.1. Micro-Benchmarks. In order to supply a basic resource characterization, mainly based on low-level performance capacity, we consider the use of traditional micro-benchmarks. To this aim, a reasonableassumption is that the performance of a machine mainly depends on the CPU, the memory and the cache, andon the interconnection network [25]; therefore, we choose a concise number of parameters to evaluate in order toprovide an easy-to-use description of the various nodes. Table 4.1 shows resource properties and related metricsmeasured by the micro-benchmarks we employed.
Table 4.1Low-level benchmarks and related metrics.
Resource Capability CPU Memory Memory-Cache Interconnection I/O
Metric MFLOPS MB/sec MB/sec MB/sec MB/sec
Benchmark Flops Stream CacheBench Mpptest Bonnie
Flops provides an estimate of peak floating-point performance (MFLOPS); Stream is the standard bench-mark for measuring sustained memory bandwidth, as it works with datasets much larger than the availablecache; CacheBench is designed to characterize the performance of possibly multiple levels of cache present onthe processor; Mpptest measures the performance of some basic MPI communication routines; Bonnie performsa series of tests on a file of known size (default 100 MB).
The micro-benchmarks used in this phase generally return more than one value; so, to obtain resultseasily usable in the matchmaking process, we considered for each benchmark synthetic parameters or the mostsignificant value. They are used to characterize resources by populating the benchmark description managedby GREEN.
4.2. Application-Specific Benchmarks. Micro benchmarks are a good solution when the user has littleinformation about the job she/he is submitting, and for applications that are not frequently executed. Indeed,very often the participants to a Virtual Organization have similar aims, and therefore it is possible to identify aset of the most used applications. In these cases the most suitable approach is to evaluate system performancethrough application-specific benchmarks that approximate at best the real application workload. This kind ofbenchmarks represent the second level of our methodology.
As case studies for this level we considered some applications of our interest, i. e. image processing, isosurfaceextraction, and linear algebra. For the first two classes of applications, we choose a light version code aiming toemphasize precise aspects of the considered metrics. With respect to image processing, we selected a computeintensive elaboration applied to a reference image of about 1 MB; in this way CPU metrics are mainly stressed.The isosurface extraction application provides a more exhaustive performance evaluation of the system, as alsoI/O operations are heavily involved. In this case, we considered the processing of a small 3D data set of 16 MB,producing a mesh made by 4 million triangles. On the contrary, to represent the class of applications based onlinear algebra, we used the well known Linpack benchmark [26]. For application-driven benchmarks, the metricconsidered to characterize resources is execution time. Similarly to the micro-benchmarks case, the results arestored in the internal data structures of GREEN.

Matching Jobs With Resources 113
5. Benchmarking resources. To evaluate the effectiveness of our methodology in resource characteriza-tion, we performed some experiments on several resources normally used to deploy and execute our applications.For sake of simplicity, here we focus on two specific high-performance resources: 1) the Michelangelo system,
Fig. 5.1. Comparison between resources according to FLOPS benchmark.
made up of 53 nodes interconnected by a Gigabit switched Ethernet. As a whole, the system provides 212AMD Opteron 275 dual core with a clock rate of 2.2 GHz. Each CPU is equipped with 2 GB RAM, and thetotal shared storage amounts to 30 TB [27]. 2) the SiCortex SC1458 system with 243 SiCortex node chips,each equipped with six cores, and linked by a proprietary interconnection network supporting a large messagebandwidth of 4 GBytes/sec. This system pursues the Green Computing guidelines, through extremely lowenergy consumption [28].
By a quick comparison clearly emerges that the two resources greatly differ both in terms of the totalnumber of CPUs and in terms of single CPU performance. In fact, SC1458 has a greater number of CPUs thanthe Michelangelo cluster, but the latter has faster CPUs. Despite these technical differences from which onemay infer consequent performance results, this expectation is contradicted by our experiments as shown by thefollowing discussion.
Fig. 5.2. Comparison between resources according to STREAM benchmark.
Starting from micro-benchmark results, the SC1458 achieves better performance in almost all cases andparameters evaluated, when considering aggregate computing power. However, its single cores have relativelylow performance compared with the single CPU of the Michelangelo cluster, and the actual power of the resource

114 A. Clematis, A. Corana, D. D’Agostino, A. Galizia and A. Quarati
derives from the high number of provided cores and the native fast connection among processes. To outline CPUperformance we depicted in Figures 5.1 and 5.2 the results obtained with FLOPS and STREAM benchmarks.
Fig. 5.3. Comparison between resources according to CacheBench.
Both benchmarks have been run on a CPU/core independently, and then the aggregated results are gatheredto represent the performance of the whole parallel resources [16].
With respect to the cache evaluation, Figure 5.3 shows that Michelangelo performs better for all vectorlengths. On the contrary, with respect to interconnection evaluation, the SC1458 achieved definitely betterperformance, as reported in Figure 5.4. We tested point-to-point communication performance, through theMPPTest benchmark; results are expressed in MB/Sec. As mentioned above, the Michelangelo Cluster employsa Gigabit switched Ethernet, while SC1458 has a proprietary interconnection network that performs significantlybetter.
Fig. 5.4. Comparison between resources according to MPPTest benchmark.
Considering the second level of benchmark, the situation is quite different. In fact, depending on theapplication domain, best results are achieved alternatively by the two resources.
We conducted our tests considering the execution times (Wall Clock Time) as metric to evaluate perfor-mance. The results are normalized according to a base value; to this end, we adopted the values returnedfrom the Michelangelo cluster. Tables 5.1 and 5.2 report the values obtained for Image Processing (IP), Iso-surface Extraction (IE) and High-Performance Linpack (HPL) benchmarks. In the latter case, we examinedseparately the use of different sets of processors (32, 64 and 128 for both). Due to the chosen metric, lowervalues correspond to better execution times.

Matching Jobs With Resources 115
Table 5.1Application-level benchmarks, execution time normalized with respect to Michelangelo.
Michelangelo SC1458
Isosurface Extraction 1 6.1
Image Processing 1 3.2
Table 5.2Application-level benchmarks, execution time normalized with respect to Michelangelo.
Michelangelo SC1458
32p 64p 128p 32p 64p 128p
HPL 1 0.3 0.2 0.44 0.13 0.08
Table 5.1 shows that Michelangelo cluster performed significantly better considering the Image Process-ing and the Isosurface Extraction applications. Instead, Table 5.2 reporting the results related to the HPLbenchmark highlights that SC1458 outperforms Michelangelo up to a factor 3, when increasing the numberof processes. This behaviour depends on the different requirements of the various applications. As to ImageProcessing and Isosurface Extraction resulted that they benefit from fast single CPU and cache memory, whileHPL tests the entire system and benefits from high number of processes linked with fast connections. Startingfrom these remarks, it is quite evident that the Michelangelo cluster is faster in the execution of IP and IE,while it poorly performs with respect to HPL. On the contrary, with respect to HPL, SC1458 outdoes theMichelangelo Cluster, but it does not achieve good results on the considered image processing operations andisosurface extraction.
Following our methodology, the differences in the performance of both resources in each level of benchmarkclearly emerge. SC1458 definitely outperforms Michelangelo with respect to almost all micro-benchmarks.However, considering the second level of benchmark, the Michelangelo cluster appears as the suitable choice forthe execution of specific applications. This performance divergence also occurred in other similar comparisonswe conducted for the other benchmarks executed against the resources normally used to deploy and execute ourapplications. This behaviour testifies the appropriateness of our approach.
6. A proof of concept. To exemplify the potentialities of our methodology, we introduce a simplifiedevaluation that highlights the benefits of adopting a benchmark aware matchmaker. Let us consider a simplifiedGrid scenario setting three jobs (J1, J2 and J3) belonging to the Image Processing and Linear Algebra classes,that are executed against SC1458 and Michelangelo, denoted R1 and R2 respectively.
Table 6.1 reports the relative spped of resources R1 and R2 with respect to the two classes of applications.As shown in the previous Section, Michelangelo performs three times better than SC1458 for Image Processingapplications, while it is about two times slower than SC1458 for Linear Algebra applications.
Table 6.1Relative speed of resources with respect to the applications.
Applications R1 R2
Image Processing 3 1
Linear Algebra 0.43 1
Table 6.2 lists the jobs. In particular, J1 and J3 are two Image Processing jobs, and J3 is computationallyheavier since it processes a larger image. J2 is a Linear Algebra job. For each job the computational timerequired on the two resources is reported, expressed in seconds; the first column also shows the temporal instantat which the job is submitted.
In Figure 6.1-(a) we depicted the case in which our benchmark-driven methodology does not apply, nomatchmaker operates and jobs are scheduled on the first available resource in a FIFO order. In this case, whenJ1 arrives at time 0, it is mapped to R1 which employs 60 seconds to process it. At time 10, J2 arrives and ismapped to R2, which executes it in 80 seconds. When J3 arrives at time 20 no resources are available, henceJ3 is queued until one is released. This happens at time 60, when J1 terminates and J3 is assigned to R1 whichtakes 120 seconds to run it, ending at time 180.

116 A. Clematis, A. Corana, D. D’Agostino, A. Galizia and A. Quarati
Table 6.2Job characteristics.
Job Comp. Time on R1 (sec) Comp. Time on R2 (sec) Application
J1(0) 60 20 Image Processing
J2(10) 35 80 Linear Algebra
J3(20) 120 40 Image Processing
Let us now consider the case in which our methodology is applied and benchmark information is used todescribe resources, see Figure 6.1-(b). Now the matchmaker is at work and, when asked for a suitable resourceto execute the Image Processing job J1, it returns R2, since it ranks better than R1 on that job class. Runningthree times faster, R2 employs just 20 seconds to execute J1. When J2 arrives at time 10, R1 is selected andit takes about 35 seconds to complete the Linear Algebra job. Finally, J3 arrives and it is assigned to R2 thatin the meantime becomes free, and the job ends after 40 seconds. The overall computation in this case ends attime 60.
Fig. 6.1. (a) scheduling of three jobs without any matchmaker, (b) improvement of execution times when a benchmark-drivenmatchmaker is applied.
From our example it clearly emerges that the use of benchmark information could be adopted to improvescheduling strategy, raising the performance of the overall execution.
7. Benchmark-Driven Matchmaking. Due to the huge gap separating users and resources, tools thatallow the two parts to better come to an agreement are highly useful. In [2, 3] we presented GEDA, a Gridservice based on a distributed and cooperative approach for Grid resource discovery. It supplies users with astructured view of resources (single machines, homogeneous and heterogeneous clusters) at the PO level, andleverages on an overlay network infrastructure which connects the various POs constituting a Grid. For eachPO, a GEDA instance is deployed to keep updated information about the state of all PO’s resources, and toexchange them with other GEDA instances in the discovery phase.
In the present work, we describe an advanced version of GEDA, called GREEN, able to characterize Gridresources through benchmark evaluations. In this context, acting as a distributed matchmaker, GREEN man-ages and compares the enriched view of resources with user-submitted jobs, with the goal of selecting the mostappropriate resource(s). Operating at intermediate level between applications (e.g. schedulers) and Grid mid-dleware, GREEN aims to discover the whole set of resources satisfying user requirements ordered by ranks.The selection of a particular resource is left to a (meta)scheduler to which the resources set is forwarded; soit is possible to apply the preferred scheduling policies to optimize Grid throughput or other target functions

Matching Jobs With Resources 117
(e.g. response times, QoS). Once the “best” resource is chosen, GREEN will be re- invoked to carry-out thesubmission of the job on it, via the Execution Environment (EE).
7.1. Benchmarking Grid Resources. GREEN supplies Grid administrators with the facility of submit-ting, executing benchmarks (both micro and application-related) against the resources belonging to a certainadministrative domain (PO), and storing results.
To reflect the underlying view of Grid resources offered by the GLUE 2.0 specification language, and tosupport the matching mechanism (i. e. the comparison with resources information contained in the previouslyacquired XML) the benchmark-value copies are directly represented as GLUE entities according to the XMLreference realizations of GLUE 2.0. By employing the openness of BenchmarkType t (as recalled in Section 3),the set of recognized benchmarks is extensible without any change in the document schema. An example of abenchmark document related to the execution of micro-benchmark Flops against the cluster identified by theIP 150.145.8.160, resulting in 480 MFlops is:<Benchmark>
<LocalID>150.145.8.160</LocalID>
<Type>MFlops</Type>
<Value>480</Value>
<BenchLevel>micro</BenchLevel>
</Benchmark>
Through the use of the extension mechanism defined in GLUE specification, we enriched the Benchmark t
type by adding the element BenchLevel which specifies the benchmark level (by accepting the two string valuesmicro and application) according to our two-level methodology.
Once a benchmark is executed and its results collected, an XML fragment, similar to the one reportedabove, is created for each resource and inserted in an XML document (namely Benchmark image), managed byGREEN, which collects all benchmark evaluations for the PO.
7.2. Extending JSDL. The counterpart of benchmarking resources is the ability for users submitting ajob to express their preferences about the performance of target machines. Resources are then ordered accordingto performance values (ranks). As explained in Section 3, both JDD and JSDL do not provide any constructable to express some preferential ordering on selected resources. We add the element Rank (of complex typeRank Type) devoted to this task, which embeds a sub-element BenchmarkType t corresponding to the onecontained in our extension of the GLUE schema. In the context of JSDL, the Value sub-element (see list below)is to be intended as a threshold to be satisfied by the corresponding Value (related to the benchmark stated byType) contained in the Benchmark element of any resource to be selected by the matchmaker before the rankingtakes place.
As we are interested in the execution of parallel applications, we borrowed from SPMD [9] an extensionto JSDL that supports users with a rich description set of applications and resources related to concurrencyaspects (e.g. number of processes, processes per host). The following is an example of an extended JSDLdocument, containing information related to parallel requirements, along with our extension to rank resourceson benchmark specification. The document is requesting for nodes able to execute the application-level “Iso-Surface Benchmark” in no more than 300 time units. Note how the Rank element has been located inside theResource one, according to the extension mechanism included by JSDL schema.<?xml version="1.0" encoding="UTF-8"?>
<jsdl:JobDefinition
xmlns:jsdl="http://schemas.ggf.org/jsdl/2005/11/jsdl"
xmlns:jsdl-posix="http://schemas.ggf.org/jsdl/2005/11/jsdl-posix"
xmlns:jsdl-spmd="http://schemas.ogf.org/jsdl/2007/02/jsdl-spmd"
xmlns:jsdl-
rank="http://saturno.ima.ge.cnr.it/ima/PONG/jsdl/2009/01/jsdl-rank">
<jsdl:JobDescription>
<jsdl:Application>
<jsdl:ApplicationName>ParIsoExtrctn</jsdl:ApplicationName>
<jsdl-spmd:SPMDApplication>
<jsdl-posix:Executable>parisoextraction</posix:Executable>

118 A. Clematis, A. Corana, D. D’Agostino, A. Galizia and A. Quarati
<jsdl-posix:Argument> inputvolume.raw</posix:Argument>
<jsdl-posix:Argument>200</posix:Argument>
<jsdl-posix:Output>isosurface.raw</posix:Output>
<jsdl-spmd:NumberOfProcesses>4</spmd:NumberOfProcesses>
<jsdl-spmd:ProcessesPerHost>2</spmd:ProcessesPerHost>
<jsdl-spmd:SPMDVariation>http://www.ogf.org/jsdl/2007/02/
jsdl-spmd/MPICH2</>
</jsdl-spmd:SPMDApplication>
</jsdl:Application>
<jsdl:Resources>
<jsdl:OperatingSystemType>
<jsdl:OperatingSystemName>LINUX</jsdl:OperatingSystemName>
</jsdl:OperatingSystemType>
<jsdl-rank:Rank>
<jsdl-rank:Type>IsoSurface_Benchmark</rank:Type>
<jsdl-rank:Value>300</rank:Value>
<jsdl-rank:BenchLevel>application</rank:BenchLevel>
</jsdl-rank:Rank>
</jsdl:Resources>
</jsdl:JobDescription>
</jsdl:JobDefinition>
7.3. Distributed Matchmaking Process. The main components of a GREEN instance along with someof their interactions with other middleware services, notably IS and EE, by considering a Grid composed ofseveral POs are shown in Figure 7.1. In the following, we summarise their roles and the behaviours.
Fig. 7.1. Example of the matching phase with various GREEN instances.
The Job Submission (JS) component receives requests of jobs submission initiated by users; depending onthe activation mode it behaves just like a messages dispatcher or as a translator of JSL documents, carryingout their subsequent submission to the EE. The Benchmark Evaluation (BE) supports administrators in theperformance-based characterization of PO resources. The Resource Discovery (RD) is in charge of feedingGREEN with the state of Grid resources. RD operates both locally and globally by carrying out two tasks:1) to discover the state of the PO resources; 2) to dispatch requests to other GREEN instances. As to the
Matching Jobs With Resources 119
first task, RD dialogues with the underlying IS (e.g. MDS, gLite IS) that periodically reports the state of thePO in the form of an XML file conformed to the GLUE version adopted by the underlying middleware. Thisdocument (namely the PO snapshot) is stored, as it is, and managed by GREEN to answer to external queriesissued by various clients (e.g. other GREEN instances, meta-schedulers). To accomplish the dispatching task,RD handles the so-called neighbors view. Depending on the number of POs, i. e. GREEN instances running,their management could consider different strategies, whose description is beyond the scope of the paper.
To deal with different underlying middleware transparently to Grid users and applications, the syntacticdifferences among the various versions of GLUE are managed by GREEN through a conversion mapping atmatching time. The Matchmaker performs the matching among resources in the Grid, and their subsequentranking, with the requirements expressed by the users through the application submission document.
More in detail, let us consider the case in which a user submits an extended JSDL document through aGrid portal (1). The document is managed by the Resource Selector component, which initiates the distributedmatchmaking by forwarding it to the JS component of a randomly selected GREEN instance (2) (e.g. PO2).JS activates the Matchmaker (3). This instance of matchmaker, namely the Master Matchmaker (MM), isresponsible to provide the set of candidate resources to the Resource selector for this specific request. MMthrough RD forwards the document to all the other known GREEN instances and contemporaneously checks itslocal memory (4-5). All the matchmakers filter their PO snapshot selecting the set of PO resources satisfyingthe query. By analyzing the pre-computed Benchmark image, the satisfying resources with a Value element(for the chosen benchmark) that fulfils the threshold fixed in the corresponding Rank element of the JSDLdocument are extracted. The resources identifiers and their corresponding benchmark values are included in alist, called PO list which is returned to MM (6-10). MM merges these lists with its own PO list, producing aGlobal List ordered on the ranking values. The Global list is passed to JS (11) which returns it back to RS (12).Besides applying the selection policy to determine the resource to use, the Resource Selector calls the JS of theGREEN responsible of the PO owning the selected machine (GREEN PO1’s instance in our case), by sendingit the extended JSDL document along with the data identifying the selected resource (13). JS translates theinformation regarding the job execution of the original JSDL document in the format proper of the specificPO middleware, stating the resource on which the computation takes place. In particular, it will produce aJDD document for GT4 resources or a JDL document for the gLite ones. Finally, it activates the ExecutionEnvironment in charge of executing the job represented in the translated document (14).
8. Conclusions. The efficient matchmaking of application requirements with characteristics of resourcesis a very important issue in Grid computing, and developing a satisfactory solution may greatly improve theusefulness of Grid platforms for a large class of potential applications. However this is not an easy task, owingto the high abstraction level of Grid platforms which causes a semantic gap between application requirementsand resource properties, the large number of possible Grid applications, the large number of available resources,the dynamicity of the Grid environment.
To reduce this gap we designed GREEN, a distributed matchmaker which provides Grid users with featuresto make easier the submission of job execution requests containing performance requirements, in order tosupport the automatic discovery and selection of the most suitable resource(s). GREEN relies on a two-levelbenchmarking methodology: resources are characterized by means of their performance evaluated through theexecution of low-level and application-specific benchmarks. According to our methodology, every resource of aPO is tagged with the results obtained through the execution of the two levels of benchmarks and hence it isselectable, on a performance basis, during the matchmaking phase. A preliminary analysis outlined promisingresults; thus future efforts are planned in the direction of a deeper evaluation of our proposal in the context ofa simulated Grid environment with particular emphasis on scheduling policies.
To ensure a good degree of independence from the underlying middleware, GREEN leverages on two stan-dards such as JSDL and GLUE, that have been properly extended to manage the performance-based descriptionof resources.
Acknowledgments. This work has been partially supported by project TECDOC-SIIT Under L.297 MiurProgramme.
120 A. Clematis, A. Corana, D. D’Agostino, A. Galizia and A. Quarati
REFERENCES
[1] X. Bai, H. Yu, Y. Ji and D. C. Marinescu, Resource matching and a matchmaking service for an intelligent Grid, Int.Journal of Computational Intelligence, 1 (2004), pp. 163–171.
[2] A. Clematis, A. Corana, D. D’Agostino, V. Gianuzzi and A. Merlo, Resource selection and application execution in aGrid: A migration experience from GT2 to GT4, in Lecture Notes in Computer Science n. 4276 (OTM 2006), R. Meersman,Z. Tari et al., eds., Springer, Berlin, 2008, pp. 1132–1142.
[3] A. Clematis, A. Corana, D. D’Agostino, V. Gianuzzi, A. Merlo and A. Quarati, A distributed approach for structuredresource discovery on Grid, in Proc. Int. Conference on Complex, Intelligent and Software Intensive Systems (CISIS 2008,Barcelona), IEEE Computer Society, 2008, pp. 117–125.
[4] I. Foster, Globus Toolkit Version 4: Software for Service-Oriented Systems, in Lecture Notes in Computer Science n. 3779(Proc. IFIP Int. Conference on Network and Parallel Computing), Springer, Berlin, 2005, pp. 2–13.
[5] R. W. Hockney, The science of computer benchmarking. Software, environments, tools, SIAM, Philadelphia, 1996.[6] F. Nadeem, R. Prodan, T. Fahringer and A. Iosup, Benchmarking Grid Applications for Performance and Scalability
Predictions, in Grid Middleware and Services: Challenges and Solutions (CoreGRID series), D.Talia, R.Yahyapour andW.Ziegler, eds., Springer, 2008, pp. 19–37.
[7] A. Anjomshoaa, F. Brisard, M. Drescher, D. Fellows, A. Ly, S. McGough, D. Pulsipher and A. Savva, Job SubmissionDescription Language (JSDL) Specification v1.0, Grid Forum Document GFD. 56, Open Grid Forum (OGF), 2005.
[8] S. Andreozzi et al., GLUE Specification v. 2.0 (rev. 3), Open Grid Forum (OGF), 2009.[9] A. Savva (Ed.), JSDL SPMD Application Extension, Version 1.0, Grid Forum Document GFD. 115, Open Grid Forum (OGF),
2007.[10] A. Clematis, A. Corana, D. D’Agostino, A. Galizia and A. Quarati, Performance based matchmaking on Grid, in
Lecture Notes in Computer Science n. 6068 (Proc. Int. Conf. on Parallel Processing and Applied Mathematics (PPAM2009), Wroclaw (Poland), September 13-16, 2009), R. Wyrzykowski, ed., Springer, Berlin, 2010, pp. 174–183.
[11] E. Jeanvoine, L. Rilling, C. Morin and D. Leprince, Using Overlay Networks to Build Operating System Services forLarge Scale Grids, Scalable Computing: Practice and Experience, 8 (2007), pp. 229-239.
[12] E. Huedo, R. S. Montero and I. M. Llorente, A Framework for Adaptive Scheduling and Execution on Grids, Software:Practice and Experience, 34 (2004), pp. 631–651.
[13] E. Huedo, R. S. Montero and I. M. Llorente, The GridWay Framework for Adaptive Scheduling and Execution on Grids,Scalable Computing: Practice and Experience, 6 (2005), pp. 1–8.
[14] gLite 3.1 User Guide, Doc. CERN-LCG-GDEIS-722398, January 2009 https://edms.cern.ch/file/722398/1.2/
gLite-3-UserGuide.html
[15] B. Marovic, M. Potocnik and B. Cukanovic, Multi-application bag of jobs for interactive and on-demand computing,Scalable Computing: Practice and Experience, 10 (2009), pp. 413-418.
[16] M. D. Dikaiakos, Grid benchmarking: vision, challenges, and current status, Concurrency and Computation: Practice andExperience, 19 (2007), pp. 89–105.
[17] G. Chun, H. Dail, H. Casanova and A. Snavely, Benchmark probes for Grid assessment, in 18th Int. Parallel and DistributedProcessing Symposium (IPDPS 2004), Santa Fe (USA), IEEE Computer Society, 2004, pp. 276.
[18] G. Tsouloupas and M. D. Dikaiakos, GridBench: A Tool for the Interactive Performance Exploration of Grid Infrastruc-tures, Journal of Parallel and Distributed Computing, 67 (2007), pp. 1029–1045.
[19] M. Frumking and R. F. Van der Wijngaart, NAS Grid Benchmarks: A tool for Grid space exploration, Cluster Computing,5 (2002), pp. 315-324.
[20] E. Elmroth and J. Tordsson, Grid resource brokering algorithms enabling advance reservations and resource selection basedon performance predictions, Future Generation Computer Systems, 24 (2008), pp. 585–593.
[21] S. Andreozzi (Ed.), GLUE v. 2.0 Reference Realizations to Concrete Data Models, Open Grid Forum (OGF), 2008.[22] M. Feller, I. Foster, S. Martin, GT4 GRAM: A Functionality and Performance Study, in Proc. 2007 TeraGrid Conference,
2007, Madison (USA) http://www.globus.org/toolkit/docs/4.2/4.2.0/user/gtuser-execution.html
[23] Job Description Language Attributes Specification for the gLite Middleware, Doc. EGEE-JRA1-TEC-555796-JDL-Attributes-v0-8, May 2006 https://edms.cern.ch/file/555796/1/EGEE-JRA1-TEC-555796-JDL-Attributes-v0-8.pdf
[24] I. Rodero, F. Guim, J. Corbal and J. Labarta, How the JSDL can Exploit the Parallelism?, in Sixth IEEE Int. Symposiumon Cluster Computing and the Grid (CCGRID’06), 2006, pp. 275–282.
[25] G. Tsouloupas and M. Dikaiakos, Characterization of Computational Grid Resources Using Low-level Benchmarks, in Proc.2nd IEEE Int. Conference on e-Science and Grid Computing, IEEE Computer Society, 2006, pp. 70.
[26] J. J. Dongarra, P. Luszczek and A. Petitet, The LINPACK benchmark: Past, present, and future, Concurrency andComputation: Practice and Experience, 15 (2003), pp. 1–18.
[27] Michelangelo Hardware, LITBIO Project http://www.supercomputing.it/At_Cilea/michelangelo_eng.htm
[28] SiCortex Home page, http://sicortex.com/
Edited by: Ewa DeelmanReceived: March 30, 2010Accepted: May 25, 2010
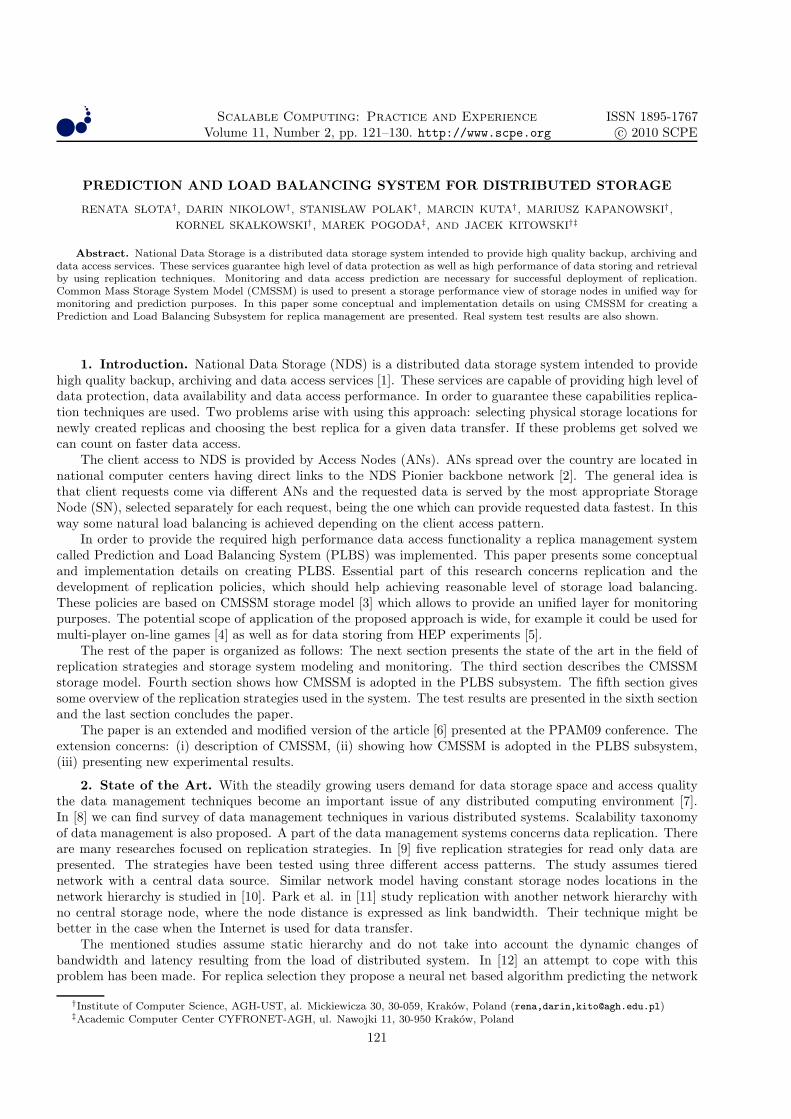
Scalable Computing: Practice and ExperienceVolume 11, Number 2, pp. 121–130. http://www.scpe.org
ISSN 1895-1767c© 2010 SCPE
PREDICTION AND LOAD BALANCING SYSTEM FOR DISTRIBUTED STORAGE
RENATA S LOTA†, DARIN NIKOLOW†, STANIS LAW POLAK†, MARCIN KUTA†, MARIUSZ KAPANOWSKI†,
KORNEL SKA LKOWSKI†, MAREK POGODA‡, AND JACEK KITOWSKI†‡
Abstract. National Data Storage is a distributed data storage system intended to provide high quality backup, archiving anddata access services. These services guarantee high level of data protection as well as high performance of data storing and retrievalby using replication techniques. Monitoring and data access prediction are necessary for successful deployment of replication.Common Mass Storage System Model (CMSSM) is used to present a storage performance view of storage nodes in unified way formonitoring and prediction purposes. In this paper some conceptual and implementation details on using CMSSM for creating aPrediction and Load Balancing Subsystem for replica management are presented. Real system test results are also shown.
1. Introduction. National Data Storage (NDS) is a distributed data storage system intended to providehigh quality backup, archiving and data access services [1]. These services are capable of providing high level ofdata protection, data availability and data access performance. In order to guarantee these capabilities replica-tion techniques are used. Two problems arise with using this approach: selecting physical storage locations fornewly created replicas and choosing the best replica for a given data transfer. If these problems get solved wecan count on faster data access.
The client access to NDS is provided by Access Nodes (ANs). ANs spread over the country are located innational computer centers having direct links to the NDS Pionier backbone network [2]. The general idea isthat client requests come via different ANs and the requested data is served by the most appropriate StorageNode (SN), selected separately for each request, being the one which can provide requested data fastest. In thisway some natural load balancing is achieved depending on the client access pattern.
In order to provide the required high performance data access functionality a replica management systemcalled Prediction and Load Balancing System (PLBS) was implemented. This paper presents some conceptualand implementation details on creating PLBS. Essential part of this research concerns replication and thedevelopment of replication policies, which should help achieving reasonable level of storage load balancing.These policies are based on CMSSM storage model [3] which allows to provide an unified layer for monitoringpurposes. The potential scope of application of the proposed approach is wide, for example it could be used formulti-player on-line games [4] as well as for data storing from HEP experiments [5].
The rest of the paper is organized as follows: The next section presents the state of the art in the field ofreplication strategies and storage system modeling and monitoring. The third section describes the CMSSMstorage model. Fourth section shows how CMSSM is adopted in the PLBS subsystem. The fifth section givessome overview of the replication strategies used in the system. The test results are presented in the sixth sectionand the last section concludes the paper.
The paper is an extended and modified version of the article [6] presented at the PPAM09 conference. Theextension concerns: (i) description of CMSSM, (ii) showing how CMSSM is adopted in the PLBS subsystem,(iii) presenting new experimental results.
2. State of the Art. With the steadily growing users demand for data storage space and access qualitythe data management techniques become an important issue of any distributed computing environment [7].In [8] we can find survey of data management techniques in various distributed systems. Scalability taxonomyof data management is also proposed. A part of the data management systems concerns data replication. Thereare many researches focused on replication strategies. In [9] five replication strategies for read only data arepresented. The strategies have been tested using three different access patterns. The study assumes tierednetwork with a central data source. Similar network model having constant storage nodes locations in thenetwork hierarchy is studied in [10]. Park et al. in [11] study replication with another network hierarchy withno central storage node, where the node distance is expressed as link bandwidth. Their technique might bebetter in the case when the Internet is used for data transfer.
The mentioned studies assume static hierarchy and do not take into account the dynamic changes ofbandwidth and latency resulting from the load of distributed system. In [12] an attempt to cope with thisproblem has been made. For replica selection they propose a neural net based algorithm predicting the network
†Institute of Computer Science, AGH-UST, al. Mickiewicza 30, 30-059, Krakow, Poland (rena,darin,[email protected])‡Academic Computer Center CYFRONET-AGH, ul. Nawojki 11, 30-950 Krakow, Poland
121

122 Renata S lota Darin Nikolow et al.
transfer time of a replica. Another example of research on replica access time prediction based on previous datatransfers measurements is [13] in which the Markov chains are used for prediction.
Authors of paper [14] propose 3 heuristic algorithms for selecting the location of new replica based onnetwork latency parameters and number of client requests observed in a certain time interval from the past.Fair-Share replication presented in [15] for choosing new replica location takes into account previous access loadof server as well as availability of storage device represented by their storage load. In this way better loadbalancing among the storage servers is achieved.
Tests of the proposed replication strategies in the studies mentioned by now are conducted by using simu-lations. Results of real implementation of proposed models and strategies using monitoring of existing storageenvironment are shown in [16] and in their previous studies. The presented in these papers replication algo-rithms embody, besides the data access cost imposed by the network, also the cost caused by storage devicescapabilities. In the case when a distributed storage system uses high bandwidth network it turns out thatthe system bottleneck are the storage devices, which bandwidth can be additionally limited according to theiractual access load.
The majority of replica selection algorithms assumes that many users access the same data sets. In thecase of data storage service holding mainly private user data, users will rather access their own particular files(holding backups or archives). That is why, essential in this case is access load balancing increasing the overallsystem utilization and thus reducing the access cost. In the proposed solution essential part of the processof existing replica selection and the process of new replica location selection is focused on the evaluating ofstorage system performance and evaluating of server load. The evaluation is based on the adopted CommonMass Storage System Model (CMSSM) proposed in [17].
Using of general monitoring system like Nagios [18], Ganglia [19] or Gemini [20] for monitoring the perfor-mance of HSM systems is troublesome since these systems do not provide the necessary utilities and methods ofdata gathering, for example, interactive queries to the monitored system or monitoring of storage request queue.Taking into account the heterogeneity of storage systems in term of hardware and software it is important tohave an unified access to the monitoring data. Some effort in this area is done by Distributed Management TaskForce [21] by specifying the Common Information Model (CIM) [22] for managing computer systems. SMI-S [23]is a CIM based standard which defines interface for managing storage environments. Grid Laboratory UniformEnvironment (GLUE) [24] is a conceptual, object-oriented, information model of Grid environments, and itsmain goal is to provide interoperability among elements of the Grid infrastructure. The above models do notaccurately present HSM systems.
The review of related works shows that the problem of data management for performance and load balancingpurposes in distributed system with underlying HSM systems as storage horses is not fully addressed whichmotivated us to start this research.
3. Common Mass Storage System Model. Storage systems used in modern grid-like computing en-vironment are often heterogeneous for historic or economics reasons. Within a virtualized environment withdynamic changing parameters a proper performance monitoring is a hard task. The lack of an unified represen-tation of performance related view of storage systems and especially of HSM storage system was the motivationfor developing the Common Mass Storage System Model [3].
The model supports various storage systems with special attention taken to the HSM systems. In the modela set of performance related parameters are defined and grouped in appropriated classes according to type ofstorage subsystems or parts (e.g. tape drive, library, etc) they are related to.
The model can be used for internal object based representation of storage system for simulation purposesand is used by various monitoring services to give a performance point of view at the given storage system.
The class diagram for the model representing HSM systems is shown in Fig.3.1. The model is able torepresent any HSM systems with a certain accuracy, which depends on the vendor’s availability of methods forobtaining the performance related parameters specified in the model. We can see that the model can be quiteaccurate since parameters like queue of waiting requests with detailed information about each request are speci-fied. This allows for very accurate performance prediction for a particular piece of data residing anywhere in thestorage hierarchy since it is possible to monitor where the data resides - on disk cache or tertiary storage (whichtape, block, etc), it is possible to monitor if there are free resources (for example tape drives) to fulfill the request.
Our vision of a general distributed storage system which makes use of CMSSM for data access predictionis presented in Fig.3.2. The system has well defined functional layers. On the bottom there is the storage layer

Prediction and Load Balancing System for Distributed Storage 123
Fig. 3.1. CMSSM’s class diagram for HSM system.
Local Disk
Storage layer
Monitoring layer
Estimation layer
Data Management
HSM System Disk Array
Fig. 3.2. Layered view of distributed storage system with data access prediction using CMSSM.
representing complete storage systems (hardware + software) like HSM systems, disk arrays, etc. Sensor layercontains pieces of software which are able to obtain one or more parameters about the given storage system.Generally, sensors are storage system dependent, but in some cases, like for instance a sensor measuring theread/write performance by doing real file I/O, one sensor can fit to more than one types of storage system.Sensors have well defined interface and can be included as plugins to a higher level monitor. Monitoring layercontains of monitors running on the monitored storage node. Monitors have well defined unified interfaceallowing other services to get selected parameters from them via the network. Requested parameters are sentin data format compatible with CMSSM. Estimation layer contains estimation services, which estimates theperformance of storage system or time-to-complete for particular future data transfer. There can be variousestimation services using different algorithms and having different estimation accuracy.
Services associated with a certain layer can use services from the lower layers and can bypass layers. Forinstance management layer service can use directly storage layer tools.
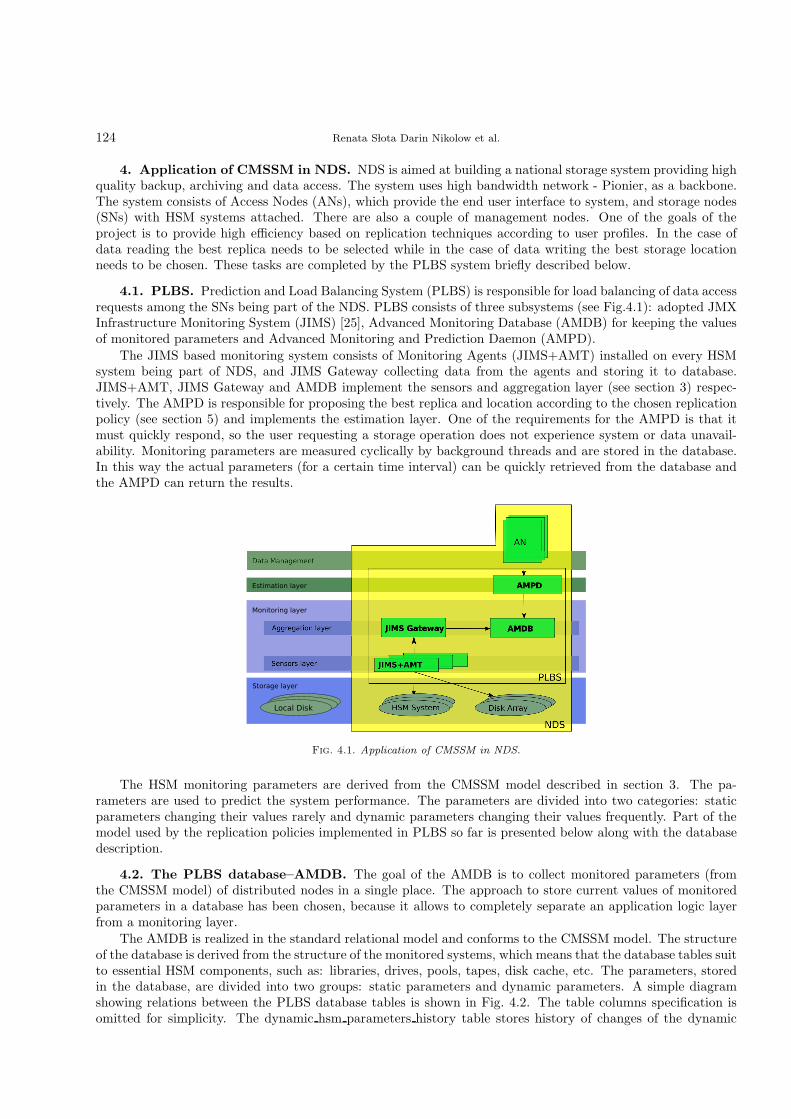
124 Renata S lota Darin Nikolow et al.
4. Application of CMSSM in NDS. NDS is aimed at building a national storage system providing highquality backup, archiving and data access. The system uses high bandwidth network - Pionier, as a backbone.The system consists of Access Nodes (ANs), which provide the end user interface to system, and storage nodes(SNs) with HSM systems attached. There are also a couple of management nodes. One of the goals of theproject is to provide high efficiency based on replication techniques according to user profiles. In the case ofdata reading the best replica needs to be selected while in the case of data writing the best storage locationneeds to be chosen. These tasks are completed by the PLBS system briefly described below.
4.1. PLBS. Prediction and Load Balancing System (PLBS) is responsible for load balancing of data accessrequests among the SNs being part of the NDS. PLBS consists of three subsystems (see Fig.4.1): adopted JMXInfrastructure Monitoring System (JIMS) [25], Advanced Monitoring Database (AMDB) for keeping the valuesof monitored parameters and Advanced Monitoring and Prediction Daemon (AMPD).
The JIMS based monitoring system consists of Monitoring Agents (JIMS+AMT) installed on every HSMsystem being part of NDS, and JIMS Gateway collecting data from the agents and storing it to database.JIMS+AMT, JIMS Gateway and AMDB implement the sensors and aggregation layer (see section 3) respec-tively. The AMPD is responsible for proposing the best replica and location according to the chosen replicationpolicy (see section 5) and implements the estimation layer. One of the requirements for the AMPD is that itmust quickly respond, so the user requesting a storage operation does not experience system or data unavail-ability. Monitoring parameters are measured cyclically by background threads and are stored in the database.In this way the actual parameters (for a certain time interval) can be quickly retrieved from the database andthe AMPD can return the results.
Local Disk
Storage layer
Monitoring layer
Estimation layer
Data Management
Fig. 4.1. Application of CMSSM in NDS.
The HSM monitoring parameters are derived from the CMSSM model described in section 3. The pa-rameters are used to predict the system performance. The parameters are divided into two categories: staticparameters changing their values rarely and dynamic parameters changing their values frequently. Part of themodel used by the replication policies implemented in PLBS so far is presented below along with the databasedescription.
4.2. The PLBS database–AMDB. The goal of the AMDB is to collect monitored parameters (fromthe CMSSM model) of distributed nodes in a single place. The approach to store current values of monitoredparameters in a database has been chosen, because it allows to completely separate an application logic layerfrom a monitoring layer.
The AMDB is realized in the standard relational model and conforms to the CMSSM model. The structureof the database is derived from the structure of the monitored systems, which means that the database tables suitto essential HSM components, such as: libraries, drives, pools, tapes, disk cache, etc. The parameters, storedin the database, are divided into two groups: static parameters and dynamic parameters. A simple diagramshowing relations between the PLBS database tables is shown in Fig. 4.2. The table columns specification isomitted for simplicity. The dynamic hsm parameters history table stores history of changes of the dynamic

Prediction and Load Balancing System for Distributed Storage 125
Fig. 4.2. The AMDB diagram.
HSM parameters. This table allows the application logic layer to make decisions based not only on the currentvalues of parameters, but also on their statistical values.
Table 4.1 presents summary of the static parameters stored in the AMDB, which are used in the replicationpolicies. Updates of these parameters are performed only on user’s demand, for example after a HSM systemreconfiguration. Some of these parameters constitutes average values (like average disk cache transfer rate),which are provided by external measurements.
Table 4.1Description of static parameters used in the replication policies.
Parameter name Description Implementation
TotalCapacity Estimated total capacityof a storage system in-stalled on a single server.
The value of this parameteris estimated as a sum of diskcache capacities
TotalDCCapacity Total capacity of a singleHSM system disk cache.
The value of this parameteris received from the df UNIXsystems command.
AverageDCReadRate Estimated value of aver-age disk cache read trans-fer rate.
The value of this parame-ter is measured by specialbenchmarks.
AverageDCWriteRate Estimated value of aver-age disk cache write trans-fer rate.
The value of this parame-ter is measured by specialbenchmarks.
NumberOfLibraries Total number of tape li-braries connected to a sin-gle server.
The value of this parame-ter is received from configu-ration files.
Table 4.2 presents summary of the dynamic parameters stored in the AMDB, which are used in the NDSreplication policies. These parameters are updated periodically. The update interval is set manually in thePLBS configuration files.
5. Replication policies. The selection of SN for a given data access request is done by heuristic methodstaking into account relevant monitoring parameters described in the previous section. Depending on the userprofile an appropriate method (called further policy) is used. The AMPD component implements 5 replicationpolicies: round robin—RR, reading in shortest time—R ST, reading from the minimally loaded device—R ML,writing replicas of big files—W BF, writing replicas to the minimally loaded device—W ML.

126 Renata S lota Darin Nikolow et al.
Table 4.2Description of dynamic parameters, which are used in the replication policies.
Parameter name Description Implementation
FreeCapacity Estimated free capacity ofa storage system installedon a single server.
The value of this parameter is es-timated as a sum of free tapes ca-pacity.
FreeDCCapacity Free space in a single HSMsystem disk cache.
The value of this parameter is ob-tained from the df UNIX systemscommand.
CurrentRate Transfer rate value fromthe last measurement.
The value of this parameter ismeasured by periodically.
HSMLoad Number of requests wait-ing or being processed bythe HSM system.
The value of this parameter is re-ceived from the dsmq commandfor the Tivoli Storage Manager(TSM) systems and from the fse-job command for the File SystemExtender (FSE) systems.
The RR policy is implemented mainly for testing purposes—it does not require monitoring data and it justselects cyclically the next available SN for subsequent requests. The other four policies select the location, forwhich the value Loc, defined in equations 5.1–5.4, is maximized. The R ST policy is defined by:
Loc = α1 ·RD
RDMax
+ α2 ·CT
RD+ α3 ·
1
1 + HL, (5.1)
where RD—average disk cache read transfer rate, RDMax—maximal value of average disk cache read transferrate, taken over all locations, CT—current transfer rate, HL—hsm load,
∑
i∈{1..3} αi = 1, αi > 0. The exactmeaning of these values is given in Tables 4.1 and 4.2.
Equation (5.2) expresses the R ML policy:
Loc = β1 ·ND
NDMax
+ β2 ·1
1 + HL+ β3 ·
1
1 + CL, (5.2)
where ND—number of drives, NDMax—maximal value of number of drives, taken over all locations, CL—CPUload,
∑
i∈{1..3} βi = 1, βi > 0.Each writing policy determines first whether enough free space is available in a HSM system. Equation 5.3
defines the W BF policy.
Loc = γi ·FC DC
TC DC
+ γ2 ·FC
TC+ γ3 ·
WR
WRMax
+ γ4 ·1
1 + HL, (5.3)
where FCDC—free disk cache capacity, TC DC—total disk cache capacity, FC —free capacity, TC —total capac-ity, WR—average disk cache write transfer rate, WRMax—maximal value of average disk cache write transferrate, taken over all locations,
∑
i∈{1..4} γi = 1, γi > 0.The policy W ML is defined by equation 5.4,
Loc = δ1 ·FCDC
TC DC
+ δ2 ·WR
WRMax
+ δ3 ·1
1 + HL, (5.4)
where∑
i∈{1..3} δi = 1, δi > 0.α, β, γ and δ are coefficients specifying the impact of the particular monitoring parameters being used in
the above formulas. They need to be tuned for the given environment. The above policies are chosen accordingto the client profile making request and the type of the request. For instance, if the client has defined in theprofile that it needs the data as fast as possible than the R ML policy is chosen.

Prediction and Load Balancing System for Distributed Storage 127
6. Test results. Four types of tests has been conducted:• Monitoring influence tests—showing PLBS impact on the performance of the monitored HSM systems,• Response time tests—showing how fast PLBS responds,• Load balancing tests—showing data access requests distribution among the storage nodes in multi user
and multi requests data access paradigm,• Throughput tests—showing the total throughput of NDS for selected PLBS replication policy.
The monitoring influence tests are targeted at the JIMS+AMT module while the response time tests aretargeted at AMPD module and the both concern the overhead introduced by PLBS to NDS. Load balancingand throughput tests concern the efficiency of data access which can be obtained due to deploying of PLBS toNDS and are provided for a selected policy.
The tests have been conducted using the PLATON [26] infrastructure on which the NDS described aboveis deployed. The testing environment consists of 5 nodes described in detail in Table 6.1 and connected viaPionier network with 1Gb links. Monitoring agents are installed on every SN while JIMS Gateway, AMPD andAMDB are installed on the kmd2 host (see Sec. 4). The results are presented in the following subsections.
Table 6.1Test environment nodes
name location type CPU HSM drives HSM cache[TB]
Cyfronet Krakow SN 2×Xeon 3.3GHz IBM TSM 4x LTO 2PCSS Poznan SN 2×Xeon 2.8GHz IBM TSM 3x LTO 2WCSS Wroclaw SN 2×Xeon 2.8GHz IBM TSM 2x LTO 1TASK Gdansk SN 2×Xeon 2.8GHz IBM TSM 3x LTO 0.2kmd2 Krakow MN 2×Xeon 2.8GHz na na na
SN—Storage Node, MN—Monitoring Node
6.1. Influence tests. In order for the JIMS to retrieve monitoring data from storage nodes a monitoringagent (JIMS+AMT) (see Fig.4.1) needs to be present on these nodes. The goal of these tests is to measure theinfluence to performance of storage system when the JIMS+AMT is running on the same node. These testswere performed on the Cyfronet SN (see Table 6.1). This HSM system is in production and the measurementswere done during periods of low activity. The main disk storage of the server resides on HP EVA8000 diskarray and is attached via 2 FC 2Gb/s links. It is used as disk cache for the HSM system. Repeated patternsof simulated users activities were generated by ftp transfers from other hosts (HSM clients). The JIMS+AMTperformed measurements every 10 minutes. Disk reads and writes generated by the measurements had littleimpact (maximum 5%) on overall execution times of data transfers to and from clients. An example test resultis shown in Fig. 6.1
The most influence of JIMS+AMT activity on users data transfers occurs in short periods when the agentmeasures disk write performance used to calculate AverageDCWriteRate (see Table 4.1). The system utilizationstatistics come from sar program. The user data rates were taken from network traffic statistics as there wasno other network traffic on the server during the tests.
6.2. Response tests. Response tests measure the time of processing prediction requests to AMPD. Ta-ble 6.2 presents test results for the implemented replication policies. Each value is taken as an average over5000 requests. We distinguished two cases: (1) the client is on the same machine that AMPD, (2) the client islocated remotely to the AMPD component.
We can see that the response times are acceptable for all policies and they do not exceed 102 ms for remoteclients and 65 ms for local ones. The network overhead has great influence on the final response times - withoutit the processing time is shorter by about 37 ms.
6.3. Load balancing test. Load balancing test shows how the requests get distributed among the storagenodes. One monitoring node and four storage nodes have taken part in this test (see Table 6.1). The testingprocedure is as follows: First, a set of 100 files has been written to the storage nodes in such way that allfiles are replicated to all four storage nodes. The file size is 1GiB. Next, a script requesting storage nodesperformance prediction and reading data from the appropriate replica is run. The script starts new requests
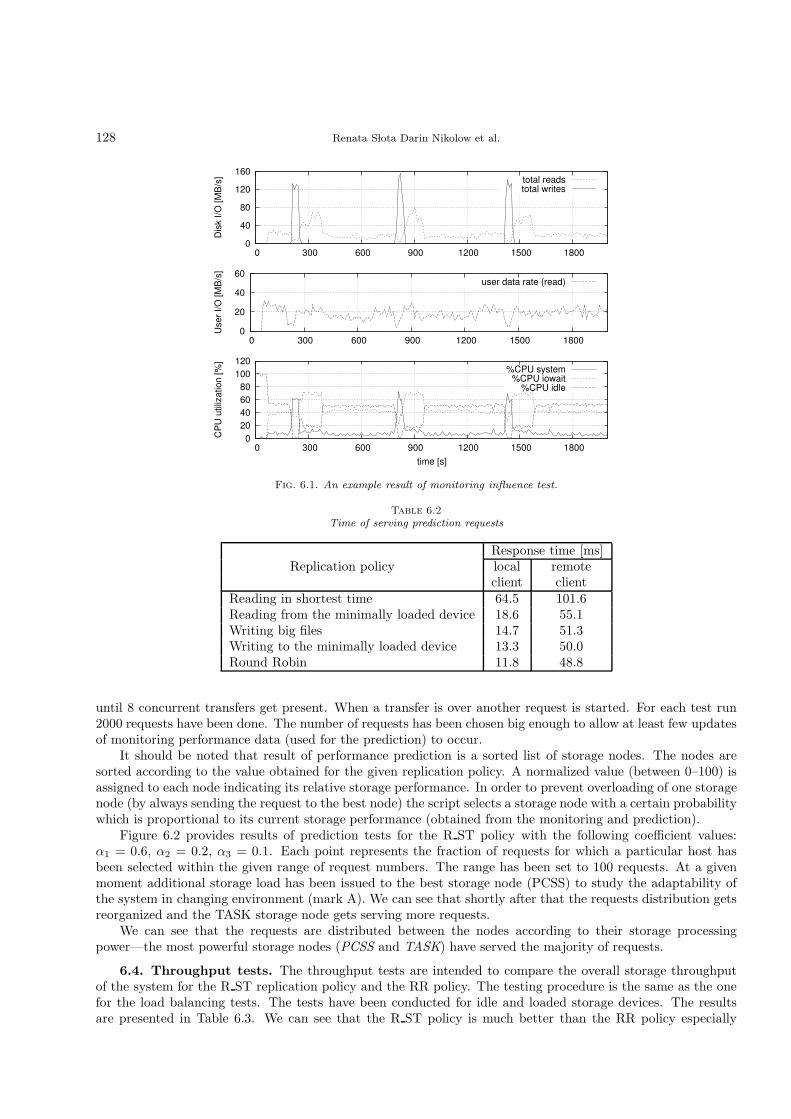
128 Renata S lota Darin Nikolow et al.
0
40
80
120
160
0 300 600 900 1200 1500 1800
Dis
k I
/O [
MB
/s] total reads
total writes
0
20
40
60
0 300 600 900 1200 1500 1800
Use
r I/
O [
MB
/s]
user data rate (read)
0
20
40
60
80
100
120
0 300 600 900 1200 1500 1800
CP
U u
tiliz
atio
n [
%]
time [s]
%CPU system%CPU iowait
%CPU idle
Fig. 6.1. An example result of monitoring influence test.
Table 6.2Time of serving prediction requests
Replication policyResponse time [ms]local remoteclient client
Reading in shortest time 64.5 101.6Reading from the minimally loaded device 18.6 55.1Writing big files 14.7 51.3Writing to the minimally loaded device 13.3 50.0Round Robin 11.8 48.8
until 8 concurrent transfers get present. When a transfer is over another request is started. For each test run2000 requests have been done. The number of requests has been chosen big enough to allow at least few updatesof monitoring performance data (used for the prediction) to occur.
It should be noted that result of performance prediction is a sorted list of storage nodes. The nodes aresorted according to the value obtained for the given replication policy. A normalized value (between 0–100) isassigned to each node indicating its relative storage performance. In order to prevent overloading of one storagenode (by always sending the request to the best node) the script selects a storage node with a certain probabilitywhich is proportional to its current storage performance (obtained from the monitoring and prediction).
Figure 6.2 provides results of prediction tests for the R ST policy with the following coefficient values:α1 = 0.6, α2 = 0.2, α3 = 0.1. Each point represents the fraction of requests for which a particular host hasbeen selected within the given range of request numbers. The range has been set to 100 requests. At a givenmoment additional storage load has been issued to the best storage node (PCSS) to study the adaptability ofthe system in changing environment (mark A). We can see that shortly after that the requests distribution getsreorganized and the TASK storage node gets serving more requests.
We can see that the requests are distributed between the nodes according to their storage processingpower—the most powerful storage nodes (PCSS and TASK) have served the majority of requests.
6.4. Throughput tests. The throughput tests are intended to compare the overall storage throughputof the system for the R ST replication policy and the RR policy. The testing procedure is the same as the onefor the load balancing tests. The tests have been conducted for idle and loaded storage devices. The resultsare presented in Table 6.3. We can see that the R ST policy is much better than the RR policy especially

Prediction and Load Balancing System for Distributed Storage 129
0
10
20
30
40
50
60
70
0 500 A 1000 1500 2000
request number
requests
[%
]
CYFRONETTASKPCSSWCSS
Fig. 6.2. Replication tests for R ST policy
if additional load is put on the system. We can also observe that for the R ST policy the throughput is notinfluenced by the additional storage load. It is because the load gets distributed proportionally to the othernodes which are still having unused storage performance.
Table 6.3Storage throughput
Replication policyStorage throughput [MiB/s]idle loaded
R ST 325 327RR 233 101
7. Summary and future work. In this paper the application of CMSSM in the national distributedstorage system, NDS, has been described. The PLBS subsystem being a part of the NDS system and providingadvanced monitoring and prediction functionalities has been presented. The system makes use of replicationtechniques to increase availability and performance of data access. Monitoring parameters, methods for re-trieving them and replication policies have been described. The influence tests showed that the monitoring didnot cause essential storage system performance degradation. The system response times are within the tensof milliseconds range which is satisfying. Load balancing test shows that requests get distributed between thenodes proportionally according to their storage processing power. Our future plans focus on using CMSSM andits ontological representation in knowledge supported distributed storage system with quality of service.
Acknowledgments. This research is partially supported by the MNiSW grant nr N N516 405535 andPLATON project POIG.02.03.00-00-028/08. AGH-UST grant nr 11.11.120.865 is also acknowledged. Thanksgo to: prof. K. Zielinski for giving access to the JIMS software, M. Brzezniak for support with PLATONinfrastructure, M. Jarzab for support with JIMS, PLATON partners for sharing storage resources.
REFERENCES
[1] National Data Storage project, Polish MNiSW grant nr R02170170170172055 03, https://kmd.pcss.pl[2] Pionier—Polish Optical Internet, http://www.pionier.gov.pl[3] D. Nikolow, R. Slota, J. Kitowski, “Knowledge Supported Data Access in Distributed Environment”, Proc. of CGW’08,
October 13-15 2008, ACC-Cyfronet AGH, 2009, Krakow, pp. 320-325.[4] J.H. Han, D.H. Lee, H. Kim, H. P. In, H.S. Chae, Y.I. Eom “A situation-aware cross-platform architecture for ubiquitous
game”, Computing and Informatics, vol. 28, nr 5, 2009, pp. 619-633[5] Funika, W. - Korcyl, K. - Pieczykolan, J. - Skital, L. - Balos, K. - Slota, R. - Guzy, K. - Dutka, L. - Kitowski, J. - Zieli1717ski,
K. “Adapting a HEP Application for Running on the Grid”, Computing and Informatics, vol. 28, nr 3, 2009, pp. 353-367[6] S lota, R., Nikolow, D., Kuta, M., Kapanowski, M., Ska lkowski, K., Pogoda, M., Kitowski, J., “Replica Management for
National Data Storage”, Proceedings PPAM09, LNCS 6068, Springer, in print.[7] Chai, E., Matsumoto, K., Uehara, M., Mori, H., ”Virtual Large-scale Disk Base on PC GRID”, Scalable Computing: Practice
and Experience, vol. 10, nr 1, SWPS, 2009, pp.87-98.[8] Srinivas, A., Janakiram, D., “Data Management in Distributed Systems: A Scalability Taxonomy”, Scalable Computing:
Practice and Experience, vol. 8, nr 1, SWPS, 2007, pp.115-130.
130 Renata S lota Darin Nikolow et al.
[9] Ranganathan K., Foster I.: “Identifying Dynamic Replication Strategies for a High-Performance Data Grid”. in: Proc. Int.Workshop on Grid Computing, Denver, Nov. 2001.
[10] Lamehamedi H., Szymanski B., Deelman E., “Data Replication Strategies in Grid Environments”, in: IEEE Computer SciencePress, Los Alamitos, CA, 2002, pp. 378-383.
[11] Park S., Kim J., Ko Y., Yoon W., “Dynamic Data Grid Replication Strategy Based on Internet Hierarchy”, LNCS 3033,Springer, 2004, pp.838-846.
[12] Rahman R.M., Barker K., Alhajj R., “A Predictive Technique for Replica Selection in Grid Environment”, in: 7-th IEEE Int.Symp. on Cluster Computing and the Grid, IEEE Computer Society, 2007.
[13] Li, J., “A Replica Selection Approach based on Prediction in Data Grid”, in: Proc. Third Int. Conf. on Semantics, Knowledgeand Grid - SKG2007, 29-31 Oct. 2007, Xi’an, Shan Xi, China, pp. 274-277.
[14] Rahman R.M., Barker K., Alhajj R., “Replica placement Strategies in Data Grid”, in: J Grid Computing (2008) 6:103-123,Springer Science + Business media B.V. 2007.
[15] Rasool, Q., Li, J., Oreku, G.S., Zhang, S., Yang, D., “A load balancing replica placement strategy in Data Grid”, Third IEEEInt. Conf. on Digital Information Management (ICDIM), Nov. 13-16, 2008, London, UK, Proc. IEEE 2008, pp. 751-756.
[16] S lota, R., Skita l, L., Nikolow D., Kitowski J., “Algorithms for Automatic Data Replication in Grid Environment”, in: LNCS,3911, Springer, 2006, pp. 707-714.
[17] D. Nikolow, R. S lota, and J. Kitowski, “Grid Services for HSM Systems Monitoring”, LNCS 4967, Springer, 2008, pp.321-330.[18] Nagios, http://www.nagios.org/[19] Ganglia monitoring system, http://ganglia.sourceforge.net[20] B. Balis, M. Bubak and B. Labno, GEMINI: Generic Monitoring Infrastructure for Grid Resources and Applications, Proc.
of Cracow’06 Grid Workshop, Oct 15-18, 2006, Cracow, Poland, ACC Cyfronet AGH, 2007, pp. 60-73.[21] Distributed Management Task Force, http://www.dmtf.org[22] Common Information Model, http://www.dmtf.org/standards/cim/.[23] Storage Management Initiative Specification (SMI-S), http://www.snia.org/tech_activities/standards/curr_standards/
smi.[24] Grid Laboratory Uniform Environment (GLUE), http://forge.gridforum.org/sf/projects/glue-wg.[25] Zielinski, K., Jarzab, M., Balos, K., Wieczorek, D., “Open Interface for Autonomic Management of Virtualized Resources in
Complex Systems—Construction Methodology”, in: FGCS, vol. 24, Issue 5, May 2008, pp. 390-401.[26] PLATON—Service Platform for e-Science, http://www.platon.pionier.net.pl/.
Edited by: Norbert MeyerReceived: March 30, 2010Accepted: June 18, 2010

Scalable Computing: Practice and ExperienceVolume 11, Number 2, pp. 131–136. http://www.scpe.org
ISSN 1895-1767c© 2010 SCPE
DISTRIBUTED DATA INTEGRATION AND MINING USING ADMIRE TECHNOLOGY∗
ONDREJ HABALA†, MARTIN SELENG†, VIET TRAN†, LADISLAV HLUCHY†,
MARTIN KREMLER‡, AND MARTIN GERA‡
Abstract. In this paper we present our work on the engine for integration of environmental data. We present a suite ofselected environmental scenarios, which are integrated into a novel data mining and integration environment, being developed inthe project ADMIRE . The scenarios have been chosen for their suitability for data mining by environmental experts. They dealwith meteorological and hydrological problems, and apply the chosen solutions to pilot areas within Slovakia. The main challenge isthat the environmental data required by scenarios are maintained and provided by different organizations and are often in differentformats. We present our approach to the specification and execution of data integration tasks, which deals with the distributednature and heterogeneity of required data resources.
Key words: environmental applications, distributed data management, data integration, OGSA DAI
1. Introduction. We present our work in the project ADMIRE, where we use advanced data miningand data integration technologies to run an environmental application, which uses data mining instead ofstandard physical modeling to perform experiments and obtain environmental predictions. The paper startswith description of the project ADMIRE, its vision and goals. Then we describe the history and current statusof the environmental application. The core of the paper then presents our approach to the integration of datafrom distributed resources. We have developed a prototype of data integration engine that allows users tospecify data integration process in form of a workflow of reusable processing elements. This paper has beenoriginally presented in [10].
1.1. The EU ICT Project ADMIRE. The project ADMIRE (Advanced Data Mining and IntegrationResearch for Europe [1]) is a 7th FP EU ICT project aims to deliver a consistent and easy-to-use technologyfor extracting information and knowledge from distributed data sources. The project is motivated by thedifficulty of extracting meaningful information by mining combinations of data from multiple heterogeneousand distributed resources. It will also provide an abstract view of data mining and integration, which willgive users and developers the power to cope with complexity and heterogeneity of services, data and processes.One of main goals of the project is to develop a language that serves as a canonical representation of the dataintegration and mining processes.
1.2. Flood Forecasting Simulation Cascade. The Flood Forecasting Simulation Cascade is a SOA-based environmental application, developed within several past FP5 and FP6 projects [2], [3], [4]. The applica-tion’s development started in 1999 in the 5th FP project ANFAS [5]. In ANFAS, it was mainly one hydraulicmodel (the FESWMS [6]). It then continued with a more complex scenario in 5th FP project CrossGrid,turned SOA in 6th FP projects K-Wf Grid and MEDIgRID, and finally extended the domain to environmentalrisk management in ADMIRE. The application is now comprised of a set of environmental scenarios, with thenecessary data and code to deploy and execute them. The scenarios have been chosen and prepared in coopera-tion with leading hydro-meteorological experts in Slovakia, working mainly for the Slovak HydrometeorologicalInstitute (SHMI), Slovak Water Enterprise (SWE), and the Institute of Hydrology of the Slovak Academy ofSciences (IH SAS). We have gathered also other scenarios from other sources, but in the end decided to use theones presented below, because they promise to be the source of new information for both the environmentaldomain community, as well as for the data mining community in ADMIRE. Together with the scenarios, wehave gathered a substantial amount of historical data. SWE has provided 10 years of historical data containingthe discharge, water temperature, and other parameters of the Vah Cascade of waterworks (15 waterworksinstallations and reservoirs in the west of Slovakia). SHMI has provided 9 years of basic meteorological data(precipitation, temperature, wind) computed by a meteorological model and stored in a set of GRIB (GriddedBinary) files, hydrological data for one of the scenarios, and also partial historical record from their nation-wide
∗This work is supported by projects ADMIRE FP7-215024, APVV DO7RP-0006-08, DMM VMSP-P-0048-09, SMART ITMS:26240120005, SMART II ITMS: 26240120029, VEGA No. 2/0211/09.
†Institute of Informatics of the Slovak Academy of Sciences, Dubravska cesta 9, 84507 Bratislava, Slovakia ({Ondrej.Habala,Martin.Selen, Viet.Tran, Ladislav.Hluchy}@savba.sk)
‡Comenius University, Faculty of Mathematics Physics and Informatics, Mlynska dolina, 84248 Bratislava, Slovakia
131

132 Ondrej Habala et.al.
Table 2.1Depiction of the predictors and variables of the ORAVA scenario
Time Rainfall TempAir Discharge TempReservoir HeightSt TempSt
T-2 RT−2 FT−2 DT−2 ET−2 XT−2 YT−2
T-1 RT−1 FT−1 DT−1 ET−1 XT−1 YT−1
T RT FT DT ET XT YTT+1 RT+1 FT+1 DT+1 ET+1 XT+1 YT+1
T+2 RT+2 FT+2 DT+2 ET+2 XT+2 YT+2
network of meteorological data. They have also provided several years of stored weather radar data, necessaryfor one of the scenarios. The programs used by the application are in the context of ADMIRE described inData Mining and Integration Lanuage (DMIL) [7]. The processes described in DMIL perform data extraction,transformation, integration, cleaning and checking. Additionally, in some scenarios we try to predict futurevalues of some hydro-meteorological variables; if necessary, we use a standard meteorological model to predictweather data for these cases.
2. Environmental Scenarios of ADMIRE. In this chapter we present the suite of environmental sce-narios, which we use to test the data mining and integration capabilities of the ADMIRE system. The scenariosare part of the Flood Forecasting and Simulation Cascade application, which has been in the meantime ex-panded beyond the borders of flood prediction into a broader environmental domain. There are four scenarios,which are in the process of being implemented and deployed in the ADMIRE testbed. These scenarios havebeen selected from more than a dozen of candidates provided by hydro-meteorological, water management, andpedological experts in Slovakia. The main criterion for their selection was their suitability for data miningapplication. The scenarios are named ORAVA, RADAR, SVP, and O3, and they are in different stages ofcompletion, with ORAVA being the most mature one, and O3 only in the beginning stages of its design.
2.1. ORAVA. The scenario named ORAVA has been defined by the Hydrological Service division of theSlovak Hydrometeorological Institute, Bratislava, Slovakia. Its goal is to predict the water discharge wave andtemperature propagation below the Orava reservoir, one of the largest water reservoirs in Slovakia.
The pilot area covered by the scenario (see Figure 2.1) lies in the north of Slovakia, and covers a relativelysmall area, well suitable for the properties of testing ADMIRE technology in a scientifically interesting, but nottoo difficult setting.
The data, which has been selected for data mining, and which we expect to influence the scenario’s targetvariables—the discharge wave propagation, and temperature propagation in the outflow from the reservoir toriver Orava—is depicted in Table 2.1.
For predictors in this scenario, we have selected rainfall and air temperature, the discharge volume of theOrava reservoir and the temperature of water in the Orava reservoir. Our target variables are the water heightand water temperature measured at a hydrological station below the reservoir. As can be seen in Figure 2.1, thestation directly below the reservoir is no.5830, followed by 5848 and 5880. If we run the data mining process intime T, we can expect to have at hand all data from sensors up to this time (first three data lines in Table 1).Future rainfall and temperature can be obtained by running a standard meteorological model. Future dischargeof the reservoir is given in the manipulation schedule of the reservoir. The actual data mining targets are theX and Y variables for times after time T (T being current time).
2.2. RADAR. This experimental scenario tries to predict the movement of moisture in the air from aseries of radar images (see for example). Weather radar measures the reflective properties of air, which aretransformed to potential precipitation before being used for data mining. An example of already processedradar sample (with the reflection already re-computed to millimeters of rainfall accumulated in an hour) can beseen in Figure 2.2.
The scenario once again uses both historical precipitation data (measured by sensors maintained by SHMI)and weather predictions computed by a meteorological model. Additionally to these, SHMI has provided severalyears’ worth of weather radar data (already transformed to potential precipitation).
2.3. SVP. This scenario, which is still in the design phase, is the most complex of all scenarios expectedto be deployed in the context of ADMIRE. It uses the statistical approach to do what the FFSC application
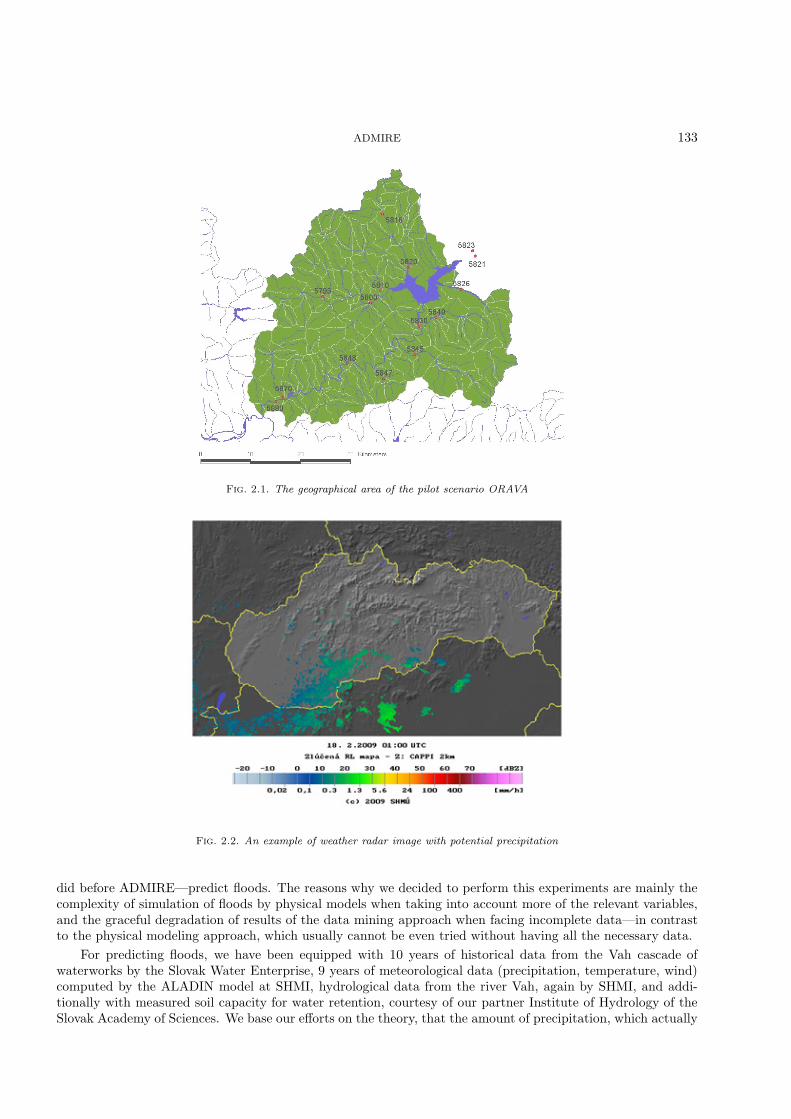
ADMIRE 133
Fig. 2.1. The geographical area of the pilot scenario ORAVA
Fig. 2.2. An example of weather radar image with potential precipitation
did before ADMIRE—predict floods. The reasons why we decided to perform this experiments are mainly thecomplexity of simulation of floods by physical models when taking into account more of the relevant variables,and the graceful degradation of results of the data mining approach when facing incomplete data—in contrastto the physical modeling approach, which usually cannot be even tried without having all the necessary data.
For predicting floods, we have been equipped with 10 years of historical data from the Vah cascade ofwaterworks by the Slovak Water Enterprise, 9 years of meteorological data (precipitation, temperature, wind)computed by the ALADIN model at SHMI, hydrological data from the river Vah, again by SHMI, and addi-tionally with measured soil capacity for water retention, courtesy of our partner Institute of Hydrology of theSlovak Academy of Sciences. We base our efforts on the theory, that the amount of precipitation, which actually

134 Ondrej Habala et.al.
reaches the river basin and contributes to the water level of the river is influenced by actual precipitation andits short-term history, water retention capacity of the soil, and to lesser extent by the evapotranspiration effect.
3. Data integration engine for environmental data. In this section, we discuss the data integrationengine designed for the environmental data integration and mining. It is motivated by the scenarios describedin previous section. We first describe requirements that we took into account and then we present our approachto environmental data integration. In the discussion, we give examples mainly from Orava scenario; the firstscenario implemented using our data integration engine.
In Orava river management scenario, the data from three different sources are used. The data are ownedand maintained by different organizations. To allow the data mining operations proposed for this scenario, thedata from those different sources must be integrated first. Furthermore, the data are kept in different formats.In the case of Orava scenario, two data sets are stored in relational database (waterworks data, water stationsmeasurements) and one is kept in binary files (precipitation data are stored in GRIB files—binary file formatfor meteorological data). From technical point of view, we must be able to work with the heterogeneous datastored in distributed, autonomous resources. In our work, we have considered so far the data in the form oflists of tuples.
In the following, we use the term data resource to denote a service providing access to data, with a singlepoint of interaction. We use the term processing resource to denote a service capable of performing operationson the input lists of tuples. Data resource can have capabilities of a processing resource.
Atomic units used for data access and transformations are called processing elements (PE). Following typesof processing elements are needed:
• Data retrieval PEs—operations able to retrieve the data from different, heterogeneous data sources.Data retrieval PEs are executed at data resources. This class of PEs is also responsible for transformingraw data sets to the form of tuples.
• Data transfer PE—able to transfer list of tuples between distinct processing resources.• Data transformation PE—operations that transform input list of tuples. These PEs can perform data
transformation on per tuple basis, or can be used to aggregate tuples in the input lists.• Data integration PEs—given input lists of tuples, data integration operations combine the tuples from
input lists into a coherent form.
An operation has one or more inputs and one or more outputs. Inputs can be either literals or list of tuplesand a outputs are list of tuples. Operations can be chained to form a data integration workflow—an orientedgraph, where nodes are operations and edges are connection of inputs and outputs of the operations.
The term Application Processing Element (APE) will denote a data integration workflow that can beexecuted at a single resource. APE is a composition of atomic operations that provides functionality requiredby a data integration task. For example, in Orava scenario we use the precipitation data from GRIB files. TheGRIB reader processing element extracts the data from GRIB files; it has two inputs—the first is a list of GRIBfiles and the second is a list of indexes in GRIB value arrays. The GRIB reader activity outputs all the valuesat input indexes from all the input files. We use an operation that queries the GRIB metadata database todeterminate GRIB files of interest and another operation that transform given geo-coordinates in WGS84 tothe indexes consumed by GRIB reader activity. This small workflow of three operations forms a single APEthat provides precipitation data for given time period and geo-coordinates. The idea behind APE is to providedata integration blocks that can be executed at a single processing or data resource and can be reused for inmultiple data integration tasks. Similarly to atomic PE, the inputs of APE can be literals or list of tuples andoutputs are list of tuples.
The goal of our proposed data integration engine is to provide means of executing data integration tasksthat are composed of multiple APEs and can integrate the data from distributed, autonomous and possiblyheterogeneous data resources. Our data integration engine is designed to run the data integration tasks, giventhe input parameters and the APE workflow specification.
APE workflow specification is composed of four components: definition of APEs instances, mapping betweeninputs and outputs of connected APEs, mapping between the definition of integration task parameters and theparameter inputs of APEs in workflow and the definition of the result output.
In alignment with ADMIRE project vision, the APEs are specified in Data Mining and Integration Language(DMIL) [7] that is being developed within the project. The goal of DMIL is to be a canonical representation ofdata integration process, described in an implementation independent manner. The APE instance is specified by

ADMIRE 135
Fig. 3.1. Orava river management scenario - APEs workflow
the DMIL description of the process that should be executed, the specification of the data/processing resourceit should be executed at and APE instance identifier that is unique within the APE workflow specification.Figure 3.1 depicts the APEs workflow of the Orava river management scenario.
In our view, the main advantage of proposed data integration engine is that user can specify sub-workflowsthat are executed on a separate data resources and the engine automatically connects the results of APEsexecuted on distributed resources. This helps to deal with the complexity of the distributed data integration.
3.1. Implementation.The prototype of proposed data integration engine for environmental data (DIEED)is implemented in JAVA programming language. It uses OGSA-DAI ([8], [9]) framework as the platform forexposing data resources in the distributed testbed and for executing the partial workflows of processing elements;it also provide us with the data transfer capabilities and streaming of the list of tuples between remote nodes.The data integration engine takes as inputs the integration task parameters and APE workflow specification.From the APE workflow specification, the engine constructs an oriented graph of APEs (defined by the mappingbetween inputs and outputs of APEs). For each node of the graph (containing an APE specified in DMIL) theDIEED performs following actions:
1. Compiles DMIL code—the DMIL specification of the node process is compiled to JAVA class thatconstructs an OGSA-DAI workflow.
2. JAVA class containing OGSA-DAI workflow is compiled by JAVA compiler, it is instantiated andOGSA-DAI workflow object is created
3. workflow object is submitted to OGSA-DAI service for execution4. workflow execution on remote server is monitored
The whole APEs workflow is monitored during execution (providing information on the state of each ofAPEs); after execution is finished, the results can be retrieved in form of WebRowSet object.
DIE was integrated with the toolkit being developed in the project; this allows the user to submit APEsworkflows, visualize the specified workflow and monitor its execution via graphical user interface based onEclipse platform. Figure 3.2 depicts the graphical user interface for DIEED.
4. Conclusion. In this paper, we have presented preliminary results of our ongoing work on the dataintegration engine for environmental data that is being developed in the scope of ADMIRE project. We havefirst described four scenarios dealing with the integration and mining of environmental data. The main challengeis that the environmental data required by scenarios are maintained and provided by different organizationsand are often in different formats. Our work concentrated on providing a platform that would allow integration

136 Ondrej Habala et.al.
Fig. 3.2. GUI showing results of DIEED—APEs workflow and its results
of data from distributed, heterogeneous resources. Our results allow users to construct reusable applicationprocessing elements specified in DMIL [7] (language for data mining and integration, which is being designedwithin the project) and the engine executes them transparently on distributed data resources.
REFERENCES
[1] ADMIRE. EU FP7 ICT project: Advanced Data Mining and Integration Research for Europe (ADMIRE), 2008-2011. Grantagreement no. 215024.
[2] CROSSGRID. EU FP5 IST RTD project: Development of Grid Environment for Interactive Applications (2002-05) IST-2001-32243.
[3] K-Wf Grid. EU FP6 RTD IST project: Knowledge-based Workflow System for Grid Applications (2004-2007) FP6-511385, callIST-2002-2.3.2.8.
[4] MEDIGRID. EU FP6 RTD Sust.Dev. project: Mediterranean Grid of Multi-Risk Data and Models (2004-2006) GOCE-CT-2003-004044, call FP6-2003-Global-2.
[5] ANFAS. EU FP5 IST RTD project: datA fusioN for Flood Analysis and decision Support (2000-03) IST-1999-11676.[6] Finite Element Surface Water Modeling System (FESWMS).[7] Atkinson M. et al.: ADMIRE White Paper: Motivation, Strategy, Overview and Impact, v0.9. 2009.[8] Antonioletti M., Atkinson M. P., Baxter R., Borley A., Chue Hong N. P., Collins B., Hardman N., Hume A., Knox A.,
Jackson M., Krause A., Laws S., Magowan J., Paton N. W., Pearson D., Sugden T., Watson P., Westhead M.: The Designand Implementation of Grid Database Services in OGSA-DAI. Concurrency and Computation: Practice and Experience,Volume 17, Issue 2-4, Pages 357-376, Feb. 2005.
[9] Karasavvas K., Antonioletti M., Atkinson M. P., Chue Hong N. P., Sugden T., Hume A. C., Jackson M., Krause A.,Palansuriya C.: Introduction to OGSA-DAI Services. Lecture Notes in Computer Science, Volume 3458, Pages 1-12,May 2005, ISBN 978-3-540-25810-0.
[10] Ciglan, M., Habala, O., Tran, V., Hluchy, L., Kremler, M., Gera, M.: Application of ADMIRE Data Mining and IntegrationTechnologies in Environmental Scenarios. To appear in Proc. of the 4th Grid Applications and Middleware Workshop(GAMW2009), Wroclaw, Poland, September 13-16, 2009, LNCS 6067-6068, Springer.
Edited by: Ewa DeelmanReceived: March 30, 2010Accepted: May 25, 2010

Scalable Computing: Practice and ExperienceVolume 11, Number 2, pp. 137–147. http://www.scpe.org
ISSN 1895-1767c© 2010 SCPE
ULTRA-FAST CARRIER TRANSPORT SIMULATION ON THE GRID.QUASI-RANDOM APPROACH.∗
EMANOUIL ATANASSOV†, TODOR GUROV†, AND ANETA KARAIVANOVA†
Abstract. The problem for simulation ultra-fast carrier transport in nano-electronics devices is a large scale computationalproblem and requires HPC and/or Grid computing resources. The most widely used techniques for modeling this carrier transportare Monte Carlo methods.
In this work we consider a set of stochastic algorithms for solving quantum kinetic equations describing quantum effectsduring the femtosecond relaxation process due to electron-phonon interaction in one-band semiconductors or quantum wires. Thealgorithms are integrated in a Grid-enabled package named Stochas-tic ALgorithms for Ultra-fast Transport in sEmiconductors(SALUTE).
There are two main reasons for running this package on the computational Grid: (i) quantum problems are very computationallyintensive; (ii) the inherently parallel nature of Monte Carlo applications makes efficient use of Grid resources. Grid (distributed)Monte Carlo applications require that the underlying random number streams in each subtask are independent in a statistical sense.The efficient application of quasi-Monte Carlo algorithms entails additional difficulties due to the possibility of job failures and theinhomogeneous nature of the Grid resource. In this paper we study the quasi-random approach in SALUTE and the performanceof the corresponding algorithms on the grid, using the scrambled Halton, Sobol and Niederreiter sequences. A large number oftests have been performed on the EGEE and SEEGRID grid infrastructures using specially developed grid implementation scheme.Novel results for energy and density distribution, obtained in the inhomogeneous case with applied electric field are presented.
Key words: ultra-fast carrier transport, Monte Carlo methods, quasi-Monte Carlo, scrambled Halton, Sobol and Niederreitersequences, grid computing
1. Introduction. The Monte Carlo Methods for quantum transport in semiconductors and semiconductordevices have been actively developed during the last two decades [3, 10, 16, 20, 24]. These Monte Carlocalculations need large amount of computational power and the reason is as follows: If temporal or spatialscales become short, the evolution of the semiconductor carriers cannot be described in terms of the Boltzmanntransport and therefore a quantum description is needed. Let us note that in contrast to the semiclassicaltransport when the kernel is positive, the kernel in quantum transport can have negative values. The arisingproblem, sometimes referred to as the “negative sign problem,” leads to additional computational efforts forobtaining the desired solution. That is why the quantum problems are very computationally intensive andrequire parallel and Grid implementations.
Quasi-Monte Carlo (QMC) simulation, using deterministic sequences that are more uniform than randomones, holds out the promise of much greater accuracy, close to O(N−1) [23] in optimal cases. While thesesequences (called low discrepancy sequences or quasirandom sequences) do improve the convergence of applica-tions like numerical integration, it is difficult to apply them for Markov chain based problems due to correlations.These difficulties can be overcame by reordering, hybrid algorithms or randomization techniques. Successfulexamples can be found in [13, 14, 15, 17, 19] and many other papers.
In this paper we present quasirandom approach for ultrafast carrier transport simulation. Due to cor-relation, the direct quasirandom variants of Monte Carlo methods do not give adequate results. Insteadof them, we propose hybrid algorithms with pseudorandom numbers and scrambled quasirandom sequences.We use scrambled modified Halton [2], scrambled Sobol [1] and scrambled Niederreiter (the scrambling al-gorithm is similar to described in [1]). In this paper we present also the developed grid implementationscheme which uses not only the computational capacity of the grid but also the available grid services in avery efficient way. With this scheme we were able to obtain new estimates about important physical quanti-ties.
This paper is an extended version of [5], presented at the the international conference Parallel Processingand Applied Mathematics (PPAM09), held in September 2009 in Poland. Here we have added more detailsabout the quasirandom approach for problems of considered kind (including our algorithm for generating Soboland Niederreiter sequences). We also have updated the Grid implementation description; the numerical testsare obtained using the most recent Grid middleware and services.
∗Supported by the Ministry of Education and Science of Bulgaria under Grant No. DO02-146/2008.†IPP—Bulgarian Academy of Sciences, Acad. G. Bonchev St., Bl.25A, 1113 Sofia, Bulgaria, E-mails:{emanouil, gurov,
anet}@parallel.bas.bg
137
138 Emanouil Atanassov, Todor Gurov and Aneta Karaivanova
The paper is organized as follows: Section 2 describes very briefly the problem and the Monte Carloalgorithms, section 3 presents the quasirandom sequences and hybrid algorithms, section 4 describes the gridimplementation scheme, section 4 contains the new estimates and performance analysis.
2. Background (Brief description of SALUTE). The first version of SALUTE was designed at IPP-BAS in 2005 as a set of Monte Carlo algorithms for simulation of ultra-fast carrier transport in semiconductorstogether with simple Grid implementation, [3, 4]. Later on, we extended the the area of application (quantumwires), the algorithms (more complicated equations to be solved) and the implementation scheme. In thispaper we present the quasirandom approach in SALUTE and discuss the new results. The physical modeldescribes a femtosecond relaxation process of optically excited electrons which interact with phonons in one-band semiconductor, [21]. The interaction with phonons is switched on after a laser pulse creates an initialelectron distribution. Experimentally, such processes can be investigated by using ultra-fast spectroscopy, wherethe relaxation of electrons is explored during the first hundred femtoseconds after the optical excitation. Inour model we consider a low-density regime, where the interaction with phonons dominates the carrier-carrierinteraction. Two cases are studied using SALUTE: electron evolution in presence and in absence of electricfield.
As a mathematical model we consider Wigner equation for the nanometer and femtosecond transportregime. In the homogeneous case we solve a version of the Wigner equation called Levinson (with finitelifetime evolution), [18], or Barker-Ferry equation (with infinite lifetime evolution), [6]. Another formulationof the Wigner equation considers inhomogeneous case when the electron evolution depends on the energy andspace coordinates. The problem is relevant e.g. for description of the ultra-fast dynamics of confined carriers.Particularly we consider a quantum wire, where the carriers are confined in the plane normal to the wire byinfinite potentials. The initial condition is assumed both in energy and space coordinates.
The numerical results that we present in this paper are for the inhomogeneous case with applied electric field(see figures in the Numerical tests section). We recall the integral form of the quantum-kinetic equation, [22]:
fw(z, kz, t) =fw(z −~kzm
t+~F
2mt2, kz, 0) +
∫ t
0
∂t′′∫ t
t′′∂t′
∫
dq′⊥
∫
dk′z
×
[
S(k′z, kz , t′, t′′,q′
⊥)fw
(
z −~kzm
(t− t′′) +~F
2m(t2 − t′′2) +
~q′z2m
(t′ − t′′), k′z , t′′
)
−S(kz, k′z , t
′, t′′q′⊥)fw
(
z −~kzm
(t− t′′) +~F
2m(t2 − t′′2) −
~q′z2m
(t′ − t′′), kz , t′′
)]
S(k′z, kz , t′, t′′,q′
⊥) =2V
(2π)3|G(q′
⊥)F(q′⊥, kz − k′z)|2
×
[
(n(q′) + 1) cos
(
ǫ(kz) − ǫ(k′z) + ~ωq′
~(t′ − t′′) +
~
2mF.q′z(t′2 − t′′2)
)
+n(q′) cos
(
ǫ(kz) − ǫ(k′z) − ~ωq′
~(t′ − t′′) +
~
2mF.q′z(t′2 − t′′2)
)]
(2.1)
Here, fw(z, kz, t) is the Wigner function described in the 2D phase space of the carrier wave vector kz and theposition z, and t is the evolution time.
F = eE/~, where E is a homogeneous electric field along the direction of the wire z, e being the electroncharge and ~—the Plank’s constant.
nq′ = 1/(exp(~ωq′/KT )− 1) is the Bose function, where K is the Boltzmann constant and T is the temper-ature of the crystal, corresponds to an equilibrium distributed phonon bath.
~ωq′ is the phonon energy which generally depends on q′ = q′⊥+q′z = q′
⊥+(kz−k′z), and ε(kz) = (~2k2z)/2m
is the electron energy.
F is obtained from the Frohlich electron-phonon coupling by recalling the factor i~ in the interactionHamiltonian, Part I:
F(q′⊥, kz − k′z) = −
[
2πe2ωq′
~V
(
1
ε∞−
1
ε s
)
1
(q′)2
]1
2
,
Ultra-fast Carrier Transport Simulation on the Grid 139
where (ε∞) and (εs) are the optical and static dielectric constants. The shape of the wire affects the electron-phonon coupling through the factor
G(q′⊥) =
∫
dr⊥eiq′
⊥r⊥ |Ψ(r⊥)|2 ,
where Ψ is the ground state of the electron system in the plane normal to the wire.In terms of numerical solution the problem consists of determining different quantities of interest by
evaluating linear functional of the following type:
J(fw) = h(x)fw(x)dx = (h, fw), (2.2)
The given function h(x) depends on the choice of the physical quantities. In our quantum model, we areinterested from the following physical quantities:
1. Wigner function for fixed evolution times;2. The wave vector;3. Electron density distributions;4. The energy density.
In the inhomogeneous case the wave vector (and respectively the energy) and the density distributions aregiven by the integrals
f(kz, t) =
∫
dz
2πfw(z, kz, t); n(z, t) =
∫
dkz2π
fw(z, kz, t). (2.3)
Our aim is to estimate these quantities (2.3), as well as the Wigner function (2.1) by quasi-MC approach.At present, SALUTE numerical experiments use GaAs material parameters. In one of the next version
of the SALUTE application, we will provide results for other types of semiconductors like Si or for compositematerials.
Detailed description of MCMs for this problem can be found in [3, 12, 16]. Let us mention that MCMs havethe advantage that MCMs estimate directly the necessary quantities, i. e. without calculating the solution ofthe Wigner function in the whole domain. The serious problem with MCMs is the large variance of the randomvariable which is proportional to the exp(T 2) where T is the evolution time. As the physicists are interestedin the quantum effects for large evolution time, the problem becomes computationally very intensive—we haveto perform billions of trajectories in order to obtain reasonable results. This was our motivation for applyingquasirandom approach and using computational grid.
3. Quasirandom approach in SALUTE. Quasi-Monte Carlo methods and algorithms proved to beefficient in many areas ranging from physics to economy. We have applied quasirandom approach for studyingquantum effects during ultra-fast carrier transport in semiconductors and quantum wires in order to reduce theerror and to speedup the computations. Next, we have used scrambled sequences for two main reasons: (i) theproblem is very complicated (the use of scrambling corrects the correlation problem found when we have useda purely quasi-Monte Carlo algorithm), and, (ii) the Grid implementation which needs parallel streams.
The computational Grid (or, shortly, the Grid) proved to be very efficient computing model. The Gridgoes well beyond simple communication between computers and aims ultimately to turn the global network ofcomputers into one vast computational resource. Using the Grid is especially useful for Monte Carlo applicationsas there the amount of similar calculations that has to be done is huge. Technically Grid coordinates resourceswhich are not a subject to central administrative control and utilizes general-purpose protocols. Anotherdistinction is that a Grid could in principle have access to parallel computers, clusters, farms, local Grids, evenInternet computing solutions, and would choose the appropriate tool for a given calculation. In this sense, theGrid is the most generalized form of distributed computing. One major advantage of Monte Carlo methods isthat they are usually very easy to be parallelized. This is, in principal, also true of quasi-Monte Carlo methods.However, the successful parallel implementation of a quasi-Monte Carlo application depends crucially on variousquality aspects of the parallel quasirandom sequences used [8, 9]. Much of the recent work on parallelizing quasi-Monte Carlo methods has been aimed at splitting a quasirandom sequence into many subsequences which arethen used independently on the various parallel processes, for example in [1, 2, 7]. This method works well forthe parallelization of pseudorandom numbers, but due to the nature of quality in quasirandom numbers, thistechnique has some difficulties. Our algorithms are based on scrambling (suitable for heterogeneous computingenvironments).

140 Emanouil Atanassov, Todor Gurov and Aneta Karaivanova
3.1. Quasirandom sequences. We use scrambled Halton, Sobol and Niederreiter sequences.
Halton sequence. We use the modified Halton sequences introduced in [2] for which the discrepancy hasa very small leading term. His construction is based on the existence of some numbers, called “admissible”.Here we recall the definitions of admissible numbers and modified Halton sequence.Definition 1. Let p1, . . . , ps be distinct primes. The integers k1, . . . , ks are called admissible for them, ifpi ∤ ki and for each set of integers m1, . . . ,ms, pi ∤ mi, there exists a set of integers α1, . . . , αs, satisfying thecongruences
kiαi
∏
1≤j≤n, j 6=i
pjαj ≡ mi(mod pi), i = 1, . . . , s.
Definition 2. Let p1, . . . , ps be distinct primes, and the integers k1, . . . ks are admissible for them. The mod-ified Halton sequence σ(p1, . . . , ps; k1, . . . , ks) = {(xn
(1), . . . , xn(s))}n = {0,∞} is constructed by setting each
sequence {xn(i)}n=0
∞to be a generalized Van der Corput - Halton sequence in base pi, with the sequence of
permutations τj(i)(t) to be the reminder of tki
j modulo pi, τj(i)(t) ∈ {0, . . . , pi − 1}.
Determining “admissible” generation of modified Halton sequence can be found in [2]. In the experimentsdescribed in this paper we use the following scrambling: We change the formulas for the permutations as
τj(i)(t) ≡ tki
(j+1) + bj(i)(mod pi),
where the integers bj(i) are chosen independently in the interval [0, pi − 1]. The scrambled sequence has the
same estimate for its discrepancy as if for any integers m1, . . . ,ms the congruences
kiαi
∏
1≤j≤n, j 6=i
pjαj ≡ mi(mod pi), i = 1, . . . , s (3.1)
have a solution, then the same is true for the congruences
kiαi+1
∏
1≤j≤n, j 6=i
pjαj + bj ≡ mi(mod pi), i = 1, . . . , s. (3.2)
The chosen algorithm is very fast, requires a small amount of memory and generates the terms of sequenceswith maximal error less that 10−14 when 106 terms are generated. It shows superior results compared to otherHalton generators.
Niederreiter and Sobol sequences. We use the Definition 3 (below), which covers most digital (t,m, s)-nets in base 2. The Sobol sequence is a (t, s)-sequence in base 2 and is a particular case of this definition.
Definition 3. Let A1, . . . , As be infinite matrices Ak = {a(k)ij }, i, j = 0, 1, . . . , with a
(k)ij ∈ {0, 1}, such that
a(k)ii = 1 for all i and k, a
(k)ij = 0 if i < j. The τ (1), . . . , τ (s) are sequences of permutations of the set {0, 1}.
Each non-negative integer n may be represented in the binary number system as
n =r
∑
j−0
bi2i.
Then the nth term of the low-discrepancy sequence σ is defined by
x(k)n =
r∑
j=0
2−j−1τ(k)j (⊕j
i=0bia(k)ij ),
where by ⊕ we denote the operation of bit-wise addition modulo 2.Next lemma explains how we generate consecutive terms of the sequence.
Lemma. Let σ be a sequence or net satisfying Definition 3, and let the non-negative integers n, p,m be given.Suppose that we desire the first p binary digits of elements in σ with indices of the form 2mj + n < 2p; thisimplicitly defines a set of compatible j′s. Thus the only numbers we need to compute are
y(k)j = ⌊2px
(k)2mj+n⌋.

Ultra-fast Carrier Transport Simulation on the Grid 141
The integers {v(k)r }∞r=0, which we call ”twisted direction numbers”, are defined by
v(k)r =
p−1∑
t=0
2p−1−t ⊕p−1j=m a
(k)tj .
Suppose that the largest power-of-two that divides 2m(j + 1) + n is l, i. e. 2m(j + 1) + n = 2i(2K + 1). Thenthe following equality holds
y(k)j+1 = y
(k)j ⊕ v
(k)i .
To obtain the results presented in this paper we have used the scrambled Sobol and Niederreiter sequences.The algorithm for generating scrambled Sobol sequence is described in [1]. We have modified this algorithmfor generating scrambled Niederreiter sequence. We have to note that not all optimizations for Sobol sequencecan be applied for Niederreiter (due to the structure of metrices A′s. This algorithm allows consecutive termsof the scrambled sequence to be obtained with essentially only two operations per coordinate: one floatingpoint addition and one bit-wise xor operation (this omits operations that are needed only once per tuple).This scrambling is achieved at no additional computational cost over that of unscrambled generation as itis accomplished totally in the initialization. In addition, the terms of the sequence are obtained in theirnormal order, without the usual permutation introduced by Gray code ordering used to minimize the cost ofcomputing the next Sobol element. This algorithm is relatively simple and very suitable for parallel and gridimplementation.
The mathematical explanations can be found in [1], here we present the algorithm in pseudo code.• Input initial data:
– if the precision is single, set the number of bits b to 32, and the maximal power of two p to 23,otherwise set b to 64 and p to 52;
– dimension s;– direction vectors {aij}, i = 0, p, j = 1, . . . , s representing the matrices A1, . . . , Ad (always aij <
2i+1);– scrambling terms d1, . . . , ds - arbitrary integers less than 2p, if all of them are equal to zero, then
no scrambling is used;– index of the first term to be generated - n;– scaling factor m, so the program should generate elements with indices 2mj + n, j = 0, 1, . . ..
• Allocate memory for s⋆l b-bit integers (or floating point numbers in the respective precision) y1, . . . , ys..• Preprocessing: calculate the twisted direction numbers vij , i = 0, . . . , p− 1, j = 0, . . . , s:
– for all j from 1 to s do– for i = 0 to p− 1 do– if i = 0, then vij = aij2
p−m, else vij = vi−1jxor(ai+m,j ⋆ (2p−i−m));• Calculate the coordinates of the n-th term of the Sobol sequence (with the scrambling applied) using
any known algorithm (this operation is performed only once). Add +1 to all of them and store theresults as floating point numbers in the respective precision in the array y.
• Set the counter N to the integer part of n2m .
• Generate the next point of the sequence:– When a new point is required, the user supplies a buffer x with enough space to hold the result.– The array y is considered as holding floating point numbers in the respective precision, and the
result of subtracting 1. from all of them is placed in the array x.– Add 1 to the counter N ;– Determine the first nonzero binary digit k of N so that N = (2M + 1)2k (on the average this is
achieved in 2 iterations);– Consider the array y as an array of b-bit integers and updated it by using the kth row of twisted
direction numbers:for i = 1 to d doyi = yixorvki.
– Return the control to the user. When a new point is needed, go to beginning of this paragraph(Generate the next point of the sequence).

142 Emanouil Atanassov, Todor Gurov and Aneta Karaivanova
Parallelization. There are three basic ways to parallelize quasirandom number sequences:• Leap-frog - The sequence is partitioned in turn among the processors like a deck of cards dealt to card
players.• Sequence splitting or blocking- The sequence is partitioned by splitting it into non-overlapping contigu-
ous subsections.• Independent sequences - Each processor has its own independent sequence.
The first and second schemes produce numbers from a single quasirandom sequence. The third scheme needs afamily of quasirandom sequences. Scrambling techniques can generate such a stochastic family of quasirandomsequences from one original quasirandom sequence. Numerical calculations presented in this paper are doneusing blocking. In this way we can exactly repeat the results for comparison.
3.2. Hybrid Algorithms in SALUTE. We have constructed hybrid Monte Carlo algorithms that usepseudo-random numbers for some dimensions and scrambled quasi-random numbers for the other dimensions.
A schematic description of the algorithm is given below, assuming that we only need to compute the Wignerfunction at one point (k1, z1). In the algorithm, ǫ1 is the truncation parameter.
• Input number of trajectories to be used N , relaxation time T , other parameters, describing the initialcondition.
• For i from 1 to N sample a trajectory as follows:– set time t := T , weight W := 1, k = k1, z := z1– prepare the next point of the quasirandom sequence to be used (Niederreiter, Halton or Sobol)
(x1, x2, . . . , xn), with n sufficiently big (n = 100 in our case), and set j = 1– repeat until t > ǫ1:
∗ k is simulated using pseudorandom numbers∗ t′, t are simulated using consecutive dimensions of the quasirandom sequence, i. e. the pointsx2j−1, x2j , by the formula
t2 := tx2j−1, t1 := t2 + x2j(t− t2), t′ := t1, t = t2
∗ multiply the weight: W := W ⋆ t(t− t2)∗ compute the two kernels K1 and K2
∗ select which one to use with probability proportional to their absolute values.∗ multiply the weight: W := W ⋆ (|K1| + |K2|)sgn(Km) if Km is the kernel selected∗ sample q using a spline approximation of the inverse function∗ multiply the weight by the appropriate integral: W := W ⋆ I∗ modify k, depending on the kernel and the electric field applied: knew = k− c3 ⋆ (t− t2) if K1
was chosen or knew = k − c3 ⋆ (t− t2) if K2 was chosen∗ modify z : znew = z − c1 ⋆ k ⋆ (t− t2) − c2 ⋆ (t− t2) ⋆ (t+ t2)∗ compute the contribution of this iteration to the Wigner function: add W ⋆ ψ(z, k) to the
estimator, where ψ(z, k) is the value of the initial condition∗ increment j := j + 1
The constructive dimensionality of the algorithm is 4n, where n is the maximal length of the trajectory.We use 2n pseudorandom numbers for each trajectory, and the dimensionality of the Halton sequence is 2n.
4. Grid implementation. A computational grid is a computing environment which enables the unifica-tion of geographically widely distributed computing resources into one big (super)computer [11]. The individualcomputing resources commonly consist mostly of computer clusters or several individual computers, which areinterconnected by a high-speed wide area network. At present, the grid is intended for supporting e-Science,however the technology itself is very adaptable for a very wide area of future computer use. The grid accumu-lates and coordinates as much computing power as possible and make it available for use by applications, whichhave a particularly high demand for computing resources.
In order to compute the physical quantities (2.1),(2.3) SALUTE application requires considerable computa-tional power and time to obtain sufficiently accurate results. Hundreds (thousands) of jobs with different inputdata have been implemented on grid clusters included in the SEEGRID infrastructure.
Ultra-fast Carrier Transport Simulation on the Grid 143
The SEEGRID infrastructure integrates computational and storage resources in South Eastern Europe.Currently there are more than 40 clusters with a total of more than 3000 CPUs and more than 400 TB ofstorage and this infrastructure is a part of European Grid infrastructure named EGEE [25]. The peculiarities ofthe region are that the network connectivity of many of these clusters is insufficient, which implies the necessityto avoid network-hungry applications and emphasize computationally intensive applications, that make efficientuse of the available resources. It also imposes the need of fault-tolerant implementations.
The SEEGRID infrastructure was built using the gLite middleware [26]. Each of the SEEGRID clustershas the mandatory Grid services:
• Computing Element• Worker Nodes• Storage Element• MON box
The Worker Nodes provide the computational resource of the site, and the Storage Element provides thestorage resources. The set of services, that are not tied to the specific site are called core services. They include
• VOMS (Virtual organisation management system)• MyProxy• R-GMA registry/schema server (distributed data-base)• BDII (provides comprehensive information about the resources)• WMS (distributes and manages the jobs among the different grid sites)• FTS (file transfer service)• AMGA (metadata catalog)
4.1. Grid implementation scheme. The need of performing a large number of tests on the EGEE andSEEGRID infrastructures allows us to develop a grid implementation scheme in order to facilitate the executionand monitoring of the submited tasks. In our grid implementation scheme we incorporated the use of the FTSand AMGA services, available in the gLite, and we were able to include the estimation of several new physicalquantities, which increased the total amount of data to be generated, stored, processed and visualized.
On the User Interface (UI) computer the scientist launches the Graphical User Interface (GUI) of theapplication (see Fig. 1). The job submission, monitoring and analysis of the results is controlled from there.
The jobs are monitored from a monitoring thread, started from the GUI, and information about theirprogress is displayed to the user. Another thread run from the GUI is responsible for collecting the outputresults from the various Storage Elements to the local one. For each output file a request for transfer is sent tothe File Transfer Service (FTS) computer.
The computational tasks are submitted using a messaging broker, that follows the AMQP protocol. Thegrid jobs contact the AMQP broker and obtain the tasks from a message queue.
The AMGA (ARDA Metadata Catalog) is used to hold information about the results obtained so far bythe user—for example input parameters, number of jobs executed, execution date etc.
The WMS sends the job to the Grid sites. When the job starts on the WN (Worker Node), it downloadsthe executable from the Storage element. The executable obtains the input parameters from the AMQP broker,performs the computations and stores the results in the local Storage Element. It registers the output. One ofthe Worker Nodes is responsible for gradual accumulation of the output of the jobs. At regular intervals theaccumulated results are registered and made available to the user.
The FTS is used in order to limit the number of files that are transferred simultaneously, because of thelimited bandwidth available. In this way we also avoid some scalability limitations of the middleware and wetry not to overload the Storage Elements. This approach is efficient, because in most cases it will not leadto increase of the total time necessary for completing all transfers, since they compete for the same networkresource. Additional benefit of the FTS is that it provides reliable transfer of the files, by retrying the transfersif necessary.
5. Numerical Tests and Grid performance analysis. The problems arising when we solve the Wignerequation using Monte Carlo approach are due to the large statistical error. This error is a product of two factors:standard deviation and sample size on the power one half. The standard deviation increases exponentially withtime, so in order to achieve reasonable accuracy, we must increase considerably the sample size. This impliesthe need of computational resources. Using the grid and above described grid implementation scheme, we wereable to obtain new results about important physical quantities: Wigner function, wave vector, electron density

144 Emanouil Atanassov, Todor Gurov and Aneta Karaivanova
Fig. 4.1. Graphical User Interface (GUI) for submission and monitoring of SALUTE jobs, and accumulation and visualizationof their results.
and energy density. The results presented here are for inhomogeneous case with applied electric field for 140femtoseconds evolution time. Normally, the execution times of the jobs at the different sites are similar, andthe delay in starting is caused by lack of free Worker Nodes. Thus our new scheme allows the user to achievethe maximum possible throughput.
We have performed experiments with pseudorandom, and scrambled Niederreiter, Sobol and Halton se-quences. In order to achieve the sufficient accuracy we have implemented 400 jobs (each with 4000000 tra-jectories) with our Monte Carlo algorithm, and 64 jobs (each with 222 trajectories) with the hybrid algo-rithm (correspondingly, with scrambled Halton, Niederreiter and Sobol sequences). The mean square errors of
rez(i)MCM − rez
(i)Hybrid, where rezi means wave vector, electron density energy density and Wigner function has
order ranging from O(10−4) to O(10−5). But to achieve the same results with the hybrid method weperformed 6 times less trajectories.
On the Figures 2, 3 and 4 one can see the quantum effects—there is no symmetry when electric field isapplied. The results obtained with MCM and the three hybrid algorithms are plotted on the same picture for

Ultra-fast Carrier Transport Simulation on the Grid 145
0 50 100 150 200 250 300 350 400−0.1
0
0.1
0.2
0.3
0.4
0.5
0.6
0.7
Fig. 5.1. Wave vector obtained with MCM and Hybrid1 (with Niederreiter) and Hybrid2 (with Halton) algorithm. The electricfield is 15[kW/cm] along to the nanowire.
Fig. 5.2. The Wigner function at 140fs presented in the plane z × kz. The electric field is 15[kV/cm] along to the nanowire.
each of the estimated quantities. They are not visible on Fig. 2 because the error is very small. The graphon Fig. 4 is in logarithmic scale and the differences can be seen. The best results are obtained using theNiederreiter sequence (in our version with the described scrambling algorithm).

146 Emanouil Atanassov, Todor Gurov and Aneta Karaivanova
Fig. 5.3. Electron density obtained with MCM and Hybrid1 (Niederreiter) and Hybrid2 (Halton). The electric field is15[kV/cm] along to the nanowire.
6. Conclusion. The use of scrambled quasi-random sequences allows for faster convergence of the algo-rithms compared to pure Monte Carlo, providing also aposteriory error estimation and avoiding singularities.The chosen computational infrastructure - Grid, enabled the achievement of interesting new results throughextensive computations, which would otherwise require considerable amount of time.
Further improvement of the convergence of the algorithms may be obtained by employing improved scram-bling algorithms of modified quasi-random sequences and this will be an important direction for our futurework.
REFERENCES
[1] E. Atanassov, “A New Efficient Algorithm for Generating the Scrambled Sobol’ Sequence”, Numerical Methods and Applica-tions, Springer-Verlag, LNCS 2542 (2003), 83-90.
[2] E. I. Atanassov, M. K. Durchova, “Generating and Testing the Modified Halton Sequences”, Numerical Methods and Appli-cations, Springer-Verlag, LNCS 2542 (2003), 91-98.
[3] E. Atanassov, T. Gurov, A. Karaivanova, M. Nedjalkov, “Monte Carlo Grid Application for Electron Transport”, LNCS 3993,Springer, 2006: 616-623.
[4] E. Atanassov, T. Gurov, A. Karaivanova, SALUTE Application for Quantum Transport New Grid Implementation Scheme,Proceedings of Spanish e-Science Grid Conference, ISBN: 987-84-7834-544-1, NIPO: 654-07-015-9, pp.23-32.
[5] E. Atanassov, A. Karaivanova, and T. Gurov, Quasi-random approach in the Grid application SALUTE, to appear in:Springer, LNCS (Proceedings of PPAM 2009).
[6] J. Barker, D. Ferry, Self-scattering path-variable formulation of high field time-dependent quantum kinetic equations forsemiconductor transport in the finite collision-duration regime. Phys. Rev. L., 42, 1979, pp. 1779-1781.
[7] B. C. Bromley, Quasirandom Number Generation for Parallel Monte Carlo Algorithms, Journal of Parallel Distributed Com-puting, 38(1), 1996, 101-104.

Ultra-fast Carrier Transport Simulation on the Grid 147
[8] H. Chi and E. Jones, “Generating Parallel Quasirandom Sequences by using Randomization”, Journal of distributed andparallel computing, 67(7): 876-881, 2007.
[9] H. Chi and M. Mascagni, “Efficient Generation of Parallel Quasirandom Sequences via Scrambling,” Lecture Notes in Com-puter Science, 4487, Springer, 2007, 723-730.
[10] M. V. Fischetti, S.E. Laux, ”Monte Carlo Analysis of Electron Transport in Small Semiconductor Devices Including Band-Structure and Space-Charge Effects”, Phys. Rev. B, 38, 1988, pp. 9721-9745.
[11] J. Foster, C. Kesselmann, The Grid: Blueprint for a New Computing Infrastructure, Morgan Kaufmann, 1998.[12] T. Gurov et al., Femtosecond Evolution of Spatially Inhomogeneous Carrier Excitations: Part II: Stochastic Approach and
GRID Implementation, LNCS 3743, Springer, 2006, pp. 157-163.[13] Karaivanova, A., Chi, H. and Gurov, T., Quasi-random walks on balls using c.u.d, In: Lecture Notes in Computer Science,
Vol. 4310, Springer-Verlag, Berlin Heidelberg New York (2007) 165–172.[14] A. Karaivanova, H.Chi, T. Gurov, Error Analysis of Quasirandom Walks on Balls, MIPRO/GVS 2009, ISBN 978-953-233-
044-1, pp. 285-289.[15] A. Karaivanova and N. Simonov, A Quasi-Monte Carlo Methods for Investigating Electrostatic Properties of Organic Pollutant
Molecules in Solvent, Springer Lecture Notes in Computer Science 3743:172-180, 2006.[16] H. Kosina, M. Nedjalkov and S. Selberherr, “An event bias technique for Monte Carlo device simulation”, Math. and Com-
puters in Simulation, 62, 2003, pp. 367-375.[17] C. Lecot and B. Tuffin, Quasi-Monte Carlo Methods for Estimating Transient Measures of Discrete Time Markov Chains,.
In Fifth International Conference on Monte Carlo and Quasi- Monte Carlo Methods in Scientific Computing, Springer,pages 329-344, 2002.
[18] I. Levinson, Translational Invariance in Uniform Fields and the Equation for the Density Matrix in Wigner Representation,Sov. Phys. JETP, 30, 1970, pp. 362367.
[19] W. Morokoff and R. E. Caflisch, A quasi-Monte Carlo approach to particle simulation of the heat equation, SIAM J. Numer.Anal., 30: 1558–1573, 1993.
[20] M. Nedjalkov, I. Dimov, F. Rossi, C. Jacoboni, “Convergence of the Monte Carlo Algorithm for the Solution of the WignerQuantum-Transport Equation”, J. Math. Comput. Model, 23, 8/9, 1996, pp. 159-166.
[21] Nedjalkov M., Kosina H. Selberherr S., Ringhofer C., Ferry D.K., Unified particle approach to Wigner-Boltzmann transportin small semiconductor devices, Physical Review B, 70, pp. 115319-115335,2004.
[22] M. Nedjalkov et al., Wigner transport models of the electron-phonon kinetics in quantum wires, Physical Review B, vol. 74,2006, pp. 035311-1035311-18.
[23] H. Niederreiter, Random Number Generations and Quasi-Monte Carlo Methods. SIAM, Philadelphia, 1992.[24] T. C. Schmidt and K. Moehring, Stochastic Path-Integral Simulation of Quantum Scattering, Physical Review A, vol. 48,
no. 5, 1993, pp. R3418.R3420.[25] http://goc.grid.sinica.edu.tw/gstat
[26] http://glite.web.cern.ch/glite/documentation/default.asp
Edited by: Marcin PaprzyckiReceived: April 10, 2010Accepted: June 21, 2010


Scalable Computing: Practice and ExperienceVolume 11, Number 2, pp. 149–159. http://www.scpe.org
ISSN 1895-1767c© 2010 SCPE
MANAGEMENT OF HIGH PERFORMANCE SCIENTIFIC APPLICATIONSUSING MOBILE AGENTS BASED SERVICES
SALVATORE VENTICINQUE∗, ROCCO AVERSA∗, BENIAMINO DI MARTINO∗, RENATO DONINI∗, SERGIO
BRIGUGLIO†, AND GREGORIO VLAD†
Abstract. High performance scientific applications are currently implemented using native languages for optimizing perfor-mance and utilization of resources. It often deals with thousands of code lines in FORTRAN or in C built of legacy applications.On the other hand new technologies can be exploited to improve flexibility and portability of services on heterogeneous and dis-tributed platforms. We propose here an approach that allows programmers to extend their applications to exploit this kind ofservices for management purposes. It can be done simply by adding some methods to the original code, which specialize applicationmanagement on occurrence of particular events. We mean that applications do not need to be rewritten into different languages oradopting specific programming models. We implemented a native console that is used by Mobile Agents to control the applicationlife-cycle. Agents implement a mobile service that supports check-pointing, suspension, resume, cloning and migration of managedapplications. A WSRF interface has been provided to Grid users who do not need to be aware about agents technology. We useda FORTRAN code for simulation of plasma turbolence as a real case study.
1. Introduction. We aim here at investigating how Mobile Agents technology can be used to developadvanced services for management of resources in distributed systems. Mobile Agents mechanisms such asautonomy, reactivity, clone-ability and mobility can be exploited for resource management and load balancingwhen system conditions change dynamically. Most of all mobile agents platforms are executed by VirtualMachines which make transparent the hardware/software architecture of the hosting node. It allows to distributeand execute mobile agents code on heterogeneous environments in a flexible way. On the other hand, most oflegacy applications have been implemented by languages such as FORTRAN and C, and they are compiled for atarget machine in order to optimize their performances. Here we present a mobile agent based service that allowsfor management of native applications on heterogeneous distributed systems. Agent technology has been usedto provide management facility on any node where the execution of applications will be started. Programmers,in order to exploit the management service, can extend their application without modify the original code,but by overriding some methods which specialize the application life-cycle. We aim at supporting checkpoint,resume, migration and monitoring. Furthermore service is targeted to each Grid user, who is unaware aboutAgent technology and can exploit services facilities by a compliant WSRF interface. A console that allowsthe application control by an agent has been designed and implemented. An agent based service designedand implemented to automatically perform management strategies. In the second section related works onmanagement services and load balancing mechanism are described. In section 3 we describe the facilities wehave implemented in order to control the application life-cycle. In section 4 the software architecture of ourservice is presented. Section 5 provides an example of simple application that has been extended in order toexploit the service.
2. Related work. Application management and migration are mechanisms developed in many environ-ments for common purposes. There are many platforms which exploit migration to implement load balancingin distributed and parallel systems. When we deal with homogeneous clusters, process migration is supportedto share resources dynamically and adaptively. MOSIX [1] provides a set of algorithms to react in real timeto the changes of resources utilization in a cluster of workstations. Migration of processes is preemptive andtransparent. The objective is to provide high performances to parallel and sequential applications. OpenMosix[2] is a decentralized version of MOSIX. Each node behaves as an autonomous system. Kerrighed [3] supportsthread migration. When a node is less loaded a process is moved there from a more busy node. OpenSSI [3]does not need to save part of the process on the original hosting node. System calls are called locally. Not allthe processes are candidates for migration.
On the other hand in heterogeneous systems process migration is not generally supported. Different en-vironments are virtualized by a middleware that hides architectural details to the applications and supportsportability. In this case is possible to migrate code and status of applications, but not to resume the processstatus. An hybrid approach that manage a Grid of homogeneous clusters is presented in [4] as an advance
∗Second University of Naples, Aversa (CE), Italy, emails: {rocco.aversa, salvatore.venticinque}@unina2.it,[email protected], [email protected]
†Associazione EURATOM-ENEA sulla Fusione, Frascati, Rome, Italy,emails: {brigulgio, vlad}@enea.it
149

150 Salvatore Venticinque, Rocco Aversa et al.
Fig. 3.1. Application life-cycle
of research cited above. Some relevant contributions, which exploit Mobile Agents technology are [5, 6]. Weaim at exploiting flexibility of Mobile Agent programming to manage legacy applications without changing theoriginal code and without rewriting the application into another language or adopting a new programmingparadigm. Some approaches which should be compared with the one presented in this paper are cited below. [7]presents an approach to support mobility of applications in a GRID environment. A mobile agent is describedby an UML-like language called blueprint. The blueprint description is transferred together its status. Thereceiving platform translates the agent blueprint description in a Java or a Python application that implementthe original functionalities Blueprint is a language for a high level specification of agent functionalities andof its operational semantics. A specification describes the behavior of an agent in terms of its basic buildingblocks: components, control flow and data flow. Agent factories interpret the agent blueprint description andgenerate executable code composed of, for example, Java, Python, or C components. To support migration ofcommon user applications, in [8], authors provide the possibility to insert some statements, such as go( ) orhop( ), between blocks of computation, such as for/while loops. A pre-compiler, such as ANTLR for C/C++and JavaCC for Java source code, is used to substitute these statements with code that implements mobility.A user program may be entirely coded in C/C++ and executed in native mode. As a result Java agent startsthe native code using a wrapper implemented by the JNI technology. In our approach programmers who wantto support migration do not need to deal with any models, but they have just to handle such events which askto save or resume the application status.
3. Management facilities and application life-cycle. We exploited Mobile Agents technology to allowservices execution on heterogeneous platforms. We mean that we can execute monitoring and control facilitieson heterogeneous nodes in a distributed environment. Furthermore we can move dynamically a service instancefrom a node to another resuming the execution at destination. Mechanisms of Mobile Agents technology havebeen adopted to design and implement advanced management facilities. Besides we provide the possibility toextend the same facilities to the managed application. Our model of application life-cycle is shown in Fig: 3.1.Regardless of the location, the process state could assume the following values: started, suspended, stoppedand resumed. In the suspended mode, the application status has been saved in order to allow process restoringwhen a resume action will be invoked. Let us clClrify that the application status is saved not the process one.That’s because we aim at supporting mobility across heterogeneous architectures. Life-cycle can be monitoredand controlled by a software console that generates and handles the following events:
1. start : starts the execution of a native application on a cluster node2. suspend : suspends the native application saving its execution status.3. resume: resumes the native application restoring the status saved on the last suspension.4. stop: stops the native application.5. checkpoint : saves the status of the native application without stopping its execution.6. migrate: migrates the native application to a target node restoring its status at destination.7. split : clones the native application and splits the job between the clones.
We have developed both an interactive GUI and a batch interpreter for submitting commands to the applicationconsole.

Management of High Performance Scientific Applications 151
Fig. 4.1. Software Architecture
4. Service architecture. As shown in Fig:4.1 software architecture of the management service is com-posed of different elements at different levels. A first set of components implements a portable service executedby Mobile Agents. Distributed Agents perform different roles. They implement user interface, application mon-itoring and control, code management. A monitor detects relevant changes of system conditions and notifiesthese events to the Agent Scheduler. The Agent Scheduler reacts in order to avoid performance degradation.It communicate and coordinates other agents. The Proxy Agent is responsible of the application execution. Itreceives requests from other agents and manages the application by a Java console. An abstract console definesthe interface between the proxy and the application. It is obviously independent by the kind of applicationthat will be controlled. Native applications will be linked to the console by mean of a native implementationof abstract methods. In order to support the execution on heterogeneous architectures, the programmer hasto make available a new shared library that overrides native methods and that has been compiled for a targetarchitecture. Libraries will be stored on a remote repository and the proxy agent is able to automaticallydownload them, when the execution is moved to a new heterogeneous node.
4.1. Agent level.
4.1.1. Agent Proxy. An Agent Proxy is delegated to manage an instance of users’ application. It can:
• save and resume the status of the native application (save, resume);• migrate, clone or split the application;• handle special conditions such as termination.
For instance whenever the agent manager requires the migration of a native application to a selected node, theAgent Proxy has to transparently:
• suspend the native application as soon as possible;• save the status of the native application;• migrate to the target node;• detect the target node hardware and software equipment;• whenever it is necessary download and install the right library;• restore the status of the native application;• resume the native application.
4.1.2. Agent Manager. The Agent Manager provides a graphic interface for creating, migrating, cloningand destroying both Agent Proxies and the native applications. It sends standard ACL messages (ACL standsfor Agent Communication Language) to ask for the actions ProxyAgents should take. The Manager allowsto load references to libraries which have been built and made available for different hardware and softwarearchitecture. It can handle independently multiple execution instances of the same application. A snapshot ofthe Management Console GUI is shown in Figure 4.2.

152 Salvatore Venticinque, Rocco Aversa et al.
Fig. 4.2. Management Console Gui
4.1.3. Agent Monitor. Our architecture includes a monitor module to detect relevant changes of systemconditions and notifies these events to the Autonomous Agent. As shown in the following the system is ableto react to the events which affect the performance of the both service and application. The way to generatethe events to send to the Batch Agent, could be less o more complex according to the particular requirements.Currently a simple configuration of management strategy based on threshold mechanisms is supported. Theagent monitor checks the application’s performance and compares it with a target input, such as the throughputof a web server; when a performance degrade was detected the right actions could be performed.
4.1.4. Agent Scheduler. The Agent Scheduler uses management facilities provided by Agent Proxies inorder to carefully distribute the cluster workload or to optimize performance of applications. For instance, itcan migrates native applications from a platform to another one that is less loaded. It can redistribute groupsof applications in order to reduce network traffic by minimizing inter-communications, or reducing the overheaddue to data transfer. Actually the user can configure the Scheduler behavior by associating a set of actions to anotification event. When a specific ACL messages has been received from the agent monitor the related batchfile is interpreted and executed. A batch file can be written as described in Figure 4.1.4. In the example weshow a sequence of commands which are executed on the occurrence of two events: idle node and busy node.Parameters of commands are extracted from content of related events notified by ACL messages.
<?xml version="1.0" encoding="UTF-8" ?>
<batch>
<activation>
<and>
<event name="idle_node">
<event name="busy_node">
</and>
</activation>
<sequence>
<operation>
<command type="suspend" agent="$busy_node.agent_name[0]"/>
</operation>
<operation>
<command type="move" agent="$busy_node.agent_name[0]">
<parameters>
<parameter>$idle_node.container[0] </parameter>
</parameters>
</command>
</operation>
<operation>
<command type="resume" agent="$busy_node.agent_name[0]"/>
</operation>
<sequence>
</batch>
Fig. 4.3. An XML batch file define the list of action that must be taken on an event occurence
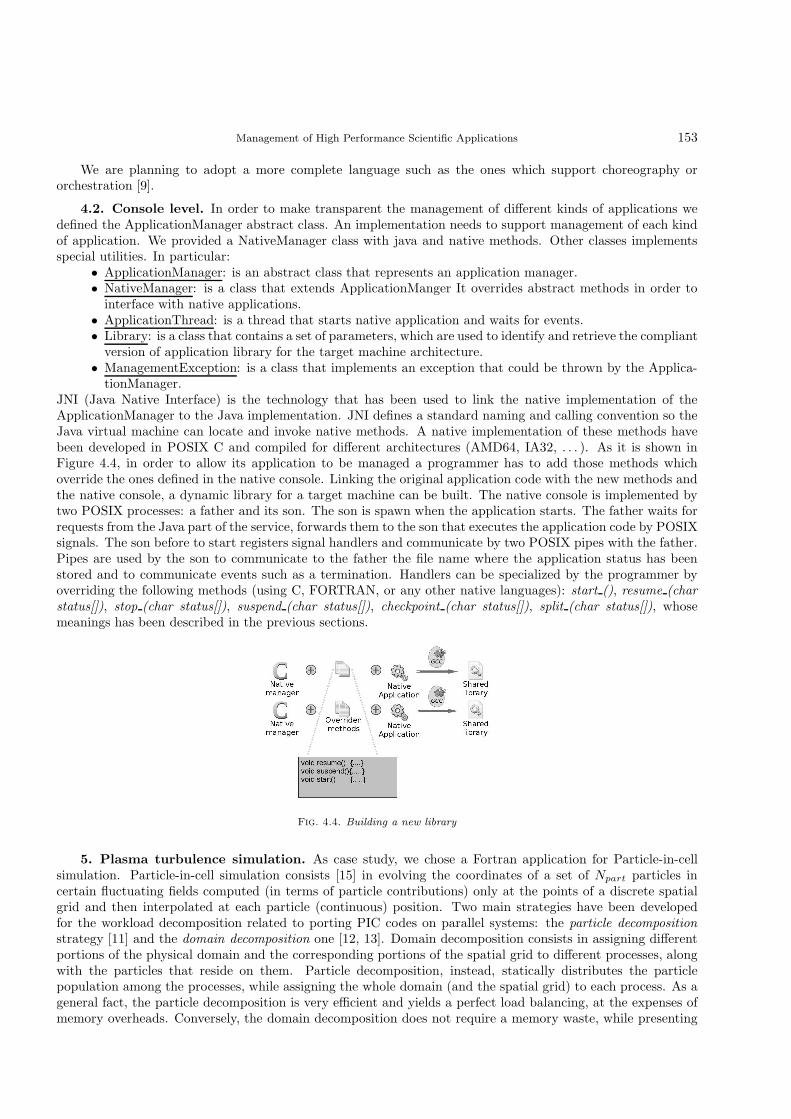
Management of High Performance Scientific Applications 153
We are planning to adopt a more complete language such as the ones which support choreography ororchestration [9].
4.2. Console level. In order to make transparent the management of different kinds of applications wedefined the ApplicationManager abstract class. An implementation needs to support management of each kindof application. We provided a NativeManager class with java and native methods. Other classes implementsspecial utilities. In particular:
• ApplicationManager: is an abstract class that represents an application manager.• NativeManager: is a class that extends ApplicationManger It overrides abstract methods in order to
interface with native applications.• ApplicationThread: is a thread that starts native application and waits for events.• Library: is a class that contains a set of parameters, which are used to identify and retrieve the compliant
version of application library for the target machine architecture.• ManagementException: is a class that implements an exception that could be thrown by the Applica-
tionManager.JNI (Java Native Interface) is the technology that has been used to link the native implementation of theApplicationManager to the Java implementation. JNI defines a standard naming and calling convention so theJava virtual machine can locate and invoke native methods. A native implementation of these methods havebeen developed in POSIX C and compiled for different architectures (AMD64, IA32, . . . ). As it is shown inFigure 4.4, in order to allow its application to be managed a programmer has to add those methods whichoverride the ones defined in the native console. Linking the original application code with the new methods andthe native console, a dynamic library for a target machine can be built. The native console is implemented bytwo POSIX processes: a father and its son. The son is spawn when the application starts. The father waits forrequests from the Java part of the service, forwards them to the son that executes the application code by POSIXsignals. The son before to start registers signal handlers and communicate by two POSIX pipes with the father.Pipes are used by the son to communicate to the father the file name where the application status has beenstored and to communicate events such as a termination. Handlers can be specialized by the programmer byoverriding the following methods (using C, FORTRAN, or any other native languages): start (), resume (charstatus[]), stop (char status[]), suspend (char status[]), checkpoint (char status[]), split (char status[]), whosemeanings has been described in the previous sections.
Fig. 4.4. Building a new library
5. Plasma turbulence simulation. As case study, we chose a Fortran application for Particle-in-cellsimulation. Particle-in-cell simulation consists [15] in evolving the coordinates of a set of Npart particles incertain fluctuating fields computed (in terms of particle contributions) only at the points of a discrete spatialgrid and then interpolated at each particle (continuous) position. Two main strategies have been developedfor the workload decomposition related to porting PIC codes on parallel systems: the particle decompositionstrategy [11] and the domain decomposition one [12, 13]. Domain decomposition consists in assigning differentportions of the physical domain and the corresponding portions of the spatial grid to different processes, alongwith the particles that reside on them. Particle decomposition, instead, statically distributes the particlepopulation among the processes, while assigning the whole domain (and the spatial grid) to each process. As ageneral fact, the particle decomposition is very efficient and yields a perfect load balancing, at the expenses ofmemory overheads. Conversely, the domain decomposition does not require a memory waste, while presenting

154 Salvatore Venticinque, Rocco Aversa et al.
particle migration between different portions of the domain, which causes communication overheads and theneed for dynamic load balancing [14, 13]. The typical structure of a PIC code for plasma particle simulationcan be represented as follows. At each time step, the code
1. computes the electromagnetic fields only at the Ncell points of a discrete spatial grid (field solver phase);2. interpolates the fields at the (continuous) particle positions in order to evolve particle phase-space
coordinates (particle pushing phase);3. collects particle contribution to the pressure field at the spatial-grid points to close the field equations
(pressure computation phase).
We can schematically represent the structure of this time iteration by the following code excerpt:
call field_solver(pressure,field)
call pushing(field,x_part)
call compute_pressure(x_part,pressure)
Here, pressure(1:n cell), field(1:n cell) and x part(1:n part) (with n cell= Ncell and n part= Npart)represent pressure, electromagnetic-field and particle-position arrays, respectively. In order to simplify thenotation, we will refer, in the pseudo-code excerpts, to a one-dimensional case, while the real code refers to athree-dimensional (3-D) application. In implementing a parallel version of the code, according to the distributed-memory domain-decomposition strategy, different portions of the physical domain and of the correspondingspatial grid are assigned to the nnode different nodes, along with the particles that reside on them. Thisapproach yields benefits and problems that are complementary to those yielded by the particle-decompositionone [11]: on the one hand, the memory resources required to each node are approximately reduced by the numberof nodes (n part∼ Npart/nnode, n cell∼ Ncell/nnode); an almost linear scaling of the attainable physical-spaceresolution (i. e., the maximum size of the spatial grid) with the number of nodes is then obtained. On the otherhand, inter-node communication is required to update the fields at the boundary between two different portionsof the domain, as well as to transfer those particles that migrate from one domain portion to another. Sucha particle migration possibly determines a severe load unbalancing of the different processes, then requiringa dynamic balancing, at the expenses of further computations and communications. Let us report here theschematic representation of the time iteration performed by each process, before giving some detail on theimplementation of such procedures:
call field_solver(pressure,field)
call check_loads(i_check,n_part,n_part_left_v,
& n_part_right_v)
if(i_check.eq.1)then
call load_balancing(n_part_left_v,n_part_right_v,
& n_cell_left,n_cell_right,n_part_left,n_part_right)
n_cell_new=n_cell+n_cell_left+n_cell_right
if(n_cell_new.gt.n_cell)then
allocate(field_aux(n_cell))
field_aux=field
deallocate(field)
allocate(field(n_cell_new))
field(1:n_cell)=field_aux(1:n_cell)
deallocate(field_aux)
endif
n_cell=max(n_cell,n_cell_new)
n_cell_old=n_cell
call send_receive_cells(field,x_part,
& n_cell_left,n_cell_right,n_part_left,n_part_right)
if(n_cell_new.lt.n_cell_old)then
allocate(field_aux(n_cell_old))
field_aux=field
deallocate(field)
allocate(field(n_cell_new))
field(1:n_cell_new)=field_aux(1:n_cell_new)
deallocate(field_aux)

Management of High Performance Scientific Applications 155
endif
n_cell=n_cell_new
n_part=n_part+n_part_left+n_part_right
endif
call pushing(field,x_part)
call transfer_particles(x_part,n_part)
allocate(pressure(n_cell))
call compute_pressure(x_part,pressure)
call correct_pressure(pressure)
In order to avoid continuous reallocation of particle arrays (here represented by x part) because of the particlemigration from one subdomain to another, we overdimension (e.g., +20%) such arrays with respect to the initialoptimal-balance size, Npart/nnode. Fluctuations of n part around this optimal size are allowed within a certainband of oscillation (e.g., ±10%). This band is defined in such a way to prevent, under normal conditions, indexoverflows and, at the same time, to avoid excessive load unbalancing.
5.1. Restructuring the original code. Preliminary experiments deal with restructuring and manage-ment of the sequential program that solves the problem presented above. The program performs, after aninizialization phase, a number of iterations that at each run update values of fields, pressures, position andvelocity of simulation particles. The original application (about 5-thousands lines of fortran code) has beenprovided by the ENEA1. It saves at the end of each iteration the intermediate results. We indentified the set ofadditional relevant information that need to be saved, at the end of each iteration in order to checkpoint andresume the application after a suspension. It means that before a new iteration starts, the application statushas been already saved. A suspension will cause the lost of work that has performed since the beginning of thecurrent iteration.
We restructured the original code by adding a number of functions to handle the start, stop, suspend andresume events. start: it calls the init function that reads the input data. The init subroutine starts also themain cycle that use many iterations to update particles data step by step.integer function start()
start=1
call init
call main_cycle
end function
stop: it stops the execution, that will restart from the beginning of the application when the start-commandwill be invoked. When the application restarts input data will be read again and intermediate results will belost.integer function stop()
stop=1
end function
checkpoint: it writes in a file the intermediate information which describe the particles (pressure, position,volume . . . ), algorithm data such as the current iteration, the max number of iterations, and others. Thesedata are stored in two modules, which are global data and particles data. The write data subroutine uses thedataout parameter as filename.integer function checkpoint(dataout,n)
integer n
character dataout(n)
use global_data
use particles_data
checkpoint=1
call write_data(dataout)
end function
suspend: it suspends the execution that can be resumed at any time, restoring the application status. The writestatus saves the application status in a file as it has been explained above. If a suspension has been requested,
1ENEA is the Italian Agency for New Technologies, Energy and Sustainable Economic Development - http ://www.fusione.enea.it
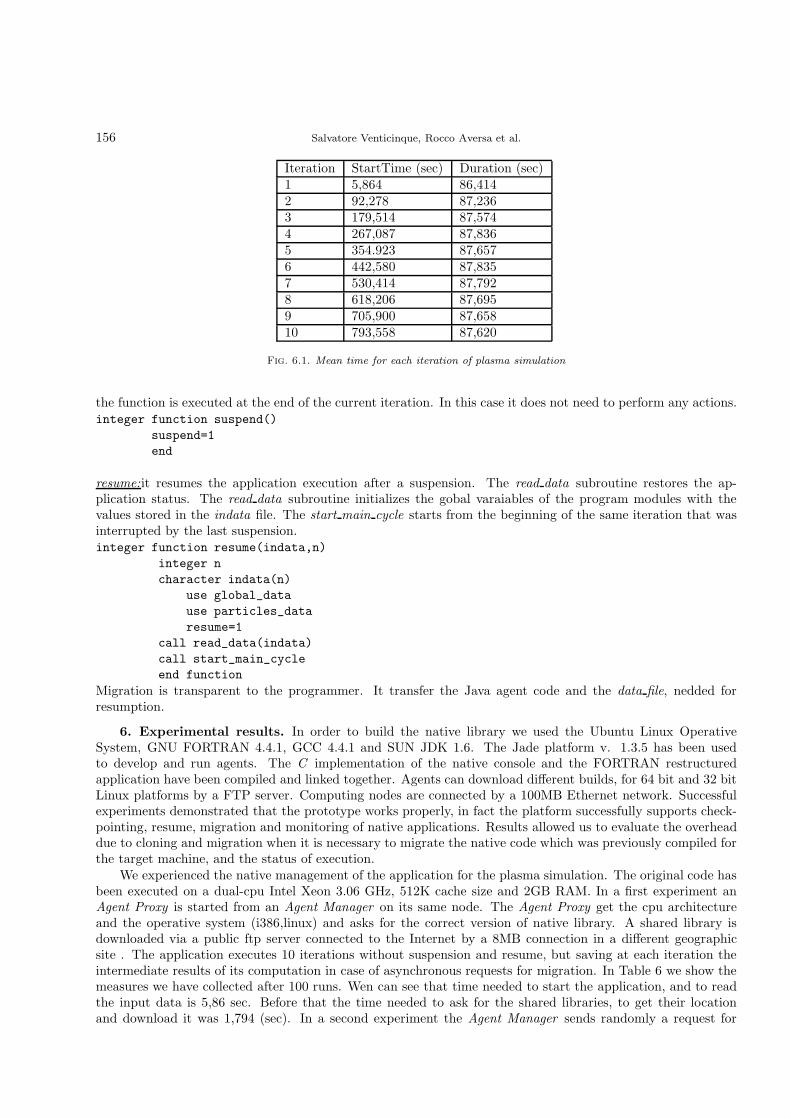
156 Salvatore Venticinque, Rocco Aversa et al.
Iteration StartTime (sec) Duration (sec)1 5,864 86,4142 92,278 87,2363 179,514 87,5744 267,087 87,8365 354.923 87,6576 442,580 87,8357 530,414 87,7928 618,206 87,6959 705,900 87,65810 793,558 87,620
Fig. 6.1. Mean time for each iteration of plasma simulation
the function is executed at the end of the current iteration. In this case it does not need to perform any actions.integer function suspend()
suspend=1
end
resume:it resumes the application execution after a suspension. The read data subroutine restores the ap-plication status. The read data subroutine initializes the gobal varaiables of the program modules with thevalues stored in the indata file. The start main cycle starts from the beginning of the same iteration that wasinterrupted by the last suspension.integer function resume(indata,n)
integer n
character indata(n)
use global_data
use particles_data
resume=1
call read_data(indata)
call start_main_cycle
end function
Migration is transparent to the programmer. It transfer the Java agent code and the data file, nedded forresumption.
6. Experimental results. In order to build the native library we used the Ubuntu Linux OperativeSystem, GNU FORTRAN 4.4.1, GCC 4.4.1 and SUN JDK 1.6. The Jade platform v. 1.3.5 has been usedto develop and run agents. The C implementation of the native console and the FORTRAN restructuredapplication have been compiled and linked together. Agents can download different builds, for 64 bit and 32 bitLinux platforms by a FTP server. Computing nodes are connected by a 100MB Ethernet network. Successfulexperiments demonstrated that the prototype works properly, in fact the platform successfully supports check-pointing, resume, migration and monitoring of native applications. Results allowed us to evaluate the overheaddue to cloning and migration when it is necessary to migrate the native code which was previously compiled forthe target machine, and the status of execution.
We experienced the native management of the application for the plasma simulation. The original code hasbeen executed on a dual-cpu Intel Xeon 3.06 GHz, 512K cache size and 2GB RAM. In a first experiment anAgent Proxy is started from an Agent Manager on its same node. The Agent Proxy get the cpu architectureand the operative system (i386,linux) and asks for the correct version of native library. A shared library isdownloaded via a public ftp server connected to the Internet by a 8MB connection in a different geographicsite . The application executes 10 iterations without suspension and resume, but saving at each iteration theintermediate results of its computation in case of asynchronous requests for migration. In Table 6 we show themeasures we have collected after 100 runs. Wen can see that time needed to start the application, and to readthe input data is 5,86 sec. Before that the time needed to ask for the shared libraries, to get their locationand download it was 1,794 (sec). In a second experiment the Agent Manager sends randomly a request for

Management of High Performance Scientific Applications 157
migration from a node to another one of the cluster. Even if we know in advance that the nodes have thesame cpu an operative system we chose to ask for and download again the shared library. Furthermore, evenif the nodes share the same file system via NFS, however the agent servers and the application execute in twodifferent directory. In the first one we have the agents code and the input data, in the second one only theintermediate results will be saved. The agent code will be transfered during migration and saved in a cache.The status of application contains intermediate values of the program variables and of the particles. The totalsize of information is about 95MB. To optimize the data transfer, the application compresses the data beforethe migration, and decompresses the file at destination. The time spent to suspend, migrate and resume theapplication will be:
Ttotal = Twrite + Tcompress + Tdecompress + Ttransfer + Tresume + Tlost (6.1)
When migration is asked the array of particles has been already written into a file at the end of the previousiteration. Twrite represents the time needed to write only the current values of variables necessary for resumption.Tcompress is the compression time that takes 6.2 sec, while the decompression takes 1.4 sec. The compressionreduce the data size to 30 MB. In the resume method of the native console, overridden by the application, wecall the tar utility, with the czf options to compress the application status. It could be done in the java code ifsuch utility is not available. The Proxy Agent, before to move, store the compressed file in a byte array and usesthe Jade APIs to migrate with its own code and attributes. Ttransfer is the time needed to transfer the agentsand the application status. On the target node we only need a running agent platform. Tresume representsthe time to restart the application that will read the intermediate values of its variable from the file system.Tlost is the time elapsed since the beginning of the current iteration before the migration request. It dependson when the signal interrupts the main thread. It will be less than the duration of a complete iteration. Inour implementation all the work that has been done since the beginning of the current iteration is lost. In theformula we do not consider the time needed to download the native code because we could send an agent at thenew destination to identify the target architecture and to download the right version of native library before andmeanwhile the application is suspended. However in the following measures this strategy as not been appliedand Ttotal will include also that contribution.
After a test-set of 100 runs, we observed a mean turnaround of 16m 22,611s without migration, and 17m18,993s with a random migration. That means a mean time of Ttotal equals to 56,382 secs to be spent formigrating the execution from a node to another one of the local network. We can observe that the migration,in this case, takes about 64% of a single iteration, that is not relevant if compared to a real execution ofhundreds iterations. We mean that the service can be effectively used to move the execution to a faster node,or to continue when the hosting machine should be upgraded or restarted. Furthermore many performanceimprovements can be designed. For example the choice to save the application status at each iteration is notthe most effective one. We could plan different strategies taking into account the duration of each iteration, thetime needed to suspend, migrate and resume the application, and the probability that it could be happening.In Fig. 6 it is shown the time trace for one execution of the test-set. We can see step by step what happened.In the first column we have who takes the time, in the second one the item is described and in the last onethe time duration. On the left side we describe what happened on the first node (Container 1) and on theright side the second Container nodes works after the migration. The character @ represents the time elapsedsince the start of the native application, otherwise the time value represents the duration of that event. In thiscase the suspension is received at 15,073 sec from the init of the application and Tlost is about 9,17 secs. Asthe mean iteration lasts for 88,728 secs, the other contributions of Ttotal are all relevant. We can observe thatthe library download takes more time at Container-2 because the Agent Proxy is running on a different nodethan the Agent Manager, so the communication use the cluster network. Nevertheless the application needsto resume the intermediate results before to start the first iteration, however all the needing initialization arealready done. That is because the first iteration starts already at 0,35 (sec).
7. Conclusions. We presented an approach for agents based management of high performance scientificapplications, providing a real case study as a proof of concept. We designed and implemented a Mobile Agentsbased service and its interface to POSIX applications. Programmers can extend their native applications inorder to support checkpoint, migration, suspension, resuming, etc. Service implementation is in Java. It isportable and mobile. Application portability on heterogeneous node is supported through the dynamic linkingof native libraries compiled for the target machine. The application life cycle can be controlled interactively from

158 Salvatore Venticinque, Rocco Aversa et al.
Container-1 Container-2Code Event Time (sec) Code Event Time
Proxy Agent Library down. 1,629 - - - - - - - - - - - - - - -
Application Iteration 1 @5,893 ; 0 - - - - - - - - - - - - - - -
Application Suspend @15,073 - - - - - - - - - - - - - - -
Agent manager Ttotal 17,349 - - - - - - - - - - - - - - -
- - - - - - - - - - - - - - - Proxy Agent Library down. 2,015
- - - - - - - - - - - - - - - Application Iteration 1 @0,329 ; 89,168
- - - - - - - - - - - - - - - Application Iteration 2 @89,497 ; 89,194
- - - - - - - - - - - - - - - Application Iteration 3 @178,691 ; 89,186
- - - - - - - - - - - - - - - Application Iteration 4 @267,878 ; 89,047
- - - - - - - - - - - - - - - Application Iteration 5 @356,926 ; 88,348
- - - - - - - - - - - - - - - Application Iteration 6 @445,274 ; 88,615
- - - - - - - - - - - - - - - Application Iteration 7 @533,889 ; 88,537
- - - - - - - - - - - - - - - Application Iteration 8 @622,426 ; 88,364
- - - - - - - - - - - - - - - Application Iteration 9 @622,426 ; 88,88
- - - - - - - - - - - - - - - Application Iteration 10 @710,790 ; 87,932
Fig. 6.2. Trace of a migrated execution
a GUI or can be programmed by a scheduler that reacts to changes in the environment. An abstract consoledefines the methods which are used by agents in order to interface with the application. An implementationfor POSIX application has been implemented and tested. We presented preliminary results which will beextended and discussed in the camera ready version. We Future work will deal with the management of paralleland distributed applications by cooperation of mobile agents which implement strategies for distributing theworkload in order to optimize system utilization or application performance.
REFERENCES
[1] Barak A. and La’adan O., The MOSIX Multicomputer Operating System for High Performance Cluster Computing. Journalof Future Generation Computer Systems (13) 4-5, pp. 361-372, March 1998.
[2] J. Bilbao, G. Garate, A. Olozaga, A. del Portillo: Easy clustering with openMosix, World Scientific and Engineering Academyand Society (2005)
[3] R. Lottiaux, B. Boissinot, P. Gallard, G. Valle, C. Morin: openMosix, OpenSSI and Kerrighed: a comparative study, INRIA(2004)
[4] Maoz T., Barak A. and Amar L., Combining Virtual Machine Migration with Process Migration for HPC on Multi-Clustersand Grids, IEEE Cluster 2008, Tsukuba, Sept. 2008.
[5] I. Foster, N. Jennings, Kesselman, Brain Meets Brawn: Why Grid and Agents Need Each Other, in Proceeding of the 3rd JointConference Autonomous Agents and Multi-Agent Systems, pp. 8-15, 2004.
[6] B. Di Martino, O. F. Rana, Grid Performance and Resource Management using Mobile Agents, in: V. Getov et al. (Eds.),Performance Analysis and Grid Computing, pp. 251-264, Kluwer Academic Publishers, 2004 (ISBN 1-4020-7693-2).
[7] F. M. T. Brazier, B. J. Overeinder, M. van Steen, and N. J. E. Wijngaards, “Agent Factory: Generative Migration of MobileAgents in Heterogeneous Environments”, Proceedings of the 2002 ACM symposium on Applied computing, ISBN:1-58113-445-2, pp 101 - 106.
[8] M. Fukuda, Y. Tanaka, N. Suzuki, L. F. Bic, S. Kobayashi, “A mobile-agent-based PC grid”, Autonomic Computing Workshop,ISBN: 0-7695-1983-0, pp 142- 150, June 2005.
[9] C. Peltz. Web Services Orchestration and Choreography. IEEE Computer Magazines, 2003.[10] R. Donini, R. Aversa, B. Di Martino e S. Venticinque. Load balancing of mobile agents based applications in grid systems.
In Proceedings of 8 IEEE 17th Workshop on Enabling Technologies: Infrastructure for Collaborative Enterprises, Rome,23-25 June 2008. IEEE.
[11] Di Martino, B., Briguglio, S., Vlad, G., Sguazzero, P.: Parallel PIC Plasma Simulation through Particle DecompositionTechniques. Parallel Computing 27, n. 3, (2001) 295–314.
[12] Fox, G. C., Johnson, M., Lyzenga, G., Otto, S., Salmon, J., Walker, D.: Solving Problems on Concurrent Processors (PrenticeHall, Englewood Cliffs, New Jersey, 1988).

Management of High Performance Scientific Applications 159
[13] Ferraro, R. D., Liewer, P., Decyk, V. K.: Dynamic Load Balancing for a 2D Concurrent Plasma PIC Code, J. Comput. Phys.109, (1993) 329–341.
[14] Cybenko, G.: Dynamic Load Balancing for Distributed Memory Multiprocessors. J. Parallel and Distributed Comput., 7,(1989) 279–391.
[15] Birdsall, C. K., Langdon, A. B.: Plasma Physics via Computer Simulation. (McGraw-Hill, New York, 1985).
Edited by: June 21, 2010Received: March 30, 2010Accepted: June 21, 2010


Scalable Computing: Practice and ExperienceVolume 11, Number 2, pp. 161–172. http://www.scpe.org
ISSN 1895-1767c© 2010 SCPE
VINE TOOLKIT—TOWARDS PORTAL BASED PRODUCTION SOLUTIONS FORSCIENTIFIC AND ENGINEERING COMMUNITIES WITH GRID-ENABLED
RESOURCES SUPPORT
DAWID SZEJNFELD, PIOTR DZIUBECKI, PIOTR KOPTA, MICHAL KRYSINSKI, TOMASZ KUCZYNSKI,
KRZYSZTOF KUROWSKI, BOGDAN LUDWICZAK, TOMASZ PIONTEK, DOMINIK TARNAWCZYK,
MA LGORZATA WOLNIEWICZ∗, PIOTR DOMAGALSKI, JAROSLAW NABRZYSKI, AND KRZYSZTOF WITKOWSKI†
Abstract. In large scale production and scientific, academic environments, the information sets to perform computationson come from various sources. In particular, some computations may require the information obtained as a result of previouscomputations. Workflow description offers an attractive approach to formally deal with such complex processes. Vine Toolkit[1] solution addresses some major challenges here such as the synchronization of distributed workflows, establishing a communitydriven grid environment for the seamless results sharing and collaboration. In order to accomplish these goals Vine Toolkit offersintegration on different layers starting from rich user interface web components embedded in portal frameworks like GridSphere[28] or Liferay [26], integration with workflow engine and grid security and ending up with a built-in meta-scheduling mechanisms,that allow IT administrators to perform load balancing automatically among computing clusters and data centers to meet peakdemands. As a result of the wow2green [5] project a complete solution has been developed and delivered and still is being adoptedin the pending projects like PL-Grid [4].
Key words: grid portals, web portal, workflows, grid computing, grid technology, grid, Vine toolkit, Vine, GRMS, flowify,wow2green, PL-Grid, GRIA, middleware, GridSphere, liferay
1. Introduction. Vine Toolkit (in short Vine) is a modular, extensible Java library that offers developersan easy-to-use, high-level Application Programming Interface (API) for Grid-enabling applications and moreas it will be described in this article. It was developed within EU-funded projects like OMII Europe [2] orBEinGRID [3] and polish infrastructural project PL-Grid [4]. It was used to build advanced portal solutionintegrating many different grid technologies within BEinGRID business experiment called wow2green (Work-flows On Web2.0 for Grid Enabled infrastructures in complex Enterprises) [5]. The solution will be described toillustrate the great scope of Vine usage and its advanced features. Integration with web frameworks like Liferay[26] allows developers to build production quality web collaboration solutions. The article is an extended versionof the PPAM 2009 article [27]—individual paragraphs were extended and some new added.
1.1. State of the art. Currently there are several grid portals on the market. While some of them allowonly to submit and manage jobs in the dedicated system, other are application development platforms designedfor building and running simulations in multiple middleware solutions. There are also environments which putfocus on the workflow or collaboration capabilities. Possibility of working with multiple middleware at thesame time combined with workflow support, collaboration capabilities as well as possibility of integration withmultiple portal frameworks are features which distinguish Vine Toolkit amongst competitive open-source gridportal solutions.
Some of the grid portals which are related to the Vine Toolkit are described in the following subsections.
1.1.1. P-GRADE. [6]—first highly integrated parallel application development system for Grid and clus-ters. It uses Globus, Condor-G and MPICH-G2 as grid-aware middleware to conduct computations. To provideGrid programming interface with support for workflow and orchestration P-GRADE uses GRAPNEL languagewhich allows a programmer to set a workflow of objects/library calls. Special tool may be used to generate MPIcode from a GRAPNEL program. Supports legacy applications written in: C, C++, Fortran, MPI, PVM.
P-GRADE Grid Portal—is a web based, service rich environment for the development, execution andmonitoring of workflows and workflow based parameter studies on various grid platforms. P-GRADE Portalhides low-level grid access mechanisms by high-level graphical interfaces, making even non grid expert userscapable of defining and executing distributed applications on multi-institutional computing infrastructures.Workflows and workflow based parameter studies defined in the P-GRADE Portal are portable between gridplatforms without learning new systems or re-engineering program code. Technology neutral interfaces andconcepts of the P-GRADE Portal help users cope with the large variety of grid solutions. More than that, any
∗Poznan Supercomputer and Networking Center, ({dejw, piotr.dziubecki, pkopta, mich, tomasz.kuczynski,
krzysztof.kurowski, bogdanl, piontek, dominikt, gosiaw}@man.poznan.pl).†FedStage Systems, ({piotr.domagalski, krzysztof.witkowski, jarek.nabrzyski}@fedstage.com).
161
162 D. Szejnfeld et al.
P-GRADE Portal installation can access multiple grids simultaneously, which enables the easy distribution ofcomplex applications on several platforms. Interoperability with Globus Toolkit 2, Globus Toolkit 4, LCG andgLite grid middlewares. Secured grid access mechanisms using X.509 certificates and proxy credentials. Built-ingraphical editor to design and define grid workflows and grid parameter studies. Integrated workflow managerthat orchestrates the fault tolerant execution of grid applications. On-line workflow and job monitoring andvisualization facilities. MPI execution in Globus and gLite grid environments. Graphical MDS and BDII gridinformation system browser. Support to include local and remote storage files into grid applications. Userlevel storage quota management to protect against server overloading. Legacy application publish and reusecapabilities by the GEMLCA mechanism. Workflow import-export-archive service.
License: GPL
1.1.2. myExperiment.org. [8]—is a collaborative environment where scientists can safely publish theirworkflows and experiment plans, share them with groups and find those of others. Workflows, other digitalobjects and bundles (called Packs) can now be swapped, sorted and searched like photos and videos on theWeb. Unlike Facebook or MySpace, myExperiment fully understands the needs of the researcher and makes itreally easy for the next generation of scientists to contribute to a pool of scientific methods, build communitiesand form relationships—reducing time-to-experiment, sharing expertise and avoiding reinvention. Launched inNovember 2007, contains the largest public collection of workflows across multiple workflow systems includingTaverna (over 800 workflows) and Trident and is used by thousands of users ranging from life sciences andchemistry to social statistics and music information retrieval. Project source code is accessible and written inRuby on Rails.
License: BSD
1.1.3. G-POD. [7]—European Space Agency Earth Observation G-POD (Grid Processing on Demand),it is a generic GRID-based operational environment where specific data handling applications can be seamlesslyplugged into system. Coupled with high-performance and sizeable computing resources managed by GRIDtechnologies, it provides the necessary flexibility for building an application virtual environment with quickaccessibility to data, computing resources and results. The G-POD web portal is a flexible, secure, genericand distributed platform where the user can easily manage all its tasks. From the creation of a new task tothe result publication, passing by the data selection and the job monitoring, the user goes trough a friendlyand intuitive interface accessible from everywhere. The portal offers access to, and support for, science-orientedEarth Observation GRID services and applications, including access to a number of global geophysical ENVISATproducts. Globus and gLite is used as main target middleware.
1.1.4. EnginFrame. [9] (EF) is a web-based front-end for job submission, tracking and integrated datamanagement for HPC applications and other services. EnginFrame can be easily plugged on several differentscheduler or grid middleware like: Platform LSF, Sun Grid Engine, PBS, gLite. Every service defined in theEF portal respects the JSR168 standard and can be exposed in any portlet container. EF is certified to becompliant with IBM WebSphere Enterprise Portal. Every service defined in the portal is automatically exposedtrough a WSDL interface so it can be accessed like a web-service application and comes with a J2EE API soyou can plug your java application to it. Can be linked with any authentication system (NIS, LDAP, ActiveDirectory, MyProxy). Authorization system decides which services the user is able to see and/or use. Portaladministrators can restrict the access to some applications to a defined class of users. Supports remote desktoptools like: Citrix metaFrame, IBM DCV, NoMachine’s NX, VNC.
License: EnginFrame uses a proprietary license.
1.2. Problem Description. The general problem solved within wow2green business experiment is pre-sented in this paragraph. This use case is just an illustration of how and where Vine Toolkit can be used. Thisarticle is focused mainly on Vine itself and only on the business logic layer without going into end user interfaceand functionality description.
Big companies consist of several units generating a variety of information sets and performing advancedcomputations. Workflow description offers an attractive approach to formally deal with complex processes. Un-fortunately, existing workflow solutions are mostly legacy systems which are difficult to integrate in dynamicallychanging business and IT environments. Grid computing offers flexible mechanisms to provide resources in theon-demand fashion. Wow2green system—called officially Flowify [10] which is based on the Vine Toolkit—is a
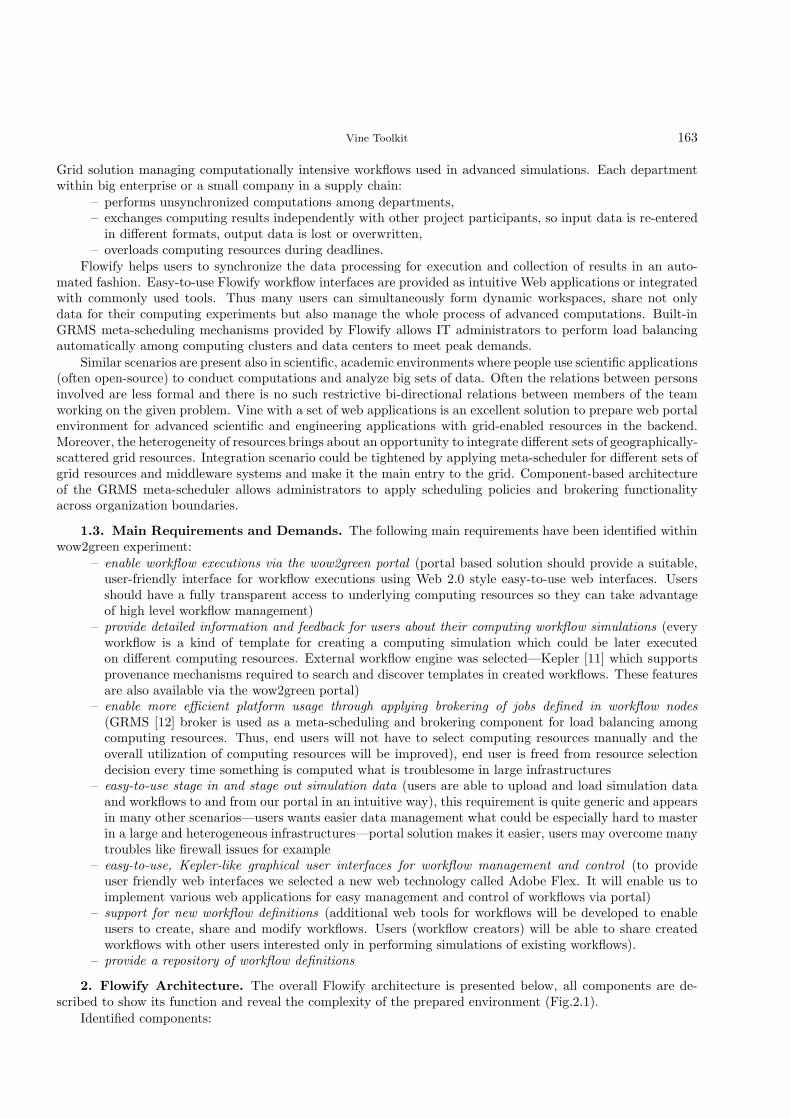
Vine Toolkit 163
Grid solution managing computationally intensive workflows used in advanced simulations. Each departmentwithin big enterprise or a small company in a supply chain:
– performs unsynchronized computations among departments,– exchanges computing results independently with other project participants, so input data is re-entered
in different formats, output data is lost or overwritten,– overloads computing resources during deadlines.
Flowify helps users to synchronize the data processing for execution and collection of results in an auto-mated fashion. Easy-to-use Flowify workflow interfaces are provided as intuitive Web applications or integratedwith commonly used tools. Thus many users can simultaneously form dynamic workspaces, share not onlydata for their computing experiments but also manage the whole process of advanced computations. Built-inGRMS meta-scheduling mechanisms provided by Flowify allows IT administrators to perform load balancingautomatically among computing clusters and data centers to meet peak demands.
Similar scenarios are present also in scientific, academic environments where people use scientific applications(often open-source) to conduct computations and analyze big sets of data. Often the relations between personsinvolved are less formal and there is no such restrictive bi-directional relations between members of the teamworking on the given problem. Vine with a set of web applications is an excellent solution to prepare web portalenvironment for advanced scientific and engineering applications with grid-enabled resources in the backend.Moreover, the heterogeneity of resources brings about an opportunity to integrate different sets of geographically-scattered grid resources. Integration scenario could be tightened by applying meta-scheduler for different sets ofgrid resources and middleware systems and make it the main entry to the grid. Component-based architectureof the GRMS meta-scheduler allows administrators to apply scheduling policies and brokering functionalityacross organization boundaries.
1.3. Main Requirements and Demands. The following main requirements have been identified withinwow2green experiment:
– enable workflow executions via the wow2green portal (portal based solution should provide a suitable,user-friendly interface for workflow executions using Web 2.0 style easy-to-use web interfaces. Usersshould have a fully transparent access to underlying computing resources so they can take advantageof high level workflow management)
– provide detailed information and feedback for users about their computing workflow simulations (everyworkflow is a kind of template for creating a computing simulation which could be later executedon different computing resources. External workflow engine was selected—Kepler [11] which supportsprovenance mechanisms required to search and discover templates in created workflows. These featuresare also available via the wow2green portal)
– enable more efficient platform usage through applying brokering of jobs defined in workflow nodes(GRMS [12] broker is used as a meta-scheduling and brokering component for load balancing amongcomputing resources. Thus, end users will not have to select computing resources manually and theoverall utilization of computing resources will be improved), end user is freed from resource selectiondecision every time something is computed what is troublesome in large infrastructures
– easy-to-use stage in and stage out simulation data (users are able to upload and load simulation dataand workflows to and from our portal in an intuitive way), this requirement is quite generic and appearsin many other scenarios—users wants easier data management what could be especially hard to masterin a large and heterogeneous infrastructures—portal solution makes it easier, users may overcome manytroubles like firewall issues for example
– easy-to-use, Kepler-like graphical user interfaces for workflow management and control (to provideuser friendly web interfaces we selected a new web technology called Adobe Flex. It will enable us toimplement various web applications for easy management and control of workflows via portal)
– support for new workflow definitions (additional web tools for workflows will be developed to enableusers to create, share and modify workflows. Users (workflow creators) will be able to share createdworkflows with other users interested only in performing simulations of existing workflows).
– provide a repository of workflow definitions
2. Flowify Architecture. The overall Flowify architecture is presented below, all components are de-scribed to show its function and reveal the complexity of the prepared environment (Fig.2.1).
Identified components:

164 D. Szejnfeld et al.
Fig. 2.1. Wow2greem system (Flowify) overall architecture.
– Gridsphere portal framework—portal framework that provides an open-source portlet based Web portal.GridSphere enables developers to quickly develop and package third-party portlet web applications thatcan be run and administered within the GridSphere portlet container. The wow2green portal is basedon this framework, production-ready portal for a larger community could be deployed on Liferay
– Vine Toolkit—used as business model layer within the portal, applications created for the scenario usesthe Vine mechanisms to interact with grid services and workflow engine, integrated Adobe Flex withBlazeDS technology allows creating advanced web applications. Vine Toolkit components used in portal:
o Workflow Manager—general component used to interact with different workflow management so-lutions through common API; in case of the wow2green solution kepler plugin was introduced
o Role Manager—role management component which allows administrators to manage role-basedaccess to GUI elements and accessible actions and also to define role-based access policies regardingdata managed through logical file manager component
o File Manager—File Manager component which allows for interacting with different data manage-ment systems by means of common API
o Portal Security Component—used for portal user certificates and proxies management, togetherwith the Certificates generation module allows for automatic certificate generation for registeredportal users
o Portal User Management—used for portal users management, user registration in the portal; to-gether with the MS Active Directory plugin it enables using existing users in the given organisationto make the integration easier with the existing IT environment (it is also possible to use someexisting LDAP service it desired)
– Vine web service—web service which exposes a subset of functionality of the Vine Toolkit componentto external systems/services—regarding Job and File Manager, the web service is used by Kepler actorsto interact with grid enabled resources
– Kepler workflow engine—core part of the Kepler/Ptolemy standalone application/framework for work-flow management, it is used in the wow2green solution as primary workflow management engine, keplerworkflow description called MOML is used within the system
– Kepler engine web service—the web service exposes the workflow engine functionality to external sys-tems/services, portal workflow manager component uses it as the workflow management service
– Set of kepler’s vine actors—base components of the workflows’ definitions to submit jobs and managedata through the Vine Toolkit service layer
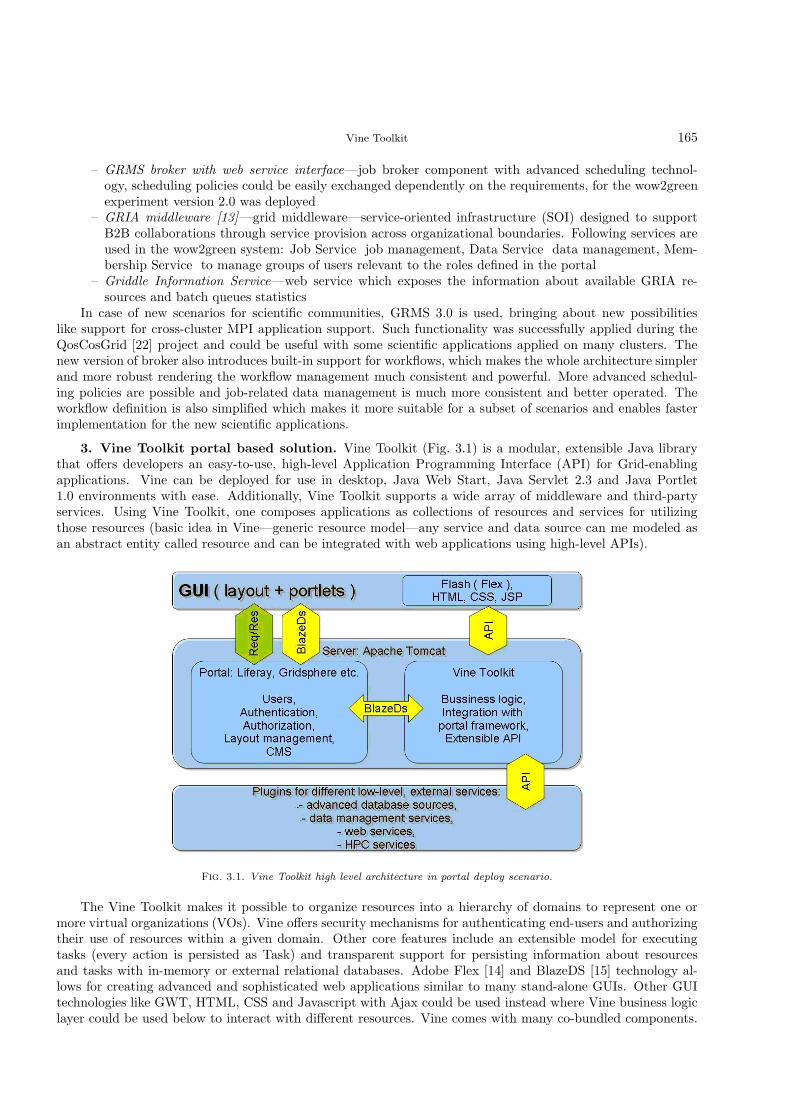
Vine Toolkit 165
– GRMS broker with web service interface—job broker component with advanced scheduling technol-ogy, scheduling policies could be easily exchanged dependently on the requirements, for the wow2greenexperiment version 2.0 was deployed
– GRIA middleware [13]—grid middleware—service-oriented infrastructure (SOI) designed to supportB2B collaborations through service provision across organizational boundaries. Following services areused in the wow2green system: Job Service job management, Data Service data management, Mem-bership Service to manage groups of users relevant to the roles defined in the portal
– Griddle Information Service—web service which exposes the information about available GRIA re-sources and batch queues statistics
In case of new scenarios for scientific communities, GRMS 3.0 is used, bringing about new possibilitieslike support for cross-cluster MPI application support. Such functionality was successfully applied during theQosCosGrid [22] project and could be useful with some scientific applications applied on many clusters. Thenew version of broker also introduces built-in support for workflows, which makes the whole architecture simplerand more robust rendering the workflow management much consistent and powerful. More advanced schedul-ing policies are possible and job-related data management is much more consistent and better operated. Theworkflow definition is also simplified which makes it more suitable for a subset of scenarios and enables fasterimplementation for the new scientific applications.
3. Vine Toolkit portal based solution. Vine Toolkit (Fig. 3.1) is a modular, extensible Java librarythat offers developers an easy-to-use, high-level Application Programming Interface (API) for Grid-enablingapplications. Vine can be deployed for use in desktop, Java Web Start, Java Servlet 2.3 and Java Portlet1.0 environments with ease. Additionally, Vine Toolkit supports a wide array of middleware and third-partyservices. Using Vine Toolkit, one composes applications as collections of resources and services for utilizingthose resources (basic idea in Vine—generic resource model—any service and data source can me modeled asan abstract entity called resource and can be integrated with web applications using high-level APIs).
Fig. 3.1. Vine Toolkit high level architecture in portal deploy scenario.
The Vine Toolkit makes it possible to organize resources into a hierarchy of domains to represent one ormore virtual organizations (VOs). Vine offers security mechanisms for authenticating end-users and authorizingtheir use of resources within a given domain. Other core features include an extensible model for executingtasks (every action is persisted as Task) and transparent support for persisting information about resourcesand tasks with in-memory or external relational databases. Adobe Flex [14] and BlazeDS [15] technology al-lows for creating advanced and sophisticated web applications similar to many stand-alone GUIs. Other GUItechnologies like GWT, HTML, CSS and Javascript with Ajax could be used instead where Vine business logiclayer could be used below to interact with different resources. Vine comes with many co-bundled components.

166 D. Szejnfeld et al.
There is a set of bundled components. User / Role / Application managers—administrative tools for usermanagement, their roles, application related right management for accessible methods of web applications, userlogin and user registration—it is module-based so the process could be extended and span any external service.like ldap or ms active directory and portal incorporates authenticated users automatically. Resource managerwhere the configuration of resources is accessible, could be displayed and changed by advanced users if desired.File browser component allows users to manage data on different data management servers and also portalfile system (PFS)—Vine provides such components to allow storing of users’ data in the portal. Job Managercomponent based on JSDL specification allows users to prepare JSDL based job description and submits jobs.Jobs are monitored and outputs could be retrieved later. Basic information about the job is also displayed.Different job managers are used here according to the installed and configured plugins. Credential managerallows for getting proxy credentials from MyProxy server configured for the portal. User is able also to add somemapping to his accounts for the accessible DN—so later it is possible to log in using MyProxy user account—single sign-on is possible then, proxy certificates are loaded automatically and user can use grid services directly.Resource browser is able to display information about grid resources—globus MDS services are used here—it isalso possible to show dynamic values such as free memory.
3.1. Workflow Engine Support. Vine Toolkit API has been enriched with the generic Workflow EngineAPI. It was created as a separate subproject which could be added as a feature during the portal installation.API reflects identified requirements regarding functionality used within end user web applications to manageusers’ workflows through the independent API. The following main functionality was included in the workflowsubmission interface: startWorkflow, stopWorkflow, pauseWorkflow, resumeWorkflow, terminateWorkflow, get-WorkflowOutputs, getWorkflowStatusById, createWorkflowSpec and beside this a set of support methods likegetWorkflowByTaskId to retrieve workflow instance from Vine using its task id. It allows quite simply add sup-port for different workflow engines if desired or required by some applications constraints. For the wow2greenexperiment Kepler engine was used as the primary workflow engine. The base API allows define so calledWorkflowDefinition which represents the workflow definition prepared as a XML string. In the case of Keplerengine MoML [16] based workflow description is used. Through the use of generic WorkflowDefinitionParame-ter a set of input parameters could be passed along with the workflow definition to the target workflow engineplugin. WorkflowManager component plays role of the generic workflow manager while the concrete instanceis created during workflow submission to the service deployed on the target host. Resources defined in theVine domain description (it is a resource registry in the given domain). Vine contains Kepler plugin projectwhich encapsulates the Kepler engine client to implement the generic Vine Workflow API. The figure 2.1 clearlyshows the connection from the portal to the Kepler Web Service it is another component which exposes thefunctionality of the Kepler workflow engine to the external clients acting as a workflow management service.The key point here are so called the Vine actors—small java classes which are in fact Vine Web Service clients.These “bricks” are used by the workflow designer to prepare workflow description to execute applications usinggrid resources and to acquire results of the computations. User is not aware where the computations takeplace—Vine Web Service by using grid services like GRMS which meta-scheduler and job broker—dispatchesthe jobs on the accessible grid environment. Vine is used here in different separate role in servlet mode to bea backed of the Vine Web Service and provide ease and unified access to different grid services like in this caseGRMS and GRIA. Such construction allows easily switch to different grid technology and reconfiguration ofthe whole environment to different middleware stack like Unicore 6 [17]. In case of new application scenariosand new GRMS 3.0 it is possible to use the broker directly regarding application workflows. New GRMS brokersupports DAG-based workflows, which are enough for most of the potential applications and possible depen-dencies between them. New project added to the Vine allows send XML-based GRMS workflows to the brokerservice. It gives a great opportunity for many scientists to connect their computing clusters on-demand to sharecomputing resources and run large-scale simulations reducing the execution time or dealing with much biggerproblem instances. Two parallel programming environments like OpenMPI and ProActive cover a wide rangeof programming languages, including Fortran, C/C++, Python (Open MPI) or Java (ProActive), thus can beeasily integrated with legacy code or naturally used as a communication layer among parallel processes andthreads. So by using GRMS workflow description with massive parallel applications could bring new possiblescenarios and even reduce potential costs of extending of the existing infrastructure. Resources could be sharedto run big parallel applications between different organizations.

Vine Toolkit 167
3.2. Uniform interface to HPC infrastructures. In order to provide end-users with transparent accessto resources, we developed a mechanism responsible for the management of uniform interfaces to diverse Gridmiddleware. Advanced classloader management mechanism enables dynamic loading of components that provideaccess to the functionality of specific Grid middleware through a uniform interface. These components are calledplug-ins in this context (and are realized as Vine subprojects with separate set of client jars). These uniforminterfaces are provided for such functionality like job submission, control, monitoring, data management, rolemanagement, user registration and authentication. They are based on standards where possible (e.g. JSDLfor job submission) and take into account both the gathered requirements and the functionality provided byGrid middleware deployed in HPC centers. The provided interface could be extended if needed of course. Suchflexibility is required as we use different workflow or single job xml descriptions regarding different workflowmanagement services like Kepler or GRMS. By extending WorkflowDefinition or JobSpec interfaces, developeris able to add support for other workflow or job descriptions. Thus many workflow or job management servicescould work at the same time hiding complexity of the grid infrastructure by web application unified GUIinterfaces.
3.2.1. Job Submission, Control and Monitoring (JSMC) Interface. One of the interfaces whichmakes use of the mechanism described above is the uniform interface for job submission functionality. It wasbased, firstly, on an analysis of the functionality of middleware systems and, secondly, on the Job SpecificationDescription Language (JSDL) [18] created by the JSDL working group at the Open Grid Forum [19]. JSDLspecifies different information required for successful application execution. One of the sub elements is appli-cation element which allows the user to specify the application to be executed on the Grid and the variousapplication parameters and arguments, including input and output files. Requirements element allows the userto specify different requirements needed for the execution of the job, such as amount of memory, number ofCPUs, etc. Data element allows the specification of input and output staging, in order for the user to optionallydefine which files should be copied to and / or from the working directory on the host where the job will beexecuted before job submission and / or after job completion respectively. The following main functionality wasincluded in the job submission interface: startJob, stopJob, getJobOutputs, getJobStatusById, createJobSpec andbeside this a bunch of support methods like getJobByTaskId to retrieve job instance from Vine using its taskid. Currently Vine supports such middleware like gLite 3.x [20] WmProxy and CREAM, Unicore 6 UnicoreXjob submission, Globus GT4 [21] WsGram, GRIA Job Service and recently QosCosGrid SMOA Computingand GRMS. Vine’s plugin management allows for simultaneous usage of different middleware technologies whatenables uniform access to the different HPC resources. In case of wow2grenn use case GRIA and GRMS Pluginswere used to access grid services. Another motivation beside seamless usage of different grid technologies wasease of configuration and possibility to switch on to different mieddleware stack without modifications to the de-veloped web applications (Vine plays role of the abstract access layer with well defined interface). JSMC servicepersists the information about all executed jobs along with all required details and the submitted specification.Monitoring data consists of job state history and basic information like start, finish time for example.
3.2.2. Data Management Interface. Another interface is the uniform interface for data managementfunctionality. It was based, first, on an analysis of the functionality of storage services of middleware systemstrying to find common API. The following main functionality was included in the data management interface:getHomeDirectory, createInputStream, createOutputStream, info, exists, list, goUpDirectory, changeDirectory,makeDirectory, copy, rename, move, delte, upload, download, createNativeURLString and beside this a bunch ofsupport methods like getDefaultFileManager to retrieve default data manager instance from Vine. CurrentlyVine supports such middleware like gLite 3.x SRM and LFC, Globus GridFTP, Unicore 6 Storage ManagementSystem (SMS), WebDAV, Storage Resource Broker (SRB), GRIA Data Service, HTTP. Vine’s plugin manage-ment allows to simultaneous usage of different storage technologies and copying data between them. In case ofwow2green use case GRIA Data Service and HTTP Data Service plugins were used to access grid services. Byusing Vine abstract layer the web applications could be written without taking into account different technolog-ical nuances. Vine also allows use different storage servers as uniform services making data management quiteeasy for the application developer. Vine is also shipped with the built-in Portal File System (PFS) which allowsstore portal end users files directly in the disk storage managed by the portal container. It is very convenientfor developers to expose data by using disposable links and store users configuration files and others close tothe portal instance. PFS is also used while downloading files from remote data storage systems. In conjunctionwith security related mechanisms and components Vine simplifies usage of different data management systems
168 D. Szejnfeld et al.
not only by unifying the API but also by covering the whole complexity related to the security issues. Vine alsodefines logical data management API which is similar to the physical one described earlier but has also supportfor meta data attributes, permissions related to files, multi-criteria file search related to meta data attributes,tags support. The logical data management API is used to organize users data and describe them with metadata attributes and tags. During the wow2green experiment all experiments results were stored and tagged inthe logical file system to facilitate searching for finished experiments and concrete results.
3.3. Security Issues. Vine can solve different security issues while accessing different grid services. Asignificant interoperability problem results from the differences in the security models of systems such as UNI-CORE or GRIA (where authentication is based on standard X.509 certificates) and Globus-based Grids (au-thentication based on GSI [23]). The main difference between these systems is that basic versions of UNI-CORE and GRIA do not support dynamic delegation while GSI-compliant systems do. Currently, to overcomethis problem, we allow a portal to authenticate on behalf of end-users. To do this, the portal signs a jobwith its own certificate and adds the distinguished name of the end-user before submitting the job to, forexample, a GRIA site. In case of Unicore Vine supports GSI-enabled extension for Unicore gateway whatenables to authenticate users by using proxy certificates. In case of gLite3 middleware voms proxy certifi-cate are created and used—Vine can be configured to support different voms servers and allow users inter-actions from different VO without any problem. Vine support MyProxy [24] server to provide true singlesign-on—during the user logging in to the portal proxy certificate is retrieved and used while accessing dif-ferent middleware services. In case of the wow2gren solution the GRIA middleware was used. So as men-tioned before portal common certificate was used to submit jobs (GSI is not supported). To distinguishusers so called GRIA policy rules are used to set job and data file owners by using users’ public certifi-cates and their distinguished names. One of the requirements of the experiment was to simplify the securitymanagement issues. So user certificates are maintained by the Vine-based portal integrated with CertificateAuthority—when user is registered for the first time, their certificate is generated and hold in the safe placeon the server. Later proxy certificates are used to interact with the grid middleware. Common portal cer-tificate is used to submit jobs to enable GRMS broker to manage them on behalf of users without the needto pass the private user’s key certificate. Vine supports all aspects of security-related issues and processes.Account creation allows automated, user-friendly user registration at the portal and to underlying Grid mid-dleware and third-party services used through the portal (registration modules are used to register new useraccounts in external services). User authentication allows the user to login into the portal and be authen-ticated, login portlet is shipped together with Vine and could be embedded in different portal frameworks.Single-Sign-On (SSO) management allows automated SSO user authentication in various Grid middleware andservices used through the portal. The user must have been previously registered in these external services.Authorization allows the administrator to access third-party authorization systems to change user permis-sions.
3.4. User Management. Common problem to solve while using different middleware infrastructures isuser management and account provision. Vine is able to register users in different middleware infrastructureslike gLite3, Unicore 6 or Globus GT4. Vine contains registration modules which allow register users on differentresources. Currently the following are provided: GridsphereRegistrationResource—allows adding new users toGridsphere portal, LiferayRegistrationResource—allows adding new users to Liferay portal, GssCertificateReg-istrationResource—creates x509 certificate and key pairs for new users, Gt4RegistrationResource—creates useraccounts on Globus Toolkit 4 host machine, GriaRegistrationResource—creates user accounts in Gria 5.3 TradeAccount Service, Unicore6RegistrationResource—creates user accounts on Unicore 6 XUUDB, DmsRegistra-tionResource—registers users on Data Management Service, VomsRegistrationResource—registers users to Vir-tual Organization Membership Service. Modular architecture and plugin management system allows easily plu-gin other registration modules if desired and extend Vine with new functionality. In case of wow2green use caseGssCertificateRegistrationResource, GridsphereRegistrationResource and DmsRegistrationResource were used togenerate users’ certificates, create portal accounts and logical file system DMS [25]. Vine also comes with bun-dled administrative web applications regarding user managamnet. One of them is UserRegistrationApp, whichallows create requests for new accounts in Vine. Another is UserManagementApp where administrator has gotoption for deactivate user account and edit user’s profile information.
3.5. Role Management. Vine also introduces role management mechanism to authorize users whiletaking different actions in the web applications. Roles are used in two scenarios—as roles at the portal level

Vine Toolkit 169
and middleware stack level. Roles at the portal level allow administrators to set permissions to access differentfunctionality in the web applications based on Vine. Administrator is able to set permissions for roles to differentpart of application and distinguish users regarding their possible scope of actions. Roles at the middleware stackare used to set access permissions regarding jobs and data files at the storage services. For the wow2green use caseGriaRoleResource, DmsRoleResource were implemented. Thus the roles created in the portal are propagatedto the middleware stack—in this case of GRIA. The end user interface allows share data for the selected roles.Such action is propagated to the middleware resources and could be used later while accessing remote storageby using given role name. Such approach makes permission management much simpler and does not multiplyremote policies for every user of the system—it is enough to assign policy for some role and assign an user tothe given role at the target system. Of course it is applicable only on middleware system which supports rolesmanagement like GRIA or DMS logical file system.
4. Towards production quality portals. Vine integrates with different portal frameworks and properone should be used to provide production quality of the final solution.
Fig. 4.1. Vine Toolkit integrated with Liferay portal framework.
4.1. Liferay as a primary solution for the production quality portal. Vine was initially designedto work with Gridsphere portlet container. The reason for that was Gridsphere’s open source nature and itstarget community—mainly scientists dealing with High Performance Computing problems. It was good startingpoint but after a few years it became obvious that concurrent solutions need to be taken into account as well.After analysis and evaluation of possible options a decision has been made to create a Liferay integrationthread. Liferay is a modern approach to create complex web portals. It supports many standards for contentpresentation and management. It is integrated with various application containers, database systems and hasmodular structure with well designed API allowing creation of custom extensions and integration with thirdparty software.
4.2. Vine Toolkit integration with Liferay. Vine is designed with its modular structure in mind. Ithas several places—hooks providing easy adaptation to the external environment. Integration with the portalacting as a portlet container is conducted on several levels. The most important are:

170 D. Szejnfeld et al.
4.2.1. Build system.o Flex sources compilation for the Liferay context path. Every flex component needs to establish com-
munication with BlazeDS backend server. As for that a context path must be compiled into the specificcomponent. Vine’s build system takes care of that task and simply prepares a version of componentspecific to the destination portal environment.
o New deployment routines including modification of portal configuration. Vine Toolkit deployed inthe application container acts as complex web application. Mainly due to its advanced class loaderspreventing from the conflict of jars it has to be deployed in a specific way. Vine’s build system isresponsible for the proper jar distribution, replacing specific tokens in the deployment descriptors,altering portal layouts etc.
o New installers designed for Liferay portal. To shorten the learning curve for new users, new installershave been introduced. They are general examples of proper configuration both Vine Toolkit along withits basic services and Liferay environment. Thanks to that user is able to startup and test new portalwithout any advanced configuration actions.
4.2.2. Integration with Liferay services.o Authentication/password policies. Integration with the parent authentication and password policies is
a crucial task to provide synchronization of applications’ state between portal and Vine. Appropriateplugins have been developed specifically for Liferay which provide seamless authentication of user againstLiferay and Vine.
o User management. Vine has its own user registry to enable Vine’s deployment to various destinationenvironments. In the portal integration scenario Vine has to integrate and synchronize with the existingportal users. To accomplish that RegistrationModule plugins are used. LiferayRegistrationModule pluginis provided for adding/editing/deleting portal users.
o Applications management. Vine components are accessible as portlet applications from the Liferayperspective. They are fully manageable with no difference to the ordinary portlets. On top of that itis possible to put more control over Vine applications via Vine Toolkit administration interfaces. Theyprovide advanced management actions for all Vine components, i. e. enabling/disabling certain featuresin specific applications, granting/revoking special permissions to them etc.
o JSR 168 compliant renderer for Vine components within Liferay portlets. Vine uses portlet componentto render Flex components. In that way it preserves internal components integrity and make Vineapplications independent from the external portal. As an output a html wrapper code is generatedwith a reference to the Vine Flex object inside.
4.3. Future plans for enhancing user experience using portal.o Introducing web messaging based on BlazeDs/Flex technologies to greatly improve applications func-
tionality.Currently the primary way of communication in Vine GUI is remoting based on BlazeDs/Flex implemen-tation. It provides efficient and responsive link between the client and server side. In Vine Toolkit theModel View Controller design pattern has been implemented enabling reuse of business logic with differentpresentation layers and leaving a place for future GUI mechanisms evolution. The next enhancement willbe adding web messaging as an alternate way of communication between the server and client side. It en-ables server to trigger notification of state’s change directly to the registered client interfaces. It will en-able developers to design new components, for instance, a status monitoring applications with great ease.Until now they had to implement a querying mechanism on the client side to ask for the updated modelconstantly. With the web messaging a business logic on the server side will trigger notifications only ifits state has changed. That will result in more efficient and sophisticated applications delivered to endusers.
o Integration with Liferay Collaboration Suite package.Liferay Collaboration Suite is a set of web applications, collaboration tools that come boundled with Liferayportal framework. The set of applications consists of blogs, message boards, instant messenger, shared calendar,address book, mail client, RSS client, Wikis, meta-tagging support. The main interest here is to idea of sharingexperiments results form executed jobs and workflows by the Vine management engine and files stored in aportal file system with other portal users. Integration will be achieved by development of dedicated pluginswhich will communicate with Liferay API. This approach will enable all applications using File Manager with
Vine Toolkit 171
seamless integration with Liferay Collaboration Suite with respect to security policies expressed by Liferay.First stage of integration, includes sharing data with wikis and message boards.
5. Next step—nanotechnology support portal. Currently our main focus is on the web applicationlevel scenarios and domain specific scientific and engineering applications. The idea is to prepare portal-basedsolution for the nanotechnology community to take advantage from nanotechnology related scientific applicationran in a large Polish grid infrastructure under the Pl-Grid project umbrella. Initial plan is to start with thesupport for open source nanotechnology applications like Abinit and Fireball. The basic functionality foreseenis to simplify application every day usage by applying graphical interface, identify possible scientific use casesand propose different GUI layout. Another important thing is to prepare workflow definitions where the rawresults will be transformed and prepared for further analysis—automation of many steps usually done manuallywill speed up work and allow to focus on the given problem. Advanced problems also require parametersweep parameters what is especially useful in case of preparing big set of potential experiments varying onlyby some parameter value. The intermediate results from the given experiment and also from parameter swepsteps will be used to prepare and show graphical plot of different physical values almost in a real time. Enduser will be able to control current execution and make possible decision to break the process for example.GMRS v3.0 meta-scheduler and broker plays here significant role as it supports workflows, parameter sweepand cross cluster job execution. Advanced data management features make possible to extract intermediatedata during job execution. Extracted data will be used not only to prepare 2D plot display but also to prepare3D visualization of the molecules structures. 3D visualization thread was started to prepare web based withlatest web standards like HTML5 and WebGL. Portal solution will bring up the desktop application and strongcollaboration environment for the whole domain specific community allowing to interact between geographicallyseparated scientists.
6. Conclusions. In this paper we presented Vine Toolkit as universal framework to build complete websolutions to interact with different services and technologies (among others different grid middleware stacks)by means of uniform, easy API. Integration with production quality portal frameworks like Liferay opens newopportunities for creating production-ready portal environments directed for large communities. The genericarchitecture of the Vine Toolkit was presented. We also included some requirements and initial ideas for thewow2green business experiment as illustration of Vine application in a real, practical use case. Vine allowssubmit jobs to different middleware stacks through a uniform user interface. In similar way uniform APIfor workflow management, data management, user authentication, role and user management are provided.Resource based model allows straightforward service support and configuration by uniform way regardless ofthe target technology. Security issues which always occur while accessing different middleware stacks are solvedby using Vine registration, authorization modules and proxy certificates support. Role management mechanismallows administrators and end users to easily manage permissions in the applications and easy grant permissionsto data files on the storage server if applicable. Beside simple jobs, whole workflows could be managed by theuniform workflow interface. Currently only the Kepler engine is supported but it could be easily extended byadding another workflow engine plugin. Vine Toolkit could be used as framework for building advanced webapplications for example with use of Adobe Flex technology as well as business logic provider for advanced webservice solutions. Prospective application scenario related with nanotechnology science will be beneficial for thescientists who want to focus on the concrete problems and large grid infrastructure exploitation. The on-goingproject will enrich our experience regarding generic scientific application support.
Acknowledgments. We are pleased to acknowledge support from the EU funded OMII-Europe and BE-inGRID projects and polish infrastructural project PL-Grid.
REFERENCES
[1] Vine Toolkit web site http://vinetoolkit.org/
[2] OMII-Europe project http://www.omii-europe.com/
[3] BEinGRID project http://www.beingrid.eu/
[4] PL-Grid project http://www.plgrid.pl/en
[5] Wow2green business experiment http://www.beingrid.eu/wow2green.html, http://www.it-tude.com/wow2green_sol.html
[6] P-GRADE http://www.p-grade.hu/
[7] G-POD http://gpod.eo.esa.int/index.asp
[8] myExperiment.org http://www.myexperiment.org/, http://wiki.myexperiment.org/index.php/Main_Page

172 D. Szejnfeld et al.
[9] EnginFrame http://www.enginframe.com/
[10] Flowify http://www.flowify.org/
[11] Kepler https://kepler-project.org/
[12] GRMS http://www.gridge.org/content/view/18/99/
[13] GRIA http://www.gria.org/about-gria/overview
[14] Adobe Flex http://www.adobe.com/products/flex/
[15] Adobe BlazeDS http://opensource.adobe.com/wiki/display/blazeds/BlazeDS/
[16] MoML language specification http://ptolemy.eecs.berkeley.edu/publications/papers/00/moml/moml_erl_memo.pdf
[17] Unicore 6 http://www.unicore.eu/
[18] JSDL http://www.ogf.org/documents/GFD.56.pdf
[19] Open Grid Forum (OGF) http://www.gridforum.org/
[20] gLite 3.x http://glite.web.cern.ch/glite/default.asp
[21] Globus GT4 http://www.globus.org/toolkit/
[22] QosCosGrid http://node2.qoscosgrid.man.poznan.pl/gridsphere/gridsphere
[23] Grid Security Infrastructure (GSI) http://www.globus.org/security/overview.html
[24] MyProxy http://grid.ncsa.illinois.edu/myproxy/
[25] Data Management System (DMS) http://dms.progress.psnc.pl/
[26] Liferay http://www.liferay.com/
[27] Dawid Szejnfeld, Piotr Domagalski, Piotr Dziubecki, Piotr Kopta, Michal Krysinski, Tomasz Kuczynski,Krzysztof Kurowski, Bogdan Ludwiczak, Jaroslaw Nabrzyski, Tomasz Piontek, Dominik Tarnawczyk,Krzysztof Witkowski, Malgorzata Wolniewicz, Vine Toolkit—Grid-enabled Portal Solution for Community DrivenComputing Workflows with Meta-scheduling Capabilities, PPAM 2009.
[28] GridSphere http://www.gridsphere.org/
Edited by: Marcin PaprzyckiReceived: April 10, 2010Accepted: June 21, 2010
Scalable Computing: Practice and ExperienceVolume 11, Number 2, pp. 173–188. http://www.scpe.org
ISSN 1895-1767c© 2010 SCPE
FAST MULTI-OBJECTIVE RESCHEDULING OF WORKFLOWS TO CONSTRAINEDRESOURCES USING HEURISTICS AND MEMETIC EVOLUTION
WILFRIED JAKOB, FLORIAN MOSER, ALEXANDER QUINTE, KARL-UWE STUCKY AND WOLFGANG SUß∗
Abstract. Scheduling of jobs organized in workflows to a computational grid is a permanent process due to the dynamicnature of the grid and the frequent arrival of new jobs. Thus, a permanent rescheduling of already planned and new jobs must beperformed. This paper will continue and extend previous work, which focused on the tuning of our Global Optimising ResourceBroker and Allocator GORBA in a static planning environment. A formal definition of the scheduling problem and a classificationwill be given. New heuristics for rescheduling based on the “old plan” will be introduced and it will be investigated how theycontribute to the overall planning process. As an extension to the work published in [22] a simple local search is added to the basicEvolutionary Algorithm (EA) of GORBA and it is examined, whether and how the resulting Memetic Algorithm improves theresults within the limited time frame of three minutes available for planning. Furthermore, the maximal possible load, which canbe handled within the given planning time, will be examined for a grid of growing size of up to 7000 grid jobs and 700 resources.
Key words: scheduling, multi-objective optimisation, evolutionary algorithms, memetic algorithms, benchmarks, heuristics,computational grid, restricted resources
1. Introduction. A computational grid can be regarded as a virtualised and distributed computing centre[11]. Users describe their application jobs, consisting of one or more elementary grid jobs, by workflows, each ofwhich may be regarded a directed acyclic graph defining precedence rules between the grid jobs. The users statewhich resources like software, data storage, or computing power are needed to fulfil their grid jobs. Resourcesmay need other ones. A software tool, for instance, may require a certain operating system and appropriatecomputer hardware to run on. This leads to the concept of co-allocation of resources. Furthermore, userswill give due dates, cost budgets and may express a preference for cheap or fast execution [20]. For planning,execution times of the grid jobs are needed. In case of entirely new jobs, this can be done by estimations or bythe use of prediction systems only. Otherwise, values coming from experience can be used. The grid middlewareis expected to support this by providing runtimes and adding them to the workflow for further usage. Accordingto the policy of their owners, resources are offered at different costs depending on e.g. time of day or day of theweek and their usage may be restricted to certain times. In addition, heterogeneous resources usually differ inperformance as well as cost-performance ratios.
To fulfil the different needs of resource users and providers, the following four objectives are considered:completion time and costs of each application job measured as fulfilment of user-given limits and averaged, andto meet the demands of resource providers, the total makespan of all application jobs and the ratio of resourceutilisation. Some of these criteria like costs and time are obviously conflicting.
As grid jobs are assumed to require computing time in the magnitude of several minutes at the minimum, acertain but limited time frame for planning is available. A time limit of three minutes was regarded reasonablefor planning. All grid jobs, which will be started within this time slot according to the old schedule, are regardedfixed jobs and will not become subject of rescheduling.
This paper extends work on rescheduling published at the PPAM 2009 conference [22] by adding two leftout benchmark scenarios for the investigation of increasing workload. Furthermore, a simple heuristic searchmechanism is introduced and incorporated in the basic EA of GORBA in such a way that it improves generatedoffspring. Thus, the EA is turned into a Memetic Algorithm (MA), an algorithm class, which has alreadyproven its superiority to pure EA in various domains [25, 23, 15, 16, 29, 2]. The investigation presented in[22] is enhanced in this paper by the assessment of the new Memetic Algorithm and its comparison to the EAresults. The main problem of creating a Memetic Algorithm is the definition of suited local searchers for thetask on hand. We will come back to this in §3.
In §2 a formal definition of the problem, a classification, and a comparison with other scheduling taskswill be given. The section ends with a discussion of related work. Section 3 will describe the used algorithms,especially the new heuristics and the new local searcher, and give a summary of the work carried out so far.The results of the experiments for assessing the effect of the new rescheduling heuristics will be presented in§4, which will also report about first investigations regarding the maximum possible load for a grid, the size of
∗Karlsruhe Institute of Technology (KIT), Institute for Applied Computer Science, Hermann-von-Helmholtz-Platz 1, 76344Eggenstein-Leopoldshafen, Germany, {wilfried.jakob, florian.moeser, alexander.quinte, uwe.stucky, wolfgang.suess}@kit.edu
173

174 Wilfried Jakob, Florian Moser, Alexander Quinte, Karl-Uwe Stucky and Wolfgang Suß
which is growing proportionally to the amount of grid jobs. In §5 a summary and outlook to future researchwill be provided.
2. Problem Definition and Classification. A notation common to scheduling literature [6, 7] is usedto facilitate comparisons with other scheduling problems. Given are a set M = {M1, . . . ,Mm} of resources, aset J = {J1, . . . , Jl} of application jobs, and a set O of grid jobs. The ni grid jobs of application job Ji aredenoted Oi1, . . . , Oini
. The following functions are given:(i) a precedence function p : O ×O → {TRUE,FALSE} for the grid jobs
(ii) an assignment function µ : O → P(P(M)) from grid jobs to resource sets. P(M) is the power set ofM . µij is the set of all possible combinations of resources from M , which together are able to perform the gridjob Oij
(iii) a function t : O × P(M) → R, which gives for every grid job Oij the time needed for the processingon a resource set Rij ∈ µij
(iv) a cost function, c : R × P(M) → R, which gives for every time z ∈ R the costs per time unit of thegiven resource set
Optimisation is done by choosing suitable start times s(Oij) ∈ R and resource allocations Rij ∈ µij . Asolution is valid, if the following two restrictions are met:
1. All grid jobs are planned and resources are allocated exclusively:
∀Oij : ∃s(Oij) ∈ R, Rij ∈ µij : ∀Mj ∈ Rij :(2.1)
Mj is in [s(Oij); s(Oij) + t(Oij , Rij)] exclusively allocated by Oij .
2. Precedence relations are adhered to:
∀i, j 6= k : p(Oij , Oik) ⇒ s(Oik) ≥ s(Oij) + t(Oij , Rij) (2.2)
A violation of the two following soft constraints is treated by penalty functions in such a way that theamount of time and cost overruns is considered as well as the number of application jobs affected.
1. All application jobs Ji have a cost limit ci, which must be observed:
∀Ji : ci ≥
ni∑
j=1
s(Oij)+t(Oij ,Rij)∫
s(Oij)
c(z,Rij)dz (2.3)
2. All application jobs Ji have due dates di, which must be adhered to:
∀Ji : di ≥ s(Oini) + t(Oini
, Rini) where Oini
is the last grid job of Ji (2.4)
The fitness calculation is based on the above-mentioned four objectives and a auxiliary objective. It measuresthe average delay of each non-terminal grid job (i. e. a grid job with no successors) relative to the earliest startingtime of its application job and it is aimed at rewarding the earlier completion of non-terminal grid jobs. Theidea is to support the process of starting grid jobs earlier, such that the final grid job can be completed earlierin the end, which is recognised by the main objective completion time. Lower and upper estimations for costsand processing times are calculated in the first planning stage of GORBA, which will be described in the nextsection. Except for the utilisation rate, the value criti,val of every criterioni is calculated relative to these limitsbased on the actual value criterioni,act as follows:
criti,val =criterioni,act − criterioni,min
criterioni,max − criterioni,min
(2.5)
This makes the single values criti,val independent of the task on hand and results in a percentage-like range.These values are weighted and summed up, which yields the raw fitness. To avoid unwanted compensation effects,the criteria are sorted singly or in groups according to priorities. The criteria of the highest priority alwayscontribute to the sum, while the others are added, if all criteria of the next higher priority fulfil a given thresholdvalue. Weights and priorities are based on experience and aimed at reaching a fair compromise between users

Fast Multi-obj. Rescheduling of Workflows to Constr. Res. Using Heur. and Memetic Evol. 175
and resource providers. The tuning of the suggested adjustment is left to the system administrator. If the twosoft constraints are violated, the raw fitness is lowered to the end fitness by a multiplication by the correspondingpenalty function, each of which delivers a factor between 0 and 1. Otherwise, end fitness and raw fitness areidentical.
Generalising, this task contains the job shop scheduling problem as a special case. The extensions are co-allocation of heterogeneous and alternative resources of different performances and time-dependent availabilityand costs, earliest start times and due dates, parallel execution of grid jobs, and more than one objective. Asour task includes the job shop problem, it is NP-complete. For this reason and because of the three minutesruntime limit, approximated solutions can be expected only.
A comparable problem could not be found in literature, see e.g. [6] and [7] for a comprehensive presentationof scheduling problems. This corresponds to the results of the literature review found in [32]. There, it isconcluded that only few publications deal with multiple objectives in scheduling and, if so, they mostly dealwith single machine problems. Within the grid domain some papers dealing with multi-criteria optimisationwere published recently. In [35] it is reported that most of them deal with two criteria, like e.g. [10], and thatin most cases only one criterion is really optimised while the other serves as a constraint, see e.g. [31, 37]. Theapproach from [37] uses matrix-like chromosomes, which is probably the reason why they can handle about30 jobs within one hour only. Kurowski et al. [24] use a modified version of the weighted sum for a realmulti-criteria optimisation, but do not handle workflows. The same holds for Xhafa et al. [36], who use twocriteria, makespan and average flow time. They can be regarded as less conflicting as time and costs, which areobviously contradicting goals. Their approach and ours have the following points in common: The usage of aMemetic Algorithm, a structured population, the concept of fast and permanent replanning, and experimentsbased on workloads and ressource pools of comparable sizes. One difference regarding both, EA and MA, isthat we use much more heuristics for seeding the initial population and for resource allocation. In [20] we haveshown that heuristic resource selection outperforms its evolutionary counterpart if the runtime for planning isstrictly limited. GLEAM uses a structured population based on the diffusion model since the early 90’s, see[13, 14, 19, 18]. Regarding the balance between exploration and exploitation it has properties comparable to thecellular approach used by Xhafa et al. But cellular neighbourhoods are harder to control and to adjust (cf. [36])than the ring structure we use. The latter needs only one parameter to steer the ratio between explorationand exploitation and this is the neighbourhood size. The cellular approach allows the genetic information tospread in two dimensions, which requires smaller neighbourhood sizes, as also Xhafa et al. observed in theirexperiments [36]. Assuming the same populaton size and a comparable slow loss of genotypic diversity duringthe course of evolution the ring topology allows larger neighbourhoods and thereby the establishment of betterelaborated niches of individuals. This and the simpler control ability can be regarded as advantages and arearguments in favour for our continuing usage of the ring based diffusion model introduced by Gorges-Schleuter20 years ago [13, 14].
Summarising, beside the work of Xhafa et al. [36] we did not find any report about a comparable amountof resources and grid jobs organised in workflows and subject to a global multi-criteria optimisation. Of course,a lot of publications focus on partial aspects of this problem. For instance, the well-known Giffler-Thompsonalgorithm [12, 28] was extended to the given problem, but surprisingly produced inferior results than ourheuristics [20] described below.
3. Algorithms of GORBA and Results from the Tuning Phase. GORBA [21, 20, 22] uses advancedreservations and is based on Globus toolkit 4 at present. It executes a two-stage planning process. In thefirst stage the data of new application jobs are checked for plausibility and a set of heuristics is applied thatimmediately delivers first estimations of costs and completion times. These results are also used to seed thestart population of the subsequent run of the Evolutionary Algorithm GLEAM (Global Learning EvolutionaryAlgorithm and Method) [4, 5].
Firstly, the old heuristics used for the tuning of GORBA reported in [33, 20] are described, followed by thenew ones for rescheduling. This is followed by a short introduction of GLEAM and a description of the localsearch procedure and the adaptive mechanism of its application as a meme of GLEAM.
3.1. Heuristics for Planning and Replanning. In a first step a sequence of grid jobs is produced bythe following three heuristic rules taking the precedence rules into account:
1. Shortest due time: grid jobs of the application job with the shortest due time first2. Shortest working time of grid job: grid jobs with the shortest working time first

176 Wilfried Jakob, Florian Moser, Alexander Quinte, Karl-Uwe Stucky and Wolfgang Suß
3. Shortest working time of application job: grid jobs of the application job with the shortest workingtime first
In the next step resources are allocated to the grid jobs using one of the following three resource allocationstrategies (RAS):
RAS-1: Use the fastest of the earliest available resources for all grid jobsRAS-2: Use the cheapest of the earliest available resources for all grid jobsRAS-3: Use RAS-1 or RAS-2 for all grid jobs of an application job according to its time/cost preference
As every RAS is applied to each grid job sequence, nine schedules are generated, from which the bestone is selected as result. These heuristics are rather simple and, therefore, more sophisticated ones have beeninvestigated. Among them, such well-known ones like the Giffler Thompson Algorithm [12, 28], Tabu Search [3],Shifting Bottleneck [1, 8], and GRASP (Greedy Randomised Adaptive Search Procedure) [30]. To our surprise,they all performed inferior to our best heuristic, which is based on shortest working time of application job[20, 27]. Thus, the first planning phase is still based on the three first heuristics, which can be used for bothcreating a new schedule and replanning an already started one. In the latter case the information of the oldplan is ignored, of course.
3.2. New Replanning Heuristics. The new heuristics tailored to the replanning situation use the gridjob sequence of the old plan for grid jobs, which are subject to rescheduling, i. e. all grid jobs which havenot already been started or will be started within the three minutes time frame. The new grid jobs are sortedaccording to one of the three heuristic rules already described and added to the sequence of old jobs, yieldingthree different sequences. Resources are allocated using the three RAS and again, nine more schedules aregenerated, but this time based on the old plan. The best of these eighteen schedules is the final result of thefirst planning stage, while all are used to seed the subsequent EA run of the second stage.
3.3. Evolutionary Search. The EA GLEAM already contains some evolutionary operators designed forcombinatorial problems. They are summarised here only, due to the lack of space, and the interested readeris referred to [4, 5]. A chromosome consists of a sequence of segments, containing a sequence of genes, whosestructure is defined by their associated problem-configurable gene types. The definition of a gene type constitutesits set of real, integer, or Boolean parameters together with their ranges of values. The latter are observed bythe standard genetic operators of GLEAM so that explicit constraints of parameters are always met. For theproblem in hand there are two basic gene types, the grid job genes and the RAS-gene described later. Eachgrid job gene consists of a grid job identifier (id in figure 3.1), represents a grid job, and has no parameters.The gene sequence is important, as it determines the scheduling sequence described later. Apart from thestandard mutation, which changes the sequence of genes by simply shifting one of them, GLEAM containsgenetic operators for arbitrary movements of gene segments and for the inversion of their internal order. Assegment boundaries can be changed by some mutations, the segments form an evolvable meta structure overthe chromosomes. Segment boundaries are also used for the standard 1- and n-point crossover operators, whichinclude a genetic repair that ensures that no offspring lacks genes in the end. The evolvable segmentation andthe problem-configurable gene types as well as their associated operators among others distinguish GLEAMfrom most standard EAs.
Figure 3.1 illustrates the coding by an example consisting of two simple application jobs or workflows, onecontaining five grid jobs and the other two. The grid jobs of all workflows are labeled by distinct identifiers id :
1 ≤ id ≤ n =
l∑
l=1
ni (3.1)
Besides the grid job genes, each chromosome contains a special additional gene for the selection of theRAS, the so called RAS-gene. It has one integer parameter, the ras-id : 1 ≤ ras-id ≤ 3. This is the onlyparameterised gene in this coding and thus, the only one which can undergo parameter mutation (in this case auniform mutation). The position of the RAS-gene has no significance for the interpretation of the chromosome.
A schedule is constructed from the grid job genes in the sequence of their position within the chromosomeas follows:

Fast Multi-obj. Rescheduling of Workflows to Constr. Res. Using Heur. and Memetic Evol. 177
Fig. 3.1. Example of a scheduling task consisting of two simple workflows and a chromosome representing a legal schedule.It is legal because there is no gene representing a direct predecessor of a grid job, which is located after the gene of that grid job.Thus, all precedence rules will be observed. The example chromosome consists of three segments, the role of which during evolutionis described in the text. The parameter part of the RAS-gene is marked by a white background.
Step 1: The earliest start time of a grid job is either the earliest start time of its application job or thelatest end time of its predecessors, if any.
Step 2: According to the RAS selected by the RAS-gene, a list of alternatives is produced for every primaryresource.
Step 3: Beginning with the first resources of the lists, the duration of the job is calculated and it is searchedfor a free time slot for the primary resource and its depending ones, beginning at the earliest starttime of step 1. If no suitable slot is found, the resources at the next position of the lists are used.
Step 4: The resources found are allocated to the grid job with the calculated time frame.
The example chromosome shown in figure 3.1 is a legal solution, as all grid jobs are scheduled in such away that no job is scheduled before its predecessor. In this case the described scheduling mechanism ensuresthat the precedence rules are adhered to. Alternatively, a phenotypic repair is performed, which is describedand assessed in detail in [33, 20]. It retains all grid jobs with missing predecessors from beeing scheduled untiltheir predecessors are scheduled.
3.4. Memetic Search. The basic idea of a Memetic Algorithm is to mimic the learning capability ofindividuals in nature by an improvement procedure, usually in the form of some local or heuristic search appliedto the offspring. This type of enhanced EA is called Memetic Algorithm, a term coined by Moscato [26]. For theproblem on hand, the multi-objective nature of the fitness function makes it hard, if not impossible to define alocal searcher (LS), for which local assessment is sufficient. This is, because it is hard to decide whether a smalllocal change of e.g. a job sequence is an improvement or not without setting up the complete allocation matrix.For the travelling salesman problem, for instance, which is a common benchmark task for combinatorial optimi-sation, it is easy to judge whether the swapping of two cities, for example, yields a better result or not. Conse-quently, we have dropped this desirable property of local assessment and now accept the necessity of elaboratingthe entire schedule to evaluate a change. The first result is the local searcher described at the end of this section.
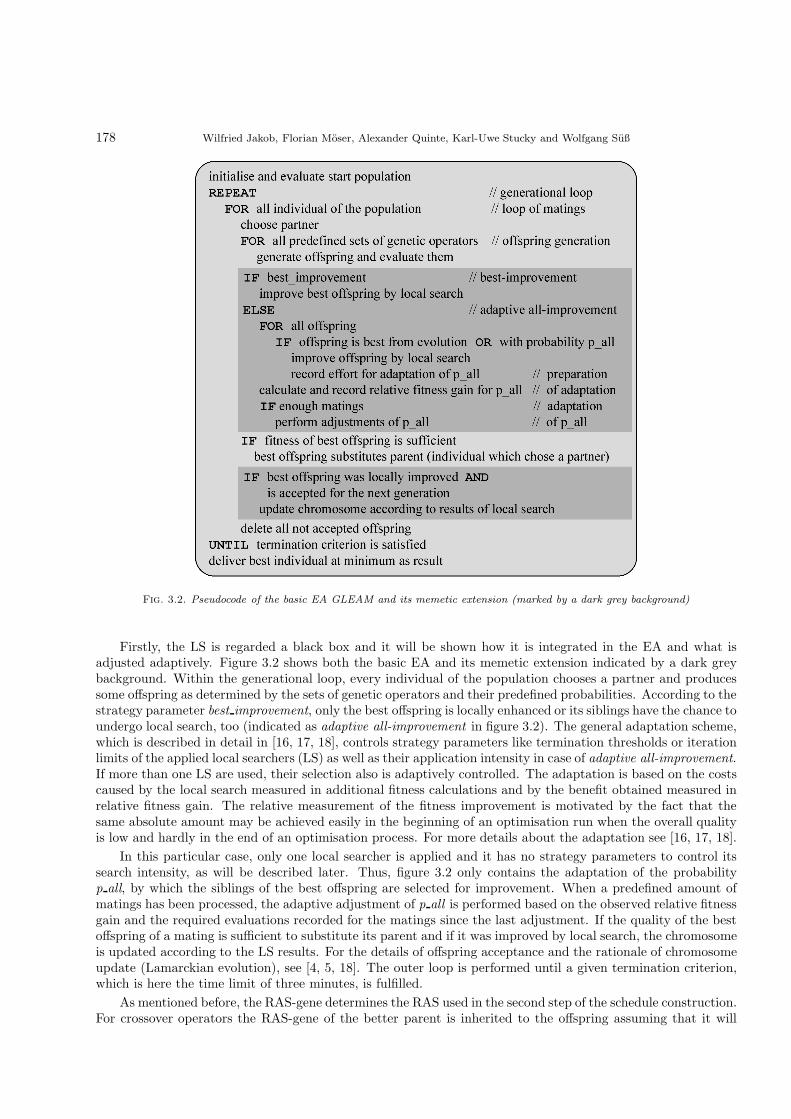
178 Wilfried Jakob, Florian Moser, Alexander Quinte, Karl-Uwe Stucky and Wolfgang Suß
Fig. 3.2. Pseudocode of the basic EA GLEAM and its memetic extension (marked by a dark grey background)
Firstly, the LS is regarded a black box and it will be shown how it is integrated in the EA and what isadjusted adaptively. Figure 3.2 shows both the basic EA and its memetic extension indicated by a dark greybackground. Within the generational loop, every individual of the population chooses a partner and producessome offspring as determined by the sets of genetic operators and their predefined probabilities. According to thestrategy parameter best improvement, only the best offspring is locally enhanced or its siblings have the chance toundergo local search, too (indicated as adaptive all-improvement in figure 3.2). The general adaptation scheme,which is described in detail in [16, 17, 18], controls strategy parameters like termination thresholds or iterationlimits of the applied local searchers (LS) as well as their application intensity in case of adaptive all-improvement.If more than one LS are used, their selection also is adaptively controlled. The adaptation is based on the costscaused by the local search measured in additional fitness calculations and by the benefit obtained measured inrelative fitness gain. The relative measurement of the fitness improvement is motivated by the fact that thesame absolute amount may be achieved easily in the beginning of an optimisation run when the overall qualityis low and hardly in the end of an optimisation process. For more details about the adaptation see [16, 17, 18].
In this particular case, only one local searcher is applied and it has no strategy parameters to control itssearch intensity, as will be described later. Thus, figure 3.2 only contains the adaptation of the probabilityp all, by which the siblings of the best offspring are selected for improvement. When a predefined amount ofmatings has been processed, the adaptive adjustment of p all is performed based on the observed relative fitnessgain and the required evaluations recorded for the matings since the last adjustment. If the quality of the bestoffspring of a mating is sufficient to substitute its parent and if it was improved by local search, the chromosomeis updated according to the LS results. For the details of offspring acceptance and the rationale of chromosomeupdate (Lamarckian evolution), see [4, 5, 18]. The outer loop is performed until a given termination criterion,which is here the time limit of three minutes, is fulfilled.
As mentioned before, the RAS-gene determines the RAS used in the second step of the schedule construction.For crossover operators the RAS-gene of the better parent is inherited to the offspring assuming that it will

Fast Multi-obj. Rescheduling of Workflows to Constr. Res. Using Heur. and Memetic Evol. 179
perform best for the new child. But what, if not? This question motivates a check-out of all reasonablealternatives in the form of a local search. Reasonable means in this context that alternative RAS are determinedfor testing based on the actual RAS and the properties of the associated schedule. If, for example, a scheduleis too costly and RAS-2 preferring cheap resources was used for its construction, only RAS-3 may performbetter. If fast resources were preferred (RAS-1) both other RAS may yield better results. All other situationsare treated accordingly.
Due to the fact that this simple local search procedure does not possess any parameters to control its searchintensity, the adaptation of the Simple Adaptive Memetic Algorithm (ASMA) is limited to the adjustment ofits adaptive all-improvement part. As pointed out in [16, 18], this type of Memetic Algorithm is called simple,because it works with one meme or local searcher only.
3.5. Benchmarks and Results from Earlier Investigations. In a first development phase of GORBAthe incorporated algorithms were tested and tuned using our standard benchmark set without co-allocationdescribed in [34]. We use synthetic benchmarks, because it is easier to ensure and steer dissimilarities asdescribed below. The set consists of four classes of application jobs, each class representing different values ofthe following two characteristics: the degree of dependencies between grid jobs D and the degree of freedom ofresource selection R:
D =
l∑
i=1
ni∑
j=1
pij
n(n− 1)/2(3.2)
R =
l∑
i=1
ni∑
j=1
card(µij)
nm(3.3)
where pij is the number of predecessors of grid job Oij , n is the number of all grid job as defined in (3.1).The resulting values are in the range between 0 and 1 with small values for few dependencies or a low number
of resource alternatives respectively. The benchmarks are constructed in such a way that random values for pijand card(µij) are chosen using a uniform distribution within given ranges. These bounds are adjusted so thateither a small degree of about 0.2 or a large one of about 0.8 is achieved. The four combinations of low and highdegrees result in four basic benchmark classes, which are abbreviated by sRsD, sRlD, lRsD, and lRlD, where sstands for small and l for large values of R and D.
The duration of grid jobs ranges uniformly distributed between three and seven time units. The sameholds for the amount of grid jobs per application job. As the total number of grid jobs is another measureof complexity, benchmarks containing 50, 100, and 200 grid jobs are defined using the same set of resourcesfor every amount. A fourth benchmark set again consists of 200 grid jobs, but with a doubled set of resourcesavailable. Time and cost budgets of the application jobs were manually adjusted so that the described heuristicsjust could not solve them and the exciting question was whether the EA can produce schedules that observethe budgets. The four benchmark classes, together with four different loads, yielded a total of 16 benchmarks[34]. They were used for former investigations, the results of which are summarised at the end of this section.
The benchmarks used for the experiments presented here are based on the described ones with the followingpeculiarities. In the experiment section four questions are investigated, see §4, which deal firstly with theusability of the old plan for rescheduling and the effectiveness of the new rescheduling heuristics. For thesequestions the old benchmarks with 100 and 200 grid jobs are used. And secondly, the processible workloadand the effect of the Memetic Algorithm compared to the pure evolutionary search is investigated. For thatthe amount of grid jobs and resources is increased proportionally while preserving the remaining properties ofthe basic benchmarks based on 200 grid jobs. But in this case, the budgets are no longer adjusted manuallyto reduce the effort. The new constraints are based on the results of a first heuristic planning with a givenpercentage of average reduction to make them harder.
The investigations presented here are based on the results reported in [20, 33]. This means that the describedcoding of the chromosomes is used together with the already mentioned phenotypic repair of possible violationsof precedence rules of the grid jobs. The advantage of this approach compared to repair mechanisms on the genelevel is that intermediate steps of shifting genes, which themselves may be faulty, are allowed to occur. The idea
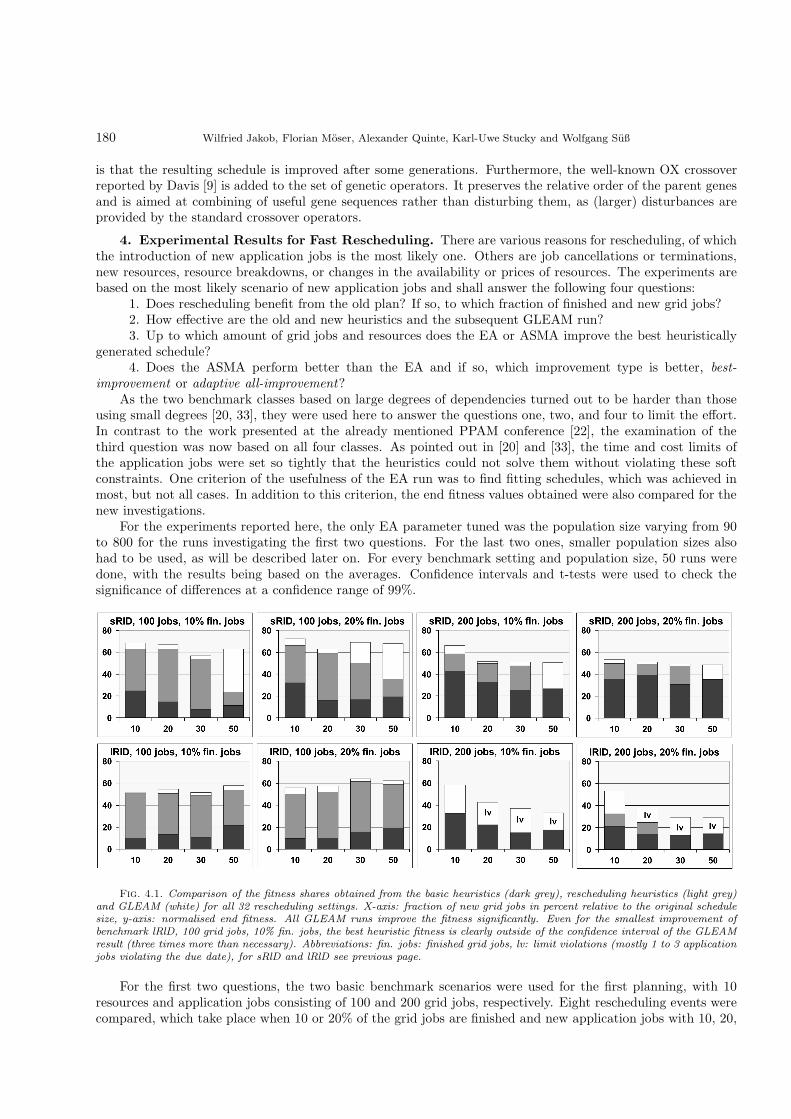
180 Wilfried Jakob, Florian Moser, Alexander Quinte, Karl-Uwe Stucky and Wolfgang Suß
is that the resulting schedule is improved after some generations. Furthermore, the well-known OX crossoverreported by Davis [9] is added to the set of genetic operators. It preserves the relative order of the parent genesand is aimed at combining of useful gene sequences rather than disturbing them, as (larger) disturbances areprovided by the standard crossover operators.
4. Experimental Results for Fast Rescheduling. There are various reasons for rescheduling, of whichthe introduction of new application jobs is the most likely one. Others are job cancellations or terminations,new resources, resource breakdowns, or changes in the availability or prices of resources. The experiments arebased on the most likely scenario of new application jobs and shall answer the following four questions:
1. Does rescheduling benefit from the old plan? If so, to which fraction of finished and new grid jobs?2. How effective are the old and new heuristics and the subsequent GLEAM run?3. Up to which amount of grid jobs and resources does the EA or ASMA improve the best heuristically
generated schedule?4. Does the ASMA perform better than the EA and if so, which improvement type is better, best-
improvement or adaptive all-improvement?As the two benchmark classes based on large degrees of dependencies turned out to be harder than those
using small degrees [20, 33], they were used here to answer the questions one, two, and four to limit the effort.In contrast to the work presented at the already mentioned PPAM conference [22], the examination of thethird question was now based on all four classes. As pointed out in [20] and [33], the time and cost limits ofthe application jobs were set so tightly that the heuristics could not solve them without violating these softconstraints. One criterion of the usefulness of the EA run was to find fitting schedules, which was achieved inmost, but not all cases. In addition to this criterion, the end fitness values obtained were also compared for thenew investigations.
For the experiments reported here, the only EA parameter tuned was the population size varying from 90to 800 for the runs investigating the first two questions. For the last two ones, smaller population sizes alsohad to be used, as will be described later on. For every benchmark setting and population size, 50 runs weredone, with the results being based on the averages. Confidence intervals and t-tests were used to check thesignificance of differences at a confidence range of 99%.
Fig. 4.1. Comparison of the fitness shares obtained from the basic heuristics (dark grey), rescheduling heuristics (light grey)and GLEAM (white) for all 32 rescheduling settings. X-axis: fraction of new grid jobs in percent relative to the original schedulesize, y-axis: normalised end fitness. All GLEAM runs improve the fitness significantly. Even for the smallest improvement ofbenchmark lRlD, 100 grid jobs, 10% fin. jobs, the best heuristic fitness is clearly outside of the confidence interval of the GLEAMresult (three times more than necessary). Abbreviations: fin. jobs: finished grid jobs, lv: limit violations (mostly 1 to 3 applicationjobs violating the due date), for sRlD and lRlD see previous page.
For the first two questions, the two basic benchmark scenarios were used for the first planning, with 10resources and application jobs consisting of 100 and 200 grid jobs, respectively. Eight rescheduling events werecompared, which take place when 10 or 20% of the grid jobs are finished and new application jobs with 10, 20,

Fast Multi-obj. Rescheduling of Workflows to Constr. Res. Using Heur. and Memetic Evol. 181
30, or 50% grid jobs (relating to the original schedule size) are added. This results in 32 benchmark settings. Weconcentrated on small amounts of already processed grid jobs, because this is more likely in practice and givesa chance for the old schedule to be useful. Otherwise, the situation is coming closer to the already investigated“new planning” situation.
Figure 4.1 compares the results for all 32 benchmark settings. It must be mentioned that a certain variationin the resulting normalised fitness values is not relevant, as the benchmarks are generated with some stochasticvariations. Values between 50 and 70 may be considered good results, as the lower and upper bounds for theevaluations are theoretical minima and maxima. Results close to 100% would indicate either a trivial case ora software error. The most important outcome is that for 10% new grid jobs, all eight scenarios perform well.The contribution of the heuristics is clearly situation-dependent and if they tend to yield poor results, GLEAMcompensates this in most cases. In other words, if the heuristics can solve the problem well, there is smallerroom left for an improvement at all. Another nice result is that this compensation is also done to a certainextent for more new grid jobs, even if the schedules cannot be made free of limit violations (cf. the six columnsindicated by lv, which stands for limit violations). It can be expected that more new grid jobs will lower thecontribution of the replanning heuristics and, in fact, Figure 4.1 confirmes this for the instance of 50% new gridjobs. The case of lRlD, 200, and 10% finished grid jobs is somewhat exceptional, as the replanning heuristicsdo not work well even in the case of few new jobs.
Table 4.1Comparison of the contributions of all rescheduling heuristics for the different fractions of finished and new grid jobs. The
best values of each column are marked dark grey, while values which reach 90% of the best at the minimum are marked light grey.Abbreviations: SDT: shortest due time, SWT: shortest work time, AJ: application job, GJ: grid job, RAS: see §3.
Finished grid jobs: 10% 20% Ave-New grid jobs: 10% 20% 30% 50% 10% 20% 30% 50% rage
RH SDT & RAS-3 0.90 0.96 0.88 0.92 0.86 0.83 0.89 0.92 0.90RH SDT & RAS-2 0.70 0.44 0.73 0.80 0.64 0.59 0.75 0.61 0.66RH SDT & RAS-1 0.48 0.44 0.54 0.45 0.59 0.22 0.53 0.45 0.46
RH SWT (GJ) & RAS-3 0.97 0.86 0.81 0.69 0.94 0.78 0.81 0.62 0.81RH SWT (GJ) & RAS-2 0.74 0.42 0.63 0.53 0.66 0.50 0.68 0.39 0.57RH SWT (GJ) & RAS-1 0.47 0.41 0.46 0.28 0.57 0.24 0.54 0.26 0.40
RH SWT (AJ) & RAS-3 0.90 0.88 0.82 0.70 0.86 0.83 0.77 0.70 0.81RH SWT (AJ) & RAS-2 0.70 0.41 0.70 0.56 0.64 0.51 0.57 0.46 0.57RH SWT (AJ) & RAS-1 0.48 0.44 0.57 0.31 0.59 0.24 0.49 0.43 0.44
SDT & RAS-3 0.45 0.42 0.35 0.56 0.45 0.41 0.47 0.51 0.45SDT & RAS-2 0.58 0.52 0.38 0.72 0.51 0.43 0.56 0.69 0.55SDT & RAS-1 0.42 0.42 0.39 0.54 0.39 0.37 0.37 0.45 0.42
SWT (GJ) & RAS-3 0.01 0.01 0.01 0.01 0.01 0.01 0.01 0.01 0.01SWT (GJ) & RAS-2 0.01 0.01 0.01 0.01 0.01 0.01 0.01 0.01 0.01SWT (GJ) & RAS-1 0.01 0.01 0.01 0.01 0.01 0.01 0.01 0.01 0.01
SWT (AJ) & RAS-3 0.02 0.02 0.02 0.02 0.02 0.02 0.02 0.02 0.02SWT (AJ) & RAS-2 0.02 0.02 0.02 0.02 0.02 0.02 0.02 0.02 0.02SWT (AJ) & RAS-1 0.02 0.02 0.02 0.02 0.02 0.02 0.02 0.02 0.02
Table 4.1 illustrates the contribution of each heuristic. For each of the 32 benchmark settings, the fitness ofeach heuristic is calculated relative to the best heuristic result for this setting. The four values for both grid jobamounts for sRlD and lRlD are averaged and shown in the table. The right column again averages the valuesfor the different finished and new grid job fractions. The old heuristics based on short working times in thelower half of the table show the same poor behaviour as for planning an empty grid [20], but when taken as abasis for the new rescheduling heuristics, they contribute quite well. According to the table, RAS-3 performsbest, but the raw material not shown here has thirteen cases, in which the two other RAS are the best ones.Thus, it is meaningful to use them all for replanning, but it seems to be wise to drop the six old heuristicssorting according to short working times.

182 Wilfried Jakob, Florian Moser, Alexander Quinte, Karl-Uwe Stucky and Wolfgang Suß
To investigate the last two questions concerning the processible load, the rescheduling scenario with 10%finished and 10% new grid jobs is used with proportionally growing numbers for grid jobs and resources. Thestudies on the behaviour of the EA GLEAM are based on all benchmark classes, while the ASMA is checkedwith sRlD and lRlD only to limit the effort. The penalty functions showed a weakness when applied to anincreasing load, with the penalty factor converging to one for small numbers of penalty causing applicationjobs. Thus, the two functions penalising the number of too costly or late application jobs were modified toyield a value 0.8 instead of near 1.0 in case of just one job. 0.8 was chosen to have a distinct separation frompenalty-free schedules with weaker overall quality. It must be borne in mind that a suitable definition of thefitness function is crucial to the success of every evolutionary search. To achieve comparability, all runs weredone with the modified fitness function, so that the results reported in [22] differ in the details of the figuresfrom those reported here. But the general tendencies remain the same as expected.
The comparisons are based on the fitness improvement obtained by the EA compared to the best heuristicresult and on the success rate, which is the ratio between violation-free and total runs per benchmark setting.Figure 4.2 shows the results. As expected, success rate and EA improvement decrease with growing load. Forlarge resource alternatives, good success rates can be preserved much longer. This is not surprising, as moreresources mean more planning freedom. The relatively large variations of the EA improvement can be explainedby the varying ability of the heuristics to produce schedules with more or less limit violations. As limit violationsare penalised severely, a small difference already can produce a relatively large fitness alteration.
No violations at all leave little room for improvements like in the two cases of sRlD and lRsD and 200 gridjobs. There is a clear correspondence between the success and the magnitude of the confidence intervals. This isbecause the penalty function reduces the fitness significantly. For loads of up to 400 grid jobs and 40 resources,GLEAM can always produce violation-free schedules. For up to 1000 grid jobs and 100 resources, this can beachieved for the cases of large resource alternatives. From that on to 1600 grid jobs and 160 resources, thechance of producing successful schedules is slowly diminishing. But improvements of the overall quality andbelow the level of violation-free schedules are still possible for loads of up to 7000 grid jobs and 700 resources,as shown in the lower part of Figure 4.2. In other words, the amount of application jobs keeping the budgets isstill increased compared to the heuristic results.
The fourth question concerns the effect of adding local search to the evolutionary process. The results forsRlD and lRlD exhibit better success rates for an increasing load, as shown in Figures 4.3 and 4.4. For sRlDboth improvement types of the ASMA yield a success for 600 grid jobs and 60 resources, which could not beachieved by GLEAM alone. In case of lRlD, the ASMA runs with adaptive all-improvement produce the betterresults for the three loads between 1200 and 1600 grid jobs. Looking at the improvement rate, it is striking thatthere are only minor differences, which in most cases are not significant, for all completely or nearly successfulruns. Again, the ASMA with adaptive all-improvement works better for the lRlD benchmarks in all cases, butone (5000 grid jobs) and in many cases of the other benchmark series. As there are four sRlD cases and one lRlDcase, where GLEAM performs best (900, 1000, 1200, and 2400 grid jobs), more investigations are necessary.For results like sRlD and 3200 or 5000 grid jobs, the t-test shows that the differences are not significant. Insummary, there is a clear tendency in favour of the ASMA variant using adaptive all improvement, which isbased mainly on the achieved improvements of the success rates.
Finally, the questions for how long improvements can be expected and which population sizes are goodshall be studied. The more grid jobs must be planned, the less evaluations can be processed within the threeminutes time frame. Figure 4.5 shows that this amount decreases continuously with growing load. The moreresource alternatives are available, the more must be checked by the RAS, which lasts longer and explains thelower numbers for the two lR cases. In the long run, the evaluations possible decrease to such an extent thatthe population size must be reduced to 20 or 30 to obtain two dozens of generations at least in the end. Itis obvious that with such small numbers, only poor results can be expected and it is encouraging that evenwith the largest load there still is a significant improvement. Hence, a faster implementation of the evaluationsoftware or better hardware will enlarge the possible load or deliver better results for the loads investigated.
As mentioned above, the only tuned strategy parameter of the EA and the ASMA is the population size.For GLEAM, sizes between 20 and 400 were observed, if the exceptional cases of 10 and 800 are left out. Thevalues are a little bit lower for the ASMA using best-improvement and about half (20 to 200) for adaptiveall-improvement. This means that the range of potential good population sizes is significantly smaller for theASMA based on adaptive all-improvement. This is due to the more intensive search done when more siblingsof a mating are locally improved.

Fast Multi-obj. Rescheduling of Workflows to Constr. Res. Using Heur. and Memetic Evol. 183
Fig. 4.2. Success rate and EA improvement compared to the best heuristic at increasing load for all four benchmark classesand 10% finished and new grid jobs. The improvement factors are given with their confidence intervals. The bars of the successrates are not shaded, so that the marks of low success rates remain visible. They are always located in the same column as thecorresponding success rate. The number of resources is in each case 10% of the number of grid jobs. For a better visibility theresults for 2400 grid jobs and more are plotted in a separate diagram, where success rates already shown in the upper part are leftout.

184 Wilfried Jakob, Florian Moser, Alexander Quinte, Karl-Uwe Stucky and Wolfgang Suß
Fig. 4.3. Success rate and EA improvement as described in Figure 4.2 for the sRlD benchmark series comparing GLEAMwith the two ASMA variants described in §3.4.
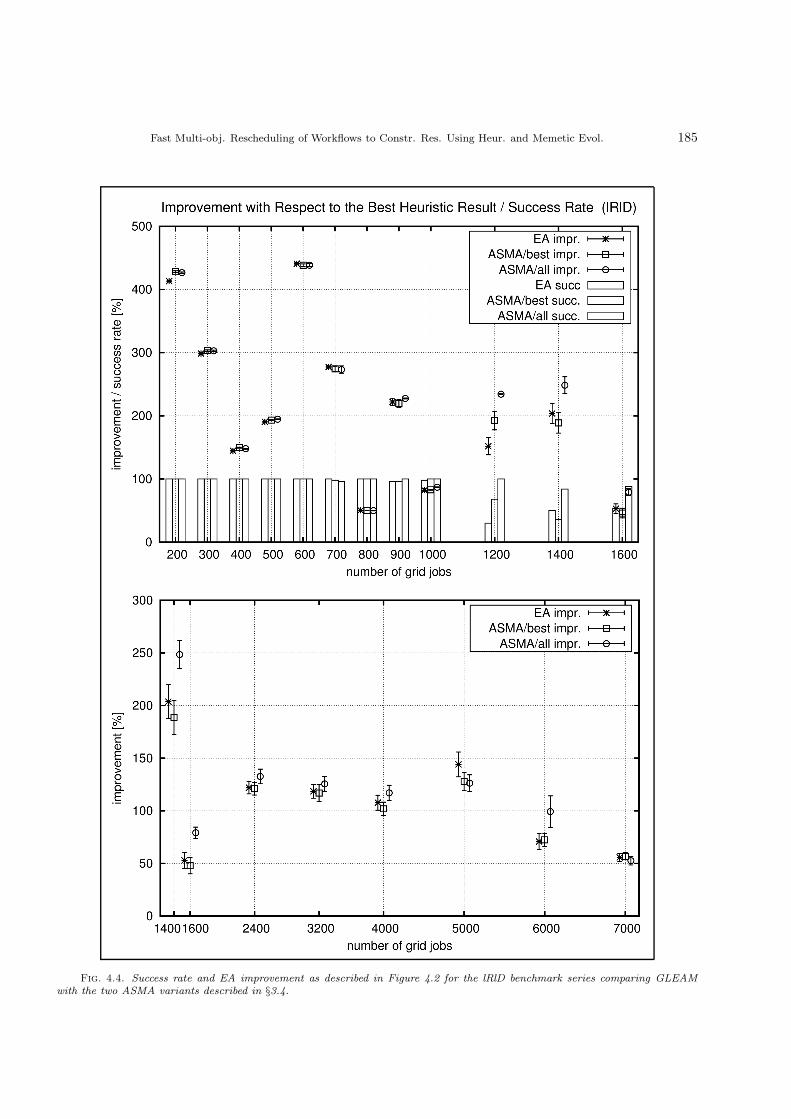
Fast Multi-obj. Rescheduling of Workflows to Constr. Res. Using Heur. and Memetic Evol. 185
Fig. 4.4. Success rate and EA improvement as described in Figure 4.2 for the lRlD benchmark series comparing GLEAMwith the two ASMA variants described in §3.4.
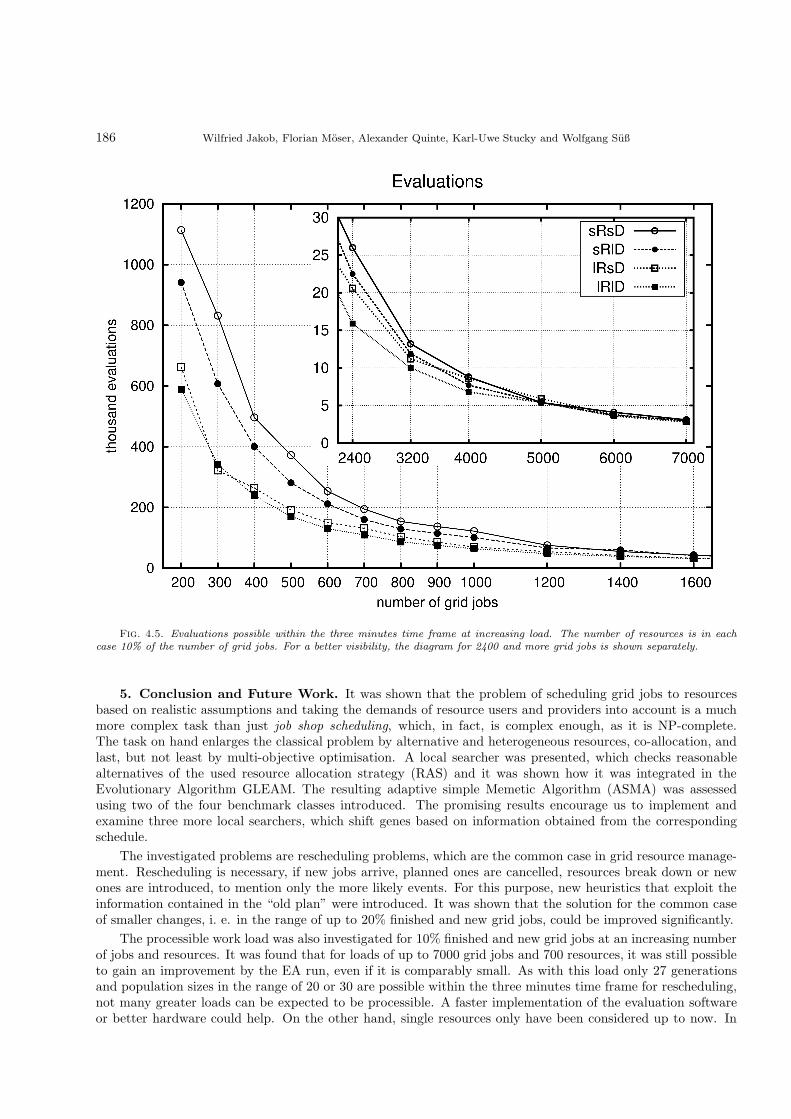
186 Wilfried Jakob, Florian Moser, Alexander Quinte, Karl-Uwe Stucky and Wolfgang Suß
Fig. 4.5. Evaluations possible within the three minutes time frame at increasing load. The number of resources is in eachcase 10% of the number of grid jobs. For a better visibility, the diagram for 2400 and more grid jobs is shown separately.
5. Conclusion and Future Work. It was shown that the problem of scheduling grid jobs to resourcesbased on realistic assumptions and taking the demands of resource users and providers into account is a muchmore complex task than just job shop scheduling, which, in fact, is complex enough, as it is NP-complete.The task on hand enlarges the classical problem by alternative and heterogeneous resources, co-allocation, andlast, but not least by multi-objective optimisation. A local searcher was presented, which checks reasonablealternatives of the used resource allocation strategy (RAS) and it was shown how it was integrated in theEvolutionary Algorithm GLEAM. The resulting adaptive simple Memetic Algorithm (ASMA) was assessedusing two of the four benchmark classes introduced. The promising results encourage us to implement andexamine three more local searchers, which shift genes based on information obtained from the correspondingschedule.
The investigated problems are rescheduling problems, which are the common case in grid resource manage-ment. Rescheduling is necessary, if new jobs arrive, planned ones are cancelled, resources break down or newones are introduced, to mention only the more likely events. For this purpose, new heuristics that exploit theinformation contained in the “old plan” were introduced. It was shown that the solution for the common caseof smaller changes, i. e. in the range of up to 20% finished and new grid jobs, could be improved significantly.
The processible work load was also investigated for 10% finished and new grid jobs at an increasing numberof jobs and resources. It was found that for loads of up to 7000 grid jobs and 700 resources, it was still possibleto gain an improvement by the EA run, even if it is comparably small. As with this load only 27 generationsand population sizes in the range of 20 or 30 are possible within the three minutes time frame for rescheduling,not many greater loads can be expected to be processible. A faster implementation of the evaluation softwareor better hardware could help. On the other hand, single resources only have been considered up to now. In

Fast Multi-obj. Rescheduling of Workflows to Constr. Res. Using Heur. and Memetic Evol. 187
the future we want to extend the system to resources with capacities like clusters of homogeneous hardware ordata storage resources.
REFERENCES
[1] J. Adams, E. Balas, and D. Zawack, The shifting bottleneck procedure for job shop scheduling, MANAGEMENT SCIENCE,34 (1988).
[2] M. B. Bader-El-Den, R. Poli, and S. Fatima, Evolving timetabling heuristics using a grammar-based genetic programminghyper-heuristic framework, Memetic Computing, 1 (2009), pp. 205–219.
[3] A. Baykasoglu, L. Ozbakır, and T. Dereli, Multiple dispatching rule based heuristic for multi-objective scheduling of jobshops using tabu search, in Proceedings of MIM 2002: 5th Int. Conf. on Managing Innovations in Manufacturing (MIM),Milwaukee, Wisconsin, USA, 2002, pp. 396–402.
[4] C. Blume and W. Jakob, Gleam - an evolutionary algorithm for planning and control based on evolution strategy, in GECCO2002, E. Cantu-Paz, ed., vol. LBP, 2002, pp. 31–38.
[5] , GLEAM - General Learning Evolutionary Algorithm and Method : ein Evolutionarer Algorithmus und seine Anwen-dungen, vol. 32 of Schriftenreihe des Instituts fur Angewandte Informatik - Automatisierungstechnik, (in German), KITScientific Publishing, Karlsruhe, 2009.
[6] P. Brucker, Scheduling Algorithms, Springer, Berlin Heidelberg, 2004.[7] , Complex Scheduling, Springer, Berlin Heidelberg, 2006.[8] K.-P. Chen, M. S. Lee, P. S. Pulat, and S. A. Moses, The shifting bottleneck procedure for job-shops with parallel machines,
Int. Journal of Industrial and Systems Engineering 2006, 1 (2006), pp. 244–262.[9] L. D. Davis and M. Mitchell, Handbook of genetic algorithms, Van Nostrand Reinhold, (1991).
[10] P.-F. Dutot, L. Eyraud, G. Mounie, and D. Trystram, Bi-criteria algorithm for scheduling jobs on cluster platforms, inSPAA ’04: Proceedings of the sixteenth annual ACM symposium on Parallelism in algorithms and architectures, NewYork, NY, USA, 2004, ACM, pp. 125–132.
[11] I. Foster, C. Kesselman, and S. Tuecke, The anatomy of the grid-enabling scalable virtual organizations, InternationalJournal of Supercomputer Applications, 15 (2001), pp. 200–222.
[12] B. Giffler and G. L. Thompson, Algorithms for solving production scheduling problems, Operations Research, 8 (1960),pp. 487–503.
[13] M. Gorges-Schleuter, Genetic Algorithms and Population Structures—A Massively Parallel Algorithm, PhD thesis, Uni-versity of Dortmund, FRG, 1990.
[14] , Explicit parallelism of genetic algorithms through population structures, in PPSN I (1990), H.-P. Schwefel andR. Manner, eds., LNCS 496, Springer, 1991, pp. 150–159.
[15] W. E. Hart, N. Krasnogor, and J. Smith, eds., Recent Advances in Memetic Algorithms. Studies in Fuzziness and SoftComputing, vol. 166, Springer, 2004.
[16] W. Jakob, Towards an adaptive multimeme algorithm for parameter optimisation suiting the engineers’ need, in PPSN IX,T. P. Runarsson, H.-G. Beyer, and J. J. Merelo-Guervos, eds., LNCS 4193, Berlin, 2006, Springer, pp. 132–141.
[17] , A cost-benefit-based adaptation scheme for multimeme algorithms, in Conf. Proc. PPAM 2007, LNCS 4967,R. Wyrzykowski, J. Dongarra, K. Karczewski, and J. Wasniewski, eds., Springer, Berlin, 2008, pp. 509–519.
[18] , A general cost-benefit based adaptation framework for multimeme algorithms, Memetic Computing, (accepted, to bepublished).
[19] W. Jakob, M. Gorges-Schleuter, and C. Blume, Application of genetic algorithms to task planning and learning, in PPSNII, R. Manner and B. Manderick, eds., North-Holland, Amsterdam, 1992, pp. 291–300.
[20] W. Jakob, A. Quinte, K.-U. Stucky, and W. Suß, Fast multi-objective scheduling of jobs to constrained resources usinga hybrid evolutionary algorithm, in PPSN X, G. Rudolph, T. Jansen, S. M. Lucas, C. Poloni, and N. Beume, eds., LNCS5199, Springer, 2008, pp. 1031–1040.
[21] W. Jakob, A. Quinte, W. Suß, and K.-U. Stucky, Optimised scheduling of grid resources using hybrid evolutionaryalgorithms, in Conf. Proc. PPAM 2005, LNCS 3911, R. Wyrzykowski, J. Dongarra, N. Meyer, and J. Wasniewski, eds.,Springer, Berlin, 2006, pp. 406–413.
[22] , Fast multi-objective rescheduling of grid jobs by heuristics and evolution, in Conf. Proc. PPAM 2009, LNCS 6067 or6068 (to be published in July, 2010), R. Wyrzykowski, J. Dongarra, K. Karczewski, and J. Wasniewski, eds., Springer,Berlin, 2010.
[23] N. Krasnogor, B. P. Blackburne, E. K. Burke, and J. D. Hirst, Multimeme algorithms for protein structure prediction,in Conf. Proc. PPSN VII, LNCS 2439, 2002, pp. 769–778.
[24] K. Kurowski, J. Nabrzuski, A. Oleksiak, and J. Weglarz, Scheduling jobs on the grid - multicriteria approach, Compu-tational Methods in Science and Technology, 12 (2006), pp. 123–138.
[25] M. W. S. Land, Evolutionary Algorithms with Local Search for Combinatorial Optimization, PhD thesis, University ofCalifornia, USA, 1998.
[26] P. Moscato, On evolution, search, optimization, genetic algorithms and martial arts - towards memetic algorithms, 1989.Tech. Rep. Caltech Concurrent Computation Program, Rep. 826, California Institute of Technology, Pasadena, CA.
[27] F. Moser, W. Jakob, A. Quinte, K.-U. Stucky, and W. Suß, An assessment of heuristics for fast scheduling of grid jobs.Submitted to the ICSOFT 2010 conference.
[28] K. Neumann and M. Morlock, Operations Research, Carl Hanser, Munchen, 2002.[29] Y. S. Ong, M. H. Lim, N. Zhu, and K. W. Wong, Classification of adaptive memetic algorithms: A comparative study,
IEEE Transactions on Systems, Man, and Cybernetics-Part B: Cybernetics, 36 (2006), pp. 141–152.[30] L. S. Pitsoulis and M. G. C. Resende, Greedy randomized adaptive search procedures, in Handbook of Applied Optimization,
P. M. Pardalos and M. G. C. Resende, eds., Oxford University Press, 2001, pp. 168–181.

188 Wilfried Jakob, Florian Moser, Alexander Quinte, Karl-Uwe Stucky and Wolfgang Suß
[31] R. Sakellariou, H. Zhao, E. Tsiakkouri, and M. D. Dikaiakos, Scheduling workflows with budget constraints, in inIntegrated Research in Grid Computing, S. Gorlatch and M. Danelutto, Eds.: CoreGrid series, Springer-Verlag, 2007.
[32] A. Setamaa-Karkkainen, K. Miettinen, and J. Vuori, Best compromise solution for a new multiobjective schedulingproblem, Computers & Computers and Operations Research archive, 33 (2006), pp. 2353–2368.
[33] K.-U. Stucky, W. Jakob, A. Quinte, and W. Suß, Tackling the grid job planning and resource allocation problem usinga hybrid evolutionary algorithm, in Conf. Proc. PPAM 2007, LNCS 4967, R. Wyrzykowski, J. Dongarra, K. Karczewski,and J. Wasniewski, eds., Springer, Berlin, 2008, pp. 589–599.
[34] W. Suß, A. Quinte, W. Jakob, and K.-U. Stucky, Construction of benchmarks for comparison of grid resource planningalgorithms, in ICSOFT 2007, Proc. of the Second ICSOFT, Volume PL/DPS/KE/WsMUSE, Barcelona, Spain, July22-25, 2007, J. Filipe, B. Shishkov, and M. Helfert, eds., Inst. f. Systems and Techn. of Inf., Control and Com., INSTICCPress, 2007, pp. 80–87.
[35] M. Wieczorek, A. Hoheisel, and R. Prodan, Taxonomy of the multi-criteria grid workflow scheduling problem, in GridMiddleware and Services - Challenges and Solutions, D. Talia, R. Yahyapour, and W. Ziegler, eds., Springer US, NewYork, 2008, pp. 237–264.
[36] F. Xhafa, E. Alba, B. Dorronsoro, B. Duran, and A. Abraham, Efficient batch job scheduling in grids using cellularmemetic algorithms, in Metaheuristics for Scheduling in Distributed Computing Environments, F. Xhafa and A. Abraham,eds., Springer, Berlin, 2008, pp. 273–299.
[37] J. Yu and R. Buyya, A budget constrained scheduling of workflow applications on utility grids using genetic algorithms, inWorkshop on Workflows in Support of Large-Scale Science, Proceedings of the 15th IEEE International Symposium onHigh Performance Distributed Computing (HPDC, IEEE, IEEE CS Press, 2006.
Edited by: Marcin PaprzyckiReceived: March 30, 2010Accepted: June 21, 2010

Scalable Computing: Practice and ExperienceVolume 11, Number 2, pp. 189–204. http://www.scpe.org
ISSN 1895-1767c© 2010 SCPE
VIESLAF FRAMEWORK: FACILITATING NEGOTIATIONS IN CLOUDS BY APPLYINGSERVICE MEDIATION AND NEGOTIATION BOOTSTRAPPING
IVONA BRANDIC∗, DEJAN MUSIC∗, AND SCHAHRAM DUSTDAR∗
Abstract. Cloud computing represents a novel and promising computing paradigm where computing resources have to beallocated to software for their execution. Self-manageable Cloud infrastructures are required in order to achieve that level offlexibility on one hand, and to comply to users’ requirements specified by means of Service Level Agreements (SLAs) on the other.However, many assumptions in Cloud markets are old fashioned assuming same market conditions as for example in computationalGrids. One such assumptions is that service provider and consumer have matching SLA templates and common understanding ofthe negotiated terms or that they provide public templates, which can be downloaded and utilized by the end users. Moreover,current Cloud negotiation systems have based themselves on common protocols and languages that are known to the participantsbeforehand. Matching SLA templates and a-priori knowledge about the negotiation terms and protocols between partners areunrealistic assumption in Cloud markets where participants meet on demand and on a case by case basis. In this paper we presentVieSLAF, a novel framework for the specification and management of SLA mappings and meta-negotiations facilitating servicemediation and negotiation bootstrapping in Clouds. Using VieSLAF users may specify, manage, and apply SLA mappings bridgingthe gap between non-matching SLA templates without a-priori knowledge about negotiation protocols, required security standardsor negotiated terms. We exemplify two case studies where VieSLAF represents an important contribution towards the developmentof open and liquid Cloud markets.
Key words: grid services, cloud computing, autonomic computing, service negotiation
1. Introduction. Service-oriented Architectures (SOA) represent a promising approach for implementingICT systems [9, 24, 30] by packaging the software to services that can be accessed independently of the usedprogramming languages, protocols, and platforms. Despite remarkable adoption of SOA as the key concept forthe implementation of ICT systems, the full potential of SOA (e.g., dynamism, adaptivity) is still not exploited[28]. SOA approach and Web service technologies represent large scale abstractions and a candidate conceptfor the implementation Cloud Computing systems, where massively scalable computing is made available toend users as a service [9, 24]. The key benefits of providing computing power as a service are (a) avoidance ofexpensive computer systems configured to cope with peak performance, (b) pay-per-use solutions for computingcycles requested on-demand, and (c) avoidance of idle computing resources [16].
Non-functional requirements of a service execution are termed as Quality of Service (QoS), and are expressedand negotiated by means of Service Level Agreements (SLAs). SLA templates represent empty SLA documentswith all required elements like parties, SLA parameters, metrics and objectives, but without QoS values [12].However, most existing Cloud frameworks assume that the communication partner know about the negotiationprotocols, required security standards and negotiated terms before entering the negotiation and that theyhave matching SLA templates. These assumptions rely on related technologies (like computational Grids) andcannot be transferred to computational Cloud markets. In case of computational Clouds a priori knowledgeabout negotiation protocols and strategies as well as matching SLA templates represent unrealistic assumptionsince services are discovered dynamically and on demand.
In this paper we approach the gap between existing QoS methods and Cloud services by proposing aVienna Service Level Agreement Framework (VieSLAF) architecture for Cloud service management with com-ponents for service mediation and negotiation bootstrapping [7, 8]. Thereby, we introduce so-called meta-negotiations to allow two parties to reach an agreement on what specific negotiation protocols, security stan-dards, and documents to use before starting the actual negotiation. Moreover, we discuss the concept ofSLA-mappings to bridge the gap between inconsistent SLA templates. The concept of SLA mappings canbe exemplified in differences in terminology for a common attribute such as price, which may be defined asusage price on one side and service price on the other, leading to inconsistencies during the negotiation pro-cess. VieSLAF framework has been successfully applied to (i) develop Cloud infrastructures for the SLA-basedresource virtualization [20] by utilizing our meta negotiation approach and (ii) to facilitate liquidity manage-ment in Clouds by using our SLA mapping approach [29]. Besides performance evaluation of the VieSLAFwe discuss successful case studies for the application of VieSLAF to establish open and liquid Cloud mar-kets.
∗Distributed Systems Group, Institute of Information Systems, Vienna University of Technology, Vienna, Austria, Emails:{ivona, dejan, dustdar}@infosys.tuwien.ac.at
189

190 I. Brandic, D. Music, S. Dustdar
The main contributions of this paper are (1) description of the scenarios for the definition of SLA mappingdocuments; (ii) development of the architecture for the meta-negotiations in Cloud systems; (iii) descriptionof the meta-negotiation document; (iv) definition of the VieSLAF architecture used for the semi-automaticmanagement of SLA mappings and meta-negotiations and (iv) demonstration of the usability of the VieSLAFframework for real-world Cloud negotiations.
The rest of this paper is organized as follows: Section 2 presents the related work. Section 3 gives an overviewabout the goals of the adaptable, versatile, and dynamic services, in particular goals considering negotiationbootstrapping and service mediation. In Section 4 we discuss the meta-negotiation approach, whereas in Section5 we present the SLA mapping approach. Section 6 presents the VieSLAF architecture. In Section 7 we evaluateSLA mapping and meta negotiation approach and report successful VieSLAF case studies. Section 8 concludesthis paper and describes the future work.
2. Related Work. Currently, a large body of work exists in the area of service negotiation and SLA-basedQoS. Most of the related work can be classified into the following four categories: (1) adaptive SLA mechanismsbased on OWL, DAML-S and other semantic technologies [13, 26, 38]; (2) SLA based QoS systems, whichconsider varying service requirements but do not consider non matching SLA templates [1, 34]; (3) systemsrelying on the principles of autonomic computing [3, 21, 22]; and systems addressing versatile negotiation inGrids/SOAs [25, 27, 18]. Since there is very little work on service mediation and negotiation bootstrapping inClouds we look in particular into related systems like Grids and SOAs [4].
Work presented in [27] discusses incorporation of SLA-based resource brokering into existing Grid systems.Oldham et al. describe a framework for semantic matching of SLAs based on WSDL-S and OWL [26]. Dobsonat al. present a unified quality of service (QoS) ontology applicable to the main scenarios identified such as QoS-based Web services selection, QoS monitoring and QoS adaptation [13]. Zhou et al. survey the current researchon QoS and service discovery, including ontologies such as OWL-S and DAML-S. Thereafter, an ontology isproposed, DAML-QoS, which provides detailed QoS information in a DAML format [38]. Hung et al. proposean independent declarative XML language called WS-Negotiation for Web services providers and requestors.WS-Negotiation contains three parts: negotiation message, which describes the format for messages exchangedamong negotiation parties, negotiation protocol, which describes the mechanism and rules that negotiationparties should follow, and negotiation decision making, which is an internal and private decision process basedon a cost-benefit model or other strategies [17]. Work presented in [1] extends the service abstraction in the OpenGrid Services Architecture (OGSA) for QoS properties focusing on the application layer. Thereby, a given servicemay indicate the QoS properties it can offer or it may search for other services based on specified QoS properties.
Quan et al. discuss the process of mapping a light communication workflow within an SLA context withdifferent kinds of sub-jobs and resources [25]. Dan et al. present a framework for providing customers of Webservices differentiated levels of service through the use of automated management and SLAs [12]. Ardagana etal. present an autonomic grid architectures with mechanisms to dynamically re-configure service center infras-tructures, which is basically exploited to fulfill varying QoS requirements [3]. Koller et al. discuss autonomousQoS management using a proxy-like approach. The implementation is based on WS-Agreement [36]. Thereby,SLAs can be exploited to define certain QoS parameters that a service has to maintain during its interactionwith a specific customer [21]. Konig at al. investigate the trust issue in electronic negotiations, dealing withtrust to a potential transaction partner and selection of such partners based on their past behavior [22].
Quan et al. and Ouelhadj et al. discuss incorporation of SLA-based resource brokering into existing Gridsystems [25, 27]. Li et al. discusses Rudder framework, which facilitates automatic Grid service compositionbased on semantic service discovery and space based computing [23]. Hill et al. discusses an architecturethat allows changes to the Grid configuration to be automated in response to operator input or sensors placedthroughout the Grid based on principles of autonomic computing [18]. Similarly to Hill et al. work discussedin Vambenepe et al. addresses global service management based on principles of autonomic computing [33].Vu et al. present an extensible and customizable framework for the autonomous discovery of semantic Webservices based on their QoS properties [35]. Condor’s ClassAds mechanism is used to represent jobs, resources,submitters and other Condor daemons [31].
However, to the best of our knowledge none of the discussed approaches deals with user-driven and semi-automatic definition of SLA mappings enabling negotiations between inconsistent SLA templates. Also, none ofthe presented approaches address meta-negotiations (MN) where participating parties may agree on a specificnegotiation protocol, security standards or other negotiation pre-requisites.

Vienna Service Level Agreement Framework - VieSLAF 191
Fig. 3.1. FoSII infrastructure
3. Adaptable, Versatile, and Dynamic services. In this section we discuss how service mediation andnegotiation bootstrapping can be realized using the concepts of autonomic computing [19]. First, we introducethe Foundations of Self-governing ICT Infrastructures (FoSII) project (Section 3.1). Thereafter we discuss howthe VieSLAF architecture contributes to the implementation of FoSII goals (Section 3.2).
3.1. FoSII infrastructure. To facilitate dynamic, versatile, and adaptive IT infrastructures, SOA systemsshould react to environmental changes, software failures, and other events which may influence the systems’behavior. Therefore, adaptive systems exploiting self-* properties (self-healing, self-controlling, self-managing,etc.) are needed, where human intervention with the system is minimized. In Foundations of Self-governingICT Infrastructures (FoSII) project we propose models and concepts for adaptive services, utilizing autonomiccomputing concepts [3, 19]. As shown in Figure 3.1 the FoSII infrastructure is used to manage the wholeMonitoring, Analysis, Planning and Execution (MAPE) lifecycle of self-adaptable Cloud services [5]. EachFoSII service implements three interfaces: (i) negotiation interface necessary for the establishment of SLAagreements, (ii) job-management interface necessary to start the job, upload data, and similar job managementactions, and (iii) the self-management interface necessary to devise actions in order to prevent SLA violations.
The self-management interface shown in Figure 3.1 is implemented by each Cloud service and specifiesoperations for sensing changes of the desired state and for reacting to those changes. The host monitor sensorscontinuously monitor the infrastructure resource metrics (input sensor values arrow a in Figure 3.1) and providethe autonomic manager with the current resource status. The run-time monitor sensors sense future SLAviolation threats (input sensor values arrow b in Figure 3.1) based on resource usage experiences and predefinedthreat thresholds. The treat thresholds should be retrieved by the knowledge management systems as describedlater on in the paper. The mapping between the sensed host values and the values of the SLA parameters isdescribed next.
As shown in Figure 3.1 we distinguish between host monitor and runtime monitor. Resources are monitoredby host monitor using arbitrary monitoring tools (e.g. Ganglia). Thus, resources metrics include e.g., down-time,up-time, available in and out bandwidth. Based on the predefined mapping rules stored in a database monitoredmetrics are periodically mapped to the SLA parameters. An example SLA parameter is service availability Av,which is calculated using the resource metrics downtime and uptime and the according mapping rule looks likethe following one:
Av = 1 − downtime/uptime (3.1)
The mapping rules are defined by the provider using appropriate Domain Specific Languages (DSL). Theserules are used to compose, aggregate, or convert the low-level metrics to form the high-level SLA parameterincluding mappings at different complexity levels e.g., 1 : n or n : m. Thus, calculated SLA values arecompared with the predefined threat threshold in order to react before SLA violations happen. The conceptof detecting future SLA violation threats is designed by defining a more restrictive threshold than the SLAviolation threshold known as threat threshold. Generation of the threat threshold is far from trivial and shouldbe defined and mananaged by the FoSII’s knowledge management system.

192 I. Brandic, D. Music, S. Dustdar
Fig. 3.2. Negotiation Bootstrapping and Service Mediation as Part of the Autonomic Process
As described in [11] we implemented a highly scalable framework for mapping of Low-level Resource Metricsto High Level SLA parameters LoM2HiS framework facilitating exchange of large numbers of messages. Wedesigned and implemented a communication model based on the Java Messaging Service (JMS) API, which isa Java Message Oriented Middleware (MOM) API for sending messages between two or more clients. We useApache ActiveMQ as a JMS provider that manages the sessions and queues.
As shown in Figure 3.1 VieSLAF framework represents an actuator mediating between inconsistent SLAtemplates and bootstrapping between different protocols. In the following we discuss how the VieSLAF con-tributes to the implementation of the MAPE cycle in self-adaptable Cloud services considering service negotia-tion phase.
3.2. Negotiation Bootstrapping and Service Mediation. Figure 3.2 depicts how the principles ofautonomic computing can be applied to negotiation bootstrapping and service mediation. As a prerequisite ofthe negotiation bootstrapping users have to specify meta-negotiation document describing the requirements ofa negotiation, as for example required negotiation protocols, required security infrastructure, provided docu-ment specification languages, etc. During the monitorig phase all candidate services are detected which neednegotiation bootstrapping, e.g. which do not have matching negotiation protocol with the potential consumer.During the analysis phase existing knowledge base is queried and potential bootstrapping strategies are found.In case of missing bootstrapping strategies users can define in a semi-automatic way new strategies (planningphase). Finally, during the execution phase the negotiation is started by utilizing appropriate bootstrappingstrategies.
The same procedure can be applied to service mediation. During the service negotiation inconsistenciesin SLA templates may be discovered (monitoring phase). During the analysis phase existing SLA mappingsare analyzed. During the planning phase new SLA mappings can be defined, if existing mappings cannot beapplied. Finally, during the execution phase the newly defined SLA mappings can be applied.
As indicated with bold borders in Figure 3.2, in this paper we present solutions for the definition andaccomplishment of meta-negotiations (Section 5) and for the specification and applications of SLA mappings(Section 4) as described next.
4. Service Mediation with SLA Mappings. In the presented approach each SLA template has to bepublished into a registry where negotiation partners i. e., provider and consumer, can find each other. Themanagement of SLA mappings and published services is presented in Section 4.1. The transformations betweenremote and local SLA templates are discussed in Section 4.2. Finally, an example SLA mapping document ispresented in Section 4.3.
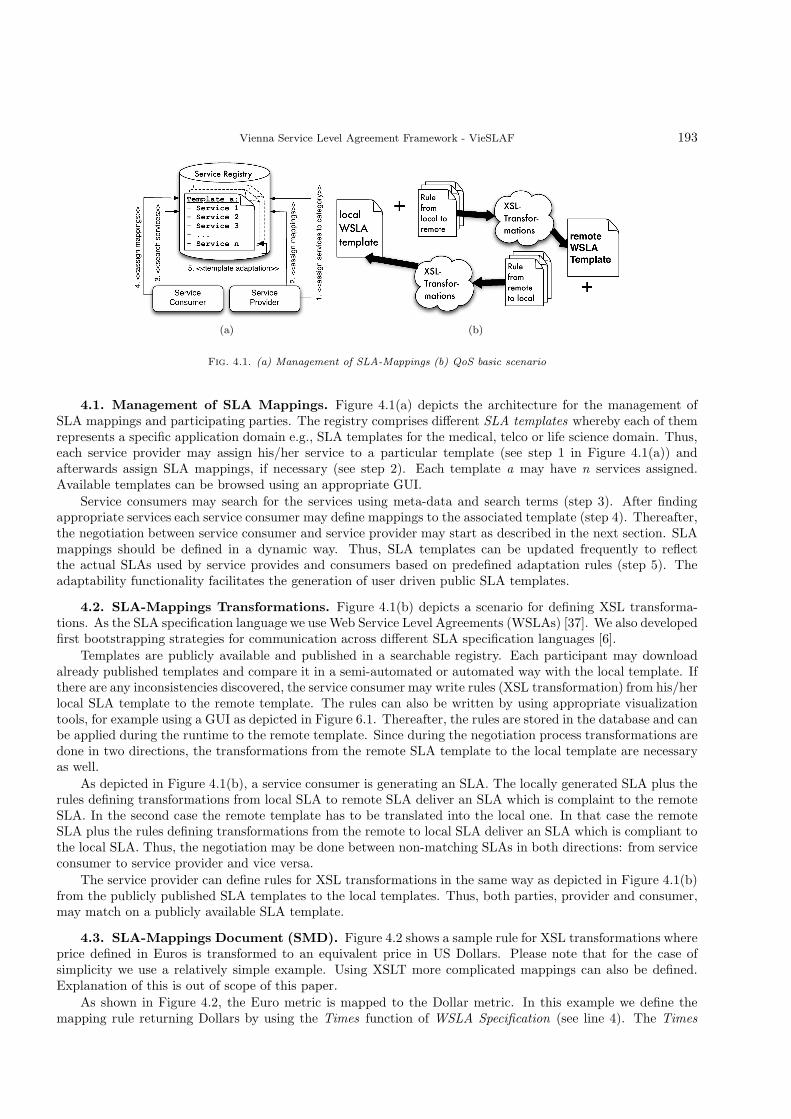
Vienna Service Level Agreement Framework - VieSLAF 193
(a) (b)
Fig. 4.1. (a) Management of SLA-Mappings (b) QoS basic scenario
4.1. Management of SLA Mappings. Figure 4.1(a) depicts the architecture for the management ofSLA mappings and participating parties. The registry comprises different SLA templates whereby each of themrepresents a specific application domain e.g., SLA templates for the medical, telco or life science domain. Thus,each service provider may assign his/her service to a particular template (see step 1 in Figure 4.1(a)) andafterwards assign SLA mappings, if necessary (see step 2). Each template a may have n services assigned.Available templates can be browsed using an appropriate GUI.
Service consumers may search for the services using meta-data and search terms (step 3). After findingappropriate services each service consumer may define mappings to the associated template (step 4). Thereafter,the negotiation between service consumer and service provider may start as described in the next section. SLAmappings should be defined in a dynamic way. Thus, SLA templates can be updated frequently to reflectthe actual SLAs used by service provides and consumers based on predefined adaptation rules (step 5). Theadaptability functionality facilitates the generation of user driven public SLA templates.
4.2. SLA-Mappings Transformations. Figure 4.1(b) depicts a scenario for defining XSL transforma-tions. As the SLA specification language we use Web Service Level Agreements (WSLAs) [37]. We also developedfirst bootstrapping strategies for communication across different SLA specification languages [6].
Templates are publicly available and published in a searchable registry. Each participant may downloadalready published templates and compare it in a semi-automated or automated way with the local template. Ifthere are any inconsistencies discovered, the service consumer may write rules (XSL transformation) from his/herlocal SLA template to the remote template. The rules can also be written by using appropriate visualizationtools, for example using a GUI as depicted in Figure 6.1. Thereafter, the rules are stored in the database and canbe applied during the runtime to the remote template. Since during the negotiation process transformations aredone in two directions, the transformations from the remote SLA template to the local template are necessaryas well.
As depicted in Figure 4.1(b), a service consumer is generating an SLA. The locally generated SLA plus therules defining transformations from local SLA to remote SLA deliver an SLA which is complaint to the remoteSLA. In the second case the remote template has to be translated into the local one. In that case the remoteSLA plus the rules defining transformations from the remote to local SLA deliver an SLA which is compliant tothe local SLA. Thus, the negotiation may be done between non-matching SLAs in both directions: from serviceconsumer to service provider and vice versa.
The service provider can define rules for XSL transformations in the same way as depicted in Figure 4.1(b)from the publicly published SLA templates to the local templates. Thus, both parties, provider and consumer,may match on a publicly available SLA template.
4.3. SLA-Mappings Document (SMD). Figure 4.2 shows a sample rule for XSL transformations whereprice defined in Euros is transformed to an equivalent price in US Dollars. Please note that for the case ofsimplicity we use a relatively simple example. Using XSLT more complicated mappings can also be defined.Explanation of this is out of scope of this paper.
As shown in Figure 4.2, the Euro metric is mapped to the Dollar metric. In this example we define themapping rule returning Dollars by using the Times function of WSLA Specification (see line 4). The Times

194 I. Brandic, D. Music, S. Dustdar
1.~\dots2. <xsl:template \dots >
3. <xsl:element name="Function" \dots >4. <xsl:attribute name="type"> <xsl:text>Times</xsl:text> </xsl:attribute>
5. <xsl:attribute name="resultType"> <xsl:text>double</xsl:text> </xsl:attribute>6. <xsl:element name="Operand" \dots >7. <xsl:copy> <xsl:copy-of select="@*|node()"/> </xsl:copy>
8. </xsl:element>9. <xsl:element name="Operand" \dots >
10. <xsl:element name="FloatScalar" \dots > <xsl:text>1.27559</xsl:text> </xsl:element>11. </xsl:element>
12. </xsl:element>13.</xsl:template>14\dots .
Fig. 4.2. Example XSL Transformation
Fig. 5.1. Meta-negotiation phases
function multiplies two operands: the first operand is the Dollar amount as selected in line 7, the second operandis the Dollar/Euro quote (1.27559) as specified in line 10. The dollar/euro quote can be retrieved by a Webservice and is usually not hard coded.
With similar mapping rules users can map simple syntax values (values of some attributes etc.), but theycan even define complex semantic mappings with considerable logic. Thus, even syntactically and semanticallydifferent SLA templates can be translated into each other.
5. Negotiation Bootstrapping with Meta-negotiations. In this section, we present an example sce-nario for the meta-negotiation architecture and describe the document structure for publishing negotiationdetails into the meta-negotiation registry.
5.1. Scenario. As depicted in Figure 5.1, the meta-negotiation infrastructure can be employed in thefollowing manner:Publish. A service provider publishes descriptions and conditions of supported negotiation protocols into the
registry (see Section 6).Lookup. Service consumers perform lookup on the registry database by submitting their own documents
describing the negotiations that they are looking for.Match. The registry discovers service providers who support the negotiation processes that a consumer is
interested in and returns the documents published by the service providers.Negotiate. Finally, after an appropriate service provider and a negotiation protocol is selected by a consumer
using his/her private selection strategy, negotiations between them may start according to the conditionsspecified in the provider’s document.
Note that in this scenario, the consumer is looking for an appropriate service provider. The reverse mayhappen as well, wherein a consumer advertises a job or a task to be carried out and many providers bid tocomplete it. In such cases, the providers would perform the lookup.
5.2. Registry Document. The participants publishing into the registry follow a common documentstructure that makes it easy to discover matching documents. This document structure is presented in Figure 5.2and consists of the following main sections. Each document is enclosed within the
<meta-negotiation>...</meta-negotiation>
tags. The document contains an <entity> elements defining contact information, organization and ID ofthe participant. The <ID> element defines the unique identifier given to the meta-negotiation document bythe registry. The publisher can update or delete the document using the identifier. Each meta-negotiation

Vienna Service Level Agreement Framework - VieSLAF 195
1. <meta-negotiation
2. xmlns:xsi="\dots ‘‘xsi:noNamespaceSchemaLocation="\dots ‘‘>3. <entity>4. <contact name="\dots ‘‘ phoneNumber="\dots ‘‘ />
5. <organization name= ‘‘University of \dots ‘‘6.~\dots
7. <ID name="1234"/>8. </entity>9. <pre-requisite>
10. <role name="consumer"/>11. <security> <authentication value="GSI location="uri"/> </security>
12. <negotiation-terms>13. <negotiation-term name="beginTime"/>
14. <negotiation-term name="endTime"/>15. <negotiation-term name="price"/>16. </negotiation-terms>
17. </pre-requisite>18. <negotiation>
19. <document name="WSLA" value="uri" version="1.0" />20. <document name="WS-Agreements" value="uri" version="1.0" />21. <protocol name="alternateOffers" schema="uri" version="1.0" location="uri"/>
22. </negotiation>23. <agreement>
24. <confirmation name="arbitrationService" value="uri"/>25. </agreement>
26. </meta-negotiation>
Fig. 5.2. Example document for meta-negotiation registry
comprises three distinguishing parts, namely pre-requisites, negotiation and agreement as described in thefollowing paragraphs.
Pre-requisites. The conditions to be satisfied before negotiations are defined within the <pre-requisite>
element (see Figure 5.2, lines 9–17). Pre-requisites define the role a participating party takes in a negotiation,the security credentials and the negotiation terms. The <role> element defines whether the specific party wantsto engage in the negotiation as a provider or as a consumer of resources. The <security> element specifiesthe authentication and authorization mechanisms that the party wants to apply before starting the negotiationprocess. For example, in Figure 5.2, the consumer requires that the other party should be authenticated throughthe Grid Security Infrastructure (GSI) [15] (line 11). The negotiation terms specify QoS attributes that a partyis willing to negotiate and are specified in the <negotiation-term> element. For example, in Figure 5.2, thenegotiation terms of the consumer are beginTime, endTime, and price (lines 13–15).
Negotiation. Details about the negotiation process are defined within the<negotiation> element. In Figure 5.2, the consumer supports two document languages and one negotiationprotocol. Each document language is specified within <document> element. In Figure 5.2, WSLA and WS-Agreements are specified as supported document languages. Additional attributes specify the URI (UniformResource Indicator) to the API or WSDL for the documents and their versions supported by the consumer (lines18–22). In Figure 5.2, AlternateOffers is specified as the supported negotiation protocol. In addition to thename, version, and schema attributes, the URI to the WSDL or API of the negotiation protocols is specifiedby the location attribute (line 21).
Agreement. Once the negotiation has concluded and if both parties agree to the terms, then they haveto sign an agreement. This agreement may be verified by a third party organization or may be lodged withanother institution who will also arbitrate in case of a dispute. These modalities are specified within the<agreement> clause of the meta-negotiation document. For example, in Figure 5.2, a third party service, calledarbitrationService, is specified for confirming the agreement between the two parties.
6. VieSLAF framework. In this section we present the architecture used for the semi-automatic man-agement of meta-negotiations and SLA mappings. We discuss a sample architectural case study exemplifyingthe usage of VieSLAF. Thereafter, we describe each VieSLAF ’s core component in detail.
6.1. VieSLAF architecture. As discussed in Section 3 VieSLAF framework represents the first proto-type for the management of self-governing ICT Infrastructures. The VieSLAF framework enables applicationdevelopers to efficiently develop adaptable service-oriented applications simplifying the handling with numerousWeb service specifications. The framework facilitates management of QoS models as for example management ofmeta-negotiations [8] and SLA mappings [7]. Based on VieSLAF framework service provider may easily manage

196 I. Brandic, D. Music, S. Dustdar
Fig. 6.1. VieSLAF Architecture
QoS models and SLA templates and frequently check whether selected services satisfy developer’s needs e.g.,specified QoS-parameters in SLAs. Furthermore, we discuss basic ideas about the adaptation of SLA templates.
We describe the VieSLAF components based on Figure 6.1. As shown in step (1) in Figure 6.1 usersmay access the registry using a GUI, browse through existing templates and meta-negotiation documents usingthe MN and SLA mapping middleware. In the next step (2), service provider specify MN documents andSLA mappings using the MN and SLA mapping middleware and submit it to the registry. Thereafter, in step(3), service consumer may query existing meta-negotiation documents, define own SLA mappings to remotetemplates. MN and SLA mapping middleware on both sides (provider’s and consumer’s) facilitate managementof MNs and SLA mappings. Submitted MN documents and SLA mappings are parsed and mapped to apredefined data model (step 4). After meta-negotiation and preselection of services, service negotiation maystart using the negotiation protocols, document languages, and security standards as specified in the MNdocument (step 5). During the negotiation SLA mappings and XSLT transformations are applied (step 6).After the negotiation, invocation of the service methods may start (step 7). SLA parameters are monitoredusing the monitoring service (step 8). Based on the submitted SLA mapping publicly available SLA templatesare adapted reflecting the majority of local SLA templates (step 9).
6.1.1. Knowledge Base. As shown in Figure 6.1 knowledge base is responsible for storing SLA tem-plates, SLA mappings and meta-negotiation documents. For storing of SLA templates and MN documentswe implemented registries, representing searchable repositories. Currently, we implemented a MS-SQL 2008database with a Web service front end that provides the interface for the management of SLA mappings and aPostgreSQL for the management of meta-negotiations. Thus, for scalability issues we rather intent to host theregistries using a cloud of databases hosted on a service provider such as Google App Engine [14] or Amazon S3[2]. The database is manipulated based on the role-model. The registry methods are implemented as WindowsCommunication Foundation (WCF) services and can be accessed only with the appropriate access rights. Wedefine three roles: service consumer, service provider and registry administrator. Service consumers are ableto search suitable services for the selected service categories e.g., by using the method findServices. Serviceconsumer may also create SLA mappings using the method createAttributeMapping. Service providers maypublish their services and bind it to a specific template category using the method createService. Furthermore,both service consumer and provider may submit and query MN documents.
6.2. Meta-negotiation Middleware. The meta-negotiation middleware facilitates publishing of themeta-negotiation documents into the registry and the integration of the meta-negotiation framework into theexisting client and/or service infrastructure, including, for example, negotiation or security clients. Besides

Vienna Service Level Agreement Framework - VieSLAF 197
Fig. 6.2. Meta-negotiation middleware
acting as a client for publishing and querying meta-negotiation documents (steps 1 and 2 in Figure 6.1), themiddleware delivers necessary information for the existing negotiation clients, i. e. information for the estab-lishment of the negotiation sessions (step 4, Figure 6.1) and information necessary to start a negotiation (step5 in Figure 6.1). As shown in Figure 6.1 each service consumer may negotiate with multiple service providersconcurrently. As mentioned in Section 5 even the reverse may happen as well, wherein a consumer advertises ajob. In such cases, the providers would negotiate with multiple consumers.
After querying the registry and applying a client-based strategy for the selection of the appropriate ser-vice, the information from the service’s meta-negotiation document is parsed. Thereafter, meta-negotiationinformation is incorporated into the existing client software using a dependency injection framework such asSpring1. This dependency injection follows an Inversion of Control approach wherein the software is configuredat runtime to invoke services that are discovered dynamically rather than known and referenced beforehand.This is suitable for meta-negotiation wherein a participant discovers others at runtime through the registryand has to dynamically adapt based on the interfaces provided by his counterpart (usually through a WSDLdocument).
Figure 6.2 shows an example of how this would work in practice. On the consumer side, the middlewarequeries the registry and obtains matching meta-negotiation documents. The middleware parses the meta-negotiation document of the selected provider and dynamically injects the interfaces discovered from the WSDLsin the document for security, negotiation and arbitration services into the existing abstract clients. Currently,we support semi-automatic integration of existing clients into meta-negotiation middleware wherein the existingclients are extended with the XML-based configuration files which are then automatically populated with thediscovered interfaces.
6.2.1. SLA Mapping Middleware. As already mentioned in Section 6.1.1 SLA mapping middleware isbased on different WCF services. For the sake of brevity, in the following we discuss just a few of them. TheRegistryAdministrationService provides methods for the manipulation of the database where administrator rightsare required e.g., creation of template categories. Another example represents WSLAMappingService, which isused for the management of SLA mappings by service consumer and service provider. WSLAQueryingServiceis used to query the SLA mapping database. The database can be queried based on template categories, SLAattributes and similar attributes. Other implemented WCF service are for example services for SLA parsing,XSL transformations, and SLA validation.
Service consumers may search for appropriate services through WSLAQueryingService and define appro-priate SLA mappings by using the method createAttributeMapping. Each query request is checked during theruntime, if the service consumer has also specified any SLA mappings for SLAElements and SLAAttributes spec-ified in the category’s SLA template. Before the requests of service consumers can be completely checked, SLAtransformations are applied. The rules necessary for the transformations of attributes and elements can be foundin the database and can be applied using the consumer’s SLA template. Thereafter, we have the consumer’stemplate completely translated into category’s SLA template. Transformations are done by WSLATransforma-
1http://www.springframework.org/

198 I. Brandic, D. Music, S. Dustdar
tor implemented with the .NET 3.5 technology and using LINQ2. In the following we explain monitoring andadaptation service in more detail.
Monitoring Service. As depicted in Figure 6.1, we implemented a lightweight concept for monitoring of SLAparameters for all services published in a specific template category. The aim of the monitoring service is tofrequently check the status of the SLA parameters of an SLA agreement and deliver information to the serviceconsumer and/or provider. Monitoring starts after publishing a service in a category and is provided throughthe whole lifetime of the service. Monitoring service is implemented as an internal registry service, similar toother services for parsing, transformation, and validation, that we have already explained in previous sections.Resources are monitored by host monitor using arbitrary monitoring tools (e.g. Ganglia). Resources metricsinclude e.g., down-time, up-time, available storage. Based on the predefined mappings stored in a database,monitored metrics are periodically mapped to the SLA parameters as described in [11].
After publishing service and SLA mappings, SLAs are parsed and it is identified which SLA parameters haveto be monitored and how. We distinguish between periodically measured SLA parameters and the parameterswhich are measured on request. The values of the periodically measured parameters are stored in the so-calledparameter-pool. The monitoring service provides two methods: a knock-in method for starting the monitoringand a method for receiving the measured SLA parameters from the measurement pool. Whenever a user requestsmonitoring information of the particular SLA (i) SLAs parameters are requested from the parameter-pool incase of periodically measured parameters or (ii) SLA parameters are immediately measured as defined in theparsed and validated SLAs in case of on-request parameters.
Adaptation Service. Remote SLA templates should not be defined in a static way, they should reflectprovider’s and consumer’s needs. We implemented a first prototype of an internal registry’s adaptation service.Thereby, mappings supplied by the consumers or the providers are evaluated. Based on the evaluation outcomea new version of the particular SLA template can be automatically defined.
Each SLA mapping can be defined as a ParameterWish (add/delete) and stored as an XML chunk. Registryadministrators have to configure a learning capability property for each template category. Regression modelsrepresent one of the promising learning functions. Whenever a new ParameterWish is accepted a new revisioncategory of an SLA template is generated. All services and consumers who voted for that specific wish areautomatically re-published to the new revision. Also all SLA mappings are automatically assigned to the newtemplate revision. Old SLA mappings of the consumers and services are deleted and also all old backgroundthreads used for calculation for old SLA template are aborted. The newly generated SLA template is thereafterparsed and new background monitoring threads are created and started for each service. Thus, based on thepresented adaptation approach public templates can be derived in a user driven way reflecting the majority oflocal templates. Application of the learning functions is discussed in more detail in Section 7.3.2.
7. VieSLAF Evaluation and Case Studies. In this section we evaluate the VieSLAF framework. InSection 7.1 we evaluate SLA mappings. In Section we 7.2 we evaluate meta-negotiations. In Section 7.3 wereport some successful VieSLAF case studies.
7.1. Evaluation of SLA mappings. In Section 7.1.1 we measure the overhead produced by SLA map-pings compared to Web service invocation without mappings. We describe the experimental testbed and thesetup used. Thereafter, we discuss the experimental results. In Section 7.1.2 we discuss stress tests with thevarying number of concurrently invoked SLA mappings. In Section 7.1.3 we present results with the varyingnumber of SLA mappings per single Web service invocation.
7.1.1. Overhead Test. In order to test the VieSLAF framework we developed a testbed as shown inFigure 7.1(a). As a client machine we used an Acer Aspire Laptop, Intel Core 2 Duo T5600 1.83 GHz, 2MB L2 Cache, 1GB RAM. For hosting of 10 sample services, calculator services with 5 methods, we useda single core Xenon 3.2Ghz, L1 cache, 4GB RAM Sun blade machine. We use the same machine to hostVieSLAF s WCF services. The aim of our evaluation is to measure the overhead produced using VieSLAF ’sWSLAQueryingService for search and mappings of the appropriate services.
We created 10 services (S1,. . . , S10) and 10 accounts for service providers. We also created the registryadministrator’s role, which manages the creation of template categories with the corresponding SLA templates.The SLA template represents a remote calculator service with five methods: Add, Subtract, Multiply, Divideand Max. Both, the provider and the consumers define five SLAMappings, which have to be used during the
2Language Integrated Query

Vienna Service Level Agreement Framework - VieSLAF 199
(a) (b)
Fig. 7.1. VieSLAF Testbed (a) for the evaluation of SLA mappings and (b) meta-negotiations
Table 7.1SLA Mappings Overhead Compared to Simple Web Service Invocation (Without SLA Mappings)
Service Search Time TotalSLA-Mapping Remaining Time
Validation Consumer Map. Provider Map.
Time in sec 0.046 0.183 0.151 1.009 1.389Time [%] 3.32 13.17 10.87 72.64 100.00
runtime. We specify three simple, syntactic mappings where we only change the name of an element or attribute.The other two mappings consider also semantic mappings, where we map between structurally different SLAtemplates.
Table 7.1 shows the experimental results. The measured values represent the arithmetic mean of 20 serviceinvocations. The overhead measured during the experimental results includes the time needed for validationof SLA documents (column Validation in Table 7.1), the time necessary to perform mappings from the localconsumers to the remote SLA templates (column Consumer Mapping) and the time necessary to transformthe remote SLA templates to the local providers (column Provider Mapping). Furthermore, we measured theremaining time necessary to perform a search. The remaining time includes the round trip time for a searchincluding data transfer between the client and the service and vise versa. As shown in Table 7.1 the timenecessary to handle SLA mappings (V alidation + ConsumerMapping + ProviderMapping) represents 0.38seconds or 27, 36% of the overall search time.
Please note that the intention of the presented experimental results is the proof of concept of the SLAmapping approach. We did not test the scalability issues, since we intend to employ computing Clouds likeGoogle App Engine [14] or Amazon S3 [2] in order to cope with the scalability issues.
7.1.2. Stress Tests. In this section we describe tests on how the VieSLAF middleware copes with themultiple SLA mappings executed concurrently with differing complexity. Evaluation is done on an Acer AspireLaptop, Intel Core 2 Duo T5600 1.83 GHz, 2 MB L2 Cache, 1GB RAM. For the evaluation we have used twodifferent SLA mappings:
• Simple: Invocation of the simple SLA mappings, an example is translation of one attribute to anotherattribute e.g., usage price to price.
• Complex: Represents the invocation of the complex SLA mappings, as for example semantic mappingsconsidering two structurally different SLA templates.
We tested VieSLAF with different versions of XSLT transformers, namely with XSLTCompiledTransform,.Net version 3.0 and with the obsolete XSLTTransform Class from .Net 1.1. Figure 7.2(a) shows the measure-ments with the XSLTCompiledTransform Transformer and with the XSLTTransform Class. The x axis depictsthe number of SLA mappings performed concurrently i. e., number of runs. The y axis depicts the measuredtime for the execution of SLA mappings in seconds.
Considering the measurement results we can observe that the XSLTTransform Class is faster than theXSLTCompiledTransform Transformer from the newer .Net version. Complex mappings executed with theXSLTTransform Class almost overlap with the simple mappings executed with the XSLTCompiledTransform.

200 I. Brandic, D. Music, S. Dustdar
(a) (b)
Fig. 7.2. (a)Stress Tests with XSLTCompiledTransform Transformer and XSLTTransform Class (b) Measurements withvarying number of SLA mappings per Web Service Invocation
We can observe that in both cases, simple and complex mapping, the performance starts to significantly decreasewith the number of SLA mappings > 100. If the number of mappings < 100, the execution time is about orless than 1 second.
7.1.3. Multiple SLA Mapping Tests. In this section we discuss performance results measured duringa Web service call with varying numbers of SLA mappings per service. We measured 5, 10, 15 and 20 SLAmappings per Web service call. In order to create a realistic testbed we used SLA mappings which depend oneach other: e.g., attribute A is transformed to attribute B, B is transformed to C, C to D, and so on. Thus, wesimulate the worst case, where SLA mappings can not be performed concurrently, they have to be performedsequentially.
Evaluation is done on an Acer Aspire Laptop, Intel Core 2 Duo T5600 1.83 GHz, 2 MB L2 Cache, 1GB RAM.Figure 7.2(b) shows measured results. The x axis depicts the number of SLA mappings performed concurrentlyor sequentially considering attribute dependencies. The y axis depicts the measured time for the execution ofSLA mappings in milliseconds. We executed SLA mappings between the remote template and the provider’stemplate (i. e., provider mappings as described in Table 7.1) before the runtime, because these mappingsare known before consumer requests. Thus, only mappings between the consumer’s template and the remotetemplate are done during the runtime as indicated with the SLA Mapping line. The line SLA Mapping + Clientinvocation comprises the time for the invocation of a Web service method including SLA mapping time. TheSLA Mapping + Client invocation line does not comprise round-trip time, it comprises only the request time.
We can conclude that even with the increasing number of SLA mappings and considering the worst casescenario with sequentially performed mappings the SLA mapping time represents about 20% of the overallexecution time.
7.2. Evaluation of the Meta-Negotiation Approach. In this section we evaluate the meta-negotiationapproach as shown in Figure 7.1(b). We have used the Gridbus broker [32] as an example service consumer andan enterprise Grid constructed using Aneka [10] as a service provider. The aim of this evaluation was to testthe overhead of the meta-negotiation infrastructure on the overall negotiation process.
7.2.1. Testbed. As shown in Figure 7.1, we deployed the registry in a machine running Windows Server2003. The registry was accessible through a Web service interface and used a PostgreSQL database on itsbackend. Since the aim of these experiments was only to test the meta-negotiation framework, we isolatedthe Negotiation Service from the resource management system. Hence, it would reject any proposal for nodereservation as it would not be able to determine node availability. We deployed 20 such services—(S1,. . . S10)on machines in a student lab in the Department of Computer Science and Software Engineering, Universityof Melbourne, Australia and (S11,. . . S20) on machines in the Department of Communication Computer andSystem Sciences, University of Genova, Italy. Negotiations with services located in Melbourne would terminatein single rounds (a proposal followed by a rejection). Services located in Italy would terminate after 2 retries. Wepublished a meta-negotiation document for each service into the registry with different negotiation terms anddocument languages. The Gridbus broker was started on a machine in the Department of Computer Science,University of Melbourne and queried the registry in order to select an appropriate service provider. It wouldthen open a negotiation process with the selected Aneka Negotiation Service.

Vienna Service Level Agreement Framework - VieSLAF 201
Table 7.2Experimental results of the meta negotiation approach
Overall Negotiation TotalMeta-Negotiation NegotiationQuerying Parsing
Time in sec 2.91 0.02 15.10 18.03Time [%] 16.16 0.01 83.73 100.00
(a) (b)
Fig. 7.3. (a) Architecture for the SLA-based Resource Virtualization [20] (b) Lifecycle of the SLA Template as used in [29]
7.2.2. Experimental Results. The results of our evaluation are shown in Table 7.2. As shown in Ta-ble 7.2 the time necessary to query the registry represents 2.91 seconds or 16.16% of the overall negotiationtime. Query time is calculated as the time necessary to get the list of the IDs, i. e. invocation of the methodquery(XMLdocument), plus the time necessary to fetch each document, i. e. multiple invocations of the methodgetDocument(ID). The time necessary to fetch each document represents about 0.2 sec. Thus, in our experi-ments we fetched about 15 XML documents in average, since 2.91/0.2 ≈ 15. Please note, that all times usedin Table 7.1 are average times measured over 10 rounds. Time necessary to parse the selected meta-negotiationdocument and to inject the WSDL information into the client is 0.02 seconds or 0.01% of the overall negotiationtime. Thus, time for the completion of the meta-negotiation is 2.93 seconds or 16.17% of the overall negotiationtime. The time for the meta-negotiation is calculated as the the sum of the time necessary to query the registry(2.91 seconds) and the time necessary to parse the selected meta document (0.02 seconds).
The time necessary to negotiate with an Aneka service represents 15.10 seconds or 83.73% of the overallnegotiation time. We observed that the negotiation time with services located in Italy represents about 15seconds (due to 2 retries), since the time necessary to negotiate with services located in Melbourne representsabout 5 seconds. Thus, in our experiments we have obviously negotiated only with services located in Italy. Westarted an alternate offers negotiation with only one round. Thus, the overall negotiation time is 18.03 seconds.Overall negotiation time is calculated as the sum of the time necessary to complete the meta-negotiation andtime necessary to complete the negotiation.
Considering the fact that the time necessary to complete a meta-negotiation represents only 16.17% of theoverall negotiation time, and considering the fact that we have used negotiations with only one round, we canshow that the overhead of the meta-negotiations do not significantly influence the overall negotiation time.
With the presented experiments we demonstrated the applicability of our approach to the proposed archi-tecture. Since we plan to use computational clouds in the future, the intention of the presented experimentswas not to test the scalability of our approach.
7.3. Case Studies. Besides FoSII project, which was the primary reason for the development of theVieSLAF framework, VieSLAF has been successfully applied to additional case studies. In Section 7.3.1 wediscuss SLA-based resource virtualization approach for on-demand service provision. In Section 7.3.2 we discussthe application of VieSLAF framework for the liquidity management in Cloud markets.
7.3.1. An SLA-based Resource Virtualization Approach For On-demand Service Provision.As discussed in [20] VieSLAF’s meta-negotiation concept has been successfully utilized for the realization of the

202 I. Brandic, D. Music, S. Dustdar
SLA based resource virtualization environment. Thereby, an integrative infrastructure has been provided foron demand service provision based on SLAs. As depicted in Figure 7.3(a) users describe the requirements foran SLA negotiation on a high level using the concept of meta-negotiations (MN). During the meta-negotiationonly those services are selected, which understand specific SLA document language and negotiation strategyor provide a specific security infrastructure. After the meta-negotiation process, a meta-broker (MB) selectsa broker that is capable of deploying a service with the specified user requirements. Thereafter, the selectedbroker negotiates with virtual or physical resources (R) using the requested SLA document language and usingthe specified negotiation strategy. Once the SLA negotiation is concluded, service (S) can be deployed on theselected resource using the Automatic Service Dployer (ASD).
7.3.2. Liquidity Management in Cloud Markets. As discussed in [29] we demonstrated the problemscaused in computational Cloud markets by a large number of resource definitions, namely low liquidity for eachavailable resource type. To counteract this problem, we applied SLA mappings, which ensures sufficient liquidityin the market. SLA mapping techniques not only simplify the search for similar offers but also allow us to derivepublic SLA templates from all existing offerings (i. e. consumer-defined service level contracts or unsigned servicelevel agreements). Figure 7.3(b) depicts the lifecycle of a public template. As indicated through step (1), weassume that for specific domains, specific SLA templates are generated, e.g. medicine, telecommunication.These generated SLA templates are then published in the public registry (step (2)). At the same time, learningfunctions for the adaptation of these public SLA templates are defined. Thereafter, SLA mappings are definedmanually by users (step (3)). During the lifetime of an SLA template adaptation of SLA mappings are doneautomatically as described in Section 6 (step (4)). Based on the learning function and based on the submittedSLA mappings, a new version of the SLA template can be defined and published in the registry (step (5)).
8. Conclusion and Future Work. In this paper we presented the goals of the Foundations of Self-Governing ICT Infrastructures (FoSII) project and how these goals can be achieved using the principles ofautonomic computing. We discussed novel meta-negotiation and SLA mapping solutions for Cloud servicesbridging the gap between current QoS models and Cloud middleware and representing important prerequisitesfor the establishment of autonomic Cloud services. We discussed the approaches for meta-negotiation andSLA mapping representing implementation of negotiation bootstrapping and service mediation approaches.Furthermore, we presented the VieSLAF framework used for the management of meta-negotiations and SLAmappings. We discussed how SLA templates can be adapted based on the submitted SLA mappings. Wepresented performance evaluation of the VieSLAF representing first proof of concepts. Moreover, we brieflyintroduced two case studies, namely the SLA-based resource virtualization approach for on-demand serviceprovision and the approach for the liquidity management in Cloud markets. Both case studies showed theimpact of the VieSLAF framework beyond the aforementioned FoSII project.
In the future we will improve learning function and facilitate different knowledge management methods asfor example case based reasoning.
Acknowledgments. The work described in this paper was partially supported by the Vienna Science andTechnology Fund (WWTF) under grant agreement ICT08-018 Foundations of Self-governing ICT Infrastructures(FoSII). The authors want to thank Vincent C. Emeakaroha for carefully proofreading the paper.
REFERENCES
[1] R. J. Al-Ali, O. F. Rana, D. W. Walker, S. Jha, and S. Sohail. G-qosm: Grid service discovery using qos properties. Computingand Informatics, 21:363–382, 2002.
[2] Amazon Elastic Compute Cloud (Amazon EC2), http://aws.amazon.com/ec2/[3] D. Ardagna, G. Giunta, N. Ingraffia, R. Mirandola, and B. Pernici. QoS-Driven Web Services Selection in Autonomic Grid
Environments. Grid Computing, High Performance and Distributed Applications (GADA) 2006 Internat. Conference,Montpellier, France, Oct 29 - Nov 3, 2006.
[4] D. Bein, A. K. Datta, S. Yellenki.A Link-Cluster Route Discovery Protocol For ad hoc Networks. Scalable Computing: Practiceand Experience Volume 9, Number 1, pp. 21–28, 2008.
[5] I. Brandic. Towards Self-manageable Cloud Services. RTSOAA 2009, in conjunction with the 33rd Annual IEEE InternationalComputer Software and Applications Conference, Seattle, USA, July 2009.
[6] I. Brandic, D. Music, S. Dustdar. Service Mediation and Negotiation Bootstrapping as First Achievements Towards Self-adaptable Grid and Cloud Services. Grids meet Autonomic Computing Workshop 2009 - GMAC09. In conjunction withthe 6th International Conference on Autonomic Computing and Communications Barcelona, Spain, June 15–19, 2009.

Vienna Service Level Agreement Framework - VieSLAF 203
[7] I. Brandic, D. Music, Ph. Leitner, S. Dustdar. VieSLAF Framework: Enabling Adaptive and Versatile SLA-Management.The 6th International Workshop on Grid Economics and Business Models 2009 (Gecon09). In conjunction with Euro-Par2009, 25–28 August 2009, Delft, The Netherlands
[8] I. Brandic, S. Venugopal, Michael Mattess, and Raykumar Buyya. Towards a Meta-Negotiation Architecture for SLA-AwareGrid Services. Workshop on Service-Oriented Engineering and Optimizations 2008. In conjunction with InternationalConference on High Performance Computing 2008 (HiPC 2008), Bangalore, India, December 17–20, 2008.
[9] R. Buyya, Ch. S. Yeo, S. Venugopal, J. Broberg, and I. Brandic. Cloud Computing and Emerging IT Platforms: Vision, Hype,and Reality for Delivering Computing as the 5th Utility. Future Generation Computer Systems, 25(6):599-616, June 2009.
[10] X. Chu, K. Nadiminti, Ch. Jin, S. Venugopal, and R. Buyya Aneka: Next-Generation Enterprise Grid Platform for e-Scienceand e-Business Applications. Proceedings of the 3rd IEEE International Conference on e-Science and Grid Computing(e-Science 2007), Dec. 10-13, 2007, Bangalore, India.
[11] V. C. Emeakaroha, I.Brandic, M. Maurer, S. Dustdar. Low Level Metrics to High Level SLAs-LoM2HiS framework: Bridgingthe gap between monitored metrics and SLA parameters in Cloud environments. The 2010 High Performance Computingand Simulation Conference (HPCS 2010) June 28—July 2, 2010, Caen, France. to appear.
[12] A. Dan, D. Davis, R. Kearney, A. Keller, R. King, D. Kuebler, H. Ludwig, M. Polan, M. Spreitzer, and A. Youssef. Webservices on demand: WSLA-driven automated management. IBM Systems Journal, 43(1), 2004.
[13] G. Dobson, A. Sanchez-Macian. Towards Unified QoS/SLA Ontologies. Proceedings of the 2006 IEEE Services ComputingWorkshops (SCW 2006), Chicago, Illinois, USA, 18-22 September 2006.
[14] Google App Engine, http://code.google.com/appengine[15] I. Foster, and C. Kesselman, and G. Tsudik, and S. Tuecke. A Security Architecture for Computational Grids, Proc. 5th
ACM Conference on Computer and Communications Security Conference, San Francisco, CA, USA, ACM Press, NewYork, USA, 1998.
[16] Foundations of Self-Governing ICT Infrastructures (FoSII) Project, http://www.wwtf.at/projects/research_projects/
details/index.php?PKEY=972_DE_O
[17] P. C. K. Hung, L. Haifei, and J. Jun-Jang. WS-Negotiation: an overview of research issues. Proceedings of the 37th AnnualHawaii International Conference on System Sciences, Big Island, Hawaii, 5-8 January 2004.
[18] Z. Hill, J. C. Rowanhill, A. Nguyen-Tuong, G. S. Wasson, J. C. Knight, J. Basney, M. Humphrey. Meeting virtual organizationperformance goals through adaptive grid reconfiguration. 8th IEEE/ACM International Conference on Grid Computing(Grid 2007), Austin, Texas, USA, September 19-21, 2007.
[19] J. O. Kephart, D.M. Chess, The vision of autonomic computing. Computer, 36:(1) pp. 41-50, Jan 2003.[20] A. Kertesz, G. Kecskemeti, I. Brandic. An SLA-based Resource Virtualization Approach for On-demand Service Provision.
VTDC 2009, In conjunction with the 6th International Conference on Autonomic Computing and CommunicationsBarcelona, Spain, June 15–19, 2009.
[21] B. Koller, L. Schubert. Towards autonomous SLA management using a proxy-like approach. Multiagent Grid Syst. 3(3),2007, IOS Press, Amsterdam, The Netherlands, The Netherlands.
[22] S. Konig, S. Hudert, T. Eymann, and M. Paolucci. Towards Reputation Enhanced Electronic Negotiations for ServiceOriented Computing. In Proceedings of the 11th International Workshop on Trust in Agent Societies (TRUST 2008),Estoril, Portugal, May 12-13, 2008.
[23] Z. Li, M. Parashar: An Infrastructure for Dynamic Composition of Grid Services. 7th IEEE/ACM International Conferenceon Grid Computing (Grid 2006), Barcelona, Spain, September 28-29, 2006.
[24] D. Nurmi, R. Wolski, Ch. Grzegorczyk, G. Obertelli, S. Soman, L. Youseff, D. Zagorodnov. The Eucalyptus Open-sourceCloud-computing System. Proceedings of Cloud Computing and Its Applications 2008, Chicago, Illinois, October 2008.
[25] D. M. Quan, J. Altmann. Resource allocation algorithm for light communication grid-based workflows within an SLA context.International Journal of Parallel, Emergent and Distributed Systems (IJPEDS), 24(1):31-48, 2009.
[26] N. Oldham, K. Verma, A. P. Sheth, and F. Hakimpour. Semantic WS-agreement partner selection. Proceedings of the 15thinternational conference on World Wide Web, WWW 2006, Edinburgh, Scotland, UK, May 23-26, 2006.
[27] D. Ouelhadj, J. Garibaldi, J. MacLaren, R. Sakellariou, and K. Krishnakumar. A multi-agent infrastructure and a servicelevel agreement negotiation protocol for robust scheduling in grid computing. in Proceedings of the 2005 European GridComputing Conference (EGC 2005), Amsterdam, The Netherlands, February, 2005.
[28] M.P. Papazoglou, P. Traverso, S. Dustdar, F. Leymann. Service-Oriented Computing: State of the Art and ResearchChallenges, IEEE Computer, 40(11): 64-71, November 2007
[29] Marcel Risch, Ivona Brandic, Jorn Altmann. Using SLA Mapping to Increase Market Liquidity. Workshop on Non FunctionalProperties and Service Level Agreements Management in Service Oriented Computing Workshop (NFPSLAM-SOC’09).The 7th International Joint Conference on Service Oriented Computing, November 23-27 2009, Stockholm,Sweden.
[30] B. Rochwerger, D. Breitgand, E. Levy, A. Galis, K. Nagin, I. M. Llorente, R. Montero, Y. Wolfsthal, E. Elmroth, J. Caceres,M. B.-Y., W. Emmerich, F. Galan. The RESERVOIR Model and Architecture for Open Federated Cloud Computing.,IBM Journal of Research and Development, 53(4) (2009)
[31] D. Thain, T. Tannenbaum, and M. Livny. Distributed Computing in Practice: The Condor Experience. Concurrency andComputation: Practice and Experience, Vol. 17, No. 2-4, pages 323-356, February-April, 2005.
[32] S. Venugopal, R. Buyya, and L. Winton, A Grid Service Broker for Scheduling e-Science Applications on Global Data Grids,Concurrency and Computation: Practice and Experience, 18(6): 685-699, Wiley Press, New York, USA, May 2006.
[33] W. Vambenepe, C. Thompson, V. Talwar, S. Rafaeli, B. Murray, D. S. Milojicic, S. Iyer, K. I. Farkas, M. F. Arlitt. Dealingwith Scale and Adaptation of Global Web Services Management. International Journal of Web Services Research, 4(3):65-84, 2007.
[34] D. W. Walker, L. Huang, O. F. Rana, and Y. Huang. Dynamic service selection in workflows using performance data.Scientific Programming 15(4):235-247, 2007.
[35] L.-H. Vu, F. Porto, K. Aberer, M. Hauswirth. An Extensible and Personalized Approach to QoS-enabled Service Discovery.,

204 I. Brandic, D. Music, S. Dustdar
Eleventh International Database Engineering and Applications Symposium (IDEAS 2007), Banff, Alberta, Canada,September 6-8, 2007.
[36] Web Services Agreement Specification (WS-Agreement), http://www.ogf.org/documents/GFD.107.pdf[37] Web Service Level Agreement (WSLA), http://www.research.ibm.com/wsla/WSLASpecV1-20030128.pdf[38] Ch. Zhou, L. T. Chia, and B. S. Lee. Semantics in service discovery and QoS measurement. IT Professional, 7(2): 29–34,
Mar-Apr 2005.
Edited by: Marcin PaprzyckiReceived: March 30, 2010Accepted: June 09, 2010

Scalable Computing: Practice and ExperienceVolume 11, Number 2, pp. 205–220. http://www.scpe.org
ISSN 1895-1767c© 2010 SCPE
LARGE SCALE PROBLEM SOLVING USING AUTOMATIC CODE GENERATION ANDDISTRIBUTED VISUALIZATION
ANDREI HUTANU†, ERIK SCHNETTER†‡, WERNER BENGER†, ELOISA BENTIVEGNA†, ALEX CLARY†§, PETER
DIENER†‡, JINGHUA GE†, ROBERT KOOIMA†¶, OLEG KOROBKIN†‡, KEXI LIU†¶, FRANK LOFFLER†, RAVI
PARUCHURI†, JIAN TAO†, CORNELIUS TOOLE†¶, ADAM YATES†, AND GABRIELLE ALLEN†¶
Abstract. Scientific computation faces multiple scalability challenges in trying to take advantage of the latest generationcompute, network and graphics hardware. We present a comprehensive approach to solving four important scalability challenges:programming productivity, scalability to large numbers of processors, I/O bandwidth, and interactive visualization of large data.We describe a scenario where our integrated system is applied in the field of numerical relativity. A solver for the governing Einsteinequations is generated and executed on a large computational cluster; the simulation output is distributed onto a distributed dataserver, and finally visualized using distributed visualization methods and high-speed networks. A demonstration of this system wasawarded first place in the IEEE SCALE 2009 Challenge.
Key words: computer algebra systems, high performance computing, distributed systems, high speed networks, problemsolving environment, scientific visualization, data intensive applications
1. Introduction. We describe the motivation, design, and experimental experiences of an end-to-endsystem for large scale, interactive and collaborative numerical simulation and visualization that addresses a setof fundamental scalability challenges for real world applications. This system was awarded first place in theIEEE SCALE 2009 Challenge in Shanghai, China in May 2009.
Our system shows a single end-to-end application capable of scaling to a large number of processors andwhose output can be visualized remotely by taking advantage of high speed networking capabilities and of GPU-based parallel graphics processing resources. The four scalability challenges that are addressed are describedbelow (see Figure 1.1).
1.1. Programming productivity. Programming productivity has long been a concern in the compu-tational science community: the ever-growing complexity of many scientific codes make the development andmaintenance of many large scale scientific applications an intimidating task. Things get even worse when one isdealing with extremely complicated systems such as the Einstein equations which, when discretized, typicallyresult in over 20 evolved variables and thousands of source terms. In addressing these issues, we present ourlatest work on generic methods for generating code that solves a set of coupled nonlinear partial differentialequations using the Kranc code generation package [1]. Our work greatly benefits from the modular design ofthe Cactus framework [2, 3], which frees domain experts from lower level programming issues, i. e., parallelism,I/O, memory management, et cetera. In this collaborative problem-solving environment based on Cactus andKranc, application developers, either software engineers or domain experts, can contribute to a code with theirexpertise, thus enhancing the overall programming productivity.
1.2. Scalability to large number of processors. With the advent of Roadrunner, the first supercom-puter that broke the petaflop/s mark in year 2008, the petaflop era was officially entered. There are a greatnumber of challenges to overcome in order to fully leverage this enormous computational power to be ableto solve previously unattainable scientific problems. The most urgent of all is the design and development ofhighly scalable and efficient scientific applications. However, the ever-growing complexity in developing suchefficient parallel software always leaves a gap for many application developers to cross. We need a bridge,a computational infrastructure, which does not only hide the hardware complexity, but also provides a userfriendly interface for scientific application developers to speed up scientific discoveries. In our project, we useda highly efficient computational infrastructure that is based on the Cactus framework and the Carpet AMRlibrary [4, 5, 6].
1.3. I/O bandwidth. We are faced with difficult challenges in moving data when dealing with largedatasets, challenges that arise from I/O architecture, network protocols and hardware resources: I/O archi-
†Center for Computation & Technology, Louisiana State University, Baton Rouge, LA 70803, USA‡Department of Physics & Astronomy, Louisiana State University, Baton Rouge LA 70803, USA§Department of Electrical & Computer Engineering, Louisiana State University, Baton Rouge LA 70803, USA¶Department of Computer Science, Louisiana State University, Baton Rouge, LA 70803, USA
205

206 Andrei Hutanu, Erik Schnetter et al.
Fig. 1.1. Scalability challenges involved in an end-to-end system for large scale, interactive numerical simulation and visual-ization for black hole modeling.
tectures that do not use a non-blocking approach are fundamentally limiting the I/O performance; standardnetwork protocols such as TCP cannot utilize the bandwidth available in emerging optical networks and cannotbe used efficiently on wide-area networks; single disks or workstations are not able to saturate high-capacitynetwork links. We propose a system that combines an efficient pipeline-based architecture, takes advantage ofnon-standard high-speed data transport protocols such as UDT, and uses distributed grid resources to increasethe I/O throughput.
1.4. Interactive visualization of large data. Bringing efficient visualization and data analysis powerto the end users’ desktop while visualizing large data and maintain interactiveness, by giving the user the abilityto control and steer the visualization, is a major challenge for visualization applications today. We are lookingat the case where sufficiently powerful visualization resources are not available at either the location where thedata was generated or at the location where the user is visualizing it, and propose using visualization clustersin the network to interactively visualize large amounts of data.
2. Scientific Motivation: Black Holes and Gamma-Ray Bursts. Over ninety years after Einsteinfirst proposed his theory of General Relativity, astrophysicists are increasingly interested in studying the regionsof the universe where gravity is very strong and the curvature of spacetime is large.
This realm of strong curvature is notoriously difficult to investigate with conventional observational as-tronomy. Some phenomena might not be observable in the electromagnetic spectrum at all, and may only bevisible in the gravitational spectrum, i. e., via the gravitational waves that they emit, as predicted by GeneralRelativity. Gravitational waves have today not yet been observed directly, but have attracted great attention

Large Scale Problem Solving 207
Fig. 2.1. Volume rendering of the gravitational radiation during a binary black hole merger
thanks to a wealth of indirect evidence [7, 8]; furthermore, gravitational wave detectors (LIGO [9], GEO [10],VIRGO [11]) will soon reach sufficient sensitivities to observe interesting astrophysical phenomena.
In order to correctly interpret the gravitational-wave astronomy data, astrophysicists must rely on compu-tationally challenging large-scale numerical simulations to study the details of the energetic processes occurringin regions of strong curvature. Such astrophysical systems and phenomena include the birth of neutron stars orblack holes in collapsing evolved massive stars, the coalescence of compact binary systems, Gamma-Ray Bursts(GRBs), active galactic nuclei harboring supermassive black holes, pulsars, and oscillating neutron stars.
Of these, Gamma-Ray Bursts (GRBs) [12] are among the most scientifically interesting. GRBs are intense,narrowly-beamed flashes of γ-rays originating at cosmological distances, and the riddle concerning their centralengines and emission mechanisms is one of the most complex and challenging problems of astrophysics today.The physics necessary in such a model includes General Relativity, relativistic magneto-hydrodynamics, nu-clear physics (describing nuclear reactions and the equation of state of dense matter), neutrino physics (weakinteractions), and neutrino and photon radiation transport. The complexity of the GRB central engine requiresa multi-physics, multi-length-scale approach that cannot be fully realized on present-day computers and willrequire petascale computing [13, 14].
At LSU we are performing simulations of general relativistic systems in the context of a decade-long researchprogram in numerical relativity. One pillar of this work is focused particularly on 3D black hole physicsand binary black hole inspiral and merger simulations. This includes the development of the necessary toolsand techniques to carry these out, such as mesh refinement and multi-block methods, higher order numericalschemes, and formulations of the Einstein equations. A second pillar of the group’s research is focused ongeneral relativistic hydrodynamics simulations, building upon results and progress achieved with black holesystem. Such simulations are crucial for detecting and interpreting signals soon expected to be recorded fromground-based laser interferometric detectors.
The specific application scenario for the work presented at the SCALE 2009 competition is the numericalmodeling of the gravitational waves produced by the inspiral and merger of binary black hole systems (seeFigure 2.1).
2.1. Use-case Scenario. The motivating and futuristic scenario for this work is based on enabling scien-tific investigation using complex application codes on very large scale compute resources:
• Scientists working together in a distributed collaboration are investigating the use of different algorithmsfor accurately simulating radiation transport as part of a computational model of gamma-ray burstswhich uses the Cactus Framework. The resulting simulation codes use adaptive mesh refinement todynamically add additional resolution where needed, involve hundreds of independent modules coordi-

208 Andrei Hutanu, Erik Schnetter et al.
nated by the Cactus Framework, require the use of tens of thousands of cores of modern supercomputersand take several days to complete.
• The scientists use the Kranc code generation package to automatically generate a suite of codes usingthe different algorithms that they wish to compare. Kranc writes these codes taking advantage ofappropriate optimization strategies for the architectures on which they will be deployed, for exampleusing GPU accelerators where available, or matching grid loops to the available cache size.
• The simulations are deployed on multiple supercomputers available to the collaboration, using co-scheduling services across different institutions to coordinate the simultaneous reservation of resources,networks, and displays. Web services are used to enable the real-time, highly configurable, collaborationof the scientists, with the simulations autonomously publishing appropriate information to services suchas Twitter and Flickr.
• As the simulations run, output data is directly streamed across high speed networks to powerfulGPU rendering clusters which produce the visualizations, and in turn stream their video outputs tolarge high resolution displays located at the collaborating sites. The displays aggregate the videooutputs from each of the different simulations, allowing the scientists to visualize and compare thesame output, while simultaneously interacting with and steering the visualization using tangible de-vices.
The scientists are thus able to use the most powerful computational resources to run the simulation and themost powerful visualization resources available to interactively visualize the data and are not limited by eithertheir local visualization resources, or the visualization resources available at the location where the simulationis being run.
3. Automatic Parallel Code Generation.
3.1. Cactus–Carpet Computational Infrastructure. Cactus [2, 3] is an open source software frame-work consisting of a central core, the flesh, which connects many software components (thorns) through anextensible interface. Carpet [4, 5, 6] serves as a driver layer of the Cactus framework providing adaptive meshrefinement, multi-patch capability, as well as memory management, parallelism, and efficient I/O. In theCactus–Carpet computational infrastructure, the simulation domain is discretized using high order finite dif-ferences on block-structured grids, employing a Berger-Oliger-style adaptive mesh refinement method [15] withsub-cycling in time, which provides both efficiency and flexibility. We use explicit Runge-Kutta methods fortime integration.
Cactus is highly portable and runs on all current HPC platforms as well as on workstations and laptops on allmajor operating systems. Codes written using Cactus have been run on various brands of the fastest computersin the world, such as various Intel and AMD based systems, SGI Altix, the Japanese Earth Simulator, IBMBlue Gene, Cray XT, and the (now defunct) SiCortex architecture, among others. Recently, the Cactus teamsuccessfully carried out benchmark runs on 131,072 cores on the IBM Blue Gene/P at the Argonne NationalLaboratory [16].
3.2. Kranc Code Generation Package. Kranc [17, 1, 18] is a Mathematica-based computer algebrapackage designed to facilitate analytical manipulations of systems of tensorial equations, and to automaticallygenerate C or Fortran code for solving initial boundary value problems. Kranc generates complete Cactus thorns,starting from a high-level description including the system of equations formulated in high-level Mathematicanotation, and discretizing the equations with higher-order finite differencing. Kranc generated thorns make useof the Cactus Computational Toolkit, declaring to Cactus the grid functions which the simulation will use, andcomputing the right hand sides of the evolution equations so that the time integrator can advance the solutionin time.
3.3.McLachlan Code. The McLachlan code [19, 20] was developed in the context of the XiRel project [21,22], a collaboration between several numerical relativity groups worldwide to develop a highly scalable, efficient,and accurate adaptive mesh refinement layer for the Cactus framework, based on the Carpet driver, aimedat enabling numerical relativists to study the physics of black holes, neutron stars and gravitational waves.The McLachlan code is automatically generated using the Kranc code generation package (see above) from ahigh-level description of the underlying set of partial differential equations. The automation is of particularimportance for experimenting with new formulations of the equations, new numerical methods, or particularmachine specific-code optimizations. McLachlan employs a hybrid MPI/OpenMP parallelism.

Large Scale Problem Solving 209
0
5
10
15
20
25
30
35
40
16 64 256 1k 4k 16k
tim
e p
er
RH
S e
va
lua
tio
n [
µs]
number of cores
Cactus Benchmark
FranklinHLRB IIKraken
Queen BeeRanger
0
2
4
6
8
10
12
16 32 64 128 256 512 1k 2k
tota
l b
an
dw
idth
[G
Byte
/s]
number of cores
Cactus I/O Benchmark
Ranger
Fig. 3.1. Left: Weak scaling benchmark results of the McLachlan code on several current leadership HPC systems. Thisbenchmark simulates a single black hole with nine levels of mesh refinement. The code scales well up to more than 12,000 cores ofRanger at TACC. Right: I/O benchmark on Ranger, showing the total I/O bandwidth vs. the number of cores. Cactus achievesa significant fraction of the maximum bandwidth already on 1,000 cores.
As can been seen from Figure 3.1, on TACC’s Ranger, McLachlan and the supporting infrastructure scalewell up to more than 12,000 cores. Cactus–Carpet is also able to use a significant fraction of the theoreticalpeak I/O bandwidth already on 1,000 cores.
4. Interactive and Collaborative Simulations.
4.1. Monitoring, Profiling and Debugging. Supporting performance and enforcing correctness of thecomplex, large-scale codes that Cactus generates is a non-trivial task, targeted by the NSF-funded Application-Level Performance and Correctness Analysis (Alpaca) project [23, 24].
In order to reap the benefits of the high-concurrency machines available today, it is not sufficient that acode’s parallel efficiency remain constant as the size of the problem is scaled up, but also that its ease of controlremains close to that of simulations carried out on a few number of computing cores; if this is not the case,the process of debugging and optimizing the code may be so time-consuming as to offset the speed-up obtainedthrough parallelism. The Alpaca project addresses this issue through the development of application-level tools,i. e., high-level tools that are aware of the Cactus data structures and execution model.
In particular, Alpaca’s objectives concentrate on three areas: (i) high-level debugging, devising debuggingstrategies that leverage high-level knowledge about the execution actors and the data processing, and developtools that extract such information from a simulation and provide it in an abstract format to the user; (ii)high-level profiling, devising algorithms for extracting high-level information from timing data; and (iii) remotevisualization, using visual control over the simulation data as a high-level correctness check. In particular, workwithin the Alpaca project includes the development of HTTPS, a Cactus module that spawns an SSL webserver, with X.509 certificate authorization, at the beginning of a simulation and uses it to receive incomingconnections, expose the simulation’s details and provide fine-grained control over its execution.
4.2. Leveraging Web 2.0 for Collaborations. In response to the fact that computer simulations arebecoming more complex and requiring more powerful resources, the way science itself is carried out is sim-ilarly changing: the growing use of computers and world-wide networks has radically modified the old cus-tom of individual (or small-collaboration) work and hand-written data collected in notebooks. When StephenHawking worked out the basic theoretical framework for two colliding black holes [25] in the early seven-ties and Larry Smarr carried out early numerical simulations [26] a few years later, both involved only verysmall teams and generated perhaps a megabyte of data. The same problem has been studied in full 3D [27],now with a team size of perhaps 15 researchers, a growing number of involved institutes and an increasein generated data by a factor of about a million. Currently unsolved problems like the Gamma-Ray Burstriddle [14] will require still larger collaborations, even from different communities, and generate even moredata.

210 Andrei Hutanu, Erik Schnetter et al.
In order for scientific collaborations to work at this scale, for the large amounts of data to be handledproperly, and for the results to be reproducible, new methods of collaboration must be developed or alreadyexisting tools from other fields must be leveraged. Cactus can now use two tools from the latter class toannounce information about simulations to existing Web 2.0 services, as described in the following.
Twitter’s [28] main service is a message routing system that enables its users to send and read each others’updates, known as tweets. Tweets have to be very short (at most 140 characters in length) and can be sent andread via a wide range of devices, e.g. mobile texting, instant message, the web, or external applications.
Twitter provides an API [29] which allows the integration of Twitter with other web services and ap-plications. One of the most important functions is the “statuses/update” API call, which is used to post anew Twitter message from the specified user. This Twitter API is used in a Cactus thorn to announce liveinformation from a simulation (Figure 7.2).
Flickr [30] was launched as an image hosting website targeted at digital photographs, but short videos canbe uploaded today as well. Flickr can be used at no charge with limits on the total size of images that can beuploaded (currently 100 MByte) and on the number of images which can be viewed (currently 200), along withother potential services available.
One important functionality, besides the image upload, is to be able to group images. Flickr offers acapability to group images into “Sets”, and also can group different “Sets” into a “Collection”. This providesa hierarchical structure for organizing simulation images.
Flickr has many features that can be taken advantage of for providing a collaborative repository for Cactus-produced images and information. All of them are accessed through a comprehensive web service API foruploading and manipulating images [31].
A new Cactus thorn uses the Flickr API to upload live images from the running simulation. Imagesgenerated by one simulation are grouped into one “Set”. It is also possible to change the rendered variables, orto change the upload frequency on-line through an Cactus-internal web server (see section 4.1).
5. Distributed Visualization.
5.1. Visualization Scenario. Our scenario is the following: the visualization user is connected over anetwork link to a grid system of various types of resources (visualization, network, compute, data). The datato be visualized is located on a data server near the location where the scientific simulation was executed andthis data server is also connected to the grid system.
There are various ways in which a visualization application can be created to solve the problem, suchas running the visualization on the data server and transferring a video stream to the client, or running thevisualization on the local client and transferring a data stream between the data server and the client.
These two solutions are limited by the visualization power available near the data server or near the localmachine, respectively. Since powerful visualization resources are not available at the client and may not beavailable near the data server, we have built a three-way distributed system that uses a visualization clusterin the network, data streaming from the data server to the visualization cluster, and video streaming from thevisualization cluster to the local client.
We have taken the problem one step further and considered the case where the network connection ofthe data server is a relatively slow one—much slower than the network capacity of the rendering machine. Inthis situation we are dealing with I/O scalability issues, and the solution we propose is to create a temporarydistributed data server in the grid. The distributed data server uses compute and data resources that arenot dedicated for this application but are allocated on-demand to support it when it needs to execute. Thedistributed data server can sustain much higher data transfer rates than a single data source. Data is loadedin advance from the source on the distributed data server. The architecture of this approach is illustrated inFigure 5.1. Because the visualization resources are not local to the end client, a remote interaction system isnecessary in order for the user to be able to connect to and steer the visualization.
5.2. I/O. High-performance data transmission over wide-area networks is difficult to achieve. One of themain factors that can influence performance is the network transport protocol. Using unsuitable protocolson wide area network can result in bad performance—for example a few Mbit/s throughput on a 10 Gbit/sdedicated network connection using TCP. The application needs to use protocols that are suitable for thenetwork that is utilized; our system uses the UDT [32] library for wide-area transfers in order to achieve highdata transmission rates. Another issue is blocking on I/O operations: blocking I/O reduces the performance

Large Scale Problem Solving 211
Fig. 5.1. Architecture of demonstration system which involves a temporary distributed data server allocated on-demand toimprove sustained data transfer rates.
that is seen by the application, and the solution we use is based on a completely non-blocking architecture usinga large number of parallel threads to keep the data flow moving.
5.3. Parallel Rendering. Parallel rendering on HPC or visualization clusters is utilized to visualize largedatasets. For the SCALE 2009 demonstration we have used a self-developed parallel GPU ray-casting volumerendering implementation to interactively visualize the time-dependent numerical relativity dataset, where eachtimestep has a size of about 1 GByte. GPU ray-casting does floating point compositing in a single pass using afragment shader. The trade-off between rendering time and visual quality can be steered directly by the user(s).Our rendering system overlaps communication with (visual) computation, in order to achieve maximum perfor-mance. Parallelism is achieved by data domain decomposition (each node renders a distinct subsection of thedata), and compositing of the resulted partial view images in order to create a single view of the entire dataset.
5.4. Video Streaming and Interaction. Interaction with the remote parallel renderer is necessary tomodify navigation parameters such as the direction of viewing or the level of zoom, and to control the trade-offof visual quality and image deliver time. Since the visualization application is not local, an interaction systemconsisting of three components was developed. The components are a local interaction client running on thelocal machine, an interaction server running on the rendering cluster, and an application plug-in that connectsthe interaction server to the application and inserts interaction commands into the application workflow (seeFig. 5.2).
For our demonstration we used specialized interaction devices developed by the Tangible VisualizationLaboratory at CCT [33] that are very useful in long-latency remote interaction systems, and can supportcollaboration (collaborative visualization) from multiple sites.
The final component of the system is the video streaming. Images that are generated from the remotevisualization cluster need to be transported to the local client for the user to see. In the past, we have successfullyutilized hardware-assisted systems running videoconferencing software (Ultragrid [34]) and software-based videostreaming using SAGE [35]. Our system supports various video streaming methods including SAGE, a selfdeveloped video streaming subsystem, or VNC [36].
6. Related Work. OptIPuter [37] is a large project that has built an advanced infrastructure connectingcomputational infrastructure with high-speed “lambda” networks to create virtual distributed metacomputers.OptIPuter technologies are used in scientific applications such as microbiology [38] and climate analysis [39].

212 Andrei Hutanu, Erik Schnetter et al.
Fig. 5.2. Architecture of interaction system
One method for tightening the integration of applications and networks is to use reserved, exclusive accessto network resources controlled by the user. Several projects, including DOE UltraScienceNet [40, 41], NSFCHEETAH [42], Phosphorus [43], G-lambda [44] and Internet2 ION [45] have explored mechanisms for providingsuch network services to applications.
The limitations of desktop-based visualization led to the development of parallel visualization systems andframeworks such as ImageVis3D [46], Chromium [47] and Equalizer [48] that can take advantage of computa-tional clusters to visualize large datasets. Equalizer and Chromium are parallel rendering frameworks that canbe used to build parallel rendering applications. ImageVis3D is a parallel rendering tool for interactive volumerendering of large datasets. These and other tools and techniques are being developed (for example as part of theInstitute for Ultra-Scale Visualization [49, 50]) to be able to take advantage of parallel resources for visualization.
Other visualization systems such as Data Vault (DV) [51], ParaView [52], and VisIt [53] were designed tofacilitate the visualization of remote data and, while they have the capability to transmit data and images overthe network, they are not able to take advantage of the full capacity of high-speed networks and thus havelow data transport performance, can suffer from a lack of interactivity and image quality, and do not supportcollaborative visualization.
Data Vault (DV) is a visualization and data analysis package for numerical codes that solve partial differ-ential equations via grid-based methods, in particular those utilizing adaptive mesh refinement (AMR) and/orrunning in a parallel environment. DV provides a of built-in functions to analyze 1D, 2D, and 3D time-dependentdatasets.
ParaView is a parallel visualization application designed to handle large datasets. It supports two distribu-tion modes: client–server and client–rendering server–data server.
VisIt is a visualization software designed to handle large datasets using client–server distribution of thevisualization process. Similar to ParaView’s client–server distribution, VisIt uses a parallel rendering serverand a local viewer and interaction client. Most commonly, the server is as a stand-alone process that reads datafrom files. An alternative exists where a simulation code delivers data directly to VisIt, separating the serverinto two components. This allows for visualization and analysis of a live running simulation.
Several visualization systems such as RAVE [54] or the visualization system by Zhu et al. [55] are focused onthe theoretical aspects of distributed visualization and do not provide the level of performance and scalabilityneeded for current scientific applications. The distributed visualization architecture proposed by Shalf andBethel [56] could support a variety of distributed visualization applications and inspired the development of oursystem.
The German TIKSL [57] and GriKSL [58] projects developed technologies for remote data access in Gridenvironments to provide visualization tools for numerical relativity applications. Based on GridFTP [59] andthe HDF5 library [60], these projects prototyped a number of remote visualization scenarios on which this workis based.

Large Scale Problem Solving 213
Fig. 7.1. The Alpaca tools provide real-time access to simulations running on remote machines, allowing monitoring, inter-active visualization, steering, and high-level debugging of large-scale simulations.
7. SCALE 2009 Demonstration and Results. The resulting Cactus application McLachlan used theCarpet Adaptive Mesh Refinement infrastructure to provide scalable, high order finite differencing, in this caserunning on 2048 cores of the Texas Advanced Computing Center (TACC) Ranger machine. The simulationran for altogether 160 hours on Ranger, generating 42 TByte of data. Live interaction with the simulationwas shown, via the application-level web interface HTTPS (Fig. 7.1, Section 4.1). The simulation also usednew thorns co-developed by an undergraduate student at LSU to announce runtime information to Twitter andreal-time images of the gravitational field to Flickr (Fig. 7.2).
Interactive visualization of the data produced was shown using a visualization system distributed acrossthe Louisiana Optical Network Initiative (LONI), see Fig. 7.3. A data server deployed on the Eric and LouieLONI clusters cached 20 GByte of data at any time in RAM using a total of 8 compute nodes. This datawas then transferred using TCP and UDT protocols over the 10 Gbit/s LONI network to rendering nodes at avisualization cluster at LSU.
The average aggregate I/O rate achieved by the SCALE 2009 system was 4 Gbit/s. Loadingtime from the remote distributed resources was six times faster than local load from disk (2 sremote vs. 12.8 s local).
Here a new parallel renderer used GPU acceleration to render images, which were then streamed using theSAGE software to the final display. VNC (Fig. 7.4) was used instead of SAGE in Shanghai due to local networklimitations. Tangible interaction devices (also located in Shanghai) provided interaction with the renderer.
The size of a rendered timestep was 10243 bytes, for a total data size of 1 GB/timestep. Therendering performance of the SCALE 2009 system for this data, executed on an 8 node renderingcluster each node equipped with NVidia Geforce 9500 GT 256 MB DDR3 was 5 frames per second.
The visualization system demonstrated its capability for interactive, collaborative and scalable visualization,achieving the team’s goal of showing how distributed systems can provide enhanced capabilities over localsystems. This system was awarded first place in the IEEE SCALE 2009 Challenge.

214 Andrei Hutanu, Erik Schnetter et al.
Fig. 7.2. New Cactus thorns allow simulations to announce live information and images to (top) Twitter, (bottom) Flickrenabling a new mode of scientific collaboration using Web 2.0 technologies.
8. Results After Demonstration. After SCALE 2009 we continued to improve the system, in particularthe rendering and I/O subsystems. In our code generation and simulation infrastructure, we have been concen-trating on adding new physics (in particular radiation transport), a new formulation of the Einstein equations,and on improving single-node (single-core and multi-core) performance.
We evaluated the visualization system performance and compared it with the performance of Paraview andVisIt using a sample dataset with a resolution of 40963 bytes with a total size of 64 GB.
Benchmarks were performed on the 8-node visualization cluster at LSU, each node having two Quad-coreIntel Xeon E5430 processors (2.66 GHz), 16 GB RAM. The performance of the rendering cluster was improved
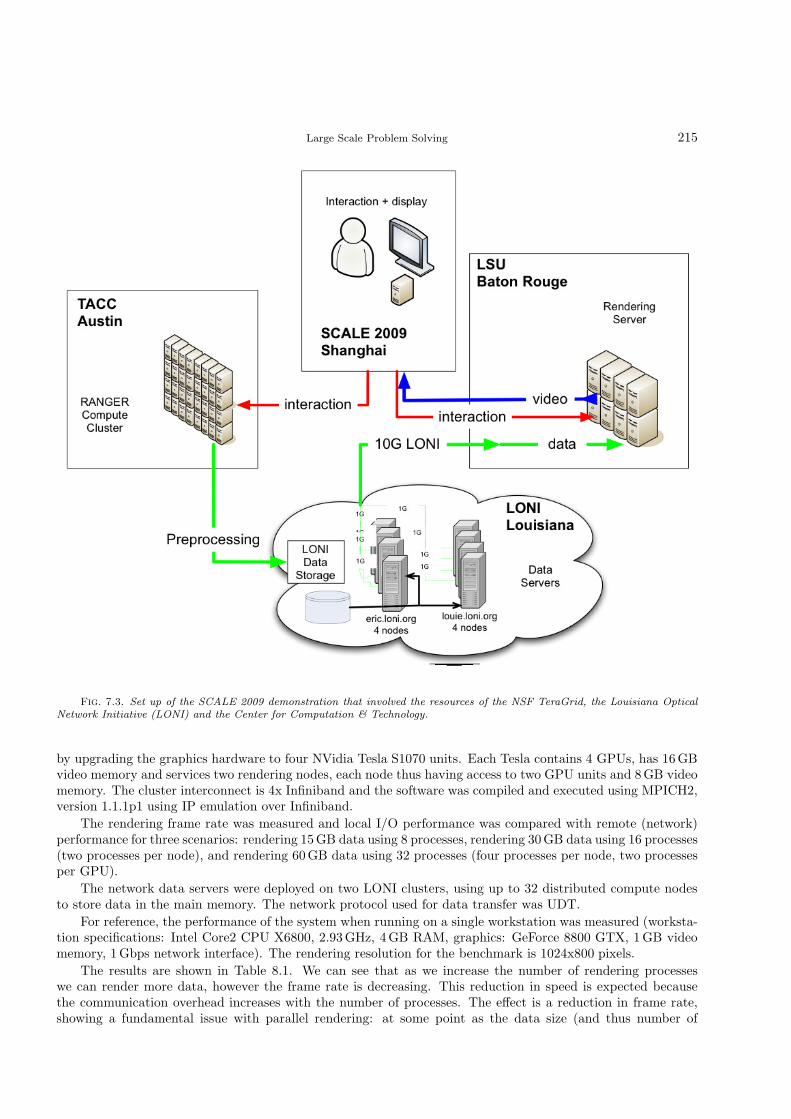
Large Scale Problem Solving 215
Fig. 7.3. Set up of the SCALE 2009 demonstration that involved the resources of the NSF TeraGrid, the Louisiana OpticalNetwork Initiative (LONI) and the Center for Computation & Technology.
by upgrading the graphics hardware to four NVidia Tesla S1070 units. Each Tesla contains 4 GPUs, has 16 GBvideo memory and services two rendering nodes, each node thus having access to two GPU units and 8 GB videomemory. The cluster interconnect is 4x Infiniband and the software was compiled and executed using MPICH2,version 1.1.1p1 using IP emulation over Infiniband.
The rendering frame rate was measured and local I/O performance was compared with remote (network)performance for three scenarios: rendering 15 GB data using 8 processes, rendering 30 GB data using 16 processes(two processes per node), and rendering 60 GB data using 32 processes (four processes per node, two processesper GPU).
The network data servers were deployed on two LONI clusters, using up to 32 distributed compute nodesto store data in the main memory. The network protocol used for data transfer was UDT.
For reference, the performance of the system when running on a single workstation was measured (worksta-tion specifications: Intel Core2 CPU X6800, 2.93 GHz, 4 GB RAM, graphics: GeForce 8800 GTX, 1 GB videomemory, 1 Gbps network interface). The rendering resolution for the benchmark is 1024x800 pixels.
The results are shown in Table 8.1. We can see that as we increase the number of rendering processeswe can render more data, however the frame rate is decreasing. This reduction in speed is expected becausethe communication overhead increases with the number of processes. The effect is a reduction in frame rate,showing a fundamental issue with parallel rendering: at some point as the data size (and thus number of

216 Andrei Hutanu, Erik Schnetter et al.
Fig. 7.4. Visualization client on the end display showing rendering of gravitational waves emitted from the inspiral collisionof two black holes.
processes required to render it) increases, the frame rate drops to a level below the point of interactivity. Theresults show that the system is able to utilize the rendering cluster to interactively render 35 times more datathan a typical workstation, and maintain an acceptable level of interactivity while rendering more than 70 timesmore data than on the workstation. The current system is able to interactively visualize data 60 times largerthan that supported by the SCALE 2009 system.
Table 8.1Data throughput and rendering scalability results.
# processes Data size Frame rate (fps) Local speed Network speed
1 (workstation) 0.8 GB 30 0.68 Gbps 0.8 Gbps8 (cluster) 15 GB 15-21 (18 avg) 0.11 Gbps 6.6 Gbps16 (cluster) 30 GB 11-13 (12 avg) 0.12 Gbps 5.3 Gbps32 (cluster) 60 GB 4-5 (4.5 avg) 0.2 Gbps 4.3 Gbps
Regarding data speed, we see a big advantage when using network I/O, proving the value of the proposedapproach of designing the system to be able to take advantage of high-speed networks. The system achieves6.6 Gbps throughput over the LONI wide-area network (the limit being the network interfaces on the cluster)when using 8 processes. As we increase the number of processes the network speed decreases slightly becauseof the increased contention on the network interface on the same node. The remote I/O performance is 20-60

Large Scale Problem Solving 217
times better than local I/O performance, and the current system is able to sustain up to 6.6 Gbps transfer rates,both showing significant improvements over the SCALE 2009 system.
To better understand the features and the trade-offs of our system (named eaviv) a comparison withalternative visualization systems was made. Two appropriate comparison systems were identified, ParaView(version 3.6.1) and VisIt (version 1.12.0).
Table 8.2Comparison of visualization systems features and performance: I/O methods, rendering and other items
Feature eaviv ParaView VisItData protocols UDT, TCP, fully config-
urableTCP only TCP only
High-speed data limit Yes: Main memory No: Disk size No: Disk sizeFrame rate 11-12 fps (30 GB) 0.5-1 fps (32 GB) 0.28-0.35 fps (32 GB)Render size limit 60 GB (GPU memory) 120 GB (CPU mem-
ory)120 GB (CPU mem-ory)
Collaborative support Yes: SAGE video distribu-tion, tangible devices
No No
Video streaming Parallel (SAGE) Serial SerialDirect simulation con-nectivity
No No Yes
Fully-featured visualiza-tion application
No (Prototype) Yes Yes
The comparison was made in three different areas: data input; parallel rendering; and miscellaneous items.Both qualitative and quantitative items were analyzed. Slightly different data sizes were used due to the differentmodes of selecting the section of interest in each system.
Starting with data input, our system supports multiple data protocols allowing it to take advantage ofhigh-speed networks. The benchmark results shown in Table 8.2 executed on the rendering cluster shows howour system can take advantage of the high-speed network to achieve a high data throughput. This throughputcan however only be sustained for an amount of data equal to the main memory size available in the network.Both ParaView and VisIt throughput is limited by disk speed.
The second area of interest is the parallel rendering component. Our system uses a GPU-based parallelrenderer, allowing it to take advantage of graphics acceleration for volume rendering and enabling high framerate. ParaView and VisIt do not currently support parallel GPU acceleration, and in consequence the framerate that they can achieve is below 1 frame per second. For VisIt the ray-casting parallel rendering method wasused for comparison. GPU-based rendering is however limited in the data size that it can render by the amountof video memory of the graphics cards. CPU-based rendering can usually render more data, as the amount ofmain memory in a system is generally higher than that of video memory.
Parallel video streaming is a feature supported by our use of the SAGE system. Each rendering node,after generating a section of the final image can transmit it directly to the viewer client. In contrast, VisItand ParaView rendering processes transmit their results first to the master node which combines them andtransmits the complete image to the client. Serial video streaming introduces additional overhead and latencyinto the system.
Our prototype has integrated support for tangible interaction devices while allowing mouse and keyboardinteraction through the use of third-party software, such as VNC. The use of SAGE and tangible interactiondevices enables direct support of collaborative visualization, where multiple users, potentially at different lo-cations around the world can simultaneously interact and collaborate using the visualization system. SAGEbridges can be used to multicast the video stream from the application to multiple users, and interaction devicesdeployed at each user location can be used to interact with the visualization.
One of the important missing features of our system is the lack of a direct connection between the visu-alization and the simulation, needed in order to visualize live data, as it is being generated (this feature isalready supported by VisIt). Our system is designed as a prototype to explore the possibilities of distributedvisualization, it only supports volume rendering of uniform scalar data, and has only a small fraction of thefeatures of complete visualization systems such as VisIt and ParaView.
218 Andrei Hutanu, Erik Schnetter et al.
9. Conclusion and Future Work. Our system shows the viability of the proposed approach of usingthe Cactus framework, automated code generation, and modern numerical methods to scale to a large numberof processors. It also shows how distributing the visualization system into separate components increases theamount of data that can be handled, increases the speed at which the data can be visualized compared to localtechniques, and improves data transfer rates and interactivity.
The driving principle behind our approach is that, following a careful analysis and based on a detaileddescription of a particular technical problem, a scalable solution is to build a fully optimized integrated softwaresystem. Our proposed system is still modular, however the interfaces between the various components areflexible, and were carefully designed to enable optimizations across multiple components. The scalability of thissystem would suffer if each component would be designed and implemented in isolation of the other componentsand the coupling between components would be limited to legacy or rigid interfaces.
Our integrated approach enables us to take advantage of the latest improvements in GPU architectures,networks, innovative interaction systems and high-performance data and video transmission systems and pro-vides a solution and a model for future scientific computing, and we believe many other applications will beable to benefit from adopting a similar approach.
In the future, we are planning to tighten the connection between the simulation and visualization com-ponents, to enable our system to visualize data on the fly as it is generated by the simulation. Our futureplans include integrating automated provisioning of network resources in our application. Towards this we arecurrently in the process of building a testbed that connects compute, storage, graphics and display resources(provided by TeraGrid sites Louisiana State University and National Center for Supercomputing Applicationsand international partners such as Masaryk University) together with dynamic network circuit services providedby Internet2 and the Global Lambda Integrated Facility international community.
A fundamental service required by our system is co-allocation and advance reservation of resources. We areworking together with resource providers and actively encourage them to enable these services that are crucialto enable the routine execution such complex distributed applications.
10. Acknowledgements. We thank the current and former members of the AEI/LSU numerical rela-tivity group who developed the physics code that made this work possible, and the extended Cactus team fortheir computational infrastructure. We also thank the original authors of the Kranc code generation pack-age for making their work publicly available. We acknowledge Jorge Ucan and Kristen Sunde for preparingthe high-definition video for the SCALE 2009 Challenge, and Debra Waters for help with organization. Thedemonstration would not have been possible without the help of our colleagues at TACC and LONI.
This material is based upon work supported by the National Science Foundation (Alpaca #0721915, BlueWaters #0725070, Viz Tangibles #0521559, XiRel #0701566, Louisiana RII CyberTools #0701491, OCI EAGEReaviv #0947825) and by the Center for Computation & Technology at LSU. The simulations and benchmarkswere performed on Queen Bee at LONI under allocations loni cactus03 and loni numrel03, and on Rangerat TACC under the NSF TeraGrid allocation TG-MCA02N014. The distributed visualization development wassupported by the NSF TeraGrid allocation TG-CCR080027T.
REFERENCES
[1] Sascha Husa, Ian Hinder, and Christiane Lechner. Kranc: a Mathematica application to generate numerical codes for tensorialevolution equations. Comput. Phys. Comm., 174:983–1004, 2006.
[2] Tom Goodale, Gabrielle Allen, Gerd Lanfermann, Joan Masso, Thomas Radke, Edward Seidel, and John Shalf. The Cactusframework and toolkit: Design and applications. In High Performance Computing for Computational Science - VECPAR2002, 5th International Conference, Porto, Portugal, June 26-28, 2002, pages 197–227, Berlin, 2003. Springer.
[3] Cactus Computational Toolkit home page.[4] E. Schnetter, S. H. Hawley, and I. Hawke. Evolutions in 3D numerical relativity using fixed mesh refinement. Class. Quantum
Grav., 21(6):1465–1488, 21 March 2004. gr-qc/0310042.[5] Erik Schnetter, Peter Diener, Nils Dorband, and Manuel Tiglio. A multi-block infrastructure for three-dimensional time-
dependent numerical relativity. Class. Quantum Grav., 23:S553–S578, 2006.[6] Mesh refinement with Carpet.[7] R.N. Hulse and J.H. Taylor. Discovery of a pulsar in a binary system. Astrophys. J., 195:L51–L53, 1975.[8] Ramesh Narayan and Jeffrey E. McClintock. Advection-dominated accretion and the black hole event horizon. New Astron.
Rev., 51:733–751, 2008.[9] LIGO: Laser Interferometer Gravitational Wave Observatory.
[10] GEO 600.[11] VIRGO.

Large Scale Problem Solving 219
[12] Peter Meszaros. Gamma-ray bursts. Rep. Prog. Phys., 69:2259–2321, 2006.[13] Christian D. Ott, Erik Schnetter, Gabrielle Allen, Edward Seidel, Jian Tao, and Burkhard Zink. A case study for petascale
applications in astrophysics: Simulating Gamma-Ray Bursts. In Proceedings of the 15th ACM Mardi Gras conference:From lightweight mash-ups to lambda grids: Understanding the spectrum of distributed computing requirements, appli-cations, tools, infrastructures, interoperability, and the incremental adoption of key capabilities, number 18 in ACMInternational Conference Proceeding Series, Baton Rouge, Louisiana, 2008. ACM.
[14] Erik Schnetter, Christian D. Ott, Gabrielle Allen, Peter Diener, Tom Goodale, Thomas Radke, Edward Seidel, and John Shalf.Cactus Framework: Black holes to gamma ray bursts. In David A. Bader, editor, Petascale Computing: Algorithms andApplications, chapter 24. Chapman & Hall/CRC Computational Science Series, 2008.
[15] Marsha J. Berger and Joseph Oliger. Adaptive mesh refinement for hyperbolic partial differential equations. J. Comput.Phys., 53:484–512, 1984.
[16] Cactus Benchmark Results and Papers.[17] Christiane Lechner, Dana Alic, and Sascha Husa. From tensor equations to numerical code — computer algebra tools
for numerical relativity. In SYNASC 2004 — 6th International Symposium on Symbolic and Numeric Algorithms forScientific Computing, Timisoara, Romania, 2004.
[18] Kranc: Automated Code Generation.[19] David Brown, Peter Diener, Olivier Sarbach, Erik Schnetter, and Manuel Tiglio. Turduckening black holes: an analytical and
computational study. Phys. Rev. D, 79:044023, 2009.[20] McLachlan, a Public BSSN Code.[21] Jian Tao, Gabrielle Allen, Ian Hinder, Erik Schnetter, and Yosef Zlochower. XiRel: Standard benchmarks for numerical
relativity codes using Cactus and Carpet. Technical Report CCT-TR-2008-5, Louisiana State University, 2008.[22] XiRel: Next Generation Infrastructure for Numerical Relativity.[23] Erik Schnetter, Gabrielle Allen, Tom Goodale, and Mayank Tyagi. Alpaca: Cactus tools for application level performance
and correctness analysis. Technical Report CCT-TR-2008-2, Louisiana State University, 2008.[24] Alpaca: Cactus tools for Application-Level Profiling and Correctness Analysis.[25] S. W. Hawking. Black holes in general relativity. Comm. Math. Phys., 25:152, 1972.[26] L. Smarr. Spacetimes generated by computers: Black holes with gravitational radiation. Ann. N. Y. Acad. Sci., 302:569–604,
1977.[27] Miguel Alcubierre, W. Benger, B. Brugmann, G. Lanfermann, L. Nerger, E. Seidel, and R. Takahashi. 3D Grazing Collision
of Two Black Holes. Phys. Rev. Lett., 87:271103, 2001.[28] Twitter.[29] Twitter Application Programming Interface.[30] Flickr.[31] Flickr API Web page.[32] Yunhong Gu and Robert L. Grossman. Udt: Udp-based data transfer for high-speed wide area networks. Comput. Networks,
51(7):1777–1799, 2007.[33] Brygg Ullmer, Rajesh Sankaran, Srikanth Jandhyala, Blake Tregre, Cornelius Toole, Karun Kallakuri, Christopher Laan,
Matthew Hess, Farid Harhad, Urban Wiggins, and Shining Sun. Tangible menus and interaction trays: core tangiblesfor common physical/digital activities. In TEI ’08: Proceedings of the 2nd international conference on Tangible andembedded interaction, pages 209–212, New York, NY, USA, 2008. ACM.
[34] Petr Holub, Ludek Matyska, Milos Liska, Lukas Hejtmanek, Jirı Denemark, Tomas Rebok, Andrei Hutanu, Ravi Paruchuri,Jan Radil, and Eva Hladka. High-definition multimedia for multiparty low-latency interactive communication. FutureGeneration Comp. Syst., 22(8):856–861, 2006.
[35] Luc Renambot, Byungil Jeong, Hyejung Hur, Andrew Johnson, and Jason Leigh. Enabling high resolution collaborativevisualization in display rich virtual organizations. Future Gener. Comput. Syst., 25(2):161–168, 2009.
[36] Tristan Richardson, Quentin Stafford-Fraser, Kenneth R. Wood, and Andy Hopper. Virtual Network Computing. IEEEInternet Computing, 2(1):33–38, 1998.
[37] Larry L. Smarr, Andrew A. Chien, Tom DeFanti, Jason Leigh, and Philip M. Papadopoulos. The optiputer. Communicationsof the ACM, 46(11):58–67, 2003.
[38] Larry Smarr, Paul Gilna, Phil Papadopoulos, Thomas A. DeFanti, Greg Hidley, John Wooley, E. Virginia Armbrust, ForestRohwer, and Eric Frost. Building an optiplanet collaboratory to support microbial metagenomics. Future Gener. Comput.Syst., 25(2):124–131, 2009.
[39] Venkatram Vishwanath, Robert Burns, Jason Leigh, and Michael Seablom. Accelerating tropical cyclone analysis usinglambdaram, a distributed data cache over wide-area ultra-fast networks. Future Gener. Comput. Syst., 25(2):184–191,2009.
[40] N.S.V. Rao, W.R. Wing, S.M. Carter, and Q. Wu. Ultrascience net: network testbed for large-scale science applications.Communications Magazine, IEEE, 43(11):S12–S17, Nov. 2005.
[41] N. S. V. Rao, W. R. Wing, S. Hicks, S. Poole, F. Denap, S. M. Carter, and Q. Wu. Ultrascience net: research testbed for high-performance networking. Proceedings of International Symposium on Computer and Sensor Network Systems, April 2008.
[42] Xuan Zheng, M. Veeraraghavan, N.S.V. Rao, Qishi Wu, and Mengxia Zhu. CHEETAH: circuit-switched high-speedend-to-end transport architecture testbed. Communications Magazine, IEEE, 43(8):s11–s17, Aug. 2005.
[43] S. Figuerola, N. Ciulli, M. De Leenheer, Y. Demchenko, W. Ziegler, and A. Binczewski on behalf of the PHOSPHORUS con-sortium. PHOSPHORUS: Single-step on-demand services across multi-domain networks for e-science. In Proceedings ofthe European Conference and Exhibition on Optical Communication ’07, 2007.
[44] Atsuko Takefusa, Michiaki Hayashi, Naohide Nagatsu, Hidemoto Nakada, Tomohiro Kudoh, Takahiro Miyamoto, TomohiroOtani, Hideaki Tanaka, Masatoshi Suzuki, Yasunori Sameshima, Wataru Imajuku, Masahiko Jinno, Yoshihiro Takigawa,Shuichi Okamoto, Yoshio Tanaka, and Satoshi Sekiguchi. G-lambda: coordination of a grid scheduler and lambda pathservice over GMPLS. Future Gener. Comput. Syst., 22(8):868–875, 2006.

220 Andrei Hutanu, Erik Schnetter et al.
[45] Internet2 ION. Web page, 2009. http://www.internet2.edu/ion/.[46] 2009. ImageVis3D: A Real-time Volume Rendering Tool for Large Data. Scientific Computing and Imaging Institute (SCI).[47] Greg Humphreys, Mike Houston, Ren Ng, Randall Frank, Sean Ahern, Peter D. Kirchner, and James T. Klosowski. Chromium:
a stream-processing framework for interactive rendering on clusters. ACM Trans. Graph., 21(3):693–702, 2002.[48] Stefan Eilemann, Maxim Makhinya, and Renato Pajarola. Equalizer: A scalable parallel rendering framework. In IEEE
Transactions on Visualization and Computer Graphics, 2008.[49] Kwan-Liu Ma, Chaoli Wang, Hongfeng Yu, Kenneth Moreland, Jian Huang, and Rob Ross. Next-Generation Visualization
Technologies: Enabling Discoveries at Extreme Scale. SciDAC Review, 12:12–21, February 2009.[50] Kwan-Liu Ma, Robert Ross, Jian Huang, Greg Humphreys, Nelson Max, Kenneth Moreland, John D. Owens, and Han-Wei
Shen. Ultra-Scale Visualization: Research and Education. Journal of Physics, 78, June 2007. (Proceedings of SciDAC2007 Conference).
[51] Data Vault Tutorial.[52] A. Cedilnik, B. Geveci, K. Moreland, J. Ahrens, and J. Favre. Remote Large Data Visualization in the ParaView Framework.
Proceedings of the Eurographics Parallel Graphics and Visualization, pages 162–170, 2006.[53] H. Childs, E. Brugger, K. Bonnell, J. Meredith, M. Miller, B. Whitlock, and N. Max. A Contract Based System For Large
Data Visualization. Visualization, IEEE 2005, pages 25–25, 2005.[54] I. J. Grimstead, N. J. Avis, and D. W. Walker. RAVE: the resource-aware visualization environment. Concurrency and
Computation: Practice and Experience, 21(4):415–448, 2009.[55] Mengxia Zhu, Qishi Wu, Nageswara S. V. Rao, and Sitharama Iyengar. Optimal pipeline decomposition and adaptive
network mapping to support distributed remote visualization. J. Parallel Distrib. Comput., 67(8):947–956, 2007.[56] J. Shalf and EW Bethel. The grid and future visualization system architectures. Computer Graphics and Applications,
IEEE, 23(2):6–9, 2003.[57] Werner Benger, Hans-Christian Hege, Andre Merzky, Thomas Radke, and Edward Seidel. Efficient Distributed File I/O for
Visualization in Grid Environments. In B. Engquist, L. Johnsson, M. Hammill, and F. Short, editors, Simulation andVisualization on the Grid, volume 13 of Lecture Notes in Computational Science and Engineering, pages 1–6. SpringerVerlag, 2000.
[58] Hans-Christian Hege, Andrei Hutanu, Ralf Kahler, Andre Merzky, Thomas Radke, Edward Seidel, and Brygg Ullmer.Progressive Retrieval and Hierarchical Visualization of Large Remote Data. Scalable Computing: Practice andExperience, 6(3):57–66, September 2005. http://www.scpe.org/?a=volume&v=23.
[59] William Allcock, John Bresnahan, Rajkumar Kettimuthu, and Michael Link. The Globus Striped GridFTP Framework andServer. In SC ’05: Proceedings of the 2005 ACM/IEEE conference on Supercomputing, page 54, Washington, DC, USA,2005. IEEE Computer Society.
[60] HDF5: Hierarchical Data Format Version 5.
Edited by: Marcin PaprzyckiReceived: March 30, 2010Accepted: June 09, 2010

AIMS AND SCOPE
The area of scalable computing has matured and reached a point where new issues and trends require a pro-fessional forum. SCPE will provide this avenue by publishing original refereed papers that address the presentas well as the future of parallel and distributed computing. The journal will focus on algorithm development,implementation and execution on real-world parallel architectures, and application of parallel and distributedcomputing to the solution of real-life problems. Of particular interest are:
Expressiveness:• high level languages,• object oriented techniques,• compiler technology for parallel computing,• implementation techniques and their effi-
ciency.
System engineering:• programming environments,• debugging tools,• software libraries.
Performance:• performance measurement: metrics, evalua-
tion, visualization,• performance improvement: resource allocation
and scheduling, I/O, network throughput.
Applications:
• database,
• control systems,
• embedded systems,
• fault tolerance,
• industrial and business,
• real-time,
• scientific computing,
• visualization.
Future:
• limitations of current approaches,
• engineering trends and their consequences,
• novel parallel architectures.
Taking into account the extremely rapid pace of changes in the field SCPE is committed to fast turnaroundof papers and a short publication time of accepted papers.
INSTRUCTIONS FOR CONTRIBUTORS
Proposals of Special Issues should be submitted to the editor-in-chief.The language of the journal is English. SCPE publishes three categories of papers: overview papers,
research papers and short communications. Electronic submissions are preferred. Overview papers and shortcommunications should be submitted to the editor-in-chief. Research papers should be submitted to the editorwhose research interests match the subject of the paper most closely. The list of editors’ research interests canbe found at the journal WWW site (http://www.scpe.org). Each paper appropriate to the journal will berefereed by a minimum of two referees.
There is no a priori limit on the length of overview papers. Research papers should be limited to approx-imately 20 pages, while short communications should not exceed 5 pages. A 50–100 word abstract should beincluded.
Upon acceptance the authors will be asked to transfer copyright of the article to the publisher. Theauthors will be required to prepare the text in LATEX 2ε using the journal document class file (based on theSIAM’s siamltex.clo document class, available at the journal WWW site). Figures must be prepared inencapsulated PostScript and appropriately incorporated into the text. The bibliography should be formattedusing the SIAM convention. Detailed instructions for the Authors are available on the SCPE WWW site athttp://www.scpe.org.
Contributions are accepted for review on the understanding that the same work has not been publishedand that it is not being considered for publication elsewhere. Technical reports can be submitted. Substantiallyrevised versions of papers published in not easily accessible conference proceedings can also be submitted. Theeditor-in-chief should be notified at the time of submission and the author is responsible for obtaining thenecessary copyright releases for all copyrighted material.