scaffold-class analysis of lead compounds by spr using a...
TRANSCRIPT

A P P L I C A T I O N N O T E 2 6
Scaffold-class analysis of lead compounds by SPR using a combination of screening and kinetic characterizationBiacore® S51 analyzes 200 lead compounds targeted against human estrogen receptors
Confident decision-making based on comprehensive analyses
• Label-free direct target binding
• High information content screens
• Detailed kinetic characterization and SAR analysis
• Predictive ADME properties
Acknowledgements The work presented in this application note is a summary of a collaboration between GlaxoSmithKline, RTP, NC, USA (Julie B. Stimmel, Thomas B. Stanley & Lisa A. Orband-Miller), Biacore Inc., USA (Sheree Long, Diana Martik & Eric Roush) and Biacore AB, Sweden (Helena Widegren & Karl Andersson). Biacore would like to acknowledge GlaxoSmithKline for their support and the provision of estrogen receptors and compounds.
INTRODUCTION
Current drug discovery approachesCurrent drug discovery approaches are largely based on
high throughput screening (HTS) of large libraries of low
molecular weight compounds against therapeutic targets.
Among the many “hits” identified from such HTS approaches,
the overwhelming majority fail to survive the increasingly
stringent scrutiny that occurs during hit-to-lead and lead
optimization phases. Compounds (and chemically-modified
derivatives) that show excellent target-binding properties
must still fulfill a number of vital criteria related to their
in vivo pharmacological properties, in the form of ADME
(Absorption, Distribution, Metabolism and Excretion)
studies. Considering that a potential drug candidate must
pass through all of these stages before entering clinical trials,
any technical approach that can increase the efficiency of the
current drug discovery approaches and reduce the proportion
of false leads as early as possible during the process would be
of considerable value.
One key to improving the efficiency of the drug discovery process is the ability to gain as much high-quality information as possible during the various phases of the operation. The sheer scale of HTS inevitably places limits on the amount and quality of information that can be obtained for each
compound screened. The efficiency of subsequent hit-to-lead,
lead optimization and early in vitro ADME stages may be
significantly enhanced, however, by the use of information-
rich technologies.
Biacore technology in drug discoveryBiacore’s surface plasmon resonance (SPR) technology is
utilized in optical biosensors that provide label-free, real-
time analysis of biomolecular interactions, producing high
quality data such as binding specificity, affinity and kinetic
rate constants. The system used in this study, Biacore® S51,
is an SPR biosensor specifically designed for drug discovery
applications, with dedicated functions for the analysis of small
molecules. Previous reports have demonstrated the value

of this system in a variety of applications, including rapid
confirmatory screening of drug target hits1, detailed kinetic
characterization of small molecule: target interactions1,
early in vitro ADME studies2 and kinetics-based SAR/QSAR
lead optimization3-4.
Background to the present studyEstrogen receptors (ERs) regulate a variety of biological
processes in the reproductive tract and gonads, as well
as in non-reproductive tissue such as the skeleton and
cardiovascular system5. Human breast tumors frequently
exhibit estrogen-dependent growth and the use of anti-
estrogens is a major therapeutic strategy against this disease6.
Other clinical problems (e.g., osteoporosis) are frequently
associated with the loss of steroid hormones at menopause,
but the use of estrogenic hormone replacement therapy
remains restricted because of fears surrounding breast
cancer. The concept of selective estrogen receptor modulators
(SERMs), pharmaceuticals exhibiting both tissue-specific
estrogen agonist and antagonist activity, has therefore been
gathering momentum as a promising approach to develop
organ-selective ER agonists7. It has been suggested for
example, that a “perfect” hormone replacement treatment
could be developed, which would have estrogenic properties
in bone and simultaneously function as an anti-estrogen in
breast tissue.
There are two major estrogen receptors, known as ERα
and ERβ. These partially conserved proteins show a strong
overlap in their distribution and function8, but also exhibit
significant differences, such as differential responses to
some anti-estrogens9. Although the significance of the two
types of ER may vary considerably depending on the precise
therapeutic situation, any drug discovery program based
on the ER as target molecule would clearly benefit from
an understanding of the behavior of lead compounds with
respect to both ERα and ERβ.
The flow cell system employed in Biacore S51 enables the
simultaneous analysis of two immobilized or captured target
molecules and is therefore ideally suited for this type of
application. In the study described in this application note,
the ligand-binding domains (LBDs) of ERα (residues 297-
555 from the 595 a.a. receptor) and ERβ (residues 257-530
from the 530 a.a. receptor) were used to analyze the binding
of a series of 200 low molecular weight compounds. These
were assigned to six groups based on their structural scaffold:
steroids, triazines, and four groups of proprietary classes
from GlaxoSmithKline (sets 1-4). Multiple approaches were
employed to analyze these compounds. Firstly, screening
assays provided rapid classification of binding to the two
targets, as well as to two major human serum proteins. A
more detailed kinetic characterization was then carried out
on approximately 150 of the compounds, producing on-off
rate plots that enabled high-resolution kinetic overviews
of the different scaffold classes as well as the identification
of individual compounds with promising lead properties.
Finally, one of the scaffold classes was selected for a kinetics-
based structure-activity relationship (SAR) analysis.
Novel strategies were employed for both assay development
and data analysis, with different approaches tailored for
the screening and kinetic characterization assays. These
different, but complementary, approaches enabled a
comprehensive analysis of the compounds on the basis of
structurally-related populations, providing high quality
information upon which further lead optimization decisions
could be made.
RESULTS
Development of screening assays Surface preparation
Initial assay development studies revealed that when ERs
were directly coupled to the sensor surface using amine
or ligand-thiol coupling, they retained little or no binding
activity (data not shown). To overcome this, an anti-his
antibody was immobilized to the sensor surface via amine
coupling and used to capture his-tagged ER ligand-binding
domains. Target consumption was minimized by mildly
cross-linking the ERs to the antibody using standard amine
coupling reagents (EDC/NHS and ethanolamine). This
surface preparation strategy (illustrated in Figure 1) resulted
in active receptors that provided a sufficiently stable surface
for more than 200 analysis cycles, with an ER consumption
of only 3 µg/run.
Figure 1. Strategy for immobilization of ERs to the sensor surface (screening
assays). Stylized sensorgrams are shown for each step in the immobilization
and assay scheme. ERα LBD was injected at 1 µM to a level of 4000 resonance
units (RU) and ERβ LBD at 2 µM to a level of 3500 RU.
Capture step Cross linking
ER
Ac tivation Antibodycoupling
Blocking
Binding Dissociation
Step 3: Screen 200 compounds from 6different scaffolds
Step 2: Estrogen receptorcaptured & mildly cross-linked
Step 1: Anti-his antibody aminecoupled to Sensor Chip CM5

Cycle number
Res
pons
e, b
indi
ng_l
ate
Res
pons
e, b
indi
ng_l
ate
-5
0
10
15
20
25
30
35
0 50 100 150 200 250 300 350
Cycle number
RUA) B) RU
-5
-5
0
10
15
20
25
30
35
0 50 100 150 200 250 300 350
-5
Cycle number
Res
pons
e, b
indi
ng_l
ate
Res
pons
e, b
indi
ng_l
ate
-5
0
10
15
20
25
30
35
0 50 100 150 200 250 300 350
Cycle number
RUA) B) RU
-5
-5
0
10
15
20
25
30
35
0 50 100 150 200 250 300 350
-5
Screening assay
The goal was to screen a relatively large set of compounds (200) for ER binding, using as rapid and simple an assay as possible. A strategy that avoided regeneration was chosen, saving a considerable amount of time during assay development. To circumvent the need for regeneration, assays were run at 32°C (to accelerate the dissociation of strong binders) and an adaptive wait time was selected to allow more dissociation time where necessary.
One effect of eliminating regeneration from the assay design is that strongly binding compounds may continue to occupy target sites during subsequent cycles, thereby masking the responses from more weakly binding compounds that come later in the run. To account for this, a total of four screens were run and the strongest binders identified in each run were moved to the end of the runs in the subsequent screens (Figure 2). This enabled a much better evaluation of the weaker binders, and while the apparent binding level of the compounds moved to a late position in the run was slightly reduced, this could be taken into consideration when assessing the data. This approach was found to be highly reproducible and robust, with excellent correlation between assays run on different days and with some samples run in a different order. Consequently, all data was averaged over the four runs.
Although several runs were required, this was more than offset by the simplified and more rapid assay development for the 200 compounds that was made possible by the regeneration-free assay format. With the objective of this part of the study being to determine ranking and relative binding levels, this approach was rapid and simple without compromising data quality.
Development of kinetic assays Surface preparation & regeneration
Whereas the surface preparation conditions for the screening assays were optimized to minimize ER consumption and assay development time, determination of kinetic rate constants places higher demands on data quality. A more standard capture assay approach (i.e. without cross-linking) was therefore used in the kinetic studies, in which compound and ER were removed from the surface by regeneration (see Methods) between analysis cycles. This ensured that fresh ER was captured before every new injection of compound and provided the optimal conditions for high quality kinetic data. Since in this capture assay format, the compound and ER are both removed between cycles, a single regeneration could be used for all compounds. For this system, 10 mM glycine pH 2.0/20 mM CHAPS was found to provide effective regeneration.
This approach did result, however, in a significant
consumption of ER (approximately 10-15 µg for each
compound characterized). Since regeneration was used in
the kinetic experiments, the assay temperature could be
reduced compared to the screening assays (from 32 to 28°C),
to minimize drift of the captured ER. Using this assay setup,
kinetic characterization of around eight compounds per
instrument per day was possible.
Kinetic characterization assay
In preliminary experiments, the solubility of the triazine
scaffold class compounds was found to be too low for
meaningful kinetic analysis, and they were excluded from
this part of the study. For the compounds belonging to
the remaining five scaffold classes (= 150), concentration
series for kinetic analyses were chosen on the basis of
qualitative ranking results from the screening assays. For
around 100 compounds, the initial concentration series
proved to be highly suitable for determination of kinetic
Figure 2. Effect of sample run order on screening results. Binding level plots for
compounds binding to the ERα LBD were generated by plotting the binding_late
report point versus cycle number. Samples were initially run randomly (A) and
subsequently with high binders (indicated by arrows in A) run last (B).

constants. Although acceptable results were also obtained
for the majority of the remaining compounds, the ranges
of concentrations spanned were found to be somewhat less
ideal. In these cases, therefore, the kinetic analyses were
repeated using modified concentration ranges (typically
requiring only minor adjustments). Four representative data
sets illustrating the diversity of binding profiles observed
among the compounds examined are shown in Figure 3.
Using this kinetic assay, rate constants were measured for the
ER-binding compounds over a range of 102-107 M-1s-1 for
association rate constants (ka), and over a range of 10-4 to
10-1 s-1 for dissociation rate constants (kd). All compounds
that exhibited dissociation rates of less than 10-4 s-1 were
nominally ascribed a kd value of 5 x 10⁻⁵ s-1 in all result plots
to indicate their slow dissociation rates.
Screening assay resultsUsing Biacore S51 Evaluation Software, each independent
screening assay can be analyzed directly to give qualitative
ranking of compounds, using two report points, taken
before and after the end of the sample injection. These
report points, which are pre-set by the software, provide a
rapid, qualitative analysis of binding interactions during the
association (binding_late) and dissociation (stability_late)
phases. Although the individual screening assays for the ER-
binding compounds were subjected to this standard Biacore
S51 evaluation (data not shown), the intention of the assay
design in this case was to analyze the results in terms of
scaffold class properties, using the averaged data from all runs.
Combined assay scaffold-class analysis
Screening data was based on two single measurements taken
from the association (A) and dissociation (D) phases of the
sensorgrams (corresponding to the report points generated
by the binding_late versus stability_late plots described
above). The results for each compound were then averaged
over the four screening assays and the mean A and D values
were used to generate A/D maps (using Microsoft Excel™),
in which compounds were grouped according to the scaffold
class to which they belonged. The distribution of compounds
among the scaffold classes was 31 steroids, 45 triazines, 36
set 1, 31 set 2, 41 set 3 and 23 set 4.
In contrast to traditional single-point assays, these A/D
maps provide an informative overview over the course
-5
0
5
10
15
20
25
-50 0 50 100 150 200
Resp
onse
RU
Time s
-5
0
5
10
15
20
25
-50 0 50 100 150 200
RU
Time s
A)
Resp
onse
-5
0
5
10
15
20
-50 0 50 100 150 200
RU
Time s
-5
0
5
10
15
20
-50 0 50 100 150 200
RU
Time s
-5
0
5
10
15
20
-50 0 50 100 150 200
RU
Time s
B)
Resp
onse
-4
-2
0
2
4
6
8
10
12
14
16
-50 0 50 100 150 200
RU
s
C)
-4
-2
0
2
4
6
8
10
12
14
16
-50 0 50 100 150 200
RU
s
-4
-2
0
2
4
6
8
10
12
14
16
-50 0 50 100 150 200
RU
s
-4
-2
0
2
4
6
8
10
12
14
16
-50 0 50 100 150 200
RU
s
C)
Time
Resp
onse
-4
-2
0
2
4
6
8
10
12
14
-50 0 50 100 150 200
RU
Time s
D)
-4
-2
0
2
4
6
8
10
12
14
-50 0 50 100 150 200
RU
Time s
-4
-2
0
2
4
6
8
10
12
14
-50 0 50 100 150 200
RU
Time s
-4
-2
0
2
4
6
8
10
12
14
-50 0 50 100 150 200
RU
Time s
D)
Figure 3. Representative data sets used for the extraction of kinetic parameters for compound binding to ERα. The four panels show compounds belonging to scaffold
classes 1 (A), 2 (B), 4 (C) and steroid (D).
-5
0
5
10
15
20
25
-50 0 50 100 150 200
Resp
onse
RU
Time s
-5
0
5
10
15
20
25
-50 0 50 100 150 200
RU
Time s
A)
Resp
onse
-5
0
5
10
15
20
-50 0 50 100 150 200
RU
Time s
-5
0
5
10
15
20
-50 0 50 100 150 200
RU
Time s
-5
0
5
10
15
20
-50 0 50 100 150 200
RU
Time s
B)
Resp
onse
-4
-2
0
2
4
6
8
10
12
14
16
-50 0 50 100 150 200
RU
s
C)
-4
-2
0
2
4
6
8
10
12
14
16
-50 0 50 100 150 200
RU
s
-4
-2
0
2
4
6
8
10
12
14
16
-50 0 50 100 150 200
RU
s
-4
-2
0
2
4
6
8
10
12
14
16
-50 0 50 100 150 200
RU
s
C)
Time
Resp
onse
-4
-2
0
2
4
6
8
10
12
14
-50 0 50 100 150 200
RU
Time s
D)
-4
-2
0
2
4
6
8
10
12
14
-50 0 50 100 150 200
RU
Time s
-4
-2
0
2
4
6
8
10
12
14
-50 0 50 100 150 200
RU
Time s
-4
-2
0
2
4
6
8
10
12
14
-50 0 50 100 150 200
RU
Time s
D)
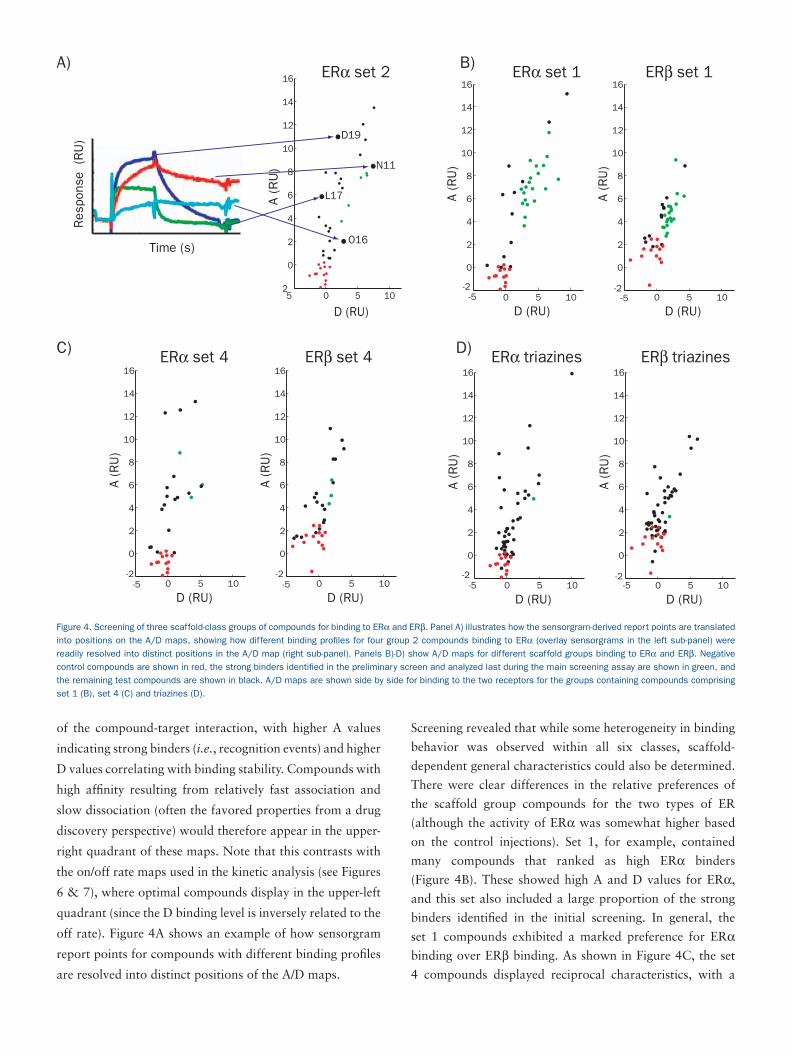
of the compound-target interaction, with higher A values
indicating strong binders (i.e., recognition events) and higher
D values correlating with binding stability. Compounds with
high affinity resulting from relatively fast association and
slow dissociation (often the favored properties from a drug
discovery perspective) would therefore appear in the upper-
right quadrant of these maps. Note that this contrasts with
the on/off rate maps used in the kinetic analysis (see Figures
6 & 7), where optimal compounds display in the upper-left
quadrant (since the D binding level is inversely related to the
off rate). Figure 4A shows an example of how sensorgram
report points for compounds with different binding profiles
are resolved into distinct positions of the A/D maps.
Screening revealed that while some heterogeneity in binding
behavior was observed within all six classes, scaffold-
dependent general characteristics could also be determined.
There were clear differences in the relative preferences of
the scaffold group compounds for the two types of ER
(although the activity of ERα was somewhat higher based
on the control injections). Set 1, for example, contained
many compounds that ranked as high ERα binders
(Figure 4B). These showed high A and D values for ERα,
and this set also included a large proportion of the strong
binders identified in the initial screening. In general, the
set 1 compounds exhibited a marked preference for ERα
binding over ERβ binding. As shown in Figure 4C, the set
4 compounds displayed reciprocal characteristics, with a
0 5 10
0
2
4
6
8
10
12
14
16
D (RU)
A (
RU
)
0 5 10
0
2
4
6
8
10
12
14
16
D (RU)
A (
RU
)
-5-2
-5-2
A)
0 5 10
0
2
4
6
8
10
12
14
16
D (RU)
A (R
U)
0 5 10
0
2
4
6
8
10
12
14
16
D (RU)
A (R
U)
-5-2
-5-2
B)
-5 0 5 10-2
0
2
4
6
8
10
12
14
16
D (RU)
A (
RU
)
-5 0 5 10 -2
0
2
4
6
8
10
12
14
16
D (RU)A (
RU
)
C) D)
5 0 5 102
0
2
4
6
8
10
12
14
16
D19
L17
N11
O16
D (RU)
A (
RU
)
Res
pons
e (R
U)
Time (s)
ERα set 2 ERα set 1 ERβ set 1
ERα set 4 ERβ set 4 ERα triazines ERβ triazines
Figure 4. Screening of three scaffold-class groups of compounds for binding to ERα and ERβ. Panel A) illustrates how the sensorgram-derived report points are translated
into positions on the A/D maps, showing how different binding profiles for four group 2 compounds binding to ERα (overlay sensorgrams in the left sub-panel) were
readily resolved into distinct positions in the A/D map (right sub-panel). Panels B)-D) show A/D maps for different scaffold groups binding to ERα and ERβ. Negative
control compounds are shown in red, the strong binders identified in the preliminary screen and analyzed last during the main screening assay are shown in green, and
the remaining test compounds are shown in black. A/D maps are shown side by side for binding to the two receptors for the groups containing compounds comprising
set 1 (B), set 4 (C) and triazines (D).
0 5 10
0
2
4
6
8
10
12
14
16
D (RU)
A (
RU
)
0 5 10
0
2
4
6
8
10
12
14
16
D (RU)
A (
RU
)
-5-2
-5-2
A)
0 5 10
0
2
4
6
8
10
12
14
16
D (RU)
A (R
U)
0 5 10
0
2
4
6
8
10
12
14
16
D (RU)
A (R
U)
-5-2
-5-2
B)
-5 0 5 10-2
0
2
4
6
8
10
12
14
16
D (RU)
A (
RU
)
-5 0 5 10 -2
0
2
4
6
8
10
12
14
16
D (RU)A (
RU
)
C) D)
5 0 5 102
0
2
4
6
8
10
12
14
16
D19
L17
N11
O16
D (RU)
A (
RU
)
Res
pons
e (R
U)
Time (s)
ERα set 2 ERα set 1 ERβ set 1
ERα set 4 ERβ set 4 ERα triazines ERβ triazines

large proportion of strong ERβ binders and generally only
moderate binding to ERα. In contrast to these ER-specific
preferences, the triazine group compounds exhibited much
less selectivity, with many exhibiting very similar binding to
both forms of the receptor (Figure 4D).
As with set 1, the steroids and set 2 compounds generally
exhibited stronger binding to ERα than to ERβ, although
the set 2 compounds were notable for the large variability
exhibited in their binding profiles to ERα. Proprietary set 3
was interesting in that it contained two quite distinct sets of
compounds, which showed either strong or weak binding to
both ER variants.
Taken together, these screening assays enabled a rapid and
efficient overview analysis of 200 potential lead compounds,
providing information-rich data on the general ER variant-
binding properties of different scaffold classes, as well as
highlighting individual compounds of potential interest for
further characterization within these classes. This approach
has a number of important benefits compared to other
screening technologies:
• Comparisons among even the strongest binders are
possible due to the resolution of binding interactions
into association- and dissociation-phases.
• The simultaneous use of two receptors provides insights
into target specificity at this early screening stage.
• In contrast to single-point binding assays, even rapidly
dissociating compounds will be detected.
• Because these plots are derived from real-time
sensorgrams, there is an in-built data quality control
and any experimental artifacts (such as insolubility
problems) will be readily observed.
An overview of the general ER-binding properties of the six
scaffold class groups is presented in Table 1.
These general characteristics are presented here mainly in
terms of binding strength, due to the complexity of the data
obtained within each scaffold-class group. It is important
to point out that a more detailed consideration of the A
and D values could also be of value when differentiating
between similar binders within the groups, or in a screen
where strong A and D value characteristic differences were
observed among the different scaffold classes. As shown later
(Figure 8), the average A binding levels from these screening
experiments predicted the affinity values derived from the
later kinetic studies with around 1 log precision, which is
perfectly sufficient for elucidating scaffold class behavior.
Kinetic studies provide a more accurate characterization at
the individual compound level, as will be described later.
Early in vitro ADME studyThe screening studies provided important information
regarding the binding of the compounds to their targets.
To be useful in a clinical environment, however, it is also
important to characterize the binding of lead compounds
to major plasma proteins: these play a major role in
transporting drug compounds through the circulation and
greatly influence their retention, distribution and delivery.
Compounds that bind too strongly (or extremely weakly) to
plasma proteins may be of little practical use, irrespective of
their target binding properties.
In this study, the compounds were analyzed for binding to human serum albumin (HSA) and α1-acid glycoprotein (AGP). HSA is the most abundant plasma protein and the principle drug transporter in the circulatory system. Although AGP is present at much lower serum concentrations, it shows a somewhat different binding profile (a preference for neutral/basic compounds, compared to an acidic compound preference for HSA) and is an important modulator of drug action. Figure 5 shows the results of this analysis for three of the scaffold sets examined. The plasma protein-binding levels were evaluated in the context of known binders and data was expressed in terms of % binding to the specific controls, warfarin (for HSA) and thioridazine (AGP).
Set 1 compounds included many strong HSA-binders, and showed significant binding to AGP (Figure 5A). Consequently, although set 1 contained the largest numbers
Scaffold Class Relative ER Selectivity Other Characteristics
Set 1 ERα many strong ERα binders
Set 2 ERα variable binding profiles (relative A & D levels) to ERα
Set 3 ERα/ERβ two groups with either strong or weak binding to both ERα & ERβ
Set 4 ERβ strong ERβ binders, intermediate ERα
Steroids ERα as Set 1, but generally slightly weaker
Triazines ERα/ERβ intermediate binders to ERα/ERβ
Table 1. Summary of general ER-binding characteristics displayed by six scaffold classes of compounds in Biacore S51 screening assays. Note that these
characteristics are designated in terms of their relative values among the six scaffold classes.

of strong ERα binders, this must be assessed in combination with the tendency of these compounds for strong binding to plasma proteins. The compounds from set 2 also exhibited a significant tendency to bind HSA and AGP, although this was reduced compared to the set 1 group (Figure 5B). From an overall lead compound assessment perspective, this observation is tempered by the inferior ER-binding characteristics of the set 2 compounds compared to set 1. The triazines showed by far the lowest tendency to bind HSA and AGP (Figure 5C), with just two examples of strong
binders to AGP.
Kinetic properties of the scaffold classesKinetic rate constants were derived for the approximately
150 compounds belonging to the five scaffold class groups
examined in this part of the study. These constants were
used to construct on/off rate maps to provide a detailed
overview of the kinetic characteristics displayed among and
within each scaffold class. These maps plot the logarithm
of the ka (y-axis) against the logarithm of the kd (x-axis)
for each compound, so that combinations of association
and dissociation rates that result in the same affinity occur
along diagonals within the map. Rapidly associating, slowly
dissociating compounds therefore appear in the upper-left
quadrant of the maps, whereas the bottom-right area of the
map displays the poorest binders.
Figure 6 shows an on/off map for all the compounds in the
kinetic study, illustrating some significant differences in
general scaffold-class characteristics (scaffold class kinetic
properties are also summarized in Table 2). The majority
of the steroid compounds clustered in a region of the map
representing the fastest association rates observed, and
with a limited range of intermediate dissociation rates. A
significant proportion of scaffold class set 1 compounds
showed slow-to-moderate dissociation rates, and several of
these exhibited sub-nanomolar affinities. The scaffold class
4 compounds were mainly characterized by relatively rapid
dissociation.
A) B) C)
Figure 5. Plasma protein binding by compounds from three different scaffold classes. Results are presented in the form of histograms showing the distribution of
compounds relative to plasma protein binding levels. The protein binding level is expressed in % terms relative to the well-characterized HSA and AGP binders, warfarin
and thioridazine, respectively. The further the bars are clustered to the right in these histograms, the higher the degree of overall plasma protein binding. Individual HSA
and AGP histograms are shown for each scaffold class; set 1 (A), set 2 (B) and triazines (C).
A) B) C)
-5 -4 -3 -2 -12
3
4
5
6
7100pM 1nM 10nM 100nM
1uM
10uM
100uM
1mM
log(kd)
log
(ka)
set 1
set 2
set 3
set 4
steroids
non-binders
Figure 6. On-off rate map of combined kinetic assays for compound binding to
ERα. As described in the text, the y-axis indicates increasing association rates,
while the x-axis indicates increasing dissociation rates. Affinities of the lead
compound on the map therefore increase in the direction bottom-right to top-
left. The key to the right of the map indicates the symbols used for the different
scaffold classes, and the inset in the bottom-right corner shows the number of
compounds from each scaffold class that were classified as non-binders.
A) B) C)
In contrast to these clustered kinetic characteristics,
compounds from the set 2 and 3 compounds exhibited
very diverse association and dissociation rates and were
more widely distributed in the map. Both of these scaffold
classes also include individual compounds exhibiting only
moderate target affinity, but with individual rate constant
characteristics (fast association or slow dissociation) that
present the possibility for chemical development to improve
affinity by specifically targeting the less desirable kinetic
property.
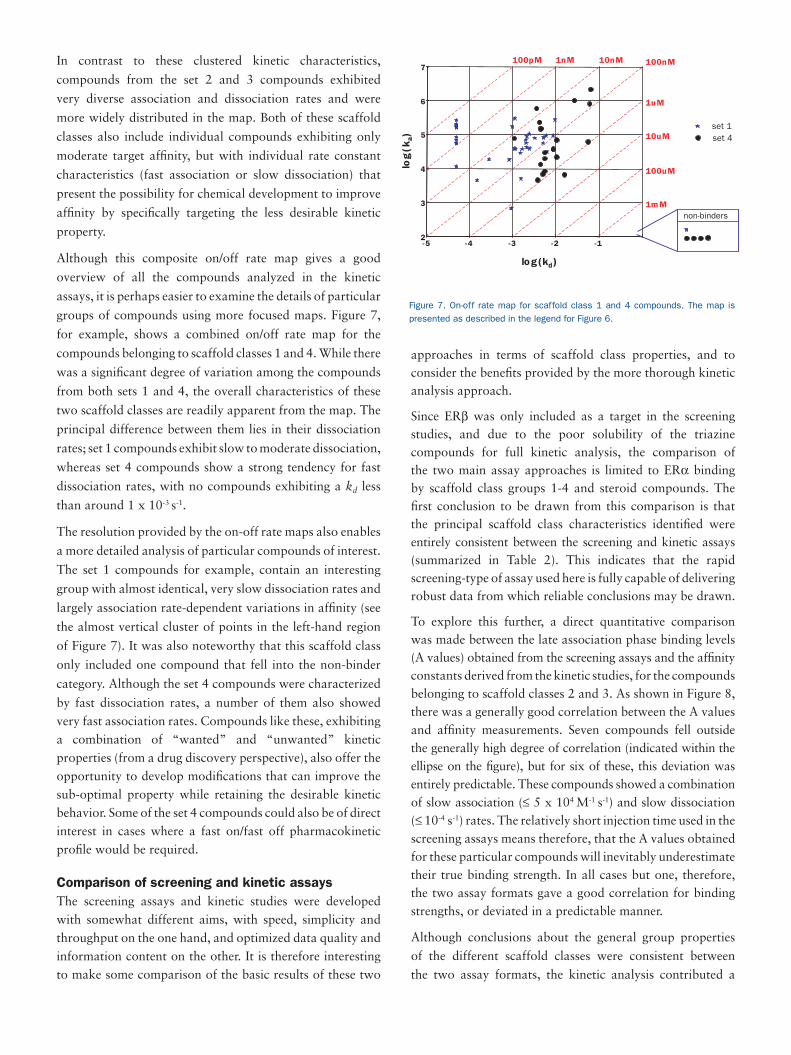
Although this composite on/off rate map gives a good
overview of all the compounds analyzed in the kinetic
assays, it is perhaps easier to examine the details of particular
groups of compounds using more focused maps. Figure 7,
for example, shows a combined on/off rate map for the
compounds belonging to scaffold classes 1 and 4. While there
was a significant degree of variation among the compounds
from both sets 1 and 4, the overall characteristics of these
two scaffold classes are readily apparent from the map. The
principal difference between them lies in their dissociation
rates; set 1 compounds exhibit slow to moderate dissociation,
whereas set 4 compounds show a strong tendency for fast
dissociation rates, with no compounds exhibiting a kd less
than around 1 x 10⁻³ s-1.
The resolution provided by the on-off rate maps also enables
a more detailed analysis of particular compounds of interest.
The set 1 compounds for example, contain an interesting
group with almost identical, very slow dissociation rates and
largely association rate-dependent variations in affinity (see
the almost vertical cluster of points in the left-hand region
of Figure 7). It was also noteworthy that this scaffold class
only included one compound that fell into the non-binder
category. Although the set 4 compounds were characterized
by fast dissociation rates, a number of them also showed very fast association rates. Compounds like these, exhibiting a combination of “wanted” and “unwanted” kinetic properties (from a drug discovery perspective), also offer the opportunity to develop modifications that can improve the sub-optimal property while retaining the desirable kinetic behavior. Some of the set 4 compounds could also be of direct interest in cases where a fast on/fast off pharmacokinetic profile would be required.
Comparison of screening and kinetic assaysThe screening assays and kinetic studies were developed with somewhat different aims, with speed, simplicity and throughput on the one hand, and optimized data quality and information content on the other. It is therefore interesting to make some comparison of the basic results of these two
approaches in terms of scaffold class properties, and to consider the benefits provided by the more thorough kinetic analysis approach.
Since ERβ was only included as a target in the screening studies, and due to the poor solubility of the triazine compounds for full kinetic analysis, the comparison of the two main assay approaches is limited to ERα binding by scaffold class groups 1-4 and steroid compounds. The first conclusion to be drawn from this comparison is that the principal scaffold class characteristics identified were entirely consistent between the screening and kinetic assays (summarized in Table 2). This indicates that the rapid screening-type of assay used here is fully capable of delivering robust data from which reliable conclusions may be drawn.
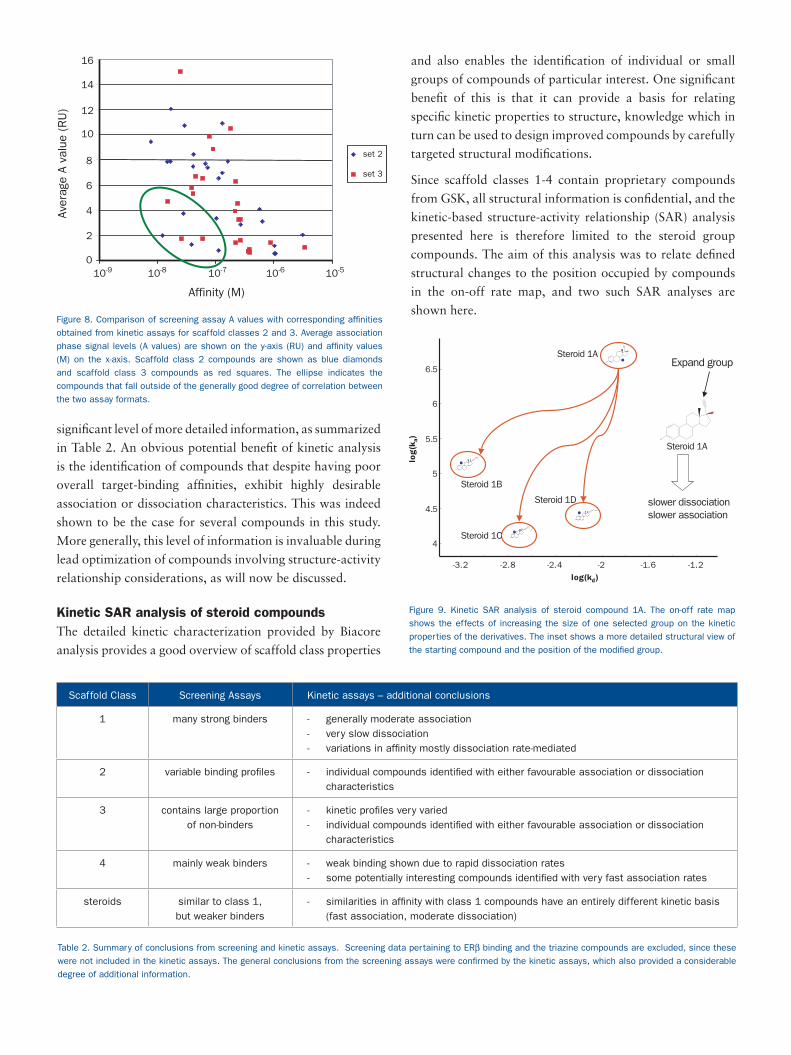
To explore this further, a direct quantitative comparison was made between the late association phase binding levels (A values) obtained from the screening assays and the affinity constants derived from the kinetic studies, for the compounds belonging to scaffold classes 2 and 3. As shown in Figure 8, there was a generally good correlation between the A values and affinity measurements. Seven compounds fell outside the generally high degree of correlation (indicated within the ellipse on the figure), but for six of these, this deviation was entirely predictable. These compounds showed a combination of slow association (≤ 5 x 10⁴ M-1 s-1) and slow dissociation (≤ 10-4 s-1) rates. The relatively short injection time used in the screening assays means therefore, that the A values obtained for these particular compounds will inevitably underestimate their true binding strength. In all cases but one, therefore, the two assay formats gave a good correlation for binding strengths, or deviated in a predictable manner.
Although conclusions about the general group properties
of the different scaffold classes were consistent between
the two assay formats, the kinetic analysis contributed a
-5 -4 -3 -2 -12
3
4
5
6
7100pM 1nM 10nM 100nM
1uM
10uM
100uM
1mM
log(kd)
log
(ka)
set 1set 4
non-binders
Figure 7. On-off rate map for scaffold class 1 and 4 compounds. The map is
presented as described in the legend for Figure 6.
significant level of more detailed information, as summarized
in Table 2. An obvious potential benefit of kinetic analysis
is the identification of compounds that despite having poor
overall target-binding affinities, exhibit highly desirable
association or dissociation characteristics. This was indeed
shown to be the case for several compounds in this study.
More generally, this level of information is invaluable during
lead optimization of compounds involving structure-activity
relationship considerations, as will now be discussed.
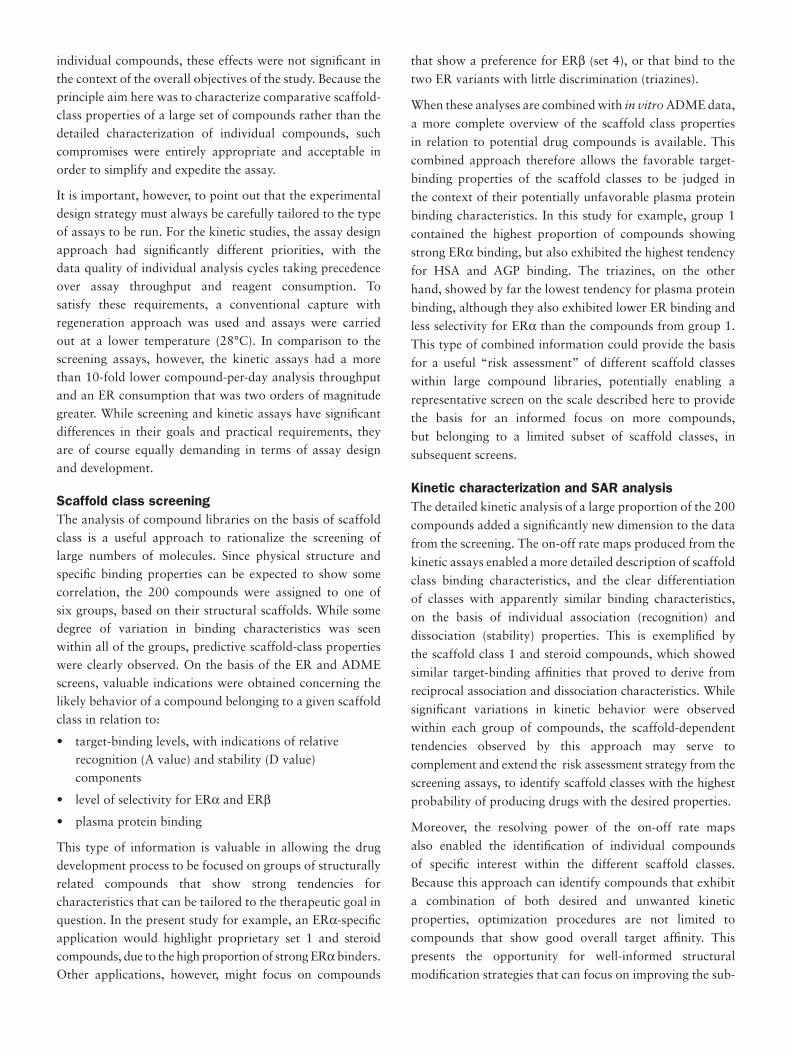
Kinetic SAR analysis of steroid compoundsThe detailed kinetic characterization provided by Biacore
analysis provides a good overview of scaffold class properties
and also enables the identification of individual or small
groups of compounds of particular interest. One significant
benefit of this is that it can provide a basis for relating
specific kinetic properties to structure, knowledge which in
turn can be used to design improved compounds by carefully
targeted structural modifications.
Since scaffold classes 1-4 contain proprietary compounds
from GSK, all structural information is confidential, and the
kinetic-based structure-activity relationship (SAR) analysis
presented here is therefore limited to the steroid group
compounds. The aim of this analysis was to relate defined
structural changes to the position occupied by compounds
in the on-off rate map, and two such SAR analyses are
shown here.Affinity (M)
Ave
rage
A v
alue
(R
U)
0
2
4
6
8 set 2
set 3
10
12
14
16
10-9 10-8 10-7 10-6 10-5
Scaffold Class Screening Assays Kinetic assays – additional conclusions
1 many strong binders - generally moderate association- very slow dissociation- variations in affinity mostly dissociation rate-mediated
2 variable binding profiles - individual compounds identified with either favourable association or dissociation characteristics
3 contains large proportion of non-binders
- kinetic profiles very varied- individual compounds identified with either favourable association or dissociation
characteristics
4 mainly weak binders - weak binding shown due to rapid dissociation rates- some potentially interesting compounds identified with very fast association rates
steroids similar to class 1, but weaker binders
- similarities in affinity with class 1 compounds have an entirely different kinetic basis (fast association, moderate dissociation)
Table 2. Summary of conclusions from screening and kinetic assays. Screening data pertaining to ERβ binding and the triazine compounds are excluded, since these
were not included in the kinetic assays. The general conclusions from the screening assays were confirmed by the kinetic assays, which also provided a considerable
degree of additional information.
Figure 8. Comparison of screening assay A values with corresponding affinities
obtained from kinetic assays for scaffold classes 2 and 3. Average association
phase signal levels (A values) are shown on the y-axis (RU) and affinity values
(M) on the x-axis. Scaffold class 2 compounds are shown as blue diamonds
and scaffold class 3 compounds as red squares. The ellipse indicates the
compounds that fall outside of the generally good degree of correlation between
the two assay formats.
O
O
CC I 99
O
F
FF
O
O
O
GR 102312XO
O
GR 102303X
-3.2 -2.8 -2.4 -2 -1.6 -1.2
4
4.5
5
5.5
6
6.5
O
O
CCI 99
log(kd)
log
(ka)
slower dissociationslower association
Expand group
Steroid 1C
Steroid 1D
Steroid 1A
Steroid 1B
Steroid 1A
Figure 9. Kinetic SAR analysis of steroid compound 1A. The on-off rate map
shows the effects of increasing the size of one selected group on the kinetic
properties of the derivatives. The inset shows a more detailed structural view of
the starting compound and the position of the modified group.

Figure 9 shows the effect of increasing the size of the group
at one particular position in steroid compound 1A. The
starting compound has a 3.5 nM affinity for ERα, with a
relatively fast association rate (4 x 10⁶ M-1 s-1). Increasing the
size of the selected group resulted in a drop in association
rate of between 1 to 2 orders of magnitude for all three
derivatives examined. This change was balanced to some
degree in all cases, however, by a corresponding decrease
in dissociation rate. In one case, these changes were well
balanced and the resulting affinity was almost identical
to the original compound. For the other two derivatives,
however, the effects of group modification on association rate
were dominant and a significant drop in affinity was seen.
In the example just described, structural modification
had simultaneous effects on association and dissociation
characteristics and resulted in lower target affinity in two
out of three cases. It is equally possible to produce modified
derivatives with improved target affinity, however, and
to selectively affect one particular kinetic property of the
compound. This is illustrated in Figure 10, which shows
the effects of adding oxygen to defined positions of another
steroid compound (2A). In this case, addition of oxygen
resulted in a marked increase in association rate for all
four derivatives. The effects of these modifications were
significantly less pronounced on the dissociation rates of the
derivatives, so that all four exhibit improved target affinity
DISCUSSION
The advent of high throughput screening approaches to the drug discovery process has promised much, but has yet to yield anything approaching its full potential. The sheer
quantity of hits that are often produced by HTS, together with the high proportion of false-positives, make this an expensive and inefficient process. These problems are further complicated by the fact that many compounds judged to be good leads in terms of their physical target affinity might fail due to a myriad of complications, including unfavorable pharmacokinetic profiles and inappropriate plasma protein binding characteristics. Any approach that can help to rationalize this process would be of great potential benefit.
This study demonstrates the value of Biacore’s SPR technology in this area, providing invaluable scaffold-class ranking and early ADME data from rapid screening assays, together with detailed kinetic characterization and kinetic SAR analysis. In practice, of course, many more compounds could be screened using a similar approach to that described here, providing rapid and reliable data upon which to filter and prioritize compounds for the more time-consuming, but highly informative characterization provided by kinetic assays. The intention here, however, was to develop assays to analyze as many of the available compounds as possible, using both approaches, so that approximately 75% of the total compounds screened were also subjected to kinetic analysis.
Assay designThe combined approaches described here provided a significant amount of high-quality information on 200 lead compounds. This was achieved largely by virtue of a well-considered assay design and by analyzing the data obtained in terms of group properties of the scaffold classes, although detailed information on individual compounds was also obtained from the kinetic assays.
The value of a good assay design was graphically demonstrated here for the screening assays:
• the cross-linked capture of the ERs solved the initial immobilization difficulties with these proteins, while minimizing their consumption during the assay
• the no-regeneration strategy employed greatly simplified the screening assay development stages, which may have proven to be very complex given the number of samples involved
Regeneration was bypassed by running at a relatively high temperature (32°C), incorporating an adaptive wait step between sample injections and by running compounds identified as the strongest binders in the initial screen at the end of subsequent assays. These conditions resulted in a reproducible, robust and reliable assay that minimized consumption of reagents. Although these conditions may have influenced the absolute binding levels of some
O
O
CCI 73
O
O
GF 119697X
O
O
O
CCI 472
O
O
O
GR 93692X
O
GW 407621X
O
6.8
6.4
log
(ka)
6
5.6
5.2
-2.5 -2 -1.5 -1log(kd)
Steroid 2E
Steroid 2A
Steroid 2A
Steroid 2D
Steroid 2C
Steroid 2B
Add oxygen
better recognition
Figure 10. Kinetic SAR analysis of steroid compound 2A. The on-off rate
map shows the effects of adding oxygen to defined positions on the kinetic
properties of the derivatives. The inset shows a more detailed structural view of
the starting compound and the positions to which oxygen was added.
individual compounds, these effects were not significant in the context of the overall objectives of the study. Because the principle aim here was to characterize comparative scaffold-class properties of a large set of compounds rather than the detailed characterization of individual compounds, such compromises were entirely appropriate and acceptable in order to simplify and expedite the assay.
It is important, however, to point out that the experimental design strategy must always be carefully tailored to the type of assays to be run. For the kinetic studies, the assay design approach had significantly different priorities, with the data quality of individual analysis cycles taking precedence over assay throughput and reagent consumption. To satisfy these requirements, a conventional capture with regeneration approach was used and assays were carried out at a lower temperature (28°C). In comparison to the screening assays, however, the kinetic assays had a more than 10-fold lower compound-per-day analysis throughput and an ER consumption that was two orders of magnitude greater. While screening and kinetic assays have significant differences in their goals and practical requirements, they are of course equally demanding in terms of assay design and development.
Scaffold class screeningThe analysis of compound libraries on the basis of scaffold class is a useful approach to rationalize the screening of large numbers of molecules. Since physical structure and specific binding properties can be expected to show some correlation, the 200 compounds were assigned to one of six groups, based on their structural scaffolds. While some degree of variation in binding characteristics was seen within all of the groups, predictive scaffold-class properties were clearly observed. On the basis of the ER and ADME screens, valuable indications were obtained concerning the likely behavior of a compound belonging to a given scaffold class in relation to:
• target-binding levels, with indications of relative recognition (A value) and stability (D value) components
• level of selectivity for ERα and ERβ
• plasma protein binding
This type of information is valuable in allowing the drug development process to be focused on groups of structurally related compounds that show strong tendencies for characteristics that can be tailored to the therapeutic goal in question. In the present study for example, an ERα-specific application would highlight proprietary set 1 and steroid compounds, due to the high proportion of strong ERα binders. Other applications, however, might focus on compounds
that show a preference for ERβ (set 4), or that bind to the two ER variants with little discrimination (triazines).
When these analyses are combined with in vitro ADME data, a more complete overview of the scaffold class properties in relation to potential drug compounds is available. This combined approach therefore allows the favorable target-binding properties of the scaffold classes to be judged in the context of their potentially unfavorable plasma protein binding characteristics. In this study for example, group 1 contained the highest proportion of compounds showing strong ERα binding, but also exhibited the highest tendency for HSA and AGP binding. The triazines, on the other hand, showed by far the lowest tendency for plasma protein binding, although they also exhibited lower ER binding and less selectivity for ERα than the compounds from group 1. This type of combined information could provide the basis for a useful “risk assessment” of different scaffold classes within large compound libraries, potentially enabling a representative screen on the scale described here to provide the basis for an informed focus on more compounds, but belonging to a limited subset of scaffold classes, in subsequent screens.
Kinetic characterization and SAR analysisThe detailed kinetic analysis of a large proportion of the 200 compounds added a significantly new dimension to the data from the screening. The on-off rate maps produced from the kinetic assays enabled a more detailed description of scaffold class binding characteristics, and the clear differentiation of classes with apparently similar binding characteristics, on the basis of individual association (recognition) and dissociation (stability) properties. This is exemplified by the scaffold class 1 and steroid compounds, which showed similar target-binding affinities that proved to derive from reciprocal association and dissociation characteristics. While significant variations in kinetic behavior were observed within each group of compounds, the scaffold-dependent tendencies observed by this approach may serve to complement and extend the risk assessment strategy from the screening assays, to identify scaffold classes with the highest probability of producing drugs with the desired properties.
Moreover, the resolving power of the on-off rate maps also enabled the identification of individual compounds of specific interest within the different scaffold classes. Because this approach can identify compounds that exhibit a combination of both desired and unwanted kinetic properties, optimization procedures are not limited to compounds that show good overall target affinity. This presents the opportunity for well-informed structural modification strategies that can focus on improving the sub-

optimal property displayed by a compound that already possesses a highly desirable kinetic characteristic (e.g., trying to specifically improve the stability of a compound that exhibits very rapid association, but which dissociates too rapidly).
The use of separate SAR (or QSAR) models for association and dissociation properties, employing the kinetic data generated by Biacore S51, enables approaches that are tailored to the intended clinical situation. This could include, for example, modifications aimed at producing a very specific pharmokinetic profile (e.g. fast on/fast off) where required, or to maximize target affinity by simultaneously increasing the association rate and decreasing the dissociation rate.
For the 200 compounds described here, the combination of careful, application-tailored experimental design, a multiple analysis strategy and the assessment of data on the basis of structural scaffold-class characteristics were able to produce a wealth of valuable information. The predictive precision of the screening data was more than sufficient to reliably describe general scaffold class properties, while the kinetics approach provided higher-resolution characterization that was equally applicable to individual compounds. The study described in this application note therefore illustrates further the power, versatility and great potential of Biacore S51 in many aspects of the drug discovery process.
METHODS
All assays were run on Biacore S51 using Series S Sensor Chip CM5. Immobilization was carried out at 25°C in all cases and assays were performed at either 32°C (screening assays) or 28°C (kinetic assays).
Target screening assay
Anti-his antibody (penta-his, BSA-free, Qiagen) was immobilized using standard amine coupling. ERα and ERβ LBDs were bound to the antibody using a capture injection and cross-linked using the amine coupling reagents, EDC/NHS and ethanolamine (see Results). The assay buffer used was PBS (53 mM Na2HPO4, 12.5 mM KH2PO4, 70 mM NaCl, pH 7.4), containing 1 mM DTT and 3% DMSO. Drug compounds were analyzed at a concentration of 1 µM (60 s injection time), with estriol and tamoxifen as positive controls for ER binding and DMSO as a negative control. No regeneration step was used, but an adaptive wait was employed at the end of the cycle. Assays were carried out at 32°C, using a 384 well format.
ADME assay
The serum proteins, HSA and AGP were immobilized directly, using standard amine coupling and standard surface thiol coupling, respectively. Running buffer was the same used during the screening assays, except that DTT was omitted. Analyte compounds were analyzed at 1 µM and warfarin (for HSA) and thioridazine (for AGP) were used as positive controls. As in the ER screening assays, DMSO was used as a negative control.
Kinetic assay
The same anti-his antibody employed in the target screening assays was used for capturing ERα ligands, but in this case, cross-linking was not carried out. The running buffer was the same as that used in the screening assays, except that the DTT was replaced with 0.2 mM TCEP. After each cycle of compound binding, both the compound and ER were removed from the sensor surface by regeneration with 10 mM glycine pH 2.0/ 20 mM CHAPS. The concentration ranges initially used for each compound were based on qualitative ranking data obtained from the screening assays. In the approximately one third of cases where these ranges proved to be sub-optimal, largely as a result of compound solubility or non-specific binding complications, minor concentration adjustments were made as appropriate and the compounds were re-analyzed. Estriol and 4-hydroxytamoxifen (4-HT) were run as repeated positive control compounds during the kinetic assays. All kinetic analyses were performed at 28°C using a 96 well format.
References1. Technology Note 5: Biacore S51 - Integrating the Hit-to-Lead Process. Characterization of thrombin leads and the identification of potent binders with favorable protein binding properties. BR-9002-16
2. Application Note 30: Characterization of drug-plasma protein interactions using surface plasmon resonance. BR-9002-99
3. Application Note 13: The characterization and selection of HIV-1 protease inhibitors using Biacore’s SPR technology. BR-9002-87
4. Proof statement: Quantitative structure activity relationships (QSAR) studies using Biacore. BR-9003-15
5. McDonnell, D.P and J.D. Norris. Connections and regulation of the human estrogen receptor. Science, 296, 1642-4 (2002)
6. Gradishar, W.J. and V.C. Jordan. The evolving role of endocrine therapy for the treatment and prevention of breast cancer. Cancer Chemother. Biol. Response. Modif., 20, 227-38. (2002)
7. McDonnell, D.P. et al. Elucidation of the molecular mechanisms of action of selective estrogen receptor modulators. Am. J. Cardiol., 90, F35-43. (2002)
8. Dupont, S. et al. Effect of single and compound knockouts of estrogen receptors alpha (ERα) and beta (ERβ) on mouse reproductive phenotypes. Development, 127, 4277-91. (2000)
9. McDonnell, D.P. et al. Definition of the molecular and cellular mechanisms underlying the tissue-selective agonist/antagonist activities of selective estrogen receptor modulators. Recent Prog. Horm. Res., 57, 295-316. (2002)
BIACORE® is a registered trademark of Biacore AB. Copyright© Biacore 2004 BR
-900
3-47
Nov
embe
r 20
04 V
ersi
on 1
.0