sbp- first quarterly review
DESCRIPTION
Payment Systems Review-SBPJuly-September, 2013TRANSCRIPT

Payment Systems Review
July-September, 2013
1st Quarter FY14

Payment Systems Review July-September, 2013
Payment Systems Department 2
1. INTRODUCTION ............................................................................................................................... 5
2. LARGE VALUE PAYMENT SYSTEMS ........................................................................................... 6
3. RETAIL PAYMENT SYSTEMS ........................................................................................................ 8
3.1 ATMS ....................................................................................................................................................... 8
3.2 REAL-TIME ONLINE BANKING (RTOB) .................................................................................................... 9
3.3 POINT OF SALE (POS) ............................................................................................................................... 9
3.4 INTERNET BANKING ............................................................................................................................... 10
3.5 MOBILE PHONE BANKING ...................................................................................................................... 10
3.6 CALL CENTER BANKING ......................................................................................................................... 11
3.7 PLASTIC CARDS COMPOSITION ............................................................................................................... 12
PAYMENT SYSTEMS IN PAKISTAN AT A GLANCE ........................................................................... 13

Payment Systems Review July-September, 2013
Payment Systems Department 3
For queries comments and your feedback on this publication,
please contact us at [email protected]. Please also include your
contact details in your email

Payment Systems Review July-September, 2013
Payment Systems Department 4
Executive Summary
This report aims to review recent developments in the area of large and retail value payment
systems in Pakistan while focusing July to September quarter of FY2014. During the quarter
under review, Pakistan Real-time Interbank Settlement Mechanism (PRISM), the large value
payment system of the country processed 131 thousand payments worth Rs. 30.6 trillion. This
shows a decrease of 2.8% and 26.7% in Volume and Value respectively compared to the
previous quarter. This decrease is mainly due to reduction in government securities settlement
transactions by the central bank.
The Volume of e-Banking transactions in Pakistan has grown considerably since July 2012. The
number of transactions done via ATMs reached around 60 million in the first quarter (July to
September) of 2013-14. The number of ATMs in the country is growing at an average of around
3.2% reaching 6,974 ATMs for the current quarter. As on 30th
September 2013, for every
100,000 people, there are 3.8 ATMs in the country whereas during the same period, Rs. 591
billion were transacted using this channel. The number of Real Time Online Branches (RTOB) is
10,135 which accounts for 95% of the total bank branches in the country; around 21 million
transactions amounting Rs. 5.6 trillion were performed via this channel during the first quarter
(July-September) of FY2013-14. As on 30th
September 2013, there were around 18.5 Point of
Sale machines for every 100,000 people in the country. The fastest growing payment channel in
the country is Mobile Banking where the number of transactions grew by 70% and the Value
transacted grew by 236% compared with the same period of last year. Presently there are around
1.4 million registered users of Mobile Banking in the country.
The number of Plastic cards (Debit, Credit, and ATM only Cards) reached 23.4 million showing
a growth of 4.7% compared with the previous quarter. The number of Debit cards is significantly
high (89%) among Plastic cards.

Payment Systems Review July-September, 2013
Payment Systems Department 5
1. Introduction
The payment systems in Pakistan comprise of various paper and electronic based instruments
that range from conventional paper based mechanisms to modern electronic systems. These
payment systems range from High Value-Low Volume Systems (like PRISM) to Retail Systems
like cheque clearing, interoperable switches and other ancillary systems.
e-Banking has shown a consistent growth in Pakistan despite a number of impediments
pertaining to power availability, load shedding, connectivity and bandwidth requirements.
Among electronic ADCs, ATM and RTOBs have contributed significantly in terms of number
and amount of transactions respectively. Moreover, the ATM infrastructure has also shown
consistent growth especially
after SBP regulation which
requires banks to have a one to
one branch to ATM ratio.
During the quarter under
review, the Volume of e-
Banking transactions grew by
29% compared to the same
period last year and by 5.2%
when compared to the
previous quarter. However, Value of these transactions has shown a marginal growth of 0.1%
compared to the same period of last year and declined 17.8% when compared to previous
quarter.
Further, in the composition of total e-Banking transactions, ATM has the highest share of 64.6%
in Volume and 9.2% share in Value of transactions. RTOB has the highest share of 87.6% in
Value with 22.8% share in Volume of transactions. The remaining portion of transactions, in
terms of Volume, is captured by POS, Internet, Call Center and Mobile Banking.

Payment Systems Review July-September, 2013
Payment Systems Department 6
Table.1: Composition of e-Banking Transactions (Number in Thousands & Amount in Million Rupees)
Channels Q1 FY13 Q4 FY13 Q1 FY14
No. Amount No. Amount No. Amount
ATM 43,877 430,418 55,735 557,771 59,416 590,914
Points of Sale (POS) 4,329 20,766 4,386 22,404 6,374 30,504
Real Time online
Banking (RTOB ) 20,181 5,847,406 22,959 7,068,046 20,979 5,626,778
Mobile Phone Banking 804 4,176 1,319 9,873 1,372 14,050
Call Centre (IVR)
Banking 166 2,093 157 2,052 166 2,374
Internet Banking 2,020 109,967 2,933 144,311 3,714 157,021
Total:- 71,377 6,414,826 87,489 7,804,457 92,021 6,421,641
Despite the range of alternate new electronic payment mechanisms, cash and other paper based
modes continue to remain preferable methods of payments. Table 2 shows that during the current
quarter, around 94.2 % in Volume and 84% in Value of transactions relating to paper based
instruments were carried out through cheques. However, total paper based transactions showed a
decline of 4% in Volume and 4.6% in Value of transactions when compared with the previous
quarter.
Table 2: Composition of Paper Based Payments-Instrument wise (Number in Million & Amount in Billion Rupees)
2. Large Value Payment Systems
The Large Value Payment System, Pakistan Real-time Interbank Settlement Mechanism
(PRISM), has shown a mixed trend of transaction settlement over the last five quarters. During
the current quarter, total transactions settled in PRISM showed an increase of 18.8% in Volume
1 Other includes Telegraphic Transfers, Coupon Payments, Cheque Refunds, Income tax vouchers etc.
Instruments
Q1 FY13 Q4 FY13 Q1 FY14
No. Amount No. Amount No. Amount
Cash withdrawals 40 3,669 42 4,014 41 3,857
Transfer 25 11,642 28 13,213 26 12,629
Clearing 16 6,250 16 6,589 15 6,149
Pay Orders 2 1,381 2 1,594 2 1,479
Demand Drafts 2 728 2 780 2 715
Other1 1 2,212 2 2,079 1 2,133
Total:- 86 25,882 91 28,269 87 26,962

Payment Systems Review July-September, 2013
Payment Systems Department 7
and a decline of 20.6% in Value of transactions compared to same quarter of the previous year.
The decrease in Volume and Value of securities settlement is due to reduction in Open Market
Operation (OMO) injections
conducted by the central bank.
The bifurcation of Value of
transactions settled through
PRISM comprises of Rs 12.6
trillion (41.1%) Interbank
Settlements, Rs. 3.0 trillion
(9.8%) Retail Cheque
Clearing settlement by the
clearing house and Rs. 15.0
trillion (49.1%) to the settlement of interbank government securities trade. The composition of
Volume of high Value transactions is: 107,078 (81.8%) Interbank Fund Transfers, 11,135 (8.5%)
retails cheques clearings and 12,759 (9.7%) securities settlements.
In terms of composition of PRISM transactions, the share of interbank fund transfer increased by
3.1% in Volume and 9.7 % in Value compared with the previous quarter.
Table 3: PRISM Quarterly Transactions (Amount in Billion Rupees)
Transactions Type
Q1 FY13 Q4 FY13 Q1 FY14
No. Amount No. Amount No. Amount
Interbank Funds Transfer 80,765 10,938 106,044 13,087 107,078 12,564
Retails Cheques Clearing 10,498 3,014 11,773 3,462 11,135 3,010
Securities Settlements 18,992 24,539 16,921 25,172 12,759 15,002
Total:- 110,255 38,491 134,738 41,721 130,972 30,576
Similarly, the share of securities settlement decreased by 2.8% in Volume and 11.3 % in Value
respectively in comparison with the previous quarter, whereas, the share of retail cheques
clearing decreased by 0.2% in Volume , however, it showed an increase by 1.5% in Value.

Payment Systems Review July-September, 2013
Payment Systems Department 8
3. Retail Payment Systems
The retail payment infrastructure in Pakistan consists of ATMs, RTOBs, Internet Banking,
Mobile Banking and Call Centers. Amongst these retail ADC channels, ATMs and RTOBs
contribute significant number and amount of transactions due to their accessibility and
convenience for the users.
3.1 ATMs
During the current quarter,
217 ATMs were added to the
network (growth rate 3.2%
compared to the previous
quarter) bringing the total
number of ATMs to 6,974.
ATMs primarily remained
the preferred channel for cash withdrawals accounting for 83.1% of the total amount transacted
via this mode. Moreover, 3rd
Party Account to Account Fund Transfer contributed 9% followed
by Account to Account Fund Transfer which contributed 6% among transactions performed via
ATM. The total amount transacted via ATMs increased by 6% compared to the last quarter of
FY13 and 37% more compared with the first quarter of the last fiscal year (Table 4).
Table 4: Composition of ATMS Transactions (Number in Thousands & Amount in Million Rupees)
*Number and amount rounded to thousand
Transactions Type
Q1 FY13 Q4 FY13 Q1 FY14
No. Amount No. Amount No. Amount
Cash Withdrawal 42,222 353,517 53,517 452,804 57,260 491,335
Cash Deposit 4 38 3 24 3 30
Deposit of Payment
Instrument * 1 * 2 * 1
Utility Bills Payment 82 276 109 283 131 416
A/c to A/c Funds Transfer 691 31,416 898 43,821 836 40,851
Third Party A/c to A/c Funds
Transfer 877 45,169 1,207 60,837 1,186 58,280
Total:- 43,877 430,418 55,735 557,771 59,416 590,914

Payment Systems Review July-September, 2013
Payment Systems Department 9
3.2 Real-time Online Banking (RTOB)
Out of the existing 10,696 bank branches, 95% (10,135 branches) are providing Real-Time
Online Banking (RTOB) services as per the current quarter. In terms of amount, 88% of e-
Banking transactions are conducted via RTOB transfers. In RTOB, Account to Account Fund
Transfer contributed 62% followed by 3rd
Party Account to Account Fund Transfer (19%).
Table.5: Composition of RTOBs Transactions
(Number in Thousands & Amount in Million Rupees)
Transactions Type
Q1 FY13 Q4 FY13 Q1 FY14
No. Amount No. Amount No. Amount
Real Time Cash Withdrawals 3,948 310,213 4,911 442,573 4,434 389,583
Real Time Cash Deposits 7,234 587,491 8,322 660,874 8,146 625,495
Real Time A\C to A\C Funds
Transfers 5,876 3,959,511 6,269 4,849,176 4,990 3,524,246
Real Time 3rd Party A\C to A\C
Funds Transfers 3,123 990,191 3,458 1,115,423 3,410 1,087,454
Total:- 20,181 5,847,406 22,960 7,068,046 20,980 5,626,778
RTOB transactions of current quarter showed a decline by 8.6% in number and 20.4% in amount
of transactions compared to the previous quarter.
3.3 Point of Sale (POS)
During the quarter under review, the net number of POS machines remained almost unchanged
compared with the previous quarter i.e. 33,749. However, both the Volume and Value of
transactions increased by around 47 % compared with same quarter of previous year while
compared to the previous quarter it grew by 45.3% in Volume and 36.2% in Value.
Table.6 Point of Sale (POS) Number and Transactions Trend (Number in Thousands & Amount in Million Rupees)
Period Number of POS Number Amount
July-September,2012 34,229 4,329 20,766
October-December,2012 34,724 4,547 22,060
January-March.2013 33,189 4,047 21,350
April-June,2013 33,748 4,386 22,404
July-September,2013 33,749 6,374 30,504

Payment Systems Review July-September, 2013
Payment Systems Department 10
3.4 Internet Banking
Consumers can avail a variety
of financial services through
Internet Banking such as
Utility Bill Payment, Account
to Account Funds Transfer,
Third Party Account to
Account Fund Transfer and
Account Information. As on
30th
September 2013, twenty
two banks are offering Internet Banking services that constitute to a Volume share of 4% of total
e-Banking transactions. During the quarter under review, 3.7 million transactions amounting to
Rs.157 billion have been conducted by 1.3 million registered internet banking users. This shows
a growth of 26.6% in Volume and 8.8% in Value of transactions compared to the previous
quarter. Table 7 also shows that 53% of the transactions done through Internet Banking
comprised of funds transfer where 47% pertain to making bills payments.
Table.7: Composition of Internet Banking Transactions
(Number in Thousands & Amount in Million Rupees)
Transactions Type
Q1 FY13 Q4 FY13 Q1 FY14
No. Amount No. Amount No. Amount
Payment Through Internet
(Excl. Util. Bill Payments) 306 51,336 424 66,691 461 71,847
Utility Bills Payment 588 2,134 707 2,343 759 2,602
A/c to A/c Funds Transfer 520 27,156 840 36,013 1,207 41,032
3rd Party A/c to A/c Funds
Transfer 606 29,339 963 39,264 1,287 41,540
Total:- 2,020 109,965 2,934 144,311 3,714 157,021
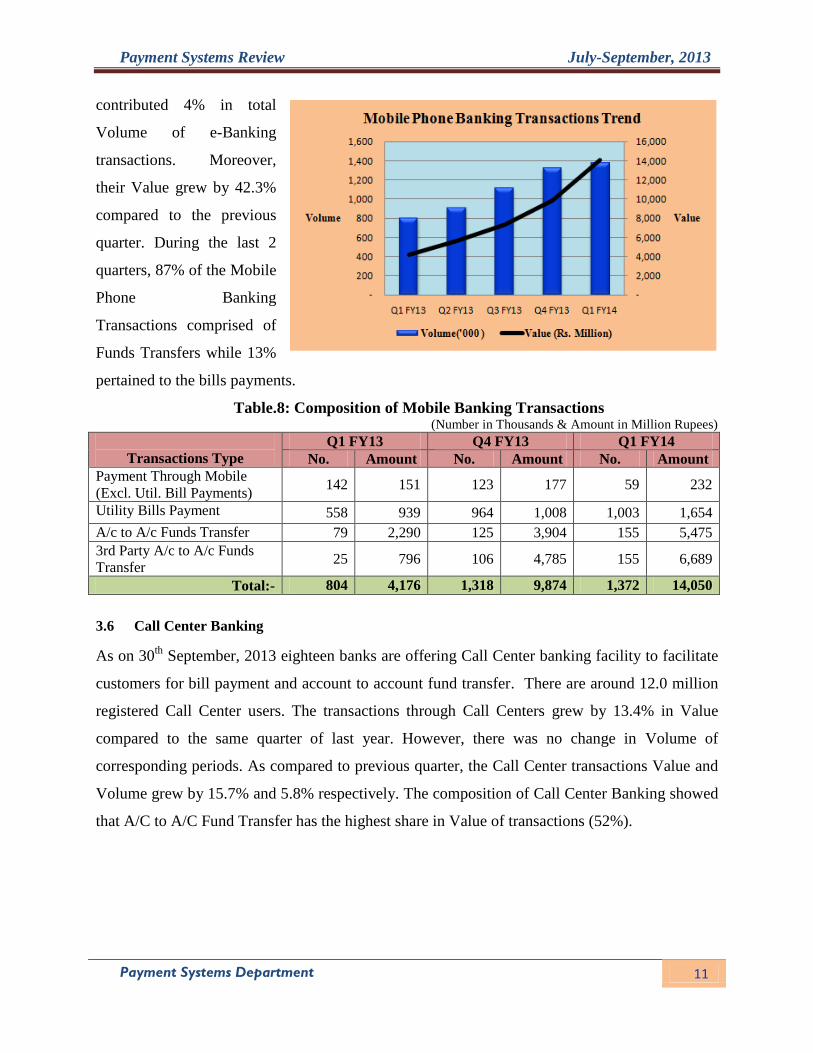
3.5 Mobile Phone Banking
As on 30th
September 2013, eleven banks are using this channel to provide financial services to
1.4 million registered Mobile Phone users who are availing Mobile Phone Banking services.
Mobile Phone Banking transactions have shown an upward trend during the last five quarters.
The Volume of Mobile Banking transactions grew by 4% compared to the previous quarter and
Payment Systems Review July-September, 2013
Payment Systems Department 11
contributed 4% in total
Volume of e-Banking
transactions. Moreover,
their Value grew by 42.3%
compared to the previous
quarter. During the last 2
quarters, 87% of the Mobile
Phone Banking
Transactions comprised of
Funds Transfers while 13%
pertained to the bills payments.
Table.8: Composition of Mobile Banking Transactions (Number in Thousands & Amount in Million Rupees)
Transactions Type
Q1 FY13 Q4 FY13 Q1 FY14
No. Amount No. Amount No. Amount
Payment Through Mobile
(Excl. Util. Bill Payments) 142 151 123 177 59 232
Utility Bills Payment 558 939 964 1,008 1,003 1,654
A/c to A/c Funds Transfer 79 2,290 125 3,904 155 5,475
3rd Party A/c to A/c Funds
Transfer 25 796 106 4,785 155 6,689
Total:- 804 4,176 1,318 9,874 1,372 14,050
3.6 Call Center Banking
As on 30th
September, 2013 eighteen banks are offering Call Center banking facility to facilitate
customers for bill payment and account to account fund transfer. There are around 12.0 million
registered Call Center users. The transactions through Call Centers grew by 13.4% in Value
compared to the same quarter of last year. However, there was no change in Volume of
corresponding periods. As compared to previous quarter, the Call Center transactions Value and
Volume grew by 15.7% and 5.8% respectively. The composition of Call Center Banking showed
that A/C to A/C Fund Transfer has the highest share in Value of transactions (52%).

Payment Systems Review July-September, 2013
Payment Systems Department 12
Table.9 Composition of Call Centers Transactions (Number in Thousands & Amount in Million Rupees)
Transactions Type
Q1 FY13 Q4 FY13 Q1 FY14
No. Amount No. Amount No. Amount
Payment Through Call Center
(Excl. Util. Bill Payments) 49 583 50 531 55 648
Utility Bills Payment 95 515 80 321 84 473
A/c to A/c Funds Transfer 20 925 25 1,108 26 1,167
3rd Party A/c to A/c Funds
Transfer 2 70 2 93 2 86
Total:- 166 2,093 157 2,052 166 2,374
3.7 Plastic Cards Composition
The total number of cards showed 19.3% growth compared to the same period of previous year.
Moreover, it depicted a growth of 4.7 % compared with the previous quarter.
In the composition of plastic cards, debit cards enjoy the highest percentage share of 89%
followed by credit cards with 6.5% and ATMs only cards with 4.2% share.
Table.10: Plastic Cards Composition Trend
Cards
Category Q1FY13 Q2FY13 Q3FY13 Q4FY13 Q1FY14
ATMs Cards 775,710 844,266 890,545 961,603 987,311
Credit Cards 1,274,066 1,271,174 1,721,526 1,087,772 1,508,340
Debit Cards 17,544,853 18,520,817 19,517,514 20,267,433 20,871,586
Total:- 19,594,629 20,636,257 22,129,585 22,316,808 23,367,237

Payment Systems Review July-September, 2013
Payment Systems Department 13
Payment Systems in Pakistan at a Glance
Brief Synopsis as on 30th September, 2013
Sr. No. Description Number
Financial Institutions
1 Number of Commercial Banks 38
2 Number of Microfinance Banks 10
3 Number of Development Financial Institutions 8
Banks' Categorization
4 Number of Public Sector Banks 5
6 Number of Local Private Banks 22
7 Number of Foreign Banks 7
8 Number of Specialized Banks 4
9 Number of PRISM’s Direct Participants 45
Infrastructure
11 Number of Online Branches 10,135
12 Number of Manual Branches 561
13 Number of ATMs 6,974
14 Number of Interoperable Switches 2
15 Number of Banks Managing POS 7
16 Number of Point of Sale(POS) Machines 33,749
17 Number of Branchless Banking(BB) Agents[2] 93,862
Banks' Services
19 Number of Banks Providing Internet Banking 22
20 Number of Banks Providing Mobile Banking 11
21 Number of Banks Providing Call Center Banking 18
22 Number of Banks issuing Credit Cards 12
23 Number of Banks issuing Debit Cards 25
24 Number of Banks issuing Prepaid Cards 7
25 Number of Banks having ATMs 30
Per 100,000 Statistics
27 Number of online Branches per 100,000 Population 5.6
28 Number of ATMs per 100,000 Population 3.8
29 Number of POS per 100,000 Population 18.5