savings and application guide for power factor correction
TRANSCRIPT

Savings and Application Guide for Power Factor Correction and Harmonic Solutions
Application Notes

Tel: +1-508-994-9661 Fax: +1-508-995-3000
[email protected] www.CDE.com
Savings and Application Guide for Power Factor Correction and Harmonic SolutionsCONTENTS
Capacitor Function .................................................................................................. 3
Equipment Causing Poor Power Factor ................................................................. 3
How Power Factor Correction Capacitors Save Money ......................................... 3
Benefits of Power Factor Improvement ................................................................. 4
Facts and Formulas .................................................................................................. 7
Degree of Power Factor Improvement .................................................................. 8
Size of Capacitor Bank ............................................................................................ 8
Determining Your Capacitor Requirements .......................................................... 9
Sizing Capacitors for Electrical Systems ............................................................... 10
Power Bill Savings ................................................................................................. 11
Factors That Affect an Electrical Bill .................................................................... 12
Location of Power Capacitors ............................................................................... 13
Suggested Maximum Capacitor Ratings for U-Frame and T-Frame Motors When Switched with Capacitors ............................................... 14
Switching Capacitors ............................................................................................. 15
Guide for Cable and Switch Selection .................................................................. 16
Understanding Harmonics .................................................................................... 17
Applying Power Factor Correction in a Harmonic Environment ........................ 18

3Tel: +1-508-994-9661 Fax: +1-508-995-3000
[email protected] www.CDE.com
Function of CapacitorsElectric power has two components:
Active power, which produces work.
Reactive power, which is needed to generate magnetic fields required for operation of inductive electrical equipment, but performs no useful work.
Active power is measured in KW (1000 Watts)
Reactive power is measured in KVAR (1000 Volt-Amperes Reactive)
Total power is measured in KVA (1000 Volt-Amperes)
The ratio of working power to total power is called power factor. The function of power factor correction capacitors is to increase the power factor by supplying reactive power when installed at or near inductive electrical equipment.
Equipment Causing Poor Power FactorA great deal of equipment causes poor power factor. One of the worst offenders is lightly loaded induction equipment. Examples of this type of equipment, and their approximate power factors follow:
80% power factor or better: Air conditioners (correctly sized), pumps, centerless grinders, cold headers, upsetters, fans or blowers.
60% to 80% power factor: Induction furnaces, standard stamping machines, and weaving machines.
60% power factor and below: Single-stroke presses, automated machine tools, finish grinders, welders.
Savings can be achieved by utilizing CDE industrial capacitors when the above equipment is used within a facility.
How Power Factor Correction Capacitors Save MoneyPower factor correction capacitors lower electrical costs two ways: In many areas, the electrical rate includes a penalty charge for low power factor. Installation of power capacitors on the electrical distribution system within a facility makes it unnecessary for the utility to supply the reactive power required by inductive electrical equipment. The savings the utility realizes in reduced generation, transmission, and distribution costs are passed on to the customer in the form of lower electrical bills.
The second source of savings derived through the use of power factor correction capacitors is in the form of increased KVA capacity in the electrical distribution system. Installation of capacitors to furnish the non-productive current requirements of the facility makes it possible to increase the connected load by as much as 20% without a corresponding increase in the size of the transformers, conductors, and protective devices making up the distribution system which services the load.
Generator Motor
KVAR
KW
ACTIVE POWER
REACTIVE
POWER
The figure above shows an induction motor operating under partially loaded conditions without power factor correction. Here the feeder line must supply BOTH magnetizing (reactive) and active power.
ACTIVE POWER
MotorGenerator
REACTIVE
POWER
KVAR
KW
CAPACITOR
The figure above shows the result of installing a power factor correction capacitor near the same motor to supply the reactive power required to operate it. The total current requirement has been reduced to the value of the active power only, thus reducing power cost and/or permitting the use of more electrical equipment on the same circuit.

4Tel: +1-508-994-9661 Fax: +1-508-995-3000
[email protected] www.CDE.com
Benefits of Power Factor ImprovementPower factor (PF) is the ratio of useful current to total current. It is also the ratio of useful power expressed in kilowatts (KW) to total power expressed in kilowatt-amperes (KVA). Power factor is usually expressed as a decimal or as a percentage.
Example: KW = 60, KVA = 100
The significant effect of improving the power factor of a circuit is to reduce the current flowing through that circuit which in turn results in the following benefits:
Benefit No. 1Less Total Plant KVA for the Same KW Working Power
Dollar savings are very significant in areas where utility billing is affected by KVA usage.
Example: 600 KW working power vs. KVA required
Power Factor 60% 70% 80% 90% 100%
Active Power 600 KW 600 KW 600 KW 600 KW 600 KW
Reactive Power 800 KVAR 612 KVAR 450 KVAR 291 KVAR 0 KVAR
Total Power 1000 KVA 857 KVA 750 KVA 667 KVA 600 KVA
Power factor correction capacitors allow for more efficient operation of plant transformers and “free up” KVA for additional load. Cost avoidance can be significant.
.60 = 60%= == Useful Power 60 KW
Total Power 100 KVA
KVA 3 x KV x I=
PF

5Tel: +1-508-994-9661 Fax: +1-508-995-3000
[email protected] www.CDE.com
Power Factor 60% 70% 80% 90% 100%
Active Power 360 KW 420 KW 480 KW 540 KW 600 KW
Reactive Power 480 KVAR 428 KVAR 360 KVAR 262 KVAR 0 KVAR
Total Power 600 KVA 600 KVA 600 KVA 600 KVA 600 KVA
Benefit No. 2More KW Working Power for the Same KVA Demand
Released system capacity allows for additional motors, lighting, etc. to be added without overloading existing distribution equipment.
Example: 600 KVA demand vs. available KW
Benefit No. 3Improved Voltage Regulation Due to Reduced Line Voltage Drop
This benefit results in more efficient performance of motors and other electrical equipment.
Example: The graphs below track the full load speed and starting torque of a motor at various levels of rated voltage.
% voltage rise* = KVAR x %ZL
KVA of transformer* with capacitor at the transformer
ZL = transformer impedance % fromnameplate
KW = KVA x PF

6Tel: +1-508-994-9661 Fax: +1-508-995-3000
[email protected] www.CDE.com
Benefit No. 4Reduction in Size of Transformers, Cables and Switchgear in New Installations Reduces Overall Investment
Example: The figures below represent the increasing size of conductors required to carry the same 100 KW at various power factors.
Benefit No. 5Reduced Power Losses in Distribution Systems
Since the losses are proportionate to the square of the current, the formula at right applies.
Example: Power Factor Correction Capacitors improve power factor from 65 percent to 90 percent in the following example.
KW 100 KVAR 48
KW 100 KVAR 133 KW 100KVAR 75
KW 100 KVAR 100 KW 100
KVA - 100 KVA - 111 KVA - 125 KVA - 141 KVA - 167
PF - 100% PF - 90% PF - 80% PF - 70% PF - 60%
I = KV A x 103
3V
% reduction of power losses =
100 - 100 ( )original PFnew PF
2
Reduction of power losses = 100 - 100 ( ) = 48%.65 2
.90

7Tel: +1-508-994-9661 Fax: +1-508-995-3000
[email protected] www.CDE.com
Facts and Formulas
1. PF = cos θ = KW (motor input)KVA
2. KW (motor input) = hp x .746% Eff
3. KVA = 3 x V x I (three phase)
4. KVA = V x I (single phase) 1000
5. KVA = KW = (KW)2 + (KVAR)2
6. I = KVA x 103 (three phase) 3V
7. I = KVA x 103 (single phase) V
8. KVAR = 2pfC (KV)2
103
9. C = KVAR x 103
(2pf)(KV)2
10. XC = 106
(2pf)C
Legend:K = 1000 I = line current (amperes)W = watts IC = capacitor current (amperes)V = voltsA = amperes C = capacitance (microfarads)hp = horsepower ƒ = frequencyPF = power factor XC = capacitive reactance
103
PF
Derating for V & ƒ
KVARE = KVARR ( )2
( )
KVARE = Effective KVAR
KVARR = Rated KVAR
VA = Applied Voltage
VR = Rated Voltage
ƒA = Applied frequency
ƒR = Rated frequency
VA ƒA
VR ƒR
Examples:• Reduced KVAR when operating 60 Hz unit @ 50 Hz
Actual KVAR = Rated KVAR ( ) = 83% rated KVAR
• Reduced KVAR when operating @ below rated voltage
Actual KVAR = rated KVAR ( )2
i.e.: 240 V @ 208 V = .75 rated KVAR
5060
operating voltagerated voltage
8Tel: +1-508-994-9661 Fax: +1-508-995-3000
[email protected] www.CDE.com
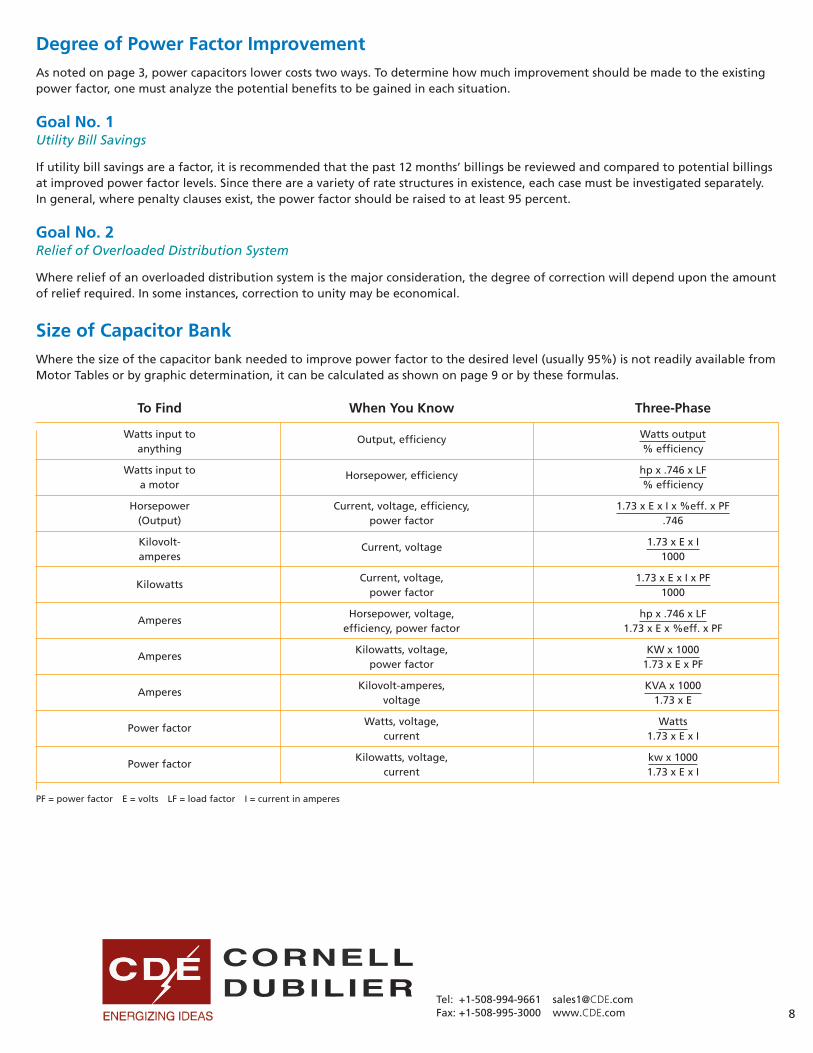
Degree of Power Factor ImprovementAs noted on page 3, power capacitors lower costs two ways. To determine how much improvement should be made to the existing power factor, one must analyze the potential benefits to be gained in each situation.
Goal No. 1Utility Bill Savings
If utility bill savings are a factor, it is recommended that the past 12 months’ billings be reviewed and compared to potential billings at improved power factor levels. Since there are a variety of rate structures in existence, each case must be investigated separately. In general, where penalty clauses exist, the power factor should be raised to at least 95 percent.
Goal No. 2Relief of Overloaded Distribution System
Where relief of an overloaded distribution system is the major consideration, the degree of correction will depend upon the amount of relief required. In some instances, correction to unity may be economical.
Size of Capacitor BankWhere the size of the capacitor bank needed to improve power factor to the desired level (usually 95%) is not readily available from Motor Tables or by graphic determination, it can be calculated as shown on page 9 or by these formulas.
To Find When You Know Three-Phase
Watts input to Output, efficiency Watts outputanything % efficiency
Watts input to Horsepower, efficiency hp x .746 x LF a motor % efficiency
Horsepower Current, voltage, efficiency, 1.73 x E x I x %eff. x PF (Output) power factor .746
Kilovolt- Current, voltage 1.73 x E x Iamperes 1000
KilowattsCurrent, voltage, 1.73 x E x I x PF
power factor 1000
AmperesHorsepower, voltage, hp x .746 x LF
efficiency, power factor 1.73 x E x %eff. x PF
AmperesKilowatts, voltage, KW x 1000
power factor 1.73 x E x PF
AmperesKilovolt-amperes, KVA x 1000
voltage 1.73 x E
Power factorWatts, voltage, Watts
current 1.73 x E x I
Power factorKilowatts, voltage, kw x 1000
current 1.73 x E x I
PF = power factor E = volts LF = load factor I = current in amperes

9Tel: +1-508-994-9661 Fax: +1-508-995-3000
[email protected] www.CDE.com
Determining Your Capacitor RequirementsThe total KVAR rating of capacitors required to improve a facility’s power factor to any desired value may be calculated very easily by using several basic formulas and by applying the appropriate multiplier selected from Table 1 on page 10.
Examples:
1. A plant with a metered demand of 600 KW is operating at a 75% power factor.What capacitor KVAR is required to correct the present power factor to 95%?
a. From Table 1, multiplier to improve PF from 75% to 95% is .553.
b. Capacitor KVAR = KW x Table 1 MultiplierCapacitor KVAR = 600 x .553 = 331.8
2. A plant load of 425 KW has a total power requirement of 670 KVA.What size capacitor is required to improve the present power factor to 90%?
a. Present PF = 425 = .634 = 63.4% 670
b. From Table 1, multiplier to improve PF from 63% to 90% is .748.
c. Capacitor KVAR = KW x Table 1 Multiplier = 425 x .748 = 317.9
3. A plant operating from a 480 volt system has a metered demand of 258 KW. The line current read by a clip-on ammeter is420 amperes.What capacitors KVAR is required to correct the present power factor to 90%?
a. KVAR = 1.73 x KV x I = 1.73 x .480 x 420 = 349 KVA
b. Present PF = 258 = .739 = 73.9% say 74% 349
c. From Table 1, Multiplier to improve PF from 74% to 90% is .425.
d. Capacitor KVAR = KW x Table 1 Multiplier = 258 x .425 = 109.6
CA
PA
CIT
OR
KV
AR
CO
RR
EC
TE
D
KV
AR
BE
FO
RE
or
UN
CO
RR
EC
TE
D K
VA
R
(re
active
po
we
r)
KVA APPARENT P
OWER (b
efore
)
KVA (after)
KW-ACTUAL or REAL POWER
ESSENTIALLY CONSTANT FOR
SAME LOAD
PF (before) PF (after)
POWER
TRIANGLE

10Tel: +1-508-994-9661 Fax: +1-508-995-3000
[email protected] www.CDE.com
Table 1 Sizing Capacitors for Electrical Systems
Table 1 gives multipliers for KW to get the capacitor KVAR needed to increase from original to desired corrected power factor. Use the multipliers to size auto-switched or fixed capacitors for large loads.
80 81 82 83 84 85 86 87 88 89 90 91 92 93 94 95 96 97 98 99 100
50 0.982 1.008 1.034 1.060 1.086 1.112 1.139 1.165 1.192 1.220 1.248 1.276 1.306 1.337 1.369 1.403 1.440 1.481 1.529 1.590 1.732
51 0.937 0.963 0.989 1.015 1.041 1.067 1.093 1.120 1.147 1.174 1.202 1.231 1.261 1.291 1.324 1.358 1.395 1.436 1.484 1.544 1.687
52 0.893 0.919 0.945 0.971 0.997 1.023 1.049 1.076 1.103 1.130 1.158 1.187 1.217 1.247 1.280 1.314 1.351 1.392 1.440 1.500 1.643
53 0.850 0.876 0.902 0.928 0.954 0.980 1.007 1.033 1.060 1.088 1.116 1.144 1.174 1.205 1.237 1.271 1.308 1.349 1.397 1.458 1.600
54 0.809 0.835 0.861 0.887 0.913 0.939 0.965 0.992 1.019 1.046 1.074 1.103 1.133 1.163 1.196 1.230 1.267 1.308 1.356 1.416 1.559
55 0.768 0.794 0.820 0.846 0.873 0.899 0.925 0.952 0.979 1.006 1.034 1.063 1.092 1.123 1.156 1.190 1.227 1.268 1.315 1.376 1.518
56 0.729 0.755 0.781 0.807 0.834 0.860 0.886 0.913 0.940 0.967 0.995 1.024 1.053 1.084 1.116 1.151 1.188 1.229 1.276 1.337 1.479
57 0.691 0.717 0.743 0.769 0.796 0.822 0.848 0.875 0.902 0.929 0.957 0.986 1.015 1.046 1.079 1.113 1.150 1.191 1.238 1.299 1.441
58 0.655 0.681 0.707 0.733 0.759 0.785 0.811 0.838 0.865 0.892 0.920 0.949 0.979 1.009 1.042 1.076 1.113 1.154 1.201 1.262 1.405
59 0.618 0.644 0.670 0.696 0.723 0.749 0.775 0.802 0.829 0.856 0.884 0.913 0.942 0.973 1.006 1.040 1.077 1.118 1.165 1.226 1.368
60 0.583 0.609 0.635 0.661 0.687 0.714 0.740 0.767 0.794 0.821 0.849 0.878 0.907 0.938 0.970 1.005 1.042 1.083 1.130 1.191 1.333
61 0.549 0.575 0.601 0.627 0.653 0.679 0.706 0.732 0.759 0.787 0.815 0.843 0.873 0.904 0.936 0.970 1.007 1.048 1.096 1.157 1.299
62 0.515 0.541 0.567 0.593 0.620 0.646 0.672 0.699 0.726 0.753 0.781 0.810 0.839 0.870 0.903 0.937 0.974 1.015 1.062 1.123 1.265
63 0.483 0.509 0.535 0.561 0.587 0.613 0.639 0.666 0.693 0.720 0.748 0.777 0.807 0.837 0.870 0.904 0.941 0.982 1.030 1.090 1.233
64 0.451 0.477 0.503 0.529 0.555 0.581 0.607 0.634 0.661 0.688 0.716 0.745 0.775 0.805 0.838 0.872 0.909 0.950 0.998 1.058 1.201
65 0.419 0.445 0.471 0.497 0.523 0.549 0.576 0.602 0.629 0.657 0.685 0.714 0.743 0.774 0.806 0.840 0.877 0.919 0.966 1.027 1.169
66 0.388 0.414 0.440 0.466 0.492 0.519 0.545 0.572 0.599 0.626 0.654 0.683 0.712 0.743 0.775 0.810 0.847 0.888 0.935 0.996 1.138
67 0.358 0.384 0.410 0.436 0.462 0.488 0.515 0.541 0.568 0.596 0.624 0.652 0.682 0.713 0.745 0.779 0.816 0.857 0.905 0.966 1.108
68 0.328 0.354 0.380 0.406 0.432 0.459 0.485 0.512 0.539 0.566 0.594 0.623 0.652 0.683 0.715 0.750 0.787 0.828 0.875 0.936 1.078
69 0.299 0.325 0.351 0.377 0.403 0.429 0.456 0.482 0.509 0.537 0.565 0.593 0.623 0.654 0.686 0.720 0.757 0.798 0.846 0.907 1.049
70 0.270 0.296 0.322 0.348 0.374 0.400 0.427 0.453 0.480 0.508 0.536 0.565 0.594 0.625 0.657 0.692 0.729 0.770 0.817 0.878 1.020
71 0.242 0.268 0.294 0.320 0.346 0.372 0.398 0.425 0.452 0.480 0.508 0.536 0.566 0.597 0.629 0.663 0.700 0.741 0.789 0.849 0.992
72 0.214 0.240 0.266 0.292 0.318 0.344 0.370 0.397 0.424 0.452 0.480 0.508 0.538 0.569 0.601 0.635 0.672 0.713 0.761 0.821 0.964
73 0.186 0.212 0.238 0.264 0.290 0.316 0.343 0.370 0.396 0.424 0.452 0.481 0.510 0.541 0.573 0.608 0.645 0.686 0.733 0.794 0.936
74 0.159 0.185 0.211 0.237 0.263 0.289 0.316 0.342 0.369 0.397 0.425 0.453 0.483 0.514 0.546 0.580 0.617 0.658 0.706 0.766 0.909
75 0.132 0.158 0.184 0.210 0.236 0.262 0.289 0.315 0.342 0.370 0.398 0.426 0.456 0.487 0.519 0.553 0.590 0.631 0.679 0.739 0.882
76 0.105 0.131 0.157 0.183 0.209 0.235 0.262 0.288 0.315 0.343 0.371 0.400 0.429 0.460 0.492 0.526 0.563 0.605 0.652 0.713 0.855
77 0.079 0.105 0.131 0.157 0.183 0.209 0.235 0.262 0.289 0.316 0.344 0.373 0.403 0.433 0.466 0.500 0.537 0.578 0.626 0.686 0.829
78 0.052 0.078 0.104 0.130 0.156 0.183 0.209 0.236 0.263 0.290 0.318 0.347 0.376 0.407 0.439 0.474 0.511 0.552 0.599 0.660 0.802
79 0.026 0.052 0.078 0.104 0.130 0.156 0.183 0.209 0.236 0.264 0.292 0.320 0.350 0.381 0.413 0.447 0.484 0.525 0.573 0.634 0.776
80 0.000 0.026 0.052 0.078 0.104 0.130 0.157 0.183 0.210 0.238 0.266 0.294 0.324 0.355 0.387 0.421 0.458 0.499 0.547 0.608 0.750
81 0.000 0.026 0.052 0.078 0.104 0.131 0.157 0.184 0.212 0.240 0.268 0.298 0.329 0.361 0.395 0.432 0.473 0.521 0.581 0.724
82 0.000 0.026 0.052 0.078 0.105 0.131 0.158 0.186 0.214 0.242 0.272 0.303 0.335 0.369 0.406 0.447 0.495 0.556 0.698
83 0.000 0.026 0.052 0.079 0.105 0.132 0.160 0.188 0.216 0.246 0.277 0.309 0.343 0.380 0.421 0.469 0.530 0.672
84 0.000 0.026 0.053 0.079 0.106 0.134 0.162 0.190 0.220 0.251 0.283 0.317 0.354 0.395 0.443 0,503 0.646
85 0.000 0.026 0.053 0.080 0.107 0.135 0.164 0.194 0.225 0.257 0.291 0.328 0.369 0.417 0.477 0.620
86 0.000 0.027 0.054 0.081 0.109 0.138 0.167 0.198 0.230 0.265 0.302 0.343 0.390 0.451 0.593
87 0.000 0.027 0.054 0.082 0.111 0.141 0.172 0.204 0.238 0.275 0.316 0.364 0.424 0.567
88 0.000 0.027 0.055 0.084 0.114 0.145 0.177 0.211 0.248 0.289 0.337 0.397 0.540
89 0.000 0.028 0.057 0.086 0.117 0.149 0.184 0.221 0.262 0.309 0.370 0.512
90 0.000 0.029 0.058 0.089 0.121 0.156 0.193 0.234 0.281 0.342 0.484
91 0.000 0.030 0.060 0.093 0.127 0.164 0.205 0.253 0.313 0.456
92 0.000 0.031 0.063 0.097 0.134 0.175 0.223 0.284 0.426
93 0.000 0.032 0.067 0.104 0.145 0.192 0.253 0.395
94 0.000 0.034 0.071 0.112 0.160 0.220 0.363
95 0.000 0.037 0.078 0.126 0.186 0.329
96 0.000 0.041 0.089 0.149 0.292
97 0.000 0.048 0.108 0.251
98 0.000 0.061 0.203
99 0.000 0.142
100 0.000
Example: Total KW input of load from wattmeter reading 100 KW at a power factor of 60%. The leading reactive KVAR necessary to raise the power factor to 90% is found by multiplying the 100 KW by the factor found in the table, which is .849. Then 100 KW x 0.849 = 84.9 KVAR. Use 85 KVAR.
Desired Corrected Power Factor (%)
Ori
gin
al P
ow
er F
acto
r (%
)

11Tel: +1-508-994-9661 Fax: +1-508-995-3000
[email protected] www.CDE.com
Power Bill SavingsPoor power factor necessitates increased generation and transmission costs to provide the required amount of real power (KW). In order to equitably distribute these costs to the user, many utilities utilize a rate structure that penalizes poor power factor. These charges will be in the demand charge section of the utility bill, but this charge differs from utility to utility. The power bill savings can be computed by the utility company upon request.
Listed below is a savings estimate from a utility company in the northeast USA.
Demand Charge Section of Bill with Uncorrected Power Factor
Power Factor 80% KW 764.2
Charges Cost/KVA KVA* Total
Transmission $6.69 $955.3 $6,390.62
Distribution $0.88 $955.3 $840.62
Transition $3.00 $955.3 $2,865.75
Total Demand Charge $10,096.99
Demand Charge Section of Bill with Corrected Power Factor
Power Factor 98% KW 764.2
Charges Cost/KVA KVA* Total
Transmission $6.69 $779.8 $5,216.83
Distribution $0.88 $779.8 2,339.39
Transistion $3.00 $779.8 $2,339.39
Total Demand Charge $8,242.44
Total Savings for Month $1,854.55
KW = The peak power usage for the month
Payback Analysis
600 KVAR Automatic Correction System
Cost of System $16,400.00
Average Monthly Savings $1,854.55
Months for Full Payback 9
600 KVAR system is based on the possibility that some months may have more KVAR correction needed.
KVA = KW
Power Factor*

12Tel: +1-508-994-9661 Fax: +1-508-995-3000
[email protected] www.CDE.com
Factors That Affect an Electric Bill
1. Energy ChargeNumber of kilowatt-hours used during the billing period. Number of kilovolt-amperes (KVA) used during the billing period.
2. Demand ChargeThis charge compensates the utility for the capital investmentrequired to serve the facility’s peak load. Demand chargesmay be a large portion of the total electric bill, sometimes ashigh as 75%. Demand charges can be reduced by reducingenergy peaks, reducing KVA, and improving power factor.
3. Power Factor Penalty ChargeA penalty imposed to encourage the user to improvepower factor. Power companies usually impose a billingpenalty when power factor (PF) drops below 90%,although this figure could be as high as 95%. In nearly allcases, the least expensive and most efficient method toreduce this charge is by adding capacitors.
KVA
PEAK DEMAND
DEMAND CURVE
TIME-BILLING PERIOD
1
2
1- Uncorrected KVA
2- Corrected KVA
13Tel: +1-508-994-9661 Fax: +1-508-995-3000
[email protected] www.CDE.com
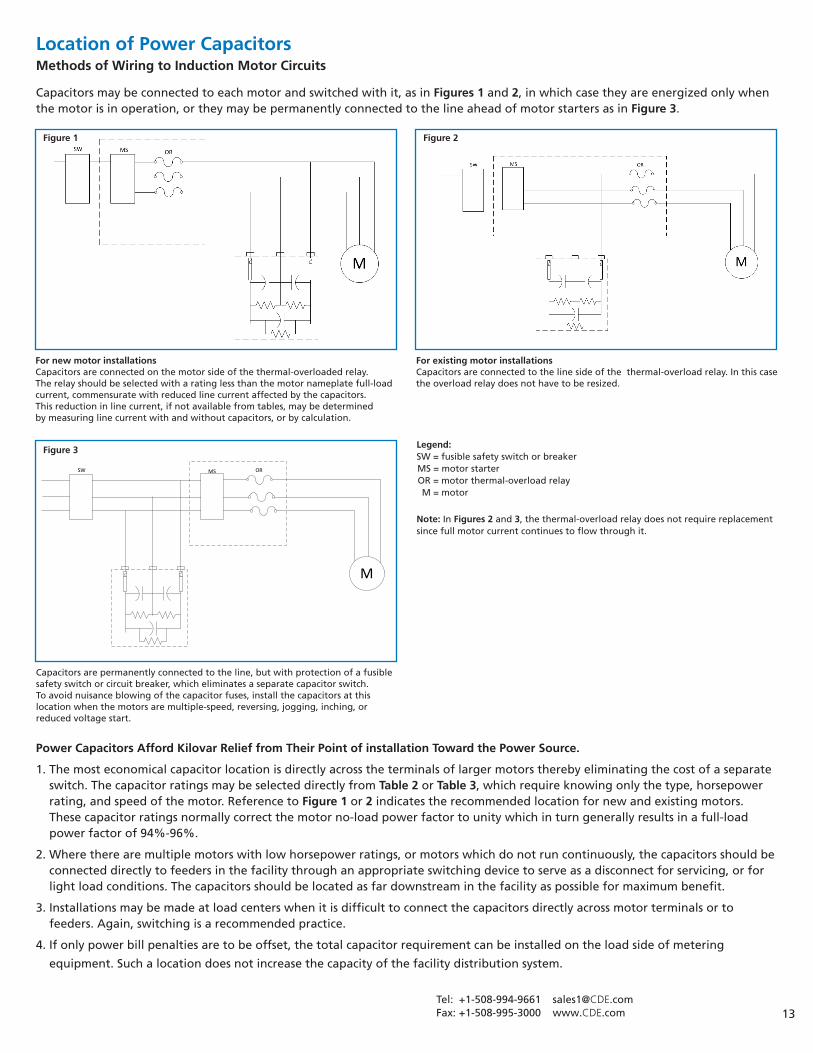
Location of Power CapacitorsMethods of Wiring to Induction Motor Circuits
Capacitors may be connected to each motor and switched with it, as in Figures 1 and 2, in which case they are energized only when the motor is in operation, or they may be permanently connected to the line ahead of motor starters as in Figure 3.
Power Capacitors Afford Kilovar Relief from Their Point of installation Toward the Power Source.
1. The most economical capacitor location is directly across the terminals of larger motors thereby eliminating the cost of a separateswitch. The capacitor ratings may be selected directly from Table 2 or Table 3, which require knowing only the type, horsepowerrating, and speed of the motor. Reference to Figure 1 or 2 indicates the recommended location for new and existing motors.These capacitor ratings normally correct the motor no-load power factor to unity which in turn generally results in a full-loadpower factor of 94%-96%.
2. Where there are multiple motors with low horsepower ratings, or motors which do not run continuously, the capacitors should beconnected directly to feeders in the facility through an appropriate switching device to serve as a disconnect for servicing, or forlight load conditions. The capacitors should be located as far downstream in the facility as possible for maximum benefit.
3. Installations may be made at load centers when it is difficult to connect the capacitors directly across motor terminals or tofeeders. Again, switching is a recommended practice.
4. If only power bill penalties are to be offset, the total capacitor requirement can be installed on the load side of metering
equipment. Such a location does not increase the capacity of the facility distribution system.
Legend: SW = fusible safety switch or breaker MS = motor starter OR = motor thermal-overload relay M = motor
Note: In Figures 2 and 3, the thermal-overload relay does not require replacement since full motor current continues to flow through it.
For new motor installations Capacitors are connected on the motor side of the thermal-overloaded relay. The relay should be selected with a rating less than the motor nameplate full-load current, commensurate with reduced line current affected by the capacitors. This reduction in line current, if not available from tables, may be determined by measuring line current with and without capacitors, or by calculation.
For existing motor installations Capacitors are connected to the line side of the thermal-overload relay. In this case the overload relay does not have to be resized.
Capacitors are permanently connected to the line, but with protection of a fusible safety switch or circuit breaker, which eliminates a separate capacitor switch. To avoid nuisance blowing of the capacitor fuses, install the capacitors at this location when the motors are multiple-speed, reversing, jogging, inching, or reduced voltage start.
Figure 1
Figure 3
Figure 2

14Tel: +1-508-994-9661 Fax: +1-508-995-3000
[email protected] www.CDE.com
Table 2Suggested Maximum Capacitor Ratings for U-Frame NEMA CIs B. Motors NEMA Motor Design A or B, Normal Starting Torque, Normal Running Current
H. P. 3600 RPM 1800 RPM 1200 RPM 900 RPM 720 RPM 600 RPM
Rating KVAR %AR KVAR %AR KVAR %AR KVAR %AR KVAR %AR KVAR %AR
3 1.5 14 1.5 15 1.5 20 2 27 2.5 35 3.5 41
5 2 12 2 13 2 17 3 25 4 32 4.5 37
7.5 2.5 11 2.5 12 3 15 4 22 5.5 30 6 34
10 3 10 3 11 3.5 14 5 21 6.5 27 7.5 31
15 4 9 4 10 5 13 6.5 18 8 23 9.5 27
20 5 9 5 10 5 11 7.5 18 10 20 10 25
25 5 6 5 8 7.5 11 7.5 13 10 20 10 21
30 5 5 5 8 7.5 11 10 15 15 22 15 25
40 7.5 8 10 8 10 10 15 16 15 18 15 20
50 10 7 10 8 10 9 15 12 20 15 25 22
60 10 6 10 8 15 10 15 11 20 15 25 20
75 15 7 15 8 15 9 20 11 30 15 40 20
100 20 8 20 8 25 9 30 11 40 14 45 18
125 20 6 25 7 30 9 30 10 45 14 50 17
150 30 6 30 7 35 9 40 10 50 17 60 17
200 40 6 40 7 45 8· 55 11 60 12 75 17
250 45 5 45 6 60 9 70 10 75 12 100 17
300 50 5 50 6 75 9 75 9 80 12 105 17
Table 3 Suggested Maximum Capacitor Ratings for T-Frame NEMA Class B. MotorsApplies to three-phase, 60 HZ motors when switched with capacitors as a single unit.
InductionMotorRating
(HP)
Nominal Motor Speed
3600 R/MIN 1800 R/MIN 1200 R/MIN 900 R/MIN 720 R/MIN 600 R/MIN
CapacitorRating(KVAR)
LineCurrent
Reduction(%)
CapacitorRating(KVAR)
LineCurrent
Reduction(%)
CapacitorRating(KVAR)
LineCurrent
Reduction(%)
CapacitorRating(KVAR)
LineCurrent
Reduction(%)
CapacitorRating(KVAR)
LineCurrent
Reduction(%)
CapacitorRating(KVAR)
LineCurrent
Reduction(%)
3 1.5 14 1.5 23 2.5 28 3 38 3 40 4 405 2 14 2.5 22 3 26 4 31 4 40 5 40
7.5 2.5 14 3 20 4 21 5 28 5 38 6 4510 4 14 4 18 5 21 6 27 7.5 36 8 3815 5 12 5 18 6 20 7.5 24 8 32 10 3420 6 12 6 17 7.5 19 9 23 10 29 12 3025 7.5 12 7.5 17 8 19 10 23 12 25 18 3030 8 11 8 16 10 19 14 22 15 24 22.5 3040 12 12 13 15 16 19 18 21 22.5 24 25 3050 15 12 18 15 20 19 22.5 21 24 24 30 3060 18 12 21 14 22.5 17 26 20 30 22 35 2875 20 12 23 14 25 15 28 17 33 14 40 19
100 22.5 11 30 14 30 12 35 16 40 15 45 17125 25 10 36 12 35 12 42 14 45 15 50 17150 30 10 42 12 40 12 52.5 14 52.5 14 60 17200 35 10 50 11 50 10 65 13 68 13 90 17250 40 11 60 10 62.5 10 82 13 87.5 13 100 17300 45 11 68 10 75 12 100 14 100 13 120 17350 50 12 75 8 90 12 120 13 120 13 135 15400 75 10 80 8 100 12 130 13 140 13 150 15450 80 8 90 8 120 10 140 12 160 14 160 15500 100 8 120 9 150 12 160 12 180 13 180 15

15Tel: +1-508-994-9661 Fax: +1-508-995-3000
[email protected] www.CDE.com
Points to Consider when Sizing Capacitors Two limiting factors must be considered when capacitors are to be switched with a motor as a unit. The first is overvoltage due to self-excitation, and the second is transient torques.
Self-excitation voltage: When a motor is disconnected from the line, it will normally rotate for a short time before coming to rest. A capacitor connected to this motor will still be supplying magnetizing current, which will excite the motor. Under these conditions, the motor and capacitor act like a generator and produce a certain voltage because of this “self-excitation.” The magnitude of the voltage that can be produced is determined by two things — the rating of the capacitor being used and the speed of the motor involved. It is not uncommon for this “self-excitation” voltage to reach 150% of rated voltage if too large a capacitor is being used.
Transient torques: Perhaps even more important than overvoltage is the transient torques that can occur if the motor happens to close back into the line before coming to a complete rest. If the motor is still rotating and acting as a generator, the resulting transient torque may be as much as 20 times the full load torque.
Because of transient torque and overload considerations, most motor manufacturers provide recommendations concerning the maximum capacitor KVAR that should be switched with a given motor. These recommendations are conservative enough to avoid endangering the motor, and will ordinarily result in a corrected power factor of approximately 95-98% at full load.
To avoid nuisance blowing of fuses when capacitors are connected directly across the motor terminals:
1. Motors should not be subject to plugging or reversing duty.
2. Motors should not be operated such that rapid restartingoccurs.
Switching CapacitorsThe National Electrical Code requires that power capacitors, other than those directly connected across motor terminals, have separate disconnecting means to permit their removal from the circuit as a regular operating procedure, or for maintenance purposes. The Code also requires that the continuous current carrying capacity of the disconnecting device and of the capacitor circuit conductors shall be not less than 135% of the rated current of the capacitor.
Since power capacitors for industrial service are designed for use in an ambient temperature of 46°C (115°F) maximum, the cables and disconnecting devices should also be selected for this ambient operation.
The data in Table 4 on page 14 is predicated on these conditions.
Percent AR is the percent reduction in full-load line current due to capacitors. A capacitor located on the motor side of the overload relay reduces current through the relay. Therefore, a smaller relay may be necessary. The motor-overload relay should be selected on the basis of the motor full-load nameplate current reduced by the percent reduction in line current (percent AR) due to capacitors.
The capacitor size specified in Table 3 will increase the full load power factor to 95% and larger sizes should not be used without consulting CDE.
To calculate required KVAR for energy efficient motors (or any motor) use the following formula:
KVAR =
PF0 Original Power Factor (supplied by manufacturer)
PF1 Target Power Factor
H.P. Motor Horsepower from nameplate
% efficiency Motor manufacturer nameplate

16Tel: +1-508-994-9661 Fax: +1-508-995-3000
[email protected] www.CDE.com
Table 4 Suggested Wire Sizes for Capacitor InstallationsThe cable sizes indicated in Table 4 are based on 135% of rated current in accordance with NEC 460.
240 Volt, 3 Phase 480 Volt, 3 Phase 600 Volt, 3 Phase
Cap.RatingKVAR
75°CMin. CableSizes
*
90°CMin. CableSizes
*
Safety SwitchCap.
RatingKVAR
75°CMin. CableSizes
*
90°CMin. CableSizes
*
Safety Switch Cap.
RatingKVAR
75°C Min. CableSizes
*
90°C Min. CableSizes
*
Safety Switch
RatingAMPS
FuseAMPS
RatingAMPS
FusesAMPS
RatingAMPS
FuseAMPS
0.5 14 14 30 3 0.5 14 14 30 1 0.5 14 14 30 11 14 14 30 5 1 14 14 30 3 1 14 14 30 32 14 14 30 10 1.5 14 14 30 3 1.5 14 14 30 3
2.5 14 14 30 10 2 14 14 30 6 2 14 14 30 33 14 14 30 15 2.5 14 14 30 6 2.5 14 14 30 54 12 12 30 20 3 14 14 30 6 3 14 14 30 55 12 12 30 20 4 14 14 30 10 4 14 14 30 66 10 10 30 25 5 14 14 30 10 5 14 14 30 10
7.5 10 10 30 30 6 14 14 30 15 6 14 14 30 108 8 8 60 35 7.5 14 14 30 15 7.5 14 14 30 15
10 8 8 60 40 8 12 12 30 20 8 14 14 30 1512.5 8 8 60 50 10 12 12 30 20 10 12 12 30 2015 6 6 60 60 12.5 10 10 30 25 12.5 12 12 30 20
17.5 4 6 100 75 15 10 10 30 30 15 10 10 30 2520 4 4 100 80 17.5 8 8 60 35 17.5 10 10 30 30
22.5 3 4 100 90 20 8 8 60 40 20 8 8 60 3525 3 3 100 100 22.5 8 8 60 50 22.5 8 8 60 40
27.5 1 2 200 125 25 8 8 60 50 25 8 8 60 4030 1 2 200 125 27.5 6 6 60 60 27.5 8 8 60 4535 1/0 1 200 150 30 6 6 60 60 30 8 8 60 5040 2/0 2/0 200 175 35 4 6 100 70 35 6 6 60 6045 3/0 3/0 200 200 40 4 4 100 80 40 4 6 100 7050 3/0 3/0 200 200 45 3 4 100 90 45 4 4 100 8060 250 4/0 400 250 50 3 3 100 100 50 4 4 100 8075 350 300 400 300 60 3 3 200 110 60 3 3 100 100
100 2x3/0 3x3/0 400 400 75 1/0 1 200 150 75 1 2 200 125125 2x250 2x4/0 600 500 100 3/0 2/0 200 200 100 1/0 1 200 150150 2x350 2x300 600 600 125 250 4/0 400 250 125 3/0 3/0 200 200175 2x500 2x350 800 700 150 350 300 400 300 150 250 4/0 400 250200 2x600 2x500 800 800 175 500 350 400 350 175 350 300 400 300225 3x350 3x300 1,200 900 200 2x3/0 2x3/0 400 400 200 500 350 400 350250 3x350 3x350 1,200 1,000 225 2x3/0 2x3/0 400 400 225 2x3/0 2x3/0 400 400275 4x300 3x400 1,200 1,100 250 2x250 2x4/0 600 500 250 2x3/0 2x3/0 400 400300 4x350 3x500 1,200 1,250 275 2x250 2x4/0 600 500 275 2x4/0 2x3/0 600 450
300 2x350 2x300 600 600 300 2x250 2x4/0 600 500325 2x500 2x350 800 700 325 2x250 2x4/1 600 500350 2x500 2x350 800 700 350 2x350 2x300 600 600375 2x600 2x500 800 800 375 2x350 2x300 600 600400 2x600 2x500 800 800 400 2x500 2x350 800 700425 3x350 2x300 1,200 900 425 2x500 2x350 800 700450 3x350 2x300 1,200 900 450 2x500 2x400 800 750475 3x350 2x300 1,200 900 475 2x500 2x400 800 750500 3x400 3x350 1,200 1,000 500 2x600 2x500 1,200 800525 3x400 3x350 1,200 1,000 525 2x600 2x500 1,200 800550 4x300 3x400 1,200 1,100 550 3x350 2x600 1,200 900575 4x350 3x500 1,200 1,200 575 3x350 2x600 1,200 900600 4x350 3x500 1,200 1,200 600 3x400 3x350 1,200 1,000
* Not more than three single conductors are allowed in a raceway with 30°C ambient. For higher ambient temperatures, consult the National Electrical Code Table 310-16 (correction factor for ambients over 30°C). Rated current is based on operation at rated voltage, frequency, and KVAR.
17Tel: +1-508-994-9661 Fax: +1-508-995-3000
[email protected] www.CDE.com
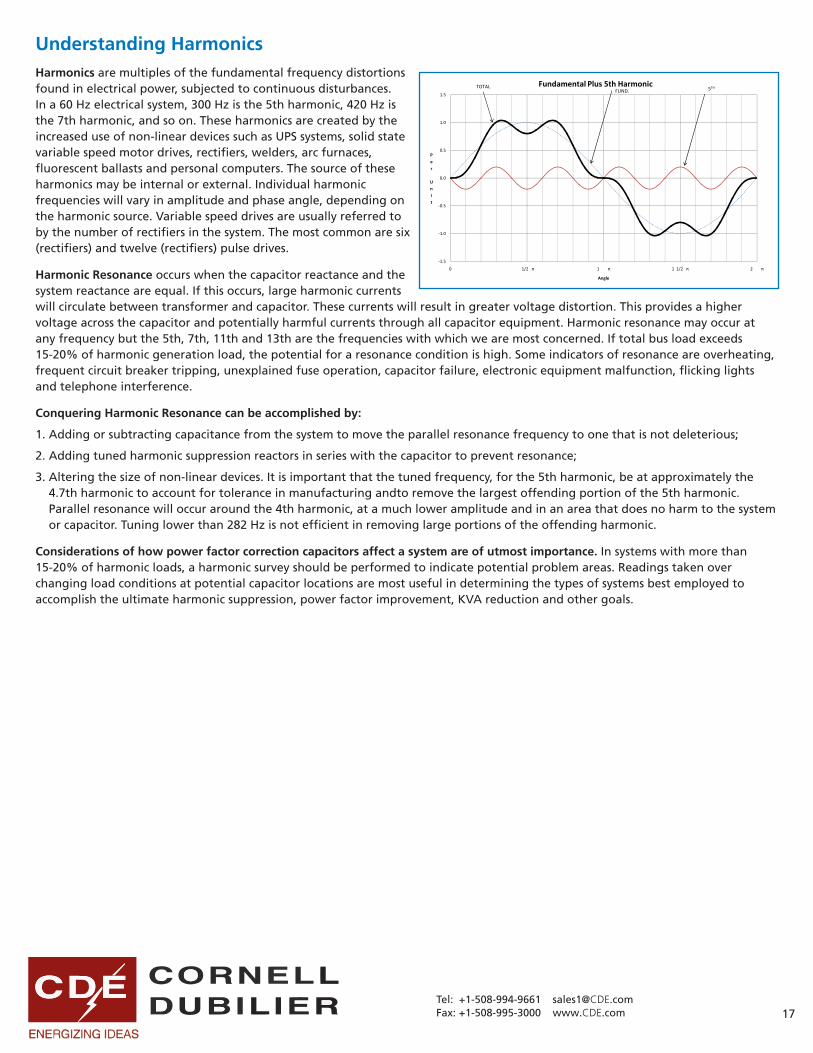
Understanding HarmonicsHarmonics are multiples of the fundamental frequency distortions found in electrical power, subjected to continuous disturbances. In a 60 Hz electrical system, 300 Hz is the 5th harmonic, 420 Hz is the 7th harmonic, and so on. These harmonics are created by the increased use of non-linear devices such as UPS systems, solid state variable speed motor drives, rectifiers, welders, arc furnaces, fluorescent ballasts and personal computers. The source of these harmonics may be internal or external. Individual harmonic frequencies will vary in amplitude and phase angle, depending on the harmonic source. Variable speed drives are usually referred to by the number of rectifiers in the system. The most common are six (rectifiers) and twelve (rectifiers) pulse drives.
Harmonic Resonance occurs when the capacitor reactance and the system reactance are equal. If this occurs, large harmonic currents will circulate between transformer and capacitor. These currents will result in greater voltage distortion. This provides a higher voltage across the capacitor and potentially harmful currents through all capacitor equipment. Harmonic resonance may occur at any frequency but the 5th, 7th, 11th and 13th are the frequencies with which we are most concerned. If total bus load exceeds 15-20% of harmonic generation load, the potential for a resonance condition is high. Some indicators of resonance are overheating,frequent circuit breaker tripping, unexplained fuse operation, capacitor failure, electronic equipment malfunction, flicking lightsand telephone interference.
Conquering Harmonic Resonance can be accomplished by:
1. Adding or subtracting capacitance from the system to move the parallel resonance frequency to one that is not deleterious;
2. Adding tuned harmonic suppression reactors in series with the capacitor to prevent resonance;
3. Altering the size of non-linear devices. It is important that the tuned frequency, for the 5th harmonic, be at approximately the4.7th harmonic to account for tolerance in manufacturing andto remove the largest offending portion of the 5th harmonic.Parallel resonance will occur around the 4th harmonic, at a much lower amplitude and in an area that does no harm to the systemor capacitor. Tuning lower than 282 Hz is not efficient in removing large portions of the offending harmonic.
Considerations of how power factor correction capacitors affect a system are of utmost importance. In systems with more than 15-20% of harmonic loads, a harmonic survey should be performed to indicate potential problem areas. Readings taken overchanging load conditions at potential capacitor locations are most useful in determining the types of systems best employed toaccomplish the ultimate harmonic suppression, power factor improvement, KVA reduction and other goals.

18Tel: +1-508-994-9661 Fax: +1-508-995-3000
[email protected] www.CDE.com
Applying Power Factor Correction in a Harmonic EnvironmentThe use of capacitors has long been accepted as the most practical solution to low power factor problems in power systems.
Modern capacitors are a reliable, maintenance free, inexpensive source of VAR’s needed in inductive circuits to synchronize the voltage and current waveforms.
In the past, the application of capacitors was straightforward; all that was required was a knowledge of KW (or KVA), existing power factor, and target power factor. In recent years, however, this practice has been complicated by the proliferation of non-linear loads.
The Source of the Problem
One of the most widely used solid state motor controls is the six-pulse drive. These devices represent a non-linear impedance to the power source, drawing a quasi-square wave alternating current rich in harmonics.
For six-pulse drives, the characteristic harmonics are: 5, 7, 11, 13, 17, 19, ...; the higher order harmonics are not usually troublesome because their magnitude is progressively smaller. Figure 4 shows the total distortion when one or more harmonics are added to the fundamental.
Harmonic Resonance
When a capacitor bank is added to a power system, it is effectively connected in parallel with the system’s impedance, which is primarily inductive. As far as the harmonic source is concerned, it sees a capacitor in parallel with an inductor. Figure 5 shows the model circuit for this system on a per phase basis. Resistor ‘R’ represents the inevitable system losses. The harmonic source is represented as a constant current source, since it behaves as such.
Since the capacitive (XC) and inductive (XL) reactances are frequency dependent (as frequency increases, XC decreases and XL
increases), there is a frequency at which these two parameters will be equal; this frequency is called the system’s natural resonant frequency.
At this frequency, the system’s impedance appears to the harmonic source to be very large, therefore, a harmonic current at the resonant frequency flowing through this impedance will result in a very large harmonic voltage as derived by Ohm’s Law (Vh = IhZh).
A large harmonic voltage will in turn result in a much larger harmonic current exchange between the capacitor bank and the system impedance. This secondary harmonic current may be many orders of magnitude larger than the generated harmonic current, resulting in nuisance operation of circuit breakers or fuses that happen to be in the path of this current.
The degree of magnification is determined by the system resistance.
Since the generated harmonic current is considered to be constant for a given frequency, then the harmonic voltage will be proportional to the impedance. Consequently, the frequency response of the impedance is a good indication of the system’s susceptibility to harmonic resonance.
Figure 4
Figure 5

19Tel: +1-508-994-9661 Fax: +1-508-995-3000
[email protected] www.CDE.com
Figure 6 is the impedance plot, as seen by the harmonic source in Figure 5, for a typical system consisting of 500 KVAR connected to a 1500 KVA, 480 volt transformer. (While impedance magnitudes are dependent on system resistance, resonant frequency is primarily a function of inductance (L) and capacitance (C).)
The quick and simple way to calculate the system’s harmonic resonance is through the following relationship derived from the system’s reactances:
h =
where: h = harmonic order
KVASC = = available short circuit at point of capacitor bank installation
KVAR = capacitor bank size
This calculation, even though it does not take into account upstream system impedance, is reasonably accurate for most applications since the bulk of the impedance is contributed by the transformer itself.
Detuning the Circuit
The most effective solution to this problem consists of series tuning the capacitor bank to the lowest offending harmonic, usually the 5th. This is done by introducing an inductor in series with the capacitor as shown in Figure 7.
The impedance versus frequency plot, as seen by the harmonic source, is shown in Figure 8; the original impedance response (untuned) is shown for comparison.
The minimum impedance occurs at the series resonant point, the 4.7th harmonic, while the peak represents a parallel resonance due to the capacitor and the two inductors. Harmonic currents generated at or near the series resonant frequency (such as the 5th) will flow to the trap harmlessly, provided the capacitor and reactor are sized properly to withstand the additional stresses. These currents are simply following the path of least impedance. The system will not resonate above this frequency since it is inductive.
This approach will accomplish two objectives. On the line side of the capacitor filter bank, system power factor is corrected and harmonic voltage distortion is reduced, Harmonic voltage (V
h) is the result of a harmonic current (Ih) flowing through the system impedance (Zh), i.e. Ohm’s Law (Vh = Ih Zh). By reducing the system impedance (Zh) we can reduce the harmonic voltage (Vh) even though the harmonic current (Ih) remains the same.
When the main objective is to reduce harmonic distortion, the engineer will consider the use of more filter stages, each tuned to the next higher harmonic (7th, 11th,... ). In some cases, where harmonic currents are excessive, the use of capacitors rated at the next higher voltage may be required. In most cases, CDE capacitors are run at rated voltage and will maintain their twenty year life expectancy.
Conclusion There are many factors to consider when applying system power factor correction. Properly sized and applied power factor correction capacitors in industrial applications will increase system power factor with the benefit of a reduction in utility costs associated with poor power factor, reduce the effects of potentially damaging harmonics, reduce system losses and release capacity. In conclusion, use of power factor correction capacitors is an economical solution to providing improved power quality to AC electric power systems.
KVA
KVASC
Zpu
KVAR
Figure 6
Figure 8
Figure 7