saving time and money with resistance welding simulation
TRANSCRIPT
JULY 20082
Significant time and money can besaved with the use of software thatsimulates the process of resistance
welding. This article provides specific ex-amples of how this has been done with thefinite element modeling software calledSorpas®. This software has been used toassist in the design of resistance weldingparts and joints. It determines welding pa-rameters, how the welding parameters canbe optimized for various conditions in pro-duction, and forecasts the microstructureof the parts after welding.
This software is currently in use bymajor automotive and manufacturingcompanies such as GM, Ford, Honda,Volkswagen, Chrysler, Mercedes Benz,Volvo, Peugeot, Citroën, Bosch, Siemens,and ARO. These and other companiesuse the software to reduce the time andmoney in resistance welding, from the de-sign stage to production floor.
Market Challenges
Clearly, there is an imperative to re-duce costs and the “time to market” in anage of increasing globalization and com-petition. At the same time, many newsteels that are both stronger and lighterare increasingly being employed to raisefuel economy and to provide greater crashprotection. These driving forces forchange and improvement bring problemsof increased design and welding complex-ity when these steels are used.
Resistance Welding
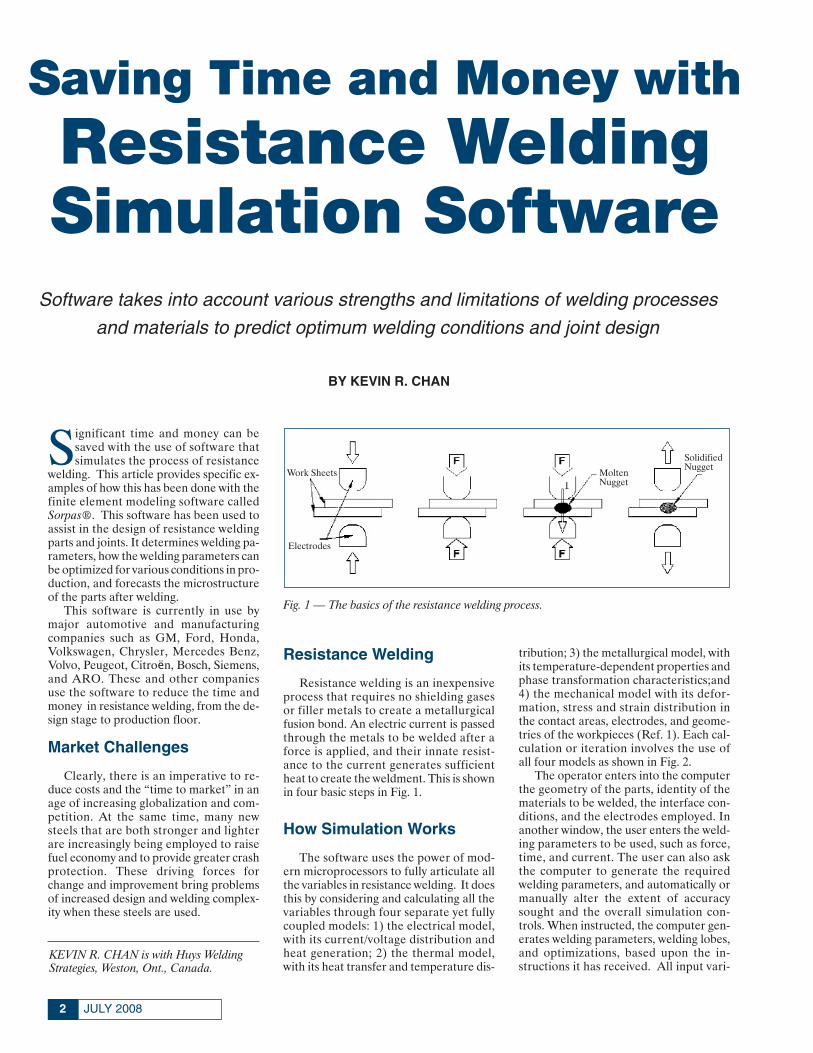
Resistance welding is an inexpensiveprocess that requires no shielding gasesor filler metals to create a metallurgicalfusion bond. An electric current is passedthrough the metals to be welded after aforce is applied, and their innate resist-ance to the current generates sufficientheat to create the weldment. This is shownin four basic steps in Fig. 1.
How Simulation Works
The software uses the power of mod-ern microprocessors to fully articulate allthe variables in resistance welding. It doesthis by considering and calculating all thevariables through four separate yet fullycoupled models: 1) the electrical model,with its current/voltage distribution andheat generation; 2) the thermal model,with its heat transfer and temperature dis-
tribution; 3) the metallurgical model, withits temperature-dependent properties andphase transformation characteristics;and4) the mechanical model with its defor-mation, stress and strain distribution inthe contact areas, electrodes, and geome-tries of the workpieces (Ref. 1). Each cal-culation or iteration involves the use ofall four models as shown in Fig. 2.
The operator enters into the computerthe geometry of the parts, identity of thematerials to be welded, the interface con-ditions, and the electrodes employed. Inanother window, the user enters the weld-ing parameters to be used, such as force,time, and current. The user can also askthe computer to generate the requiredwelding parameters, and automatically ormanually alter the extent of accuracysought and the overall simulation con-trols. When instructed, the computer gen-erates welding parameters, welding lobes,and optimizations, based upon the in-structions it has received. All input vari-
BY KEVIN R. CHAN
KEVIN R. CHAN is with Huys WeldingStrategies, Weston, Ont., Canada.
Work Sheets
Electrodes
MoltenNugget
SolidifiedNugget
Saving Time and Money withResistance WeldingSimulation Software
Software takes into account various strengths and limitations of welding processes
and materials to predict optimum welding conditions and joint design
Fig. 1 — The basics of the resistance welding process.
3WELDING JOURNAL
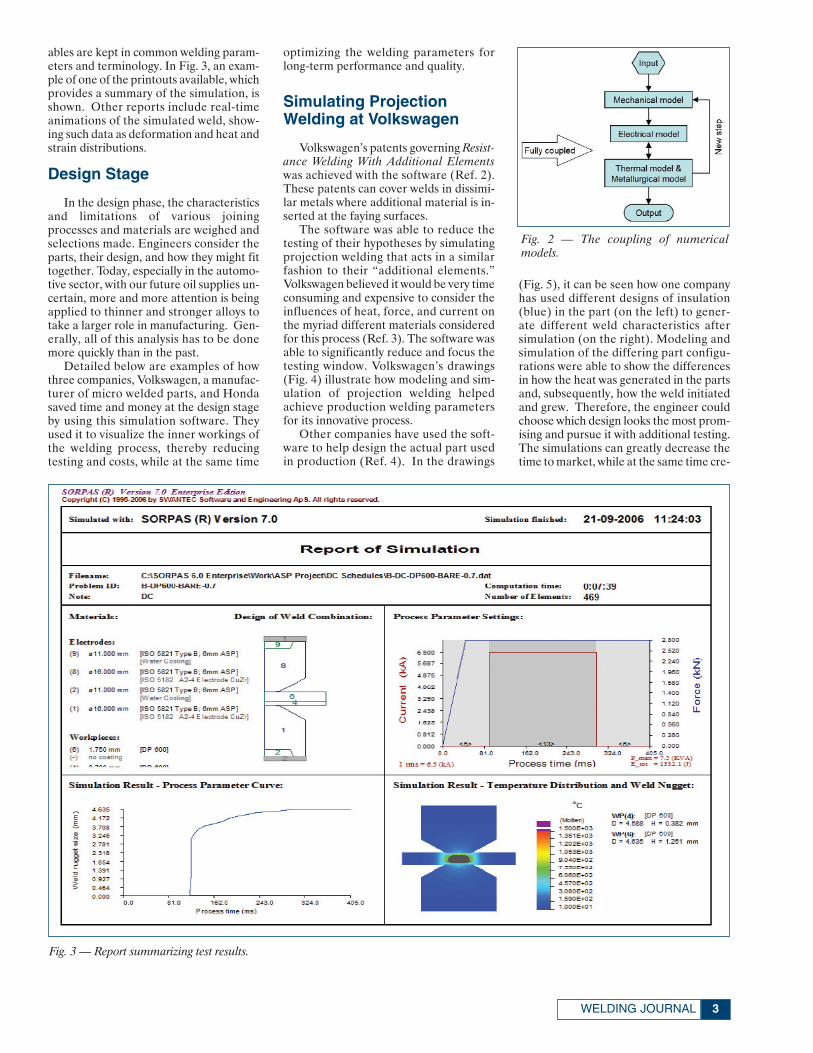
ables are kept in common welding param-eters and terminology. In Fig. 3, an exam-ple of one of the printouts available, whichprovides a summary of the simulation, isshown. Other reports include real-timeanimations of the simulated weld, show-ing such data as deformation and heat andstrain distributions.
Design Stage
In the design phase, the characteristicsand limitations of various joiningprocesses and materials are weighed andselections made. Engineers consider theparts, their design, and how they might fittogether. Today, especially in the automo-tive sector, with our future oil supplies un-certain, more and more attention is beingapplied to thinner and stronger alloys totake a larger role in manufacturing. Gen-erally, all of this analysis has to be donemore quickly than in the past.
Detailed below are examples of howthree companies, Volkswagen, a manufac-turer of micro welded parts, and Hondasaved time and money at the design stageby using this simulation software. Theyused it to visualize the inner workings ofthe welding process, thereby reducingtesting and costs, while at the same time
optimizing the welding parameters forlong-term performance and quality.
Simulating ProjectionWelding at Volkswagen
Volkswagen’s patents governing Resist-ance Welding With Additional Elementswas achieved with the software (Ref. 2).These patents can cover welds in dissimi-lar metals where additional material is in-serted at the faying surfaces.
The software was able to reduce thetesting of their hypotheses by simulatingprojection welding that acts in a similarfashion to their “additional elements.”Volkswagen believed it would be very timeconsuming and expensive to consider theinfluences of heat, force, and current onthe myriad different materials consideredfor this process (Ref. 3). The software wasable to significantly reduce and focus thetesting window. Volkswagen’s drawings(Fig. 4) illustrate how modeling and sim-ulation of projection welding helpedachieve production welding parametersfor its innovative process.
Other companies have used the soft-ware to help design the actual part usedin production (Ref. 4). In the drawings
(Fig. 5), it can be seen how one companyhas used different designs of insulation(blue) in the part (on the left) to gener-ate different weld characteristics aftersimulation (on the right). Modeling andsimulation of the differing part configu-rations were able to show the differencesin how the heat was generated in the partsand, subsequently, how the weld initiatedand grew. Therefore, the engineer couldchoose which design looks the most prom-ising and pursue it with additional testing.The simulations can greatly decrease thetime to market, while at the same time cre-
Fig. 2 — The coupling of numerical models.
Fig. 3 — Report summarizing test results.

JULY 20084
ating a paper trail where choices made areappropriately documented, with their ac-companying result noted.
Reducing TestRequirements at Honda
Honda used the software to reduce thenumber of tests needed to find an inex-pensive way to join the hem of an exteriorcar door and its inner panel without mark-ing the outer surface. The software wasused to aid in the optimization of weldingparameters and projection design for anindirect hem projection weld (Ref. 5).
In this case, physically prototyping themany different configurations and testingthe actual parts was not economicallysound. Without simulation, the choicesavailable for welding parameters of a hemprojection indirect weld are daunting andperhaps unmanageable with the newercoated steel alloys. However, the softwarewas able to reconfigure the electrodes andtools to accommodate any resistance heat-ing process. Figures 6 and 7 show Honda’sdesign. The software accurately estimatedthe effect of different welding parametersand projection nipple heights that wouldproduce an indent-free outer surface. Thiswas possible by running a series of simu-lations with certain variables altered.
Anticipating New Materials
The performance characteristics ofsome new TRIP and DP steels alter whenthey are welded. When these new complexphase steels are made, their strength andcharacter arise from the unique mi-crostructure resulting from controlledcooling and heating. The fusion nuggetand heat-affected zone present a temper-
Fig. 4 — Illustrations of Volkswagen’s patents for Resistance Welding with Additional Elements.
Fig. 5 — Example of using different insulation designs (left) to generate different weldingcharacteristics.
Fig. 6 — Geometric mesh generated by the software forfinite element modeling.
Fig. 7 — A finished simulation illustrating a specific combination of welding pa-rameters and projection designs.

5WELDING JOURNAL
ature range from melting to slight warm-ing around the weld area. This tempera-ture history destroys the carefully createdmicrostructure that gave rise to the steel’scharacter in the first place and can alsolead to other problems such as hardeningand cracking. The cooling rate of an ad-vanced steel is often critical to its perform-ance and microstructure. Another issuemay be that there is a DP steel welded toan high-strength low-alloy (HSLA) steel,creating a weldment with an unknownmixture of two alloys in the weld.
Thus the cooling rate of a weld in anadvanced high-strength steel may ad-versely affect the performance of thatsteel in a crash. With these types of issuesin mind, the University of Waterloo isworking with Sorpas® to predict the mi-crostructure, and hence the performance,of a weld in simulation (Ref. 6).
Figure 8 is an amalgamation of a met-allographic photograph of a weld per-formed in the university on the left whichhas then been compared to the earliersimulation on the right to confirm its reli-ability. Dotted lines indicate the overallaccuracy of the simulation. Certain nodalpoints in the simulation are indicated onthe drawing, and the simulation indicatestheir peak temperature (far right).
These peak temperatures are then gen-erated as graphs (Fig. 9), which indicatethe coarse zone of the HAZ, the fusionzone, and the intercritical HAZ. Thenthey are referenced to published constantcooling diagrams (CCT), a copy of onewhich is reproduced in Fig. 10. Coloreddots on the CCT in Fig. 10 tie into the col-ors on Figs. 8 and 9, indicating the vari-ous regions of the weld, based upon peaktemperature. It is noteworthy that the sim-ulated peak temperatures of the weld tieinto the CCT diagram and the metallo-graphic photographic record of the weld.
Production Stage
Described above is how this softwarecan help reduce time and money spent in
the design and prototyping stages of newproducts and new materials. The great-est use, however, has proved to be in theday-to-day use of the software as an aidto increasing stable and consistent pro-duction and the optimization of weldingparameters.
As an example, take the parts in Figs.8–10. Let us suppose that we want tochange the peak temperature of the weld-ment and thus control its cooling rate.The software can predict changes in theresultant microstructure with changes inthe length of heat or numbers of pulsedheat inputs. Figure 11 shows results fromsimulation for the temperature history inthe coarse-grained HAZ and the result-ant changes to peak temperature andcooling rate based upon increments inweld time of a second weld pulse. Thus itbecomes easy to adjust and document
changes and improvements in a produc-tion setting (Ref. 7).
The production environment is prima-rily concerned with optimizing welding pa-rameters and to maximize and stabilizeproduction. Optimization is an ongoingprocess, as parts will have variances intheir fit and setup; and the materials them-selves will vary both in their surface prepa-ration, cleanliness, and appearance as wellas in the materials from which they aremade (Ref. 8). Therefore, it is every engi-neer’s desire that he or she can find thebest spot in the weldability lobe to gainthat overall consistency.
Automotive Parts SupplierOptimizes Welding Variables
As an example, a North American Tier
Fig. 8 — A metallographic photograph and a simulation showingpeak temperatures in different regions of the weld and HAZ.
Fig. 9 — Graphs indicating time and temperature during the weld-ing of specific sites, or nodes, of the weldment (see Fig. 8).
Fig. 10 — A published constant cooling diagram indicating the peak temperatures fromFigs. 8 and 9.

JULY 20086
1 automotive supplier that is currentlywelding a new line with DP600 steel foundthat its initial welding lobes were very nar-row and that the welding heat was toohigh, which caused not only shorter elec-trode life but also transformer duty cycleissues. In addition, the company had lim-ited time and resources to deal with prob-lems of poor quality welds, inspection, andrepair (Ref. 9).
The software has a function to auto-
matically generate weld current optimiza-tions based upon a requested size of weldnugget. Complete weldability lobes arecalculated in accordance with ISO14327:2004. The weldability lobe gener-ated by the software has solid colors indi-cating risk of expulsion while also indicat-ing the nugget size. It also indicates nuggetwidth at the convergence of the weld timeand weld current. Purple indicates elec-trode melting, red shows expulsion at the
interface between sheets, green for welds,and gray for no welds — Fig. 12.
The generation of these weldabilitylobes was then used as an initial guide toset individual welding machines. It wasfound that the simulations were, on aver-age, 90% accurate. The company alsoadopted titanium-carbide metal matrixcomposite coated electrodes, which werefound to have a wider welding lobe thanuncoated Class 2 electrodes. The com-pany believes that it has saved $100,000with the simulation software. The savingscame from the following:
1) reduced costs with fewer tests, 2) reduced scrap and wasted time,3) reduced costs for production main-
tenance problems,4) reduced time to respond to OEM
requirements,5) reduced time for production run-
ning, settings determination, and opti-mization,
6) improved weld quality and produc-tion stability, and
7) fewer problems and misunderstand-ings and more accurate and documentedprocedures.
Conclusions
This simulation software for resistancewelding, in the hands of a qualified engi-neer, can significantly reduce the time andexpenses of developing new designs andmaterials, establish better process param-eter settings, and improve troubleshoot-ing and weld quality.
References
1. Zhang, W. 2004. Design and implemen-tation of software for resistance weldingprocess simulations, SAE.
2. Patent number DE 102 51 414 A1; pub-lished 05.19.2004.
3. Simulation of innovative resistance weld-ing processes. 2002. Volkswagen AG, K-EFWW, 17.10.
4. Huys technical bulletin #14 and simula-tion of resistance projection and spot welding.2006. SWANTEC Software and EngineeringApS.
5. Edwards, P., and Chan, K. 2006. Lower-ing costs by simulating design of complex welds,SMWC.
6. Khan, I., et al. 2006. Predicting mi-crostructure using Sorpas cooling rates, Uni-versity of Waterloo.
7. Khan, I., Kuntz, M., and Zhou, N. 2006.Monitoring the effect of pulsing using Sorpas,University of Waterloo.
8. Zhang, W. 2006. New developments andchallenges in simulation and optimization ofresistance welding. Proceedings of the 4th Inter-national Seminar on Advances in ResistanceWelding.
9. Scotchmer, N. 2005. Widening the weld-ing lobe in the RSW process of advanced highstrength steels, BAM.
Fig. 11 — Variations in the length of a postweld tempering pulse of a weld are graphed forpeak temperature and cooling rate.
Fig. 12 — Weldability lobe diagram.