saving for college with 529 plans and other options: an updatetax treatmentof 529 plans would...
TRANSCRIPT

issu
e no
.70
Janu
ary
2002
tiaa
-cre
fins
titu
te.o
rg
dialogue
in this issue
Introduction . . . . . . . . . . . . . . . . . . . . . . . . . . . . . . . . . . . . . . . . . . . . . . . . . . . . . . . . . . . . . . . . . . . .p 2
529 Plans: What’s New? . . . . . . . . . . . . . . . . . . . . . . . . . . . . . . . . . . . . . . . . . . . . . . . . . . . . . .p 2
Tax Law Changes Related to the Coverdell ESA . . . . . . . . . . . . . . . . . . . . . . . . .p 4
Saving and Financial Aid . . . . . . . . . . . . . . . . . . . . . . . . . . . . . . . . . . . . . . . . . . . . . . . . . . . . .p 4
Simulated Accumulations Using Different Approaches . . . . . . . . . . . . .p 8
Concluding Remarks . . . . . . . . . . . . . . . . . . . . . . . . . . . . . . . . . . . . . . . . . . . . . . . . . . . . . . . . . .p 16
Jennifer MaDouglas ForeTIAA-CREF institute
The Economic Growth and Tax Reconciliation Act of 2001, signed intolaw in June 2001, made substantial changes to the rules governing529 plans and the Education IRA (renamed Coverdell EducationSavings Account). In this article, we provide an updated comparisonof 529 plans with other options. In addition to taking into accountthe new tax law changes, we discuss in detail the impact of savingon financial aid eligibility. We also use a “Monte Carlo” approach tosimulate asset accumulations in a 529 plan, balanced mutual funds,Coverdell Education Savings Accounts, and Series-I savings bonds.Results show that 529 plans have definite advantages over otherinvestment strategies with similar risk characteristics.
Saving for College with 529 Plans and Other
Options: An Update
r e s e a r c h
70Iti

> > > I N T R O D U C T I O N
College tuition inflation in the past thirty years has aver-aged approximately 2 to 3 percentage points higher thangeneral price inflation and is showing no sign of slowingdown. For the 2001-2002 academic year, the averagetuition and fees at four-year public colleges and universi-ties is $3,754, a 7.7 percent increase from a year ago. Forthe same year, the average tuition and fees at four-yearprivate colleges and universities is $17,123, a 5.5 percentincrease from a year ago.1
Paying for college is one of the most significant finan-cial burdens families bear. For parents who anticipatepaying a substantial portion of college expenses withsavings, it is important that they start college planningas early as possible and choose the right savings optionbased on their own situations. In a previous issue ofResearch Dialogue (Ma and Fore, Issue no. 67, March2001), we discussed the features of 529 plans andcompared these plans with several other college-savingoptions. In that issue, we also presented numericalcalculations comparing asset accumulations in a 529 plan with those in balanced mutual funds andSeries-I bonds.
The calculations and information provided in that arti-cle were based on the laws and regulations that werein effect as of March 2001. The Economic Growth andTax Relief Reconciliation Act of 2001 (the “2001 TaxAct”), signed into law in June 2001, made substantialchanges to the rules governing 529 plans and therecently renamed Coverdell Education Savings Account(ESA). Among its provisions, the new tax law providesthat earnings included in qualified withdrawals from a529 plan are exempt from federal income tax, startingin 2002. The new tax law also raises the annual contri-bution limit for the Coverdell ESA from $500 to $2,000per beneficiary.
In this article, we update our analysis of saving with529 plans and several other options to reflect the taxlaw changes. We also discuss in detail the impact ofsaving on financial aid eligibility. In addition, we use aMonte Carlo approach to simulate asset accumulationsfor each saving option. Rather than assuming fixedrates of return into the future, the Monte Carloapproach allows for random asset returns in simulat-ing possible future outcomes.
The remainder of the paper is structured as follows. InSection 1, we describe the tax law changes related to 529plans. In Section 2, we discuss the tax law changesrelated to the Coverdell ESA. In Section 3, we discuss theimpact of saving on financial aid. In Section 4, wedescribe the Monte Carlo approach for the numericalsimulations and present updated comparisons of 529plans with mutual funds, Coverdell ESAs and Series-Ibonds. We provide some concluding remarks in Section 5.We include detailed assumptions for our simulations inthe Appendices.
> > > 5 2 9 P L A N S : W H A T ’ S N E W ?
Named after the section of the Internal Revenue Code that created them, 529 plans are qualified tuition programs designed to help families save forcollege expenses. Two basic types of 529 plans areavailable: savings and prepaid. Prepaid plans allowfamilies to prepay future tuition at today’s prices.Savings plans are investment programs that offer avariable rate of return.
Although the first prepaid tuition plan (MichiganEducation Trust) was introduced in 1988, it was not until1996 that Section 529 was added to the Internal RevenueCode (IRC) to clarify the federal tax treatment of state-sponsored tuition plans. Contributions to 529 plans arenot deductible for federal income tax purposes, but earn-ings grow tax-free until withdrawal. Many states provideadditional state income tax benefits in the form of statetax deduction for contributions or state tax exemptionon earnings, or both.
The 2001 Tax Act made 529 plans more appealing, as theearnings of qualified withdrawals from state-sponsoredplans are made exempt from federal income tax, startingJanuary 1, 2002. States that currently do not exempt earn-ings from state income taxes may follow suit and exemptearnings from state taxes. To illustrate the significance ofthis tax law change, consider a case where parents savingon behalf of a newborn child contribute $200 a month toa 529 plan over the next 18 years. Assuming an 8 percentannual rate of return, they would have $96,657 availableto pay for college under the new tax law. Under the oldtax law, they would have $88,639 after paying 15 percentfederal income tax on earnings.
<2> r e s e a r c h d i a l o g u e

i s s u e n o . 7 0 j a n u a r y 2 0 0 2 <3>
Note that all provisions of the 2001 Tax Act are sched-uled to expire on December 31, 2010. Were this to occur(and given no other changes in the interim), the federaltax treatment of 529 plans would revert to its statusprior to January 1, 2002. However, given that the relevantprovisions of the 2001 Tax Act are explicitly designed tofacilitate long-term saving for college, it is possible thatthe enhanced federal tax status of 529 plans willcontinue after 2010. In our simulations, therefore, weassume that the relevant provisions of the 2001 Tax Actwill be extended beyond 2010. Individuals should never-theless be aware that there is an explicit risk that federaltax policy toward 529 plans may change after 2010—andthat there is always a risk that federal tax policies willchange in the future.
Even before the tax law changes, 529 plans were veryflexible. Anyone, regardless of income, can contributeto a 529 plan. Withdrawals may be used to pay fortuition, fees, room and board, books, supplies, andequipment at almost any postsecondary institution.Although most prepaid plans are open to state resi-dents only, most savings plans allow anyone from anystate to open an account. Most 529 savings plans allowthe beneficiary to be anyone, even oneself. 529 plansoffer generous saving limits. Most prepaid plans allowpurchasers to purchase up to four years’ worth offuture tuition credits at certain in-state schools. Forsavings plans, a lifetime limit on contributions perbeneficiary is imposed based on account balances (thesum of contributions and earnings less fees andexpenses) and in some cases gross contributions.Lifetime contribution limits vary widely across states.Currently, the lowest limit on gross contributions is$100,000 and the highest is $251,000. The lowestlimit on account balances is $122,484 and the highestis $265,620.2
Before the tax law changes, if an account owner decidedto transfer assets from one 529 plan to another, theycould do so only by changing the beneficiary. The 2001Tax Act permits the rollover of an account from one 529plan to another once every twelve months withoutchanging the beneficiary. The 2001 Tax Act also ties thelimits on qualified room and board expenses for 529plans more closely to actual costs and allows the trans-fer of account between cousins, which is particularlyimportant since it allows grandparents to transfer funds
among their grandchildren.
The earnings portion of non-qualified withdrawals from529 plans is subject to income tax at the distributee’srate and an additional 10 percent tax.3 However, theaccount owner may make a penalty-free, tax-free rolloverby designating another “member of the family” as thenew beneficiary.
As of June 2001, there were approximately 1.9 millionaccounts with a total asset value of $10.8 billion acrossall 529 plans (including both savings and prepaid types),an increase of 40 percent compared to August 2000. Asof December 2001, forty states had 529 savings plans inoperation. The rest of the states had 529 savings plansunder development. Twenty-two states had 529 prepaidplans either in operation or under development.4
Summary tables describing the features of existingsavings and prepaid plans can be found in the datasection of www.tiaa-crefinstitute.org.
I n v e s t m e n t C h o i c e s f o r 5 2 9 P l a n s
One potential drawback for 529 plans is that the federallaw requires that investors may not make direct invest-ment decisions. Before 2002, investors were only allowedto choose from an array of investment options availablefrom the plan when establishing an account. Investorswere also allowed to change the percentage of newcontributions going into each investment option.However, investors were not allowed to move existingassets between investment options.
Most 529 savings plans offer an age-based option, whichinvests heavily in stocks when the beneficiary is youngand shifts away from stocks and towards fixed-incomeand money market securities as the beneficiary getscloser to college age. Some states offer multiple age-based portfolios representing different levels of risk.Many states have also introduced other investmentoptions including all equity, all fixed-income, and guar-anteed options.
The expansion of investment options has certainlyprovided more choices for investors. In fact, investors cannow obtain almost any asset allocation they desire byusing a combination of investment options and allocat-ing new contributions accordingly. Starting in 2002,investors are allowed to change the investment strategyfor existing assets in a 529 account once per calendar

<4> r e s e a r c h d i a l o g u e
year and upon a change in the designated beneficiary ofthe account.
When choosing investment option(s), households needto consider many factors, including the age of the bene-ficiary, their own risk tolerance, and their overall financialsituation. Households may find some options moresuited to their savings needs than others. Higher equityallocations may appeal to those investors who are will-ing to take more investment risk and volatility for poten-tially higher returns, while a guaranteed option mayappeal to those investors who are more concerned aboutpreserving principal.
> > > T A X L A W C H A N G E S R E L A T E D T O
T H E C O V E R D E L L E S A
The 2001 Tax Act also made substantial changes to theCoverdell ESA, formerly known as the Education IRA. TheCoverdell ESA was introduced as part of the TaxpayerRelief Act of 1997. Although contributions to CoverdellESAs were not tax-deductible, earnings were exemptfrom income tax if withdrawals were used to pay quali-fied higher education expenses.
Despite its tax benefits, the Coverdell ESA has not been apopular option for saving for college mainly because of itslow $500 annual contribution limit. The 2001 Tax Act raisesthe annual contribution limit per beneficiary to $2,000,starting in 2002. This increase in contribution limit hasmade the Coverdell ESA a viable option for many families.
However, there is an income restriction for the CoverdellESA. For 2001, the income phase-out range was between$95,000 and $110,000 for single taxpayers and between$150,000 and $160,000 for married couples filing a jointtax return. In 2002, more families are eligible for theCoverdell ESA, as the 2001 Tax Act raises the incomephase-out range for married couples to between$190,000 and $220,000.
Starting in 2002, qualified expenses for the Coverdell ESAinclude elementary and secondary school expenses atpublic, private, or religious schools.5 This is a boon forfamilies who plan to send their children to privateelementary and/or secondary schools.
The earnings portion of non-qualified withdrawals fromthe Coverdell ESA is subject to income tax at the distrib-
utee’s rate in addition to a 10 percent penalty.6 Before2002, an excise tax was imposed if individualscontributed to both a 529 plan and a Coverdell ESA onbehalf of the same beneficiary in the same year. The newlaw provides that the excise tax no longer applies.However, the same education expenses are not allowedto support tax-free distributions from both a 529 planand a Coverdell ESA.
Table 1 provides a comparison chart that summarizes themain features of several ways to save for college, reflect-ing the recent tax law changes.
> > > S A V I N G A N D F I N A N C I A L A I D
Funds in a 529 plan may affect the amount of financialaid a student is eligible for, especially federal financialaid. The interaction of saving in general and financialaid eligibility is a very complex issue. Put simply, astudent’s financial need is determined by the differ-ence between the cost of attendance at a school andthe student’s Expected Family Contribution (EFC). Astudent’s EFC can be considered as the amount ofcollege expenses the student and his/her family areexpected to contribute towards his/her college costs.The cost of attendance is the estimated sum of tuitionand fees, room and board, books and supplies, trans-portation, and miscellaneous expenses. For any givenlevel of cost of attendance, the larger the EFC, thesmaller the student’s need—and thus the loweramount of aid for which the student is eligible.
In calculating a dependent student’s EFC, up to 5.64percent of parents’ assets, 35 percent of the student’sassets, and 50 percent of the student’s income areconsidered available to pay for college expenses.Therefore, assets held in the student’s name will reducethe student’s financial need much more than assets heldin a parent’s name will.
Depending on the source of financial aid, either the FederalMethodology (FM) or the Institutional Methodology (IM)may be used to determine a student’s EFC. Established bythe U.S. Congress and administered by the U.S. Departmentof Education, the FM is used to determine a student’s EFCfor federal financial aid purposes. The IM is used by manycolleges and universities to calculate a student’s EFC fornon-federal financial aid purposes.

i s s u e n o . 7 0 j a n u a r y 2 0 0 2 <5>
T a b l e 1 : A C o m p a r i s o n o f S e v e r a l W a y s t o S a v e f o r C o l l e g e
Note: The information provided in this table reflects the 2001 tax law changes.
(1) (2) (3) (4)
Section 529 Plans Mutual Funds Coverdell Education Series-I Savings Bonds
Savings Account
Tax Benefits
Is the Value of theAccount Excludedfrom the Owner’sTaxable Estate?
How Much Can beInvested?
Qualified HigherEducation Expenses
Financial AidTreatment
Who MakesInvestment decision?
Income Restriction
Impact on Hope orLifetime Tax Credits
Flexibility
Earnings federal andstate income tax deferredand federal income taxfree, if withdrawals areused for qualified highereducation expenses.
Yes.
Varies by state. Somestates alow lifetimeaccount balances as highas $265,620.
Tuition, fees, books,supplies, room and board,and equipment.
Savings plans: parents’assets; prepaid plans mayreduce aid dollar-for-dollar.
State sponsor with inputfrom program manager.
No.
Education expenses usedto support tax-free distri-butions from a 529 planmay not be used to claima Hope or LifetimeLearning credit.
Earnings on non-quali-fied withdrawals taxed atdistributee’s rate plus anadditional 10% tax.
No special tax bene-fits. Earnings aretaxed in the year real-ized.
No.
No limit.
Any expense.
Parents’ assets.
Owner.
No.
No.
Money can be with-drawn anytime forany purpose.
Earnings income tax free, ifused for qualified elemen-tary, secondary and highereducation expenses.
Yes.
Up to $2,000 per year.
Same as (1). Elementary andsecondary educationexpenses also qualify.
Student’s assets.
Owner.
Yes.
Education expenses used tosupport tax-free distribu-tions from a Coverdell ESAmay not be used to claim aHope or Lifetime Learningcredit.
Earnings on non-qualifiedwithdrawals taxed atdistributee’s rate plus anadditional 10% tax.
Earnings state and localincome tax free, federalincome tax deferred. Forqualified taxpayers, earningsfully or partially excludablefrom federal income tax, ifused for qualified highereducation expenses.
No.
Up to $30,000 per year.
Tuition and fees only.
Parents’ assets if educationexpenses are for a child.Student’s assets if educationexpenses are for oneself.
Guaranteed returns.
No restriction on purchases.However, there is incomerestriction for excludingearnings from federalincome tax.
Education expenses used tosupport tax-free redemptionon I bonds may not be usedto claim a Hope or LifetimeLearning credit.
Can be redeemed after 6months. A 3-month earningspenalty applies to redemp-tion within 5 years ofissuance.

Since federal financial aid makes up the majority of totalstudent financial aid, we discuss in detail the FM for thecalculation of EFC and present a table that illustrates theestimated EFC at various levels of family income andassets for dependent students. The major differencebetween the FM and IM is that the IM takes into consid-eration home equity while the FM does not.
T h e F e d e r a l M e t h o d o l o g y f o r t h e
C a l c u l a t i o n o f E x p e c t e d F a m i l y
C o n t r i b u t i o n
Most federal financial aid programs require thatstudents fill out a Free Application for Federal StudentAid (FAFSA). The FAFSA collects information on astudent’s and parents’ income and assets, family size, etc.After the FAFSA is submitted, the Central ProcessingSystem at the Department of Education applies the FMformula to determine a student’s EFC and confirmssome of the eligibility requirements through computermatches with other agencies.
Based on a student’s dependency status, one of threeEFC formulas is applied to calculate the student’s EFC.These three formulas are for dependent students, inde-pendent students without dependents other than aspouse, and independent students with dependentsother than a spouse, respectively. We focus on theformula used for dependent students.
A dependent student’s EFC comes from the student’scontribution from income and assets and parents’ contri-bution from income and assets, calculated in steps asfollows (illustrated in Figure 1).
Parents’ contribution from income and assets:
1. Start from the parents’ adjusted gross income (AGI)as reported on the tax return.
2. Add back some tax-exempt income such as earnedincome tax credit and contributions to a retirementplan.
3. Subtract several allowances including incomeprotection allowance (to cover living expenses),federal and state income tax allowance, social secu-rity tax allowance, and employment protectionallowance. The result is called Available Income (AI).
4. Parents’ discretionary net worth is calculated by
summing up parents’ financial assets excluding homeequity and subtracting an asset protection allowance.
5. Twelve percent of parents’ discretionary net worthis added to parents’ AI to get parents’ AdjustedAvailable Income (AAI).
6. The parental contribution from income and assetsis then determined by applying a progressiveschedule to the AAI. As the table in Figure 1 shows,for 2001-2002, the annual marginal rate used bythe FM ranges from 22 percent to 47 percent.Therefore, for families facing the maximum 47percent rate, 5.64 percent (12% x 47%) of parents’assets above the asset protection allowance areconsidered available to pay for college expenses.
Please note:• After subtracting various allowances, parents’ AI is
usually much lower than their AGI.
• Parents’ retirement assets are excluded in calculat-ing their discretionary net worth.
• The asset protection allowance is to provide parentsfor retirement. Therefore, the allowance increaseswith the age of the older parent. For 2001-2002school year, the asset protection allowance rangesfrom zero to $75,100. For a two-parent family withthe older parent being 45, the allowance is $42,400.
• Parents’ contribution is divided by the number ofdependent college students in the household.
Student’s contribution from income and assets:
1. Start from the student’s AGI as reported on theincome tax return.
2. Add back some tax-exempt income and benefits.
3. Subtract several allowances including federal andstate income tax allowance, social security taxallowance, and income protection allowance.
4. The result is called Available Income (AI). Fiftypercent of the student’s AI is considered availableto pay for college expenses.
5. Thirty-five percent of the student’s assets is consid-ered available to pay for college expenses.
Assets in a 529 savings plan held in a parent’s name areconsidered as parents’ assets for financial aid purposes
<6> r e s e a r c h d i a l o g u e

i s s u e n o . 7 0 j a n u a r y 2 0 0 2 <7>
F i g u r e 1 : T h e C a l c u l a t i o n o f t h e E x p e c t e d F a m i l y C o n t r i b u t i o n
Parents’AGI
Parents’tax-exemptincome
Allowances Parents’AvailableIncome(AI) Parents’
AdjustedAvailableIncome(AAI)
Parents’Contributionfrom Incomeand Assets
ExpectedFamilyContribution
applied to a table as
shown below+ _
Parents’assetsexcludinghomeequity
AssetProtectionallowance
Parents’Contribu-tion fromAssets
_ multiplied by 12%
+
Student’sAGI
Student’stax-exemptincome
Allowances Student’sAvailableIncome(AI)
+ _ multiplied by 50% Student’sContributionfrom Income
Student’sassets
multiplied by 35% Student’sContributionfrom Assets
+
+
T a b l e : P a r e n t s ’ C o n t r i b u t i o n f r o m A A I f o r 2 0 0 1 - 2 0 0 2
A c a d e m i c Ye a r
If parents’ AAI is The parents’ expected contribution from AAI is
-$3,410 or less -$750
-$3,409 to $11,400 22% of AAI
$11,401 to $14,300 $2,508 + 25% of AAI over $11,400
$14,301 to $17,200 $3,233 + 29% of AAI over $14,300
$17,201 to $20,100 $4,074 + 34% of AAI over $17,200
$20,101 to $23,000 $5,060 + 40% of AAI over $20,100
$23,001 or more $6,220 + 47% of AAI over $23,000

and thus assessed at a 5.64 percent rate in the EFCcalculation. Assets in a 529 prepaid contract usuallyreduce a student’s cost of attendance by the value ofthe contract and thus reduce a student’s aid on adollar-for-dollar basis.
The financial aid treatment of various saving options isincluded in Table 1. As Table 1 shows, assets in CoverdellESAs are considered as students’ assets in the EFC calcu-lation and assessed at a 35 percent rate.
Table 2 illustrates the calculated parental contributionfor various levels of family income and parental assets.
T o S a v e o r N o t t o S a v e ?
Although saving in general may affect the amount offinancial aid a student is eligible for, in most cases it isthe amount of loans that will be affected since onlystudents with very low EFCs are eligible for grants.Colleges and universities usually try to meet students’financial need with aid packages that consist of grants,loans, and work study. As Figure 2 shows, an estimated$74.4 billion student aid was available to help studentspay for postsecondary education in the 2000-2001academic year. Of this amount, $50.8 billion wasprovided by the federal government with $37.1 billion inthe form of federal loans.7 Unlike grants, loans must berepaid. The more families save for college, the less theywill need to borrow.
It is also worth noting that a student may qualify for asimplified EFC formula if his family income level fallsbelow a certain level (currently $50,000) and neither thestudent nor the parents were required to file an IRS Form1040 for the previous tax year. Because the simplifiedformula does not take assets into consideration in theEFC calculation, saving in this case will not affect theamount of financial aid the student is eligible for at all.Students with family income below $13,000 are auto-matically eligible for a zero EFC.
> > > S I M U L A T E D A C C U M U L A T I O N S
U S I N G D I F F E R E N T S A V I N G S
V E H I C L E S – A M O N T E C A R L O
A P P R O A C H
In Research Dialogue Issue 67, we presented a series ofnumerical calculations to illustrate potential asset
accumulations in various savings options. For thosecalculations, we used historical average returns to proj-ect asset accumulations. In other words, we assumedthat the historical average annual return for each assetclass would prevail, with certainty, for each year goingforward. Although this approach has the appeal ofbeing simple and straightforward, it does not allow forthe possible risk and volatility associated with eachasset class.
In this article, we use a Monte Carlo approach to simu-late asset accumulations in a 529 plan, Coverdell ESAs,mutual funds, and Series-I savings bonds. The MonteCarlo approach is based on trials. In each trial, thecomputer generates random asset returns and inflationrates (based on historical data) for each year goingforward and records the outcome. Thus, each trial willresult in an asset accumulation based on the randomlydrawn asset returns. In our analysis, we conduct 10,000trials and report the distribution as well as the averageasset accumulations of these 10,000 trials. In generatingrandom asset returns and inflation rates, we preservethe contemporaneous correlations between these series.For a detailed discussion of the assumptions for MonteCarlo simulations, see Appendix A.
<8> r e s e a r c h d i a l o g u e
Federal Loans ($37.1)49.9%
Institutional and Other Grants ($14.5)19.5%
Federal Pell Grants ($7.9) 10.7%
State Grants ($4.6)6.2%
FederalCampus-Based ($2.8)3.8%
Other Federal Programs ($2.8) 3.9%
Nonfederal Loans ($4.5)6.1%
Source: Trends in Student Aid 2001, The College Board.
F i g u r e 2 : E s t i m a t e d S t u d e n t A i d b y
S o u r c e f o r A c a d e m i c Ye a r 2 0 0 0 - 2 0 0 1( C u r r e n t D o l l a r s i n B i l l i o n s )
Total Aid Awarded($74.4)

i s s u e n o . 7 0 j a n u a r y 2 0 0 2 <9>
5 2 9 P l a n s a n d M u t u a l F u n d s
Three time horizons are used: six, twelve, and eighteenyears. These time horizons can be considered as repre-senting the time periods available for saving for collegefor parents (and grandparents) of children beginningmiddle school, elementary school, or infants, respectively.For each time horizon, annual contributions are assumeddeposited at the beginning of the year. Asset allocationstrategies are those of New York’s 529 plan ManagedAllocation Option for the year 2001 (see Appendix B). Inthe simulations, mutual fund investors are assumed tomimic this strategy exactly.
Given the structure of the simulations, the comparisonsare invariant with respect to the amount contributed.Annual contributions of $2,000 were chosen, primarilybecause this is the annual contribution limit in the newCoverdell ESA. The relative amounts accumulated wouldbe the same, however, regardless of whether saversmake annual contributions of $1,000, $2,000, or $5,000.Table 3 presents the results of the simulations. The top
panel of the table presents the scenario where fees areequalized between the 529 plan and a mutual fundemploying the same asset allocation strategy. Thebottom panel shows the scenario where the mutualfund charges fees representing the industry average. Thetable shows mean accumulations generated by theMonte Carlo simulations. Hence $2,000 invested annu-ally in the 529 plan would on average grow to $15,138after six years, to $39,506 after twelve years, and to$81,392 after eighteen years.
Table 3 shows that accumulations in the 529 plan areconsistently much greater than in comparable mutualfunds employing the same asset allocation strategy.Furthermore, the simulations clearly show that theadvantages of saving for college using the 529 plangrow over time. Consider first the scenario where feesare equalized between the 529 plan and the compara-ble mutual fund. At a six-year time horizon, the advan-tage of saving with the 529 plan varies between 7.6and 10.0 percent, depending on the tax bracket. At a
T a b l e 2 : E s t i m a t e d P a r e n t a l C o n t r i b u t i o n b y P a r e n t a l I n c o m e a n d A s s e t s
f o r 2 0 0 1 - 2 0 0 2 a c a d e m i c y e a r , U s i n g F e d e r a l M e t h o d o l o g y ( F M )
Parents’ Before-Tax Net Assets (Excluding Primary Residence and Family Farm)Income $20,000 $40,000 $50,000 $75,000 $100,000
$20,000 $0 $0 $0 $0 $139
$30,000 $100 $100 $301 $961 $1,621
$40,000 $1,582 $1,582 $1,782 $2,442 $3,183
$50,000 $3,139 $3,139 $3,388 $4,290 $5,354
$60,000 $5,284 $5,284 $5,648 $6,958 $8,368
$70,000 $7,818 $7,818 $8,248 $9,658 $11,068
$80,000 $10,373 $10,373 $10,802 $12,212 $13,622
$90,000 $12,927 $12,927 $13,356 $14,766 $16,176
Assumptions:
1) A tw0-parent family with two dependent children. 2) The older parent is 45 and both parents are employed. 3) Income is
from employment. 4) Parents were required to file an IRS Form 1040 tax return for 2000. 5) The family used the standard
deduction. 6) Only one child is enrolled in college. 7) Parents are residents of New York state.

an eighteen-year time horizon, the advantage rangesfrom a low of 32.0 percent to a high of 40.2 percent.
What is driving the results? Several broad themesemerge from the simulations. The first is that the rela-tive advantage of saving using a 529 plan increases as ahousehold’s tax bracket increases. The second is that thefees charged as investment expenses matter more thanthe taxation of investment returns. This is perhapssurprising, but makes sense upon further scrutiny. InScenario B shown in Table 3, the difference in fees is nottrivial. This has a large impact on the total accumulation.The reason why the fairly generous tax treatment
<10> r e s e a r c h d i a l o g u e
twelve-year time horizon, the advantage variesbetween 16.1 and 21.0 percent. At an eighteen-year timehorizon, the advantage ranges from a low of 26.7percent to a high of 34.9 percent. In the secondscenario, the mutual fund charges the industry averagefees of 124, 113, and 46 basis points for stocks, bonds,and money market, respectively. In this scenario, theadvantage of saving for college using the 529 planbecomes even more significant. At a six-year time hori-zon, the advantage of saving with the 529 plan rangesfrom 8.7 to 11.0 percent. At a twelve-year time horizon,the advantage varies between 18.9 and 23.7 percent. At
T a b l e 3 : A c c u m u l a t i o n s i n a 5 2 9 P l a n a n d R e b a l a n c e d M u t u a l F u n d s : T w o
H y p o t h e t i c a l S c e n a r i o s
Scenario A529 plan expense ratio: 65 basis points (bps); mutual funds expense ratio: 65 bps
Mutual funds earnings distributed as 25% short-term capital gains and 25% long-term capital gains
18-year horizon 12-year horizon 6-year horizon
529 plan accumulation $81,392 $39,506 $15,138
Mutual funds after-tax accumulation
25% federal, 6.85% state $64,250 $34,029 $14,06235% federal, 6.85% state $60,346 $32,646 $13,758
529 plan advantage over mutual funds
25% federal, 6.85% state 26.7% 16.1% 7.6%35% federal, 6.85% state 34.9% 21.0% 10.0%
Scenario B529 plan expense ratio: 65 bps; mutual funds expense ratio: industry average
Mutual funds earnings distributed as 25% short-term capital gains and 25% long-term capital gains
18-year horizon 12-year horizon 6-year horizon
529 plan accumulation $81,392 $39,506 $15,138
Mutual funds after-tax accumulation
25% federal, 6.85% state $61,658 $33,239 $13,92835% federal, 6.85% state $58,064 $31,948 $13,638
529 plan advantage over mutual funds
25% federal, 6.85% state 32.0% 18.9% 8.7%35% federal, 6.85% state 40.2% 23.7% 11.0%

i s s u e n o . 7 0 j a n u a r y 2 0 0 2 <11>
accorded capital gains in the simulations is relativelyunimportant in terms of the results is linked to thereason why 529 plans increase in attractiveness as ahousehold’s tax bracket increases. Rebalancing plays amajor role. As the time horizon shortens, more and moreof the total portfolio is invested in fixed-income securi-ties. Hence capital gains on equity returns become rela-tively less important, and the taxation of interest incomebecomes relatively more important. Finally, the mostimportant factor behind the superiority of 529 plans as acollege savings vehicle is the exemption from federaltaxation. The federal tax exemption places 529 plans in
an unassailably favorable position when it comes tosaving for college.
Another consideration in any comparison of 529 plansand mutual funds is the value of the state tax deduction,if any. New York’s College Saving Program enables NewYork taxpayers to deduct up to $5,000 of contributionsper taxpayer from their state income taxes. Thediscounted future value of this tax deduction enhancesthe relative appeal of the 529 plan (for New York resi-dent taxpayers). The value of this tax deduction is quitesignificant. Assuming annual contributions (deduc-tions) of $2,000, a state income tax rate of 6.85 percent,
T a b l e 4 : A c c u m u l a t i o n s i n a 5 2 9 P l a n a n d R e b a l a n c e d M u t u a l f u n d s : T w o
H y p o t h e t i c a l S c e n a r i o s , R e f l e c t i n g t h e V a l u e o f S t a t e T a x D e d u c t i o n o n
C o n t r i b u t i o n s f o r 5 2 9 p l a n
Scenario A529 plan expense ratio: 65 bps; mutual funds expense ratio: 65 bps
Mutual funds earnings distributed as 25% short-term capital gains and 25% long-term capital gains
18-year horizon 12-year horizon 6-year horizon
529 plan accumulation $85,140 $41,683 $16,091
Mutual funds after-tax accumulation
25% federal, 6.85% state $64,250 $34,029 $14,06235% federal, 6.85% state $60,346 $32,646 $13,758
529 plan advantage over mutual funds
25% federal, 6.85% state 32.5% 22.5% 14.4%35% federal, 6.85% state 41.1% 27.7% 17.0%
Scenario B529 plan expense ratio: 65 bps; mutual funds expense ratio: industry average
Mutual funds earnings distributed as 25% short-term capital gains and 25% long-term capital gains
18-year horizon 12-year horizon 6-year horizon
529 plan accumulation $85,140 $41,683 $16,091
Mutual funds after-tax accumulation
25% federal, 6.85% state $61,658 $33,239 $13,92835% federal, 6.85% state $58,064 $31,948 $13,638
529 plan advantage over mutual funds
25% federal, 6.85% state 38.1% 25.4% 15.5%35% federal, 6.85% state 46.6% 30.5% 18.0%
<12> r e s e a r c h d i a l o g u e
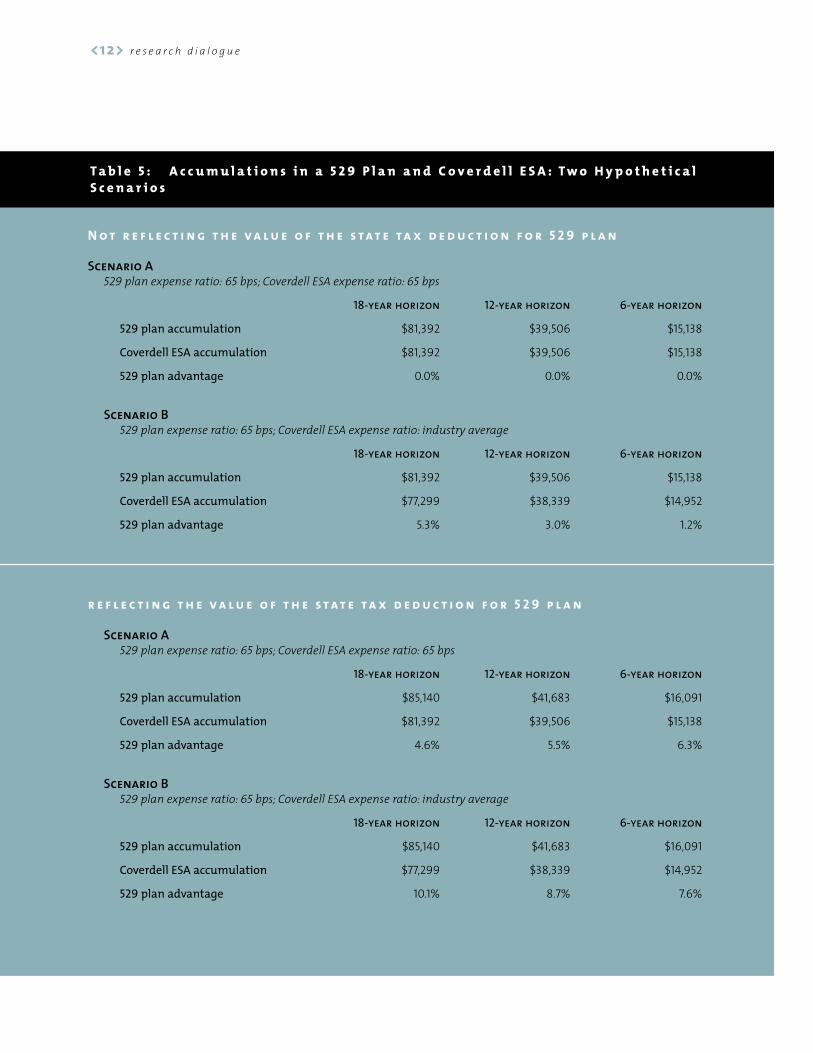
T a b l e 5 : A c c u m u l a t i o n s i n a 5 2 9 P l a n a n d C o v e r d e l l E S A : T w o H y p o t h e t i c a l
S c e n a r i o s
N o t r e f l e c t i n g t h e v a l u e o f t h e s t a t e t a x d e d u c t i o n f o r 5 2 9 p l a n
Scenario A529 plan expense ratio: 65 bps; Coverdell ESA expense ratio: 65 bps
18-year horizon 12-year horizon 6-year horizon
529 plan accumulation $81,392 $39,506 $15,138
Coverdell ESA accumulation $81,392 $39,506 $15,138
529 plan advantage 0.0% 0.0% 0.0%
Scenario B529 plan expense ratio: 65 bps; Coverdell ESA expense ratio: industry average
18-year horizon 12-year horizon 6-year horizon
529 plan accumulation $81,392 $39,506 $15,138
Coverdell ESA accumulation $77,299 $38,339 $14,952
529 plan advantage 5.3% 3.0% 1.2%
r e f l e c t i n g t h e v a l u e o f t h e s t a t e t a x d e d u c t i o n f o r 5 2 9 p l a n
Scenario A529 plan expense ratio: 65 bps; Coverdell ESA expense ratio: 65 bps
18-year horizon 12-year horizon 6-year horizon
529 plan accumulation $85,140 $41,683 $16,091
Coverdell ESA accumulation $81,392 $39,506 $15,138
529 plan advantage 4.6% 5.5% 6.3%
Scenario B529 plan expense ratio: 65 bps; Coverdell ESA expense ratio: industry average
18-year horizon 12-year horizon 6-year horizon
529 plan accumulation $85,140 $41,683 $16,091
Coverdell ESA accumulation $77,299 $38,339 $14,952
529 plan advantage 10.1% 8.7% 7.6%

i s s u e n o . 7 0 j a n u a r y 2 0 0 2 <13>
and the discount rate used is the yield on municipalbonds (the historical average is 4.25 percent), thediscounted value of the tax deduction grows to $953 ata time horizon of six years, to $2,177 at twelve years,and to $3,748 at 18 years.
Adding these sums into the accumulation totals calcu-lated in the simulations for New York’s College SavingProgram further enhances the attractiveness of theprogram. This is shown in Table 4. At a six-year time hori-zon, the advantage of the 529 plan ranges from 14.4 to18.0 percent, depending on fees charged and the taxbracket. At a twelve-year time horizon, 529 plans outper-form mutual funds from 22.5 to 30.5 percent. At aneighteen-year time horizon, the relative advantage of the529 plan is as much as 46.6 percent. In the most favor-able scenario for mutual funds, the advantage of the 529plan is still 32.5 percent.
5 2 9 P l a n s a n d C o v e r d e l l E d u c a t i o n
S a v i n g s A c c o u n t s
The new tax law transformed the all but worthlessEducation IRA, with an annual contribution limit ofonly $500, into the worthwhile Coverdell ESA, with anannual contribution limit of $2,000. The Coverdell ESAcan also be used to save for education expenses atprivate elementary and secondary schools.Furthermore, the account owner retains complete flexi-bility with respect to asset allocation, making this anattractive saving vehicle for many households. Giventhe similar federal tax treatment of 529 plans andCoverdell ESAs, a comparison of the two savings vehi-cles reduces to a comparison of fees and the impact ofstate tax deductions, if any, on 529 plans. Table 5 pres-ents this comparison. In the top half of the table,scenario A shows the case where fees are equalizedbetween the two savings vehicles. In this case thesimulated accumulations are identical. In scenario B,the Coverdell ESA is assumed to be invested in amutual fund with industry-average annual expensecharges. In this case the 529 plan has a slight advan-tage, ranging from 1.2 percent at a six-year time hori-zon to 3.0 percent at a twelve-year time horizon and5.3 percent at an eighteen-year time horizon.
The bottom half of the table reflects the impact of a(New York) state tax deduction on the comparison. Inscenario A, where fees are equalized, the presence of astate tax deduction results in an advantage for the 529
plan ranging from 4.6 percent at an eighteen-year timehorizon to 5.5 percent at a twelve-year time horizon and6.3 percent at a six-year time horizon. The reason whythe advantage for the 529 plan falls as the time horizonlengthens is a product of the discount rate used to valuethe state tax deduction. The discount rate, 4.25 percent,is large relative to the average return at the six-year timehorizon, because at this time horizon returns are domi-nated by money market securities. Conversely, at longertime horizons the discount rate is small relative to theaverage returns for the 529 plan, due to the heavierequity weighting in the asset allocation strategy atlonger time horizons.
In scenario B the 529 plan enjoys the dual advantages ofthe state tax deduction and lower fees. This results in anadvantage for the 529 plan ranging from 7.6 percent at asix-year time horizon to 8.7 percent at a twelve-year timehorizon and 10.1 percent at an eighteen-year time hori-zon. In this scenario the advantage for the 529 plangrows as the time horizon lengthens due to the disparityin fees.
In sum, Table 5 shows that Coverdell ESAs are an attrac-tive vehicle for household’s saving for college. Two addi-tional features of Coverdell ESAs merit mention. In termsof annual investment fees, it is certainly possible forinvestors to select mutual funds with expense chargeslower than 65 basis points, making Coverdell ESAsslightly superior to 529 plans, assuming hypotheticalequal returns. Coverdell ESAs are still only a partialanswer to the problem of saving for college, however,due to their annual contribution limit of $2,000.
I m p l i c a t i o n s o f t h e S i m u l a t i o n s
The above comparisons did not show the full range ofoutcomes generated by the simulations, only the meanresults. The value of the Monte Carlo approach, however,lies in the use of historical data to provide an under-standing of the range of uncertainty that future invest-ment returns might take. For the 529 plan at a six-yeartime horizon, the simulations generated a range ofoutcomes from $12,927 at the 10 percent level to $17,510at the 90 percent level. This means that while on averagethe accumulation was $15,138 after six years, only 10percent of the simulations generated accumulations ofless than $12,927, and in 90 percent of the simulationsthe accumulation was no greater than $17,510. Figure 3shows this comparison for the case of the 529 plan, a

<14> r e s e a r c h d i a l o g u e
5 10 15 20 25 30 35
Percentile
40 45 50 55 60 65 70 75 80 85 90 9511,000
12,000
13,000
14,000
15,000
16,000
17,000
18,000
$19,000
Figure 3. Range of Accumulations in Alternative Saving
Vehicles: 6-Year Time Horizon, Scenario A
529 PlanCoverdell ESA, Industry-average ExpensesMF 25% Federal, 6,85% State, 65 bpsMF 35% Federal, 6,85% State, 65 bps
5 10 15 20 25 30 35
Percentile
40 45 50 55 60 65 70 75 80 85 90 9511,000
12,000
13,000
14,000
15,000
16,000
17,000
18,000
$19,000
Figure 4. Range of Accumulations in Alternative Saving
Vehicles: 6-Year Time Horizon, Scenario B
529 PlanCoverdell ESA, Industry-average ExpensesMF 25% Federal, 6.85% State, Industry-average ExpensesMF 35% Federal, 6.85% State, Industry-average Expenses
5 10 15 20 25 30 35
Percentile
40 45 50 55 60 65 70 75 80 85 90 9525,000
30,000
35,000
40,000
45,000
50,000
$55,000
Figure 5. Range of Accumulations in Alternative Saving
Vehicles: 12-Year Time Horizon, Scenario A
529 PlanCoverdell ESA, Industry-average ExpensesMF 25% Federal, 6,85% State, 65 bpsMF 35% Federal, 6,85% State, 65 bps
5 10 15 20 25 30 35
Percentile
40 45 50 55 60 65 70 75 80 85 90 9525,000
30,000
35,000
40,000
45,000
50,000
$55,000
Figure 6. Range of Accumulations in Alternative Saving
Vehicles: 12-Year Time Horizon, Scenario B
529 PlanCoverdell ESA, Industry-average ExpensesMF 25% Federal, 6,85% State, Industry-average ExpensesMF 35% Federal, 6,85% State, Industry-average Expenses
5 10 15 20 25 30 35
Percentile
40 45 50 55 60 65 70 75 80 85 90 9540,000
50,000
60,000
70,000
80,000
90,000
100,000
110,000
120,000
$130,000
Figure 7. Range of Accumulations in Alternative Saving
Vehicles: 18-Year Time Horizon, Scenario A
529 PlanCoverdell ESA, Industry-average ExpensesMF 25% Federal, 6,85% State, 65 bpsMF 35% Federal, 6,85% State, 65 bps
5 10 15 20 25 30 35
Percentile
40 45 50 55 60 65 70 75 80 85 90 9540,000
50,000
60,000
70,000
80,000
90,000
100,000
110,000
120,000
$130,000
Figure 8. Range of Accumulations in Alternative Saving
Vehicles: 18-Year Time Horizon, Scenario B
529 PlanCoverdell ESA, Industry-average ExpensesMF 25% Federal, 6,85% State, Industry-average ExpensesMF 35% Federal, 6,85% State, Industry-average Expenses

i s s u e n o . 7 0 j a n u a r y 2 0 0 2 <15>
Coverdell ESA with industry average expenses, andmutual funds in two different tax brackets and expensecharges of 65 basis points. Figure 4 repeats this compari-son at a six-year time horizon, except that the mutualfunds have industry average expenses. Figures 3 and 4make two basic points. The first point is that the 529plan has larger accumulations than any of the alterna-tive saving vehicles throughout the range of simulations,from the 5th percentile to the 95th percentile. Thesecond point is that the comparative advantage of the529 plan vis-à-vis the mutual funds becomes larger atthe higher ranges of the simulations. For example, theaccumulation in the 529 plan at the 25th percentile ofthe simulations was $13,844, versus $12,809 for themutual fund investor in the top tax bracket with a fundcharging industry average annual fees. At the 75thpercentile, however, the accumulation in the 529 planwas $16,255, versus $14,394 for the mutual fund. Hencethe disparity in accumulations grows as the accumula-tion results become progressively more favorable in eachsaving vehicle. In other words, the good news increaseson the upside.
Similar comparisons are shown at the twelve-year timehorizon in Figures 5 and 6. Once again the same patternholds. At the 5th percentile the accumulation is $28,097in the 529 plan, $27,449 for the Coverdell ESA with indus-try average expense charges, $26,049 for a mutual fundinvestor in the 25 percent federal tax bracket, with astate tax bracket of 6.85 percent and an annual expensecharge of 65 basis points, and $25,348 for a mutual fundinvestor in the top federal tax bracket, with a state taxbracket of 6.85 percent and an annual expense charge of65 basis points. Thus when the outcomes are bad the529 plan still results in higher accumulations, but thedifference is small. At the 95th percentile, however, thedifferences are substantial. Figure 5 shows that in thiscase the relative accumulations are $54,408 in the 529plan, $52,649 in the Coverdell ESA, and $44,402 and$41,856 in the mutual funds, depending on the federaltax bracket. Figure 6 shows that the disparities in theaccumulations become still greater when the mutualfund investor chooses a fund with industry-averageexpense charges.
The range of accumulations at the eighteen-year timehorizon are shown in Figures 7 and 8. The figures showthat as the time horizon lengthens the difference inaccumulations between the alternative savings vehi-
cles grows as well. At the 50th percentile, Figure 7shows that the median accumulation was $77,062 inthe 529 plan, $73,379 in the Coverdell ESA when theexpense charge was the industry average, and $61,678and $58,197 in the mutual funds with the two differentfederal tax brackets and common expense charges of65 basis points. At the 75th percentile, however, theaccumulations were $94,371, $89,510, $72,888, and$68,132 respectively. At the 95th percentile, the accu-mulations were $126,200, $120,521, $93,116, and $86,583respectively. Hence at the 75th percentile the differencebetween the accumulation in the 529 plan and thehigh-federal-tax-bracket mutual fund was 39 percent,and rose to 46 percent at the 95th percentile.
5 2 9 P l a n s a n d S e r i e s I B o n d s
An additional comparison is between 529 plans andSeries I bonds. The interest rate on Series I bonds is infla-tion-indexed and includes two parts: (1) a predeterminedreal interest rate that applies throughout the life span ofthe bonds, and (2) the inflation rate, which is announcedsemiannually to reflect the most recent Consumer PriceIndex. In our simulations, the inflation rate is randomlygenerated (see Appendix A) and the real rate of thereturn for Series I bonds is assumed to remain at thecurrent rate of 2.0 percent.
Where interest on Series I bonds is fully excluded fromfederal taxation, 529 plans outperform Series I bonds by4.5 percent at a six-year time horizon, by 14.7 percent at atwelve-year time horizon, and by 31.5 percent at an eight-een-year time horizon. In an alternative scenario, theinterest of Series I bonds is subject to federal taxation ata rate of 25 percent. In this scenario, 529 plans outper-form Series I bonds by 9.2 percent at a six-year time hori-zon, by 24.1 percent at a twelve-year time horizon, and by46.9 percent at an eighteen-year time horizon.
We also consider two additional scenarios for thecomparison of 529 plans and Series I bonds, this timereflecting the value of a state tax deduction for 529plans. The first scenario presents the case where inter-est on Series I bonds is fully excluded from federaltaxation; and the second presents the case where inter-est on Series I bonds is subject to federal taxation at arate of 25 percent. In the first scenario 529 plansoutperform Series I bonds by 11 percent at a six-yeartime horizon, by 21 percent at a twelve-year time hori-zon, and by 37.6 percent at an eighteen-year time hori-

zon. In the second scenario 529 plans outperformSeries I bonds by 16 percent at a six-year time horizon,by 31 percent at a twelve-year time horizon, and by 53.7percent at an eighteen-year time horizon. The simula-tions show that under all circumstances investing in a529 plan results in significantly greater accumulationsthan can be obtained by purchasing Series I bonds. Thisis true whether or not investors are able to take advan-tage of the federal tax exclusion, and whether or notthe 529 plan enjoys a state tax deduction. These resultswould only be overturned, it appears, if future inflationwere to rise to levels substantially above thosemodeled here or if the real interest rate were muchhigher than the current 2.0 percent. Hence onlyinvestors who are extremely risk averse, or who antici-pate sharply higher future inflation, could expect togain in relative terms by saving for college using SeriesI bonds.
> > > C O N C L U D I N G R E M A R K S
A college education is perhaps the most importantinvestment parents can make in a child’s future. Theeconomic benefits of a college education haveincreased as the wage gap between high school andcollege graduates widened in the past few decades.According to the Census Bureau, college graduatesearned on average 83 percent more than high schoolgraduates in 2000.8 However, a college education doesnot come cheap. That is why it is important thatparents start saving as early as possible.
Although there are many savings options available,many parents find themselves overwhelmed when itcomes to choosing the right option for their family. Inthis article, we present an updated analysis of savingwith 529 plans and other options. We show that 529plans are now even more appealing thanks to the recenttax law changes. With qualified withdrawals from 529plans now completely exempt from federal taxation, 529plans are an extremely attractive investment vehicle forcollege savings. Although 529 plans are not guaranteedto outperform other investments, they have definiteadvantages over other investment strategies with simi-lar risk characteristics. A majority of states now offer 529savings plans, and few states have residency require-ments. Households shopping for a 529 plan should firstinvestigate whether or not their state plan offers a statetax deduction. Households should also consider the
available investment alternatives of individual 529 plans.Most 529 plans offer a variety of asset allocation options,allowing households to tailor their investments to theirrisk preferences. In addition, households should espe-cially investigate the expense charges of 529 plans. Aswe demonstrated in the simulation analysis, fees mattera great deal.
Levels of risk tolerance and preference for direct invest-ment control vary, and households may prefer somesaving strategies to others. In making their savings deci-sions, households should take into account their ownfinancial situations and savings goals and evaluate theadvantages and disadvantages of each strategy to findthe best way to meet their own college saving needs.
This article was prepared by Jennifer Ma, research economist, and Douglas Fore, assistant director,TIAA-CREF Institute. The TIAA-CREF Institute, part of theTIAA-CREF group of companies, was established to fosterresearch and education to support the lifelong financialsecurity of individuals and their families. The Instituteconducts research, provides research grants and awards toindependent scholars, and develops educational programsin several fields of study, including: pensions and retire-ment; health, life and long-term care insurance; invest-ment products and strategies; endowments and plannedgiving; higher education financing and trends; corporategovernance, and financial literacy. Other companies in theTIAA-CREF group offer or manage Classic and Roth IRAs,Education IRAs, Section 529 Plans, Mutual Funds, and othersecurities products. For more information on these products, including charges and expenses, call 1 800 8421924 for prospectuses or a program disclosure booklet;read them carefully before you invest.
<16> r e s e a r c h d i a l o g u e

i s s u e n o . 7 0 j a n u a r y 2 0 0 2 <17>
A P P E N D I X A : D E T A I L E D A S S U M P T I O N S
F O R S I M U L A T I O N S
AAsssseett RReettuurrnnssIn each period, the gross returns (1+Rt) for stocks, bonds, and
money market are assumed to be distributed as lognormal, i.e.,
log(1+Rt) = rt, where rt is normally distributed. In the Monte Carlo
simulations, the return for each asset class in each year is
randomly drawn from a lognormal distribution. Based on the
1926-2000 historical data, the mean and standard deviation for
the annual net return (Rt) for each asset class are as follows:
IInnffllaattiioonnSince the nominal interest rate on Series-I bonds is the sum of a
pre-determined real interest rate and the inflation rate, we need
to simulate future inflation rates. We assume that inflation
follows the process described below:
Inflationt = � + � * Inflationt-1 + �t (A1)
�t = �*�t-1 + �t (A2)
Where �t is i.i.d. normally distributed with a zero mean and vari-
ance �2. In other words, the inflation rate in each year is deter-
mined by three factors: (1) a constant rate �, (2) the inflation rate
in the previous period, and (3) a random stochastic term �t.
Furthermore, the random stochastic term in each period is corre-
lated with the stochastic term in the previous period. The
parameter estimates from historical data are as follows:
For each year into the future, a random �t term is generated,
which is then used to calculate the �t term using equation A2.
The �t term is in turn used to calculate the inflation rate using
equation A1. In generating random returns for stocks, bonds, and
money market, and the �t component of inflation, the rank
correlations between these series are preserved. The rank corre-
lation matrix for these series obtained from historical data is as
follows:
TTaaxxeessTwo different tax brackets are used for mutual funds. The low
tax bracket is a federal tax bracket of 27 percent for 2002(reduced to 25 percent by 2006) and a state income tax of 6.85percent. The high tax bracket is a federal tax bracket of 38.6percent for 2002 (reduced to 35 percent by 2006) and a state
income tax of 6.85 percent. The state income tax rates corre-
spond to those of New York. We assume that the tax rates sched-
uled to come into effect in 2006 remain in effect indefinitely.
For mutual funds, stock returns are assumed to consist of a divi-
dend payment at a fixed annual yield rate of 1.5 percent, regard-
less of the stock return being positive. This dividend income
reduces the annual random stock return by 150 basis points. Of
the remaining stock return, 25 percent of all positive returns are
assumed to be short-term realized capital gains and 25 percent
long-term realized capital gains. Thus, 50 percent are unrealized
capital gains. If the after-dividend stock return is negative, then
no capital gains are realized. Accumulated unrealized capital
gains are taxed at the end of the investment horizon. Returns on
bonds and money market are assumed to consist entirely of divi-
dends and thus taxed as regular income.
We also consider the tax consequences of rebalancing for mutual
funds. If rebalancing results in a sale of stocks, then a portion of
the unrealized capital gains is realized and taxed as long-term
capital gains. This portion is calculated on a pro-rata basis.
FFeeeessThe 529 plan was assumed to have annual expense charges of 65basis points, corresponding to New York’s 529 Plan. Two different
scenarios were used for the fees charged by mutual funds and
Coverdell ESAs. In one scenario, expense charges of 65 basis
points were assumed. In a second scenario, annual expense
charges of 123, 114, and 46 basis points were assumed for stocks,
bonds, and money market, respectively. These annual expense
charges correspond to the industry average expense charges of
each of these asset classes. For stocks and bonds, the expense
data were as of October 31, 2001. (Source: Morningstar, Inc.) For
money market, the expense data were as of the end of the third
quarter of 2001. (Source: iMoneyNet, Inc.) Furthermore, no front
or back loads or 12b-1 fees were assumed in the simulations.
Net Return (Rt) Stocks Bonds Money Market
Mean 13.12% 6.03% 3.86%
Standard
deviation 21.98% 8.32% 3.15%
� 0.017� 0.484� 0.249�
2 0.001
Stocks Bonds Cash Inflation
Stocks 1.00 0.22 -0.03 -0.14Bonds 0.22 1.00 0.09 -0.20Cash -0.03 0.09 1.00 0.48Inflation -0.14 -0.20 0.48 1.00

<18> r e s e a r c h d i a l o g u e
A p p e n d i x B : N e w Yo r k S t a t e 5 2 9 P l a n 2 0 0 1 M a n a g e d A s s e t A l l o c a t i o n
Beneficiary’s Year of Birth Projected Years to Enrollment Equities Bonds Money Market
2000 or 2001 18 years 75% 25% 0%1998 or 1999 16-17 years 65% 35% 0%1996 or 1997 14-15 years 60% 40% 0%1994 or 1995 12-13 years 55% 45% 0%1992 or 1993 10-11 years 50% 50% 0%1990 or 1991 8-9 years 45% 55% 0%1988 or 1989 6-7 years 40% 60% 0%1986 or 1987 4-5 years 30% 70% 0%1984 or 1985 2-3 years 20% 70% 10%Pre-1984 1 year 15% 40% 45%

i s s u e n o . 7 0 j a n u a r y 2 0 0 2 <19>
R E F E R E N C E S
The College Board, Trends in College Pricing 2001, New York, 2001.
The College Board, Trends in Student Aid 2001, New York, 2001.
Hurley, Joseph F., The Best Way to Save for College, BonaCom
Publications, 2001.
iMoneyNet, Inc., Money Fund Expense Report.
Internal Revenue Service, Economic Growth and Tax
Reconciliation Act of 2001, June 2001.
Internal Revenue Service, IRS Notice 2001-55, September 2001.
Ma, Jennifer and Douglas Fore, “Saving for College: A
Comparison of Section 529 Plans with Other Options,” Research
Dialogue, Issue 67, March 2001.
Ma, Jennifer, Mark J. Warshawsky, John Ameriks, and Julia
Blohm, “An Economic Approach to Setting the Contribution
Limits in Qualified State-sponsored Tuition Savings Plan,”
National Tax Association Proceedings 2000.
Morningstar Inc., Morningstar Principia Pro Mutual Funds.
U.S. Department of Education, 2001-2002 Student Financial Aid
Handbook.
F O O T N O T E S
1Source: Trends in College Pricing 2001, The College Board.
2Among the forty existing savings plans, thirty-two states have
account balance limits and eight have contribution limits. See
Ma, Warshawsky, Ameriks, and Blohm (2001) for a study of
using an economic approach to setting the contribution limits
for 529 plans. In practice, limits are set by states according to
broad considerations set forth in the IRC and regulations.
3The additional 10% tax does not apply in the event of the bene-
ficiary’s death or becoming disabled. If the beneficiary receives
tax-free scholarship, educational assistance allowance, or other
tax-free educational benefits, then the distributions are not
subject to the additional 10% tax to the extent that the distribu-
tion is not more than the amount of the scholarship, educa-
tional allowances, or other benefits.
4Source: College Savings Plan Network, Lexington, Kentucky.
5Allowable expenses include tuition, fees, academic tutoring,
books, supplies, other equipment, “special needs services,” room
and board, uniforms, transportation and “supplementary items
and services.”
6Same exceptions exist as those for 529 plans.
7Source: Trends in Student Aid 2001, The College Board.
8Reflects all wage and salary workers aged 25 to 64. Source:
Current Population Survey, March Supplement, U.S. Census
Bureau, 2001.

Iti
© 2001 TIAA-CREF Institute
730 Third AvenueNew York, NY 10017-3206Tel 800.842.2733 ext 6363tiaa-crefinstitute.org