saver plus 2008 follow-up survey results · jennifer harlim, school of economics ... monash...
TRANSCRIPT
Saving behaviour of past Saver Plus participantsRoslyn Russell, School of Economics, Finance and Marketing, RMIT University
Jennifer Harlim, School of Economics, Finance and Marketing, RMIT University
Robert Brooks, Department of Econometrics and Business Statistics, Monash University
Saver Plus 2008 follow-up survey resultsMay 2008

ANZ and The Brotherhood of St Laurence are pleased to release this third report of participants’ saving behaviour post their involvement in Saver Plus. Participants in this study participated in the pilot of the program and at the time of survey were either 2 years or 3 years out of the program.
The long-term behavioural impacts of Saver Plus are of critical importance in determining if it is an appropriate intervention for low-income people to assist in building assets and money confidence over their lifetimes.
We have seen a pleasing continuation of the positive effects of Saver Plus since the last report. Of course, ongoing savings patterns, increased confidence in money management, and positive inter-generational effects are all very important outcomes. Additionally, the fact that response rates remain so high, and anecdotal accounts from past participants are so enthusiastic, is a firm testament to the success of the program model and the skill with which it is so expertly delivered by our community partners.
As one participant says, “It was a life changing experience doing the Saver Plus program. I now do so many things that I learnt with this program, like actually saving and now I can pay my bills on time. My family are happier, and we even saved and had a little holiday – FANTASTIC”
Meantime, participation rates in Saver Plus continue to grow. As at the publication date, over 1,400 people have commenced participation across 20 locations nationally. Interest is being expressed by other service providers and potential funders, and the potential for Saver Plus to be expanded to achieve truly significant scale is very high.
RMIT University has supported the success of Saver Plus through an ongoing body of dedicated research that is continuing to draw attention internationally. Special thanks to Dr Roslyn Russell, who along with others in the RMIT team has been in constant contact with the partners and our Saver Plus workers since the very genesis of the program, and understands better than most the many challenges and triumphs involved.
Finally, we would like to extend our deepest gratitude to the many people involved in the delivery of Saver Plus. The commitment and support of our original partners; Berry Street, the Benevolent Society and The Smith Family (and all of their Saver Plus staff) has been unyielding, and we are delighted to share these successes with them.
Foreword
Sarina Greco General Manager, Community Services The Brotherhood of St Laurence
Michelle Commandeur Head, Group Community Relations ANZ

Saving behaviour of past Saver Plus participants May 2008
Roslyn Russell, School of Economics, Finance and Marketing, RMIT University
Jennifer Harlim, School of Economics, Finance and Marketing, RMIT University
Robert Brooks, Department of Econometrics and Business Statistics, Monash University
May 2008

Saving behaviour of post Saver Plus participants
2
Contents
Table of Contents 2
List of Tables 3
List of Figures 4
Summary 5
1.0 Introduction 6
2.0 Method 7
3.0 Characteristics of Responding Participants 8
4.0 Post-Saver Plus Saving Behaviour 9
4.1 Savings Levels and Patterns 9
4.2 Methods for Making Deposits 14
4.3 Comments from Participants About Saving 14
4.4 Current Reasons for Saving 16
5.0 Changes in Spending on Education 18
6.0 Managing Money and Planning Ahead 19
7.0 Financial Stability and Saving Behaviour 21
8.0 Current Use of Financial Products 27
9.0 General Impact of Saver Plus on Participant and Family 28
9.1 Reduced Stress 29
9.2 Benefits for Children 30
10.0 Individual Role in Society: Perceptions and Participation 31
10.1 Community Involvement 31
10.2 Value of Own Opinion 32
11.0 Conclusion 33
12.0 References 34

Saving behaviour of post Saver Plus participants
3
List of Tables
Table 1: Composition of respondents by location 7
Table 2: Composition of respondents by phase 7
Table 3: Changes in monthly savings deposits by location 9
Table 4: Changes in monthly savings deposits by phase 10
Table 5: Saving pattern by location 11
Table 6: Saving pattern by phase 11
Table 7: Interaction between changes in monthly savings deposits and current saving pattern 11
Table 8: Interaction between ease of making monthly Saver Plus savings deposits and follow-up savings deposit levels and patterns 13
Table 9: Interaction between insurance products and follow-up savings deposit levels 13
Table 10: Method for making deposits 14
Table 11: Comments from participants about saving 15
Table 12: Current reasons for saving 16
Table 13: Comments by participants about goals 17
Table 14: Levels of spending on education compared to 12 months ago 18
Table 15: Planning horizon for saving and spending 19
Table 16: Comments by participants about managing money and planning ahead 20
Table 17: Financial difficulties in the past year 21
Table 18: Financial difficulties and income changes 22
Table 19: Debt and income changes 23
Table 20: Changing income levels and savings deposit levels 23
Table 21: Changing income levels and saving patterns 23
Table 22: Financial difficulties and savings deposit levels 24
Table 23: Financial difficulties and saving patterns 24
Table 24: Changing debt levels and savings deposit levels 25
Table 25: Changing debt levels and saving patterns 25
Table 26: Comments from participants about the factors that have affected their saving efforts 26
Table 27: Preferred sources of advice in case of financial difficulties 26
Table 28: Financial products – current levels of use 27
Table 29: Comments from participants about the longer term impacts from participating in Saver Plus 28
Table 30: Comments from participants about reduced stress due to participating in Saver Plus 29
Table 31: Comments from participants about the impact of Saver Plus on their children 30
Table 32: Participation in community / social activity over the last 12 months 31
Table 33: Change in level of participation over the last 12 months 31
Table 34: Impact of own opinion 32
Saving behaviour of post Saver Plus participants
4
List of Figures
Figure 1: Monthly savings deposits in the last 12 months 9
Figure 2: Current saving patterns 10
Figure 3: Changes in savings deposit levels for Phase One participants who have replied to the three follow-up surveys 12
Figure 4: Changes in savings deposit levels for Phase Two participants who have replied to the last two follow-up surveys 12
Figure 5: Planning horizon: Saving and spending 19
Figure 6: Changes in overall debt in the last 12 months 22
Saving behaviour of post Saver Plus participants
5
Summary
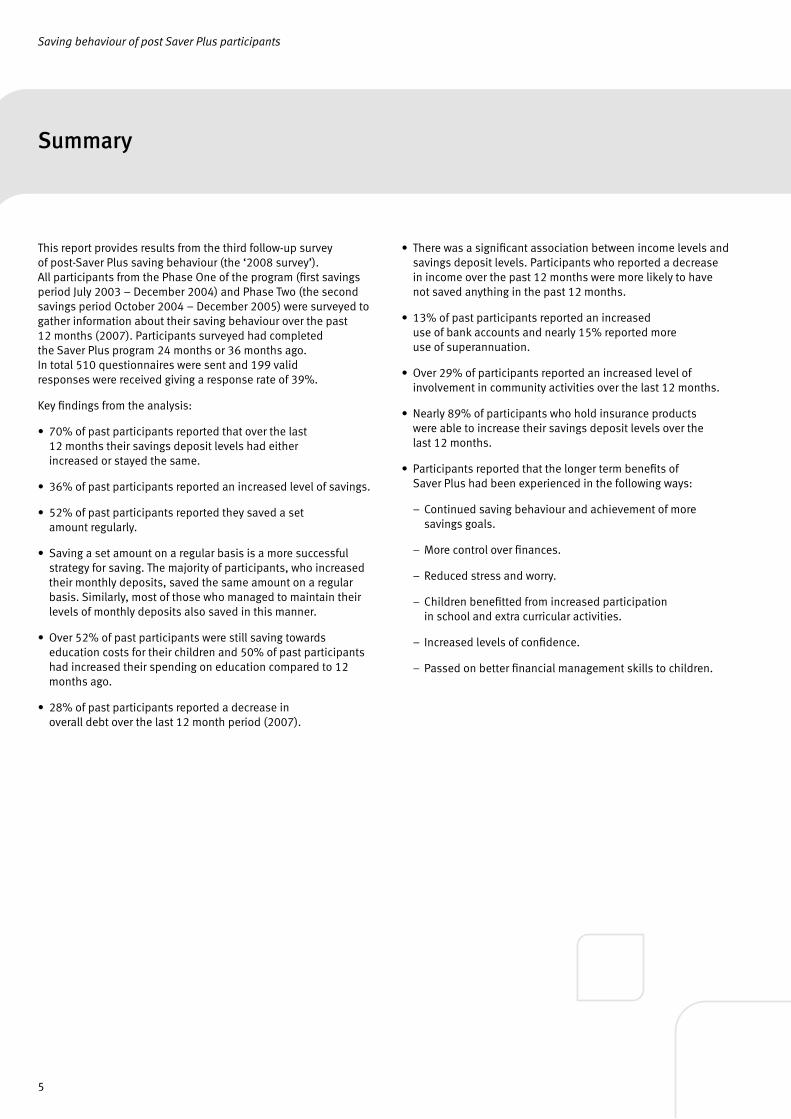
This report provides results from the third follow-up survey of post-Saver Plus saving behaviour (the ‘2008 survey’). All participants from the Phase One of the program (first savings period July 2003 – December 2004) and Phase Two (the second savings period October 2004 – December 2005) were surveyed to gather information about their saving behaviour over the past 12 months (2007). Participants surveyed had completed the Saver Plus program 24 months or 36 months ago. In total 510 questionnaires were sent and 199 valid responses were received giving a response rate of 39%.
Key findings from the analysis:
• 70% of past participants reported that over the last 12 months their savings deposit levels had either increased or stayed the same.
• 36% of past participants reported an increased level of savings.
• 52% of past participants reported they saved a set amount regularly.
• Saving a set amount on a regular basis is a more successful strategy for saving. The majority of participants, who increased their monthly deposits, saved the same amount on a regular basis. Similarly, most of those who managed to maintain their levels of monthly deposits also saved in this manner.
• Over 52% of past participants were still saving towards education costs for their children and 50% of past participants had increased their spending on education compared to 12 months ago.
• 28% of past participants reported a decrease in overall debt over the last 12 month period (2007).
• There was a significant association between income levels and savings deposit levels. Participants who reported a decrease in income over the past 12 months were more likely to have not saved anything in the past 12 months.
• 13% of past participants reported an increased use of bank accounts and nearly 15% reported more use of superannuation.
• Over 29% of participants reported an increased level of involvement in community activities over the last 12 months.
• Nearly 89% of participants who hold insurance products were able to increase their savings deposit levels over the last 12 months.
• Participants reported that the longer term benefits of Saver Plus had been experienced in the following ways:
– Continued saving behaviour and achievement of more savings goals.
– More control over finances.
– Reduced stress and worry.
– Children benefitted from increased participation in school and extra curricular activities.
– Increased levels of confidence.
– Passed on better financial management skills to children.

Saving behaviour of post Saver Plus participants
6
This report provides results from the third (2008) survey of post-Saver Plus saving behaviour. All participants from Phase One (July 2003 – December 2004) and Phase 2 (October 2004 – December 2005) were surveyed to gather information about their savings levels and patterns (2007). Saver Plus, a financial literacy and matched savings program, was initiated in 2003 to assist families on low incomes improve their financial knowledge, build a long-term savings habit and save for education expenses. The program was developed in partnership by ANZ and the Brotherhood of St Laurence (BSL) and has been implemented through subsequent partnerships with Berry Street Victoria (BSV), The Benevolent Society (TBS), and The Smith Family (TSF).
The program includes three components: matched savings at a ratio of $1 for every $1 saved (however, the two savings periods included in this analysis offered $2:1 matched savings1 ); financial literacy education; and support from the delivering organisation. To be eligible to participate in Saver Plus Phase One and Two, an individual needed to be a parent or guardian of children enrolled in a government secondary school2 ; have a Health Care Card or Pension Card issued by Centrelink; have earnings through part-time, casual or self employment; and be able to demonstrate a capacity to save. Participants were encouraged to save towards a goal that relates to education costs.
Phase One of Saver Plus began in July 2003 and was completed in December 2004. It was offered in three sites: Frankston, Victoria (BSL), Shepparton, Victoria (BSV), and Campbelltown, NSW (TBS). The total number of participants across the three sites was 269.
Phase Two of Saver Plus ran from October 2004 to December 2005 in four locations, three being the same as the first phase with the addition of South East Queensland (TSF). There were 408 participants who completed Phase Two.
1.0 Introduction
In 2006 (Phase Three) Saver Plus was significantly extended and includes 19 sites across Queensland, New South Wales, Victoria and A.C.T. The sites are managed by the Brotherhood of St Laurence, Berry Street Victoria, Benevolent Society and The Smith Family.
The evaluations of the first and second phases have confirmed that Saver Plus has been successful in achieving its goals. A total of 92.4% of participants in the first phase and 94.5% in the second phase met or exceeded their savings goal. In terms of improved money management behaviour, approximately 95% of Saver Plus participants from the first phase and 96% from the second phase reported an increase in their ability to plan and manage their money since undertaking Saver Plus3. Nearly all participants from phase one and two (98.8% and 99.6% respectively) expressed a desire to continue saving after completing Saver Plus.
While it is important that participants in programs such as Saver Plus develop the intention to continue the desired behaviour post-program, the real test of any social change program is the actual behaviour change that occurs once the monitoring, incentives and organisational support has ceased. To date, the follow-up surveys indicate strong levels of continued saving behaviour with results from 2007 survey showing 75% of past Saver Plus participants were still saving the same amount or more 12 and 24 months later. Results from the 2006 survey showed 72% of participants who had completed Saver Plus 12 months previously were still saving the same amount or more.
This report provides an indication of the saving behaviour during 2007 as reported by past participants 36 months after the phase one participants and 24 months after phase two participants completed Saver Plus4.
3 These results are from participant focus groups held three months after completion of the program.4 The exception for phase 1 participants is the Frankston Continuing Group (FCG) who were offered
the opportunity to participate in the second savings period.
1 Except for a group of participants from phase 1 who were given the opportunity to do the program in the subsequent year at a matched rate of $1:1.
2 Saver Plus eligibility now includes parents or guardians of children at primary school and also individuals who want to save for their own vocational education.

Saving behaviour of post Saver Plus participants
7
For the purpose of analysing post-Saver Plus saving behaviour of participants, a survey was conducted on all Phase One and Two participants who indicated a willingness to participate in the research. A total of 510 questionnaires were sent in December 2007 requesting information relating to saving and money management behaviour and community engagement during the previous 12 months. We received 199 valid responses, resulting in a response rate of 39%.
The composition of respondents by location and phase of participation in the program are shown in Tables 1 and 2, respectively. The majority of respondents were from Frankston (35.6%, including the Frankston Continuing group) and Shepparton (30.7%). However the proportions of respondents by location were very similar to the proportions across locations in the original evaluation research.
The majority of respondents (76.9%) to the 2007 survey were participants in Phase Two of the program. However the proportions of Phase One and Two participants in the 2008 survey are very close to the proportions of Phase One and Two participants in the original evaluation research.
From the Phase One participants there were 28 respondents (61.0% of Phase One respondents) who have now completed all three follow-up surveys, while from the Phase Two participants there were 112 respondents (73.2%) who completed both the 2007 and 2008 surveys.
2.0 Method
Table 1: Composition of respondents by location
Location Total
N %
Shepparton 61 30.7
Frankston 26 13.1
Frankston Continuing 45 22.5
Campbelltown 34 17.1
Brisbane 33 16.6
Victoria 132 66.3
NSW & QLD 67 33.7
Overall 199 100.0
Table 2: Composition of respondents by phase
Total
N %
Phase 1 46 23.1
Phase 2 153 76.9
Overall 199 100.0

Saving behaviour of post Saver Plus participants
8
We have compared the socio-demographic characteristics of the participants in the follow-up research to those participants who did not respond to the latest survey. We found that respondents to the survey had the following differences relative to the participants in the initial evaluation research:
1. There was a significantly higher proportion of couples with children among the respondents, a finding consistent with that obtained by Russell, Mihajilo and Brooks (2007) in the 2007 survey.
2. There were statistically significant differences in income, age and number of dependent children. Specifically our respondents were older with lower income and a smaller number of dependent children, a finding again consistent with that obtained by Russell, Mihajilo and Brooks (2007) in the 2007 study.
3. The respondents to the 2008 survey also displayed a higher degree of interaction with financial institutions and products prior to their participation in Saver Plus. They also had a higher level of pre-program savings and are more likely to be holders of a range of financial products including shares, term deposits, house and contents insurance, vehicle insurance and private health insurance. This again was a similar finding to that obtained by Russell, Mihajilo and Brooks (2007) in the 2007 study.
4. The respondents to the 2008 survey were more likely to have saved more than their original goal while participating in the Saver Plus program, and less likely to have not met their goal while participating in the Saver Plus program.
3.0 Characteristics of Responding Participants

Saving behaviour of post Saver Plus participants
9
4.1 Savings Levels and PatternsThe majority of respondents indicated they had continued saving in the last 12 months. Figure 1 shows the savings behaviour of the overall sample of respondents in the last 12 months in terms of what had happened to their monthly savings deposits. Overall, the majority of respondents reported their monthly savings deposits had either increased (36%) or stayed the same (34%). These percentages were only slightly down from the 2007 study (for details see Russell, Mihajilo and Brooks (2007)) which found 38% of respondents had increased their monthly savings deposits and 37% maintained their savings deposit levels).
The behaviour of respondents relating to their monthly savings deposits by location is detailed in Table 3, while the results by phase are reported in Table 4. Overall, the Campbelltown location had the highest proportion (79.4%) of participants who had monthly savings deposits had either increased (41.2%) or been maintained (38.2%).
More than 40% of respondents from two locations (Frankston Continuing: 42.2%, Campbelltown: 41.2%) reported increases in their monthly savings deposits. The Frankston location (not including the continuing group) had the lowest proportion (15.4%) of respondents who had increased their monthly savings deposits in the last 12 months, and correspondingly also had the highest proportion (34.6%) of respondents who reported a decrease in their monthly savings deposit levels in the last 12 months. However, Brisbane was the location where the highest proportion (21.2%) of participants reported not having saved in the last 12 months. However the differences in saving behaviour across locations were not statistically significantly different from each other.
Both phases had approximately 70% of participants who had either increased or maintained their monthly savings deposits, and these differences were not statistically significantly different across the phases of participation. This finding differed from that of the 2007 study (Russell, Mihajilo and Brooks, 2007) in which a greater proportion of the Phase One respondents had increased or maintained their savings levels.
4.0 Post-Saver Plus Saving Behaviour
Table 3: Changes in monthly savings deposits by location
Monthly savings deposits in the last 12 months have:
c2(12)=16.70 p>0.05 Increased Stayed the same Decreased Not saved
Shepparton 38.3% 36.7% 13.3% 11.7%
Frankston 15.4% 15.4% 34.6% 7.7%
Frankston Continuing 42.2% 26.7% 24.4% 6.7%
Campbelltown 41.2% 38.2% 14.7% 5.9%
Brisbane 36.4% 27.3% 15.1% 21.2%
Victoria 35.6% 34.1% 21.2% 9.1%
NSW & QLD 38.8% 32.8% 14.9% 13.5%
Overall 36.7% 33.7% 19.1% 10.5%
Figure 1: Monthly savings deposits in the last 12 months
Increased36%
Stayed the same34%
Decreased19%
Not saved11%

Saving behaviour of post Saver Plus participants
10
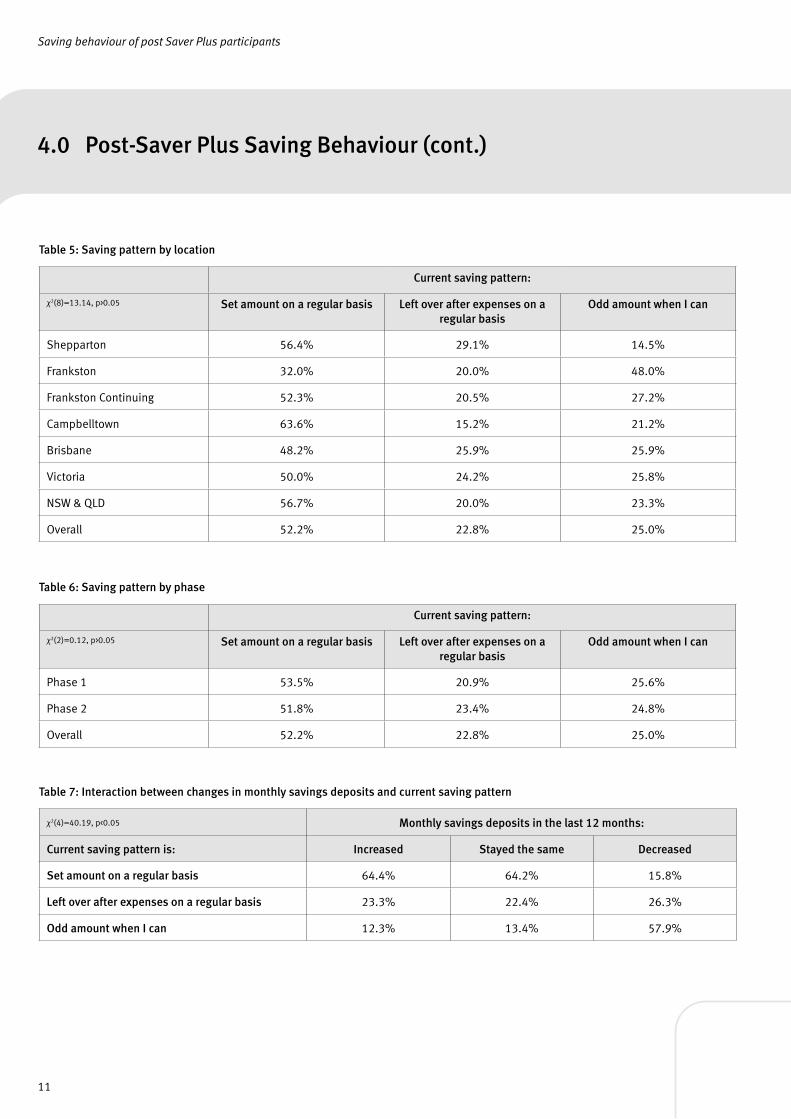
Respondents were also asked about their current saving patterns. Figure 2 shows the current saving patterns of the overall sample. The majority of respondents (52%) reported a strategy of saving a set amount on a regular basis. This percentage was noticeably higher than the percentage of all households in 2003 who reported a savings attitude of ‘save regularly by putting money aside’ in the analysis of the HILDA survey by Headey, Warren and Harding (2006)5.
The savings behaviour of respondents by location is detailed in Table 5, while the results by phase are reported in Table 6. The location with the highest proportion (63.6%) of respondents who reported saving a set amount on a regular basis was Campbelltown, while the location with the lowest proportion (32.0%) of respondents who reported saving a set amount on a regular basis was Frankston (excluding the continuing group). However the differences in saving patterns across locations were not statistically significant. More than 50% of responding participants from Phases One and Two reported saving a set amount on a regular basis as their current saving pattern.
In the 2006 and 2007 studies (Russell, Brooks and Nair, 2006; Russell, Mihajilo and Brooks, 2007), there was a statistically significant relationship between saving behaviour and changes in monthly savings deposits. More specifically, previous studies found those individuals who adopted the strategy of saving a set amount on a regular basis were more likely to have increased or maintained their monthly savings deposits.
We found a similar result in the 2008 analysis. The respondents who increased or maintained their monthly savings deposits were much more likely to have had a current saving pattern of saving a set amount on a regular basis. The results of this analysis are detailed in Table 7.
Table 4: Changes in monthly savings deposits by phase
Monthly savings deposits in the last 12 months have:
c2(3)=0.48, p>0.05 Increased Stayed the same Decreased Not saved
Phase One 32.6% 37.0% 19.6% 10.8%
Phase Two 37.9% 32.6% 19.0% 10.5%
Overall 36.7% 33.7% 19.1% 10.5%
Figure 2: Current saving patterns
Set amount on a regular basis
52%
Left over amount after expenses
23%
Odd amount when can
25%
5 The analysis in Headey, Warren and Harding (2006) asks about attitudes to saving. If we add together their three savings categories of ‘save regularly by putting money aside’, ‘spend regular income, save other income’ and ‘save whatever is left over – no plan’ we find that 31.9% of males and 33.8% of females who choose one of these savings categories choose the save regularly by putting money aside’ option. However the differences in results may be due to the different emphasis in the questions, and the different time periods being studied.
4.0 Post-Saver Plus Saving Behaviour (cont.)
Saving behaviour of post Saver Plus participants
11
Table 6: Saving pattern by phase
Current saving pattern:
c2(2)=0.12, p>0.05 Set amount on a regular basis Left over after expenses on a regular basis
Odd amount when I can
Phase 1 53.5% 20.9% 25.6%
Phase 2 51.8% 23.4% 24.8%
Overall 52.2% 22.8% 25.0%
Table 7: Interaction between changes in monthly savings deposits and current saving pattern
c2(4)=40.19, p<0.05 Monthly savings deposits in the last 12 months:
Current saving pattern is: Increased Stayed the same Decreased
Set amount on a regular basis 64.4% 64.2% 15.8%
Left over after expenses on a regular basis 23.3% 22.4% 26.3%
Odd amount when I can 12.3% 13.4% 57.9%
Table 5: Saving pattern by location
Current saving pattern:
c2(8)=13.14, p>0.05 Set amount on a regular basis Left over after expenses on a regular basis
Odd amount when I can
Shepparton 56.4% 29.1% 14.5%
Frankston 32.0% 20.0% 48.0%
Frankston Continuing 52.3% 20.5% 27.2%
Campbelltown 63.6% 15.2% 21.2%
Brisbane 48.2% 25.9% 25.9%
Victoria 50.0% 24.2% 25.8%
NSW & QLD 56.7% 20.0% 23.3%
Overall 52.2% 22.8% 25.0%
4.0 Post-Saver Plus Saving Behaviour (cont.)
Saving behaviour of post Saver Plus participants
12
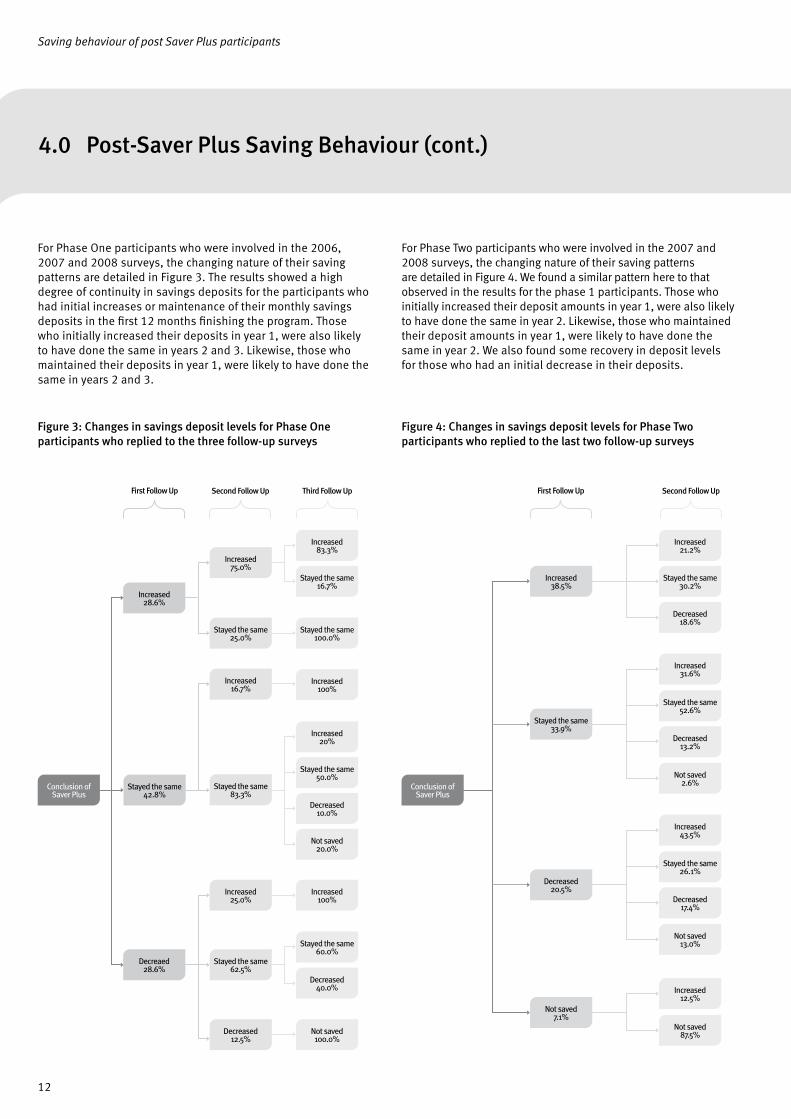
For Phase One participants who were involved in the 2006, 2007 and 2008 surveys, the changing nature of their saving patterns are detailed in Figure 3. The results showed a high degree of continuity in savings deposits for the participants who had initial increases or maintenance of their monthly savings deposits in the first 12 months finishing the program. Those who initially increased their deposits in year 1, were also likely to have done the same in years 2 and 3. Likewise, those who maintained their deposits in year 1, were likely to have done the same in years 2 and 3.
For Phase Two participants who were involved in the 2007 and 2008 surveys, the changing nature of their saving patterns are detailed in Figure 4. We found a similar pattern here to that observed in the results for the phase 1 participants. Those who initially increased their deposit amounts in year 1, were also likely to have done the same in year 2. Likewise, those who maintained their deposit amounts in year 1, were likely to have done the same in year 2. We also found some recovery in deposit levels for those who had an initial decrease in their deposits.
Figure 3: Changes in savings deposit levels for Phase One participants who replied to the three follow-up surveys
Figure 4: Changes in savings deposit levels for Phase Two participants who replied to the last two follow-up surveys
First Follow Up Second Follow Up Third Follow Up
Increased 83.3%
Stayed the same 16.7%
Stayed the same 100.0%
Increased 100%
Increased 20%
Stayed the same 50.0%
Decreased 10.0%
Not saved 20.0%
Increased 100%
Stayed the same 60.0%
Decreased 40.0%
Not saved 100.0%
Conclusion of Saver Plus
Stayed the same 42.8%
Stayed the same 83.3%
Increased 16.7%
Stayed the same 25.0%
Increased 75.0%
Increased 25.0%
Stayed the same 62.5%
Decreased 12.5%
Increased 28.6%
Decreaed 28.6%
Increased 21.2%
Stayed the same 30.2%
Decreased 18.6%
Increased 31.6%
Stayed the same 52.6%
Decreased 13.2%
Not saved 2.6%
Increased 43.5%
Stayed the same 26.1%
Decreased 17.4%
Not saved 13.0%
Increased 12.5%
Not saved 87.5%
Conclusion of Saver Plus
Not saved 7.1%
Decreased 20.5%
Stayed the same 33.9%
Increased 38.5%
First Follow Up Second Follow Up
4.0 Post-Saver Plus Saving Behaviour (cont.)

Saving behaviour of post Saver Plus participants
13
We also explored whether there were any statistically significant differences in savings deposit levels and patterns across the socio-demographic characteristics of respondents, and their behaviour during the Saver Plus program. In the 2007 study, Russell, Mihajilo and Brooks (2007) found no statistically significant differences between these characteristics and behaviour and the savings levels and patterns. However, those who had found it easy to meet their Saver Plus savings goal were more likely to have increased or maintained their monthly savings deposit levels and were more likely to be saving a set amount on a regular basis.
We found a similar result in the 2008 survey, in that those participants who found it easy to make their monthly Saver Plus deposits were more likely to have increased or maintained their monthly savings deposits, and were more likely to save a set amount on a regular basis. These results are detailed in Table 86. In addition we also found that those who did not have house, contents or vehicle insurance while participating in Saver Plus were more likely to have not saved in the 2008 study. These results were detailed in Table 9.
Table 8: Interaction between ease of making monthly Saver Plus savings deposits and follow-up savings deposit levels and patterns
How easy was it for you to find the money to put in to your Saver Plus account each month
Monthly savings deposits c2(3)=9.79, p<0.05
Usually fairly easy Sometimes easy, sometimes hard
Increased 69.2% 30.8%
Stayed the same 67.9% 32.1%
Decreased 48.3% 51.7%
Not saved 33.3% 66.7%
Current saving patterns c2(2)=15.80, p<0.05
Usually fairly easy Sometimes easy, sometimes hard
Set amount regular 75.6% 24.4%
Left over regular 59.4% 40.6%
Odd amount when can 39.0% 61.0%
Table 9: Interaction between insurance products and follow-up savings deposit levels
Monthly savings deposits
c2(3)=9.98, p<0.05
House and contents insurance during program
Yes No
Increased 87.8% 12.2%
Stayed the same 93.3% 6.7%
Decreased 95.2% 4.8%
Not saved 64.3% 35.7%
Monthly savings deposits
c2(3)=9.24, p<0.05
Vehicle insurance during program
Yes No
Increased 91.8% 8.2%
Stayed the same 100.0% 0.0%
Decreased 90.5% 9.5%
Not saved 76.9% 23.1%
6 The initial survey and last round follow-up analysis also included the ‘usually fairly hard’ category in the analysis of the question. The number of respondents from this category in this round of the follow up survey is too low for it to be included in the formal analysis.
4.0 Post-Saver Plus Saving Behaviour (cont.)
Saving behaviour of post Saver Plus participants
14
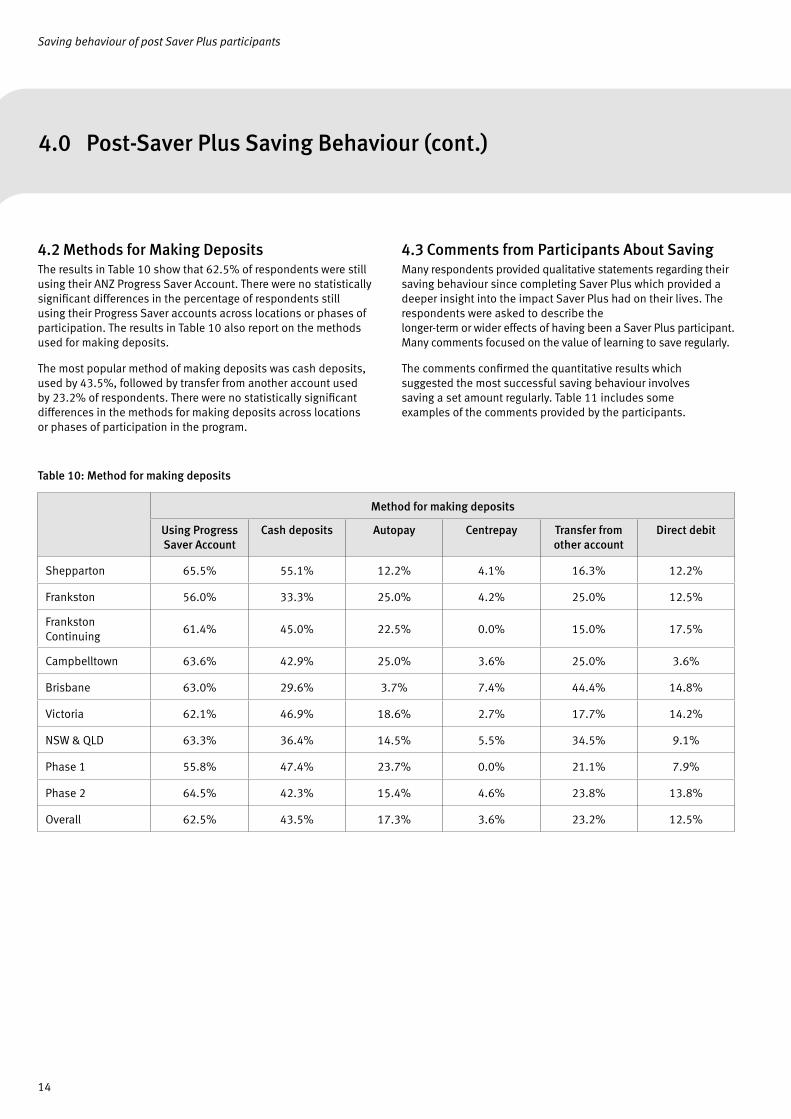
4.2 Methods for Making DepositsThe results in Table 10 show that 62.5% of respondents were still using their ANZ Progress Saver Account. There were no statistically significant differences in the percentage of respondents still using their Progress Saver accounts across locations or phases of participation. The results in Table 10 also report on the methods used for making deposits.
The most popular method of making deposits was cash deposits, used by 43.5%, followed by transfer from another account used by 23.2% of respondents. There were no statistically significant differences in the methods for making deposits across locations or phases of participation in the program.
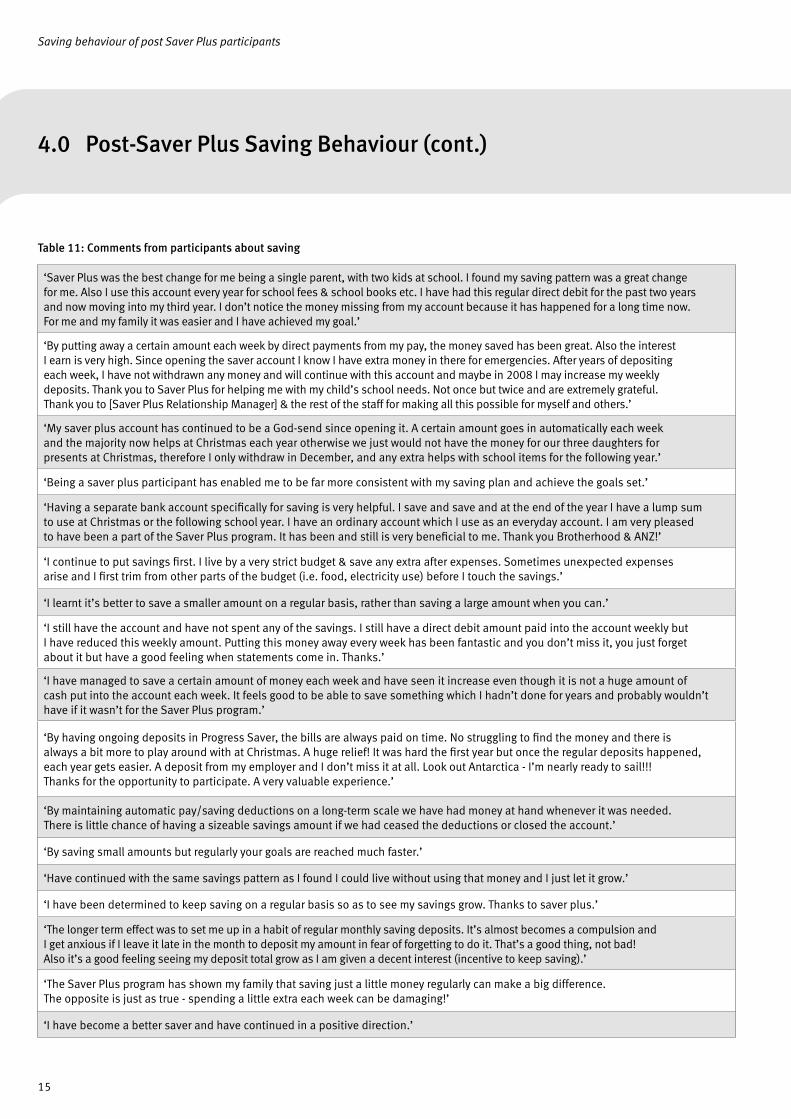
4.3 Comments from Participants About SavingMany respondents provided qualitative statements regarding their saving behaviour since completing Saver Plus which provided a deeper insight into the impact Saver Plus had on their lives. The respondents were asked to describe the longer-term or wider effects of having been a Saver Plus participant. Many comments focused on the value of learning to save regularly.
The comments confirmed the quantitative results which suggested the most successful saving behaviour involves saving a set amount regularly. Table 11 includes some examples of the comments provided by the participants.
Table 10: Method for making deposits
Method for making deposits
Using Progress Saver Account
Cash deposits Autopay Centrepay Transfer from other account
Direct debit
Shepparton 65.5% 55.1% 12.2% 4.1% 16.3% 12.2%
Frankston 56.0% 33.3% 25.0% 4.2% 25.0% 12.5%
Frankston Continuing
61.4% 45.0% 22.5% 0.0% 15.0% 17.5%
Campbelltown 63.6% 42.9% 25.0% 3.6% 25.0% 3.6%
Brisbane 63.0% 29.6% 3.7% 7.4% 44.4% 14.8%
Victoria 62.1% 46.9% 18.6% 2.7% 17.7% 14.2%
NSW & QLD 63.3% 36.4% 14.5% 5.5% 34.5% 9.1%
Phase 1 55.8% 47.4% 23.7% 0.0% 21.1% 7.9%
Phase 2 64.5% 42.3% 15.4% 4.6% 23.8% 13.8%
Overall 62.5% 43.5% 17.3% 3.6% 23.2% 12.5%
4.0 Post-Saver Plus Saving Behaviour (cont.)
Saving behaviour of post Saver Plus participants
15
Table 11: Comments from participants about saving
‘Saver Plus was the best change for me being a single parent, with two kids at school. I found my saving pattern was a great change for me. Also I use this account every year for school fees & school books etc. I have had this regular direct debit for the past two years and now moving into my third year. I don’t notice the money missing from my account because it has happened for a long time now. For me and my family it was easier and I have achieved my goal.’
‘By putting away a certain amount each week by direct payments from my pay, the money saved has been great. Also the interest I earn is very high. Since opening the saver account I know I have extra money in there for emergencies. After years of depositing each week, I have not withdrawn any money and will continue with this account and maybe in 2008 I may increase my weekly deposits. Thank you to Saver Plus for helping me with my child’s school needs. Not once but twice and are extremely grateful. Thank you to [Saver Plus Relationship Manager] & the rest of the staff for making all this possible for myself and others.’
‘My saver plus account has continued to be a God-send since opening it. A certain amount goes in automatically each week and the majority now helps at Christmas each year otherwise we just would not have the money for our three daughters for presents at Christmas, therefore I only withdraw in December, and any extra helps with school items for the following year.’
‘Being a saver plus participant has enabled me to be far more consistent with my saving plan and achieve the goals set.’
‘Having a separate bank account specifically for saving is very helpful. I save and save and at the end of the year I have a lump sum to use at Christmas or the following school year. I have an ordinary account which I use as an everyday account. I am very pleased to have been a part of the Saver Plus program. It has been and still is very beneficial to me. Thank you Brotherhood & ANZ!’
‘I continue to put savings first. I live by a very strict budget & save any extra after expenses. Sometimes unexpected expenses arise and I first trim from other parts of the budget (i.e. food, electricity use) before I touch the savings.’
‘I learnt it’s better to save a smaller amount on a regular basis, rather than saving a large amount when you can.’
‘I still have the account and have not spent any of the savings. I still have a direct debit amount paid into the account weekly but I have reduced this weekly amount. Putting this money away every week has been fantastic and you don’t miss it, you just forget about it but have a good feeling when statements come in. Thanks.’
‘I have managed to save a certain amount of money each week and have seen it increase even though it is not a huge amount of cash put into the account each week. It feels good to be able to save something which I hadn’t done for years and probably wouldn’t have if it wasn’t for the Saver Plus program.’
‘By having ongoing deposits in Progress Saver, the bills are always paid on time. No struggling to find the money and there is always a bit more to play around with at Christmas. A huge relief! It was hard the first year but once the regular deposits happened, each year gets easier. A deposit from my employer and I don’t miss it at all. Look out Antarctica - I’m nearly ready to sail!!! Thanks for the opportunity to participate. A very valuable experience.’
‘By maintaining automatic pay/saving deductions on a long-term scale we have had money at hand whenever it was needed. There is little chance of having a sizeable savings amount if we had ceased the deductions or closed the account.’
‘By saving small amounts but regularly your goals are reached much faster.’
‘Have continued with the same savings pattern as I found I could live without using that money and I just let it grow.’
‘I have been determined to keep saving on a regular basis so as to see my savings grow. Thanks to saver plus.’
‘The longer term effect was to set me up in a habit of regular monthly saving deposits. It’s almost becomes a compulsion and I get anxious if I leave it late in the month to deposit my amount in fear of forgetting to do it. That’s a good thing, not bad! Also it’s a good feeling seeing my deposit total grow as I am given a decent interest (incentive to keep saving).’
‘The Saver Plus program has shown my family that saving just a little money regularly can make a big difference. The opposite is just as true - spending a little extra each week can be damaging!’
‘I have become a better saver and have continued in a positive direction.’
4.0 Post-Saver Plus Saving Behaviour (cont.)

Saving behaviour of post Saver Plus participants
16
4.4 Current Reasons for SavingThe respondents to the follow-up survey were also asked about their current reason for saving. These results are detailed in Table 12. Consistent with the findings in the 2007 study reported by Russell, Mihajilo and Brooks (2007) we found the most common reason for saving was for the education of children and grandchildren.
Saving for education is a priority for parents globally, and in Australia this was been found to be one of the primary motivations for household savings (Beal, 2000; Harris, Loundes and Webster; 2002). The second most common goal was planning for the future/ to get ahead, followed by travel/holidays and emergencies/unemployment or illness. The importance of saving for emergencies was consistent with the precautionary savings motive found in the broader Australian studies of Beal (2000) and Harris, Loundes and Webster (2002).
Table 12: Current reasons for saving
Reason for saving %
Education for children or grandchildren 52.3
For the future/to get ahead 36.9
Travel/holidays 34.9
Emergencies/unemployment or illness 31.8
Home improvements/extensions/repairs 19.5
Pay off mortgage on home 19.0
Pay off other debts (including credit cards) 16.4
Purchase of appliances, cars 15.4
Medical/dental 14.9
Help children or other relatives 13.3
Retirement/old age 11.8
Education for self or spouse 6.7
No particular reason 6.7
Pay for weddings or other ceremonies 5.6
To buy a home 4.6
To buy assets such as shares or managed funds 4.1
Investing in own business 2.6
4.0 Post-Saver Plus Saving Behaviour (cont.)

Saving behaviour of post Saver Plus participants
17
In terms of the saving for education of children and grandchildren we found a statistically significant difference7 across the locations in the proportions of respondents reporting this as a motivation for saving: Shepparton (68.9%), Frankston (65.4%), Frankston Continuing (48.8%), Campbelltown (35.3%) and Brisbane (34.4%).
The concept of having a savings goal was an important factor in the past participants continued saving behaviour. Many respondents (as seen in Table 12) were still saving for their child’s education but they also reported having other goals such as holidays or home improvements that motivated them to save. Many participants were keen to establish ‘rainy day’ savings (or ‘dry days’ as one participant suffering from the drought called it) to use as a buffer in the event of loss of income or unexpected expenses.
Table 13: Comments by participants about goals
‘I feel I have a safety net by having money in the bank I could use if I really had to. It feels good to set goals and fulfil them because there is savings there to do just that.’
‘I now always have some savings for a “rainy day”, or should I say “dry days”! I am also thinking about investing in more shares or managed investment. Thank you!’
‘We have been able to continue saving $50 per fortnight which gives us plenty for our daughter’s education expenses with some left over for the following year. This year we have $1000 to go towards next year 2009 when she starts VCE. Without Saver Plus, we would never have been in this position. ‘God bless saver plus program’.’
‘The first year after completing the course the extra money helped with the children’s extra curricular activities. The second year after setting a similar goal I was able to take the family on a ski-trip. Now when Christmas is over, I plan to start adding more to my balance to enable us to have that extra money to fall back on. I highly recommend Saver Plus to anyone eligible.’
‘I continue to have a set amount of money go directly into the progress saver account to save for goals I set to improve the house or make repairs which I was not doing before.’
‘I have continued to save small amounts and planning our first holiday in 3 years to QLD next year.’
‘I use Saver Plus to payout money for extra expenses. We have recently built a new home and Saver Plus helped us with saving for a deposit. Now it’s used for insurance and education.’
‘Just letting the automatic payments build up, I have requested not to get annual statements so I can’t be tempted when I see the balance and it’s not attached to an ATM card. This ensures I forget about it until Christmas when I have many bills fall due like insurances and car registration and the following university fees.’
7 c2(4)=16.76, p<0.05)
4.0 Post-Saver Plus Saving Behaviour (cont.)
Saving behaviour of post Saver Plus participants
18
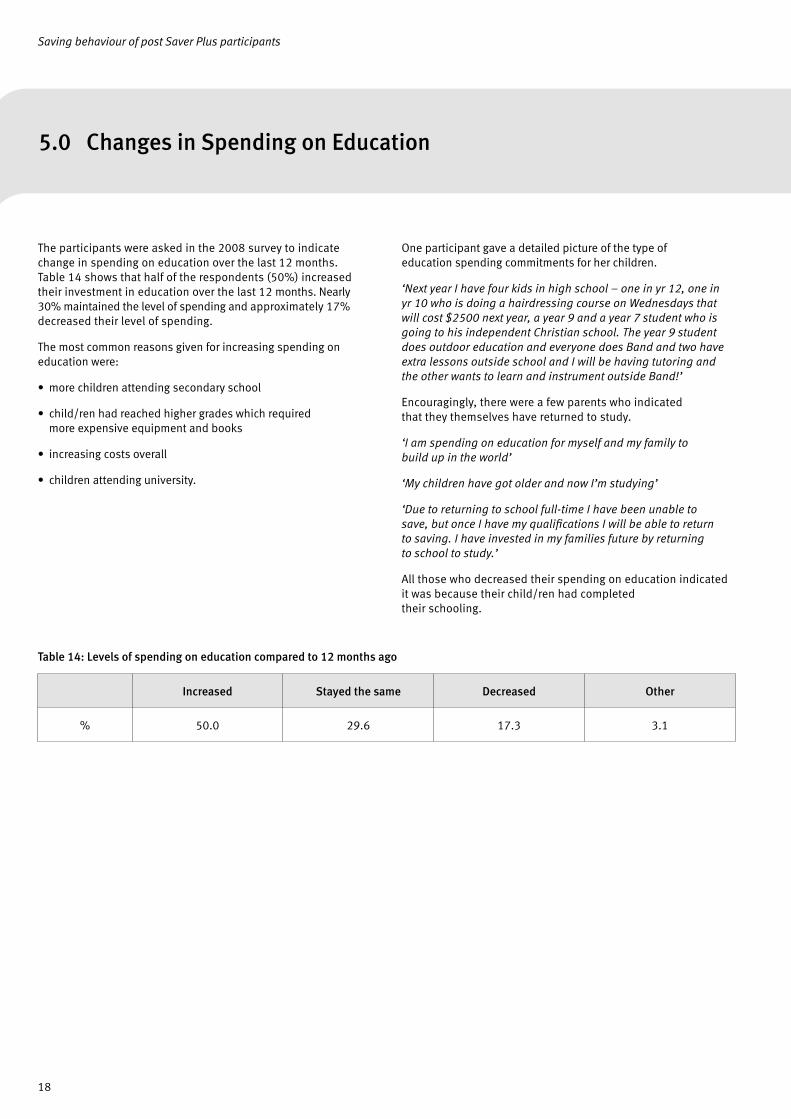
The participants were asked in the 2008 survey to indicate change in spending on education over the last 12 months. Table 14 shows that half of the respondents (50%) increased their investment in education over the last 12 months. Nearly 30% maintained the level of spending and approximately 17% decreased their level of spending.
The most common reasons given for increasing spending on education were:
• more children attending secondary school
• child/ren had reached higher grades which required more expensive equipment and books
• increasing costs overall
• children attending university.
One participant gave a detailed picture of the type of education spending commitments for her children.
‘Next year I have four kids in high school – one in yr 12, one in yr 10 who is doing a hairdressing course on Wednesdays that will cost $2500 next year, a year 9 and a year 7 student who is going to his independent Christian school. The year 9 student does outdoor education and everyone does Band and two have extra lessons outside school and I will be having tutoring and the other wants to learn and instrument outside Band!’
Encouragingly, there were a few parents who indicated that they themselves have returned to study.
‘I am spending on education for myself and my family to build up in the world’
‘My children have got older and now I’m studying’
‘Due to returning to school full-time I have been unable to save, but once I have my qualifications I will be able to return to saving. I have invested in my families future by returning to school to study.’
All those who decreased their spending on education indicated it was because their child/ren had completed their schooling.
Table 14: Levels of spending on education compared to 12 months ago
Increased Stayed the same Decreased Other
% 50.0 29.6 17.3 3.1
5.0 Changes in Spending on Education

Saving behaviour of post Saver Plus participants
19
The respondents to the 2008 survey were asked to indicate what time period was most important to them in planning their savings and spending. These results are summarised in Table 15 and Figure 5. Consistent with findings in the 2007 study, we found that the next year was the most popular planning horizon, followed by the next few months. These findings contrast those reported in the Headey, Warren and Harding (2006) analysis of the 2003 HILDA data where they found a higher proportion of respondents reported the next week (Males: 24.0%, Females: 23.7%) as the most important planning horizon and a lower proportion of respondents reported the next year (Males: 16.2%, Females: 18.3%) as the most important planning horizon8.
6.0 Managing Money and Planning Ahead
Table 15: Planning horizon for saving and spending
Time horizon for saving and spending %
Next week 10.8
Next few months 22.1
Next year 38.5
Next 2-4 years 12.3
Next 5-10 years 10.3
More than 10 years 6.2
Next few months
22%
Next year39%
Next 2-4 years12%
Next 5-10 years10%
More than 10 years
6%Next week
11%
Figure 5: Planning horizon: Saving and spending
8 The differences in results may be due in part to the different emphasis in questions, our follow up results also address the time horizon for spending, and the different time periods, 2003 vs. 2007.

Saving behaviour of post Saver Plus participants
20
The experience of Saver Plus and the education program encouraged participants to have financial plans and manage their money over longer periods of time. Table 16 provides some examples indicative of participants incorporating more planning into their financial management behaviour.
6.0 Managing Money and Planning Ahead (cont.)
Table 16: Comments by participants about managing money and planning ahead
‘The Saver Plus program helped me look at how I spent money. It has made me look at long term goals we want for our family and shown me how to work towards that. I now work as much as possible to a budget and keeping an eye on our long term goals.’
‘I tried to stick to a budget this year so I could pay for my children’s subjects and book hire for 2008 in advance. I also paid for my child to go on a school camp up to Great Keppell (Rockhampton) which was expensive. I prepay all my household bills before Christmas, and also order Chrisco Hampers for 2007. And I also put my family members Christmas presents on a 6 months lay-by from Kmart and have paid this off during the year. So yes, Saver Plus gave me a lot of great ideas on how to be self-reliant so I can achieve a lot with our budget. I really can’t save but I use my money wisely. We think it is important to have our household bills paid before the due date. And school debts paid off before the end of the year.’
‘I will always be more ‘aware’ of my financial situation by what I’ve learned by participating in the program. I have strategies in place.’
‘I now keep an eye on budgeting and have worked out a future plan.’
‘More aware of money issues/budgeting and planning for harder times/loss of income.’
‘Saver Plus gave me a greater awareness of needs vs. wants, financial planning with goals and time frame, clearer financial priorities, - the discussions around personal money issues allowed me to see how minimal my consumer habits and aspirations are, but that they are inevitable expenses that I need to plan for - and need to increase my income & savings potential regardless.’
‘I budget better and plan ahead. Having a set amount taken from my salary every week means I don’t have to think about saving - and I don’t miss it.’
‘Has made it possible to be 12 months ahead in saving for children’s education costs. Don’t have to worry about where the money to pay fees, etc is coming from. Current level of savings per fortnight covers this. Don’t miss the payment amount. Thanks Saver Plus.’
‘I have a constant consciousness of spending. Budgets and forward planning of financial requirements are a lifestyle - as are shopping lists. We still get surprises e.g. dentist bills, excursion fees, new shoes etc, but seem to manage with payment plans and flexible money assignment.’
‘It made me see that a small amount put away each week can reduce financial worries at Christmas time (which is when school fees are due). I intend to double my savings next year to pay for Christmas presents as well which will be a big help because I do not get paid over the school holiday period.’
‘It has made me realise with a little planning anything is possible.’
‘Being involved in the program gave me specific goals and targets, workable strategies and ideas which have been easy to implement and satisfying to continue. Saver Plus made saving “real” and possible. Once you know you can do it and feel the power of it - you can’t give it up!’
Saving behaviour of post Saver Plus participants
21
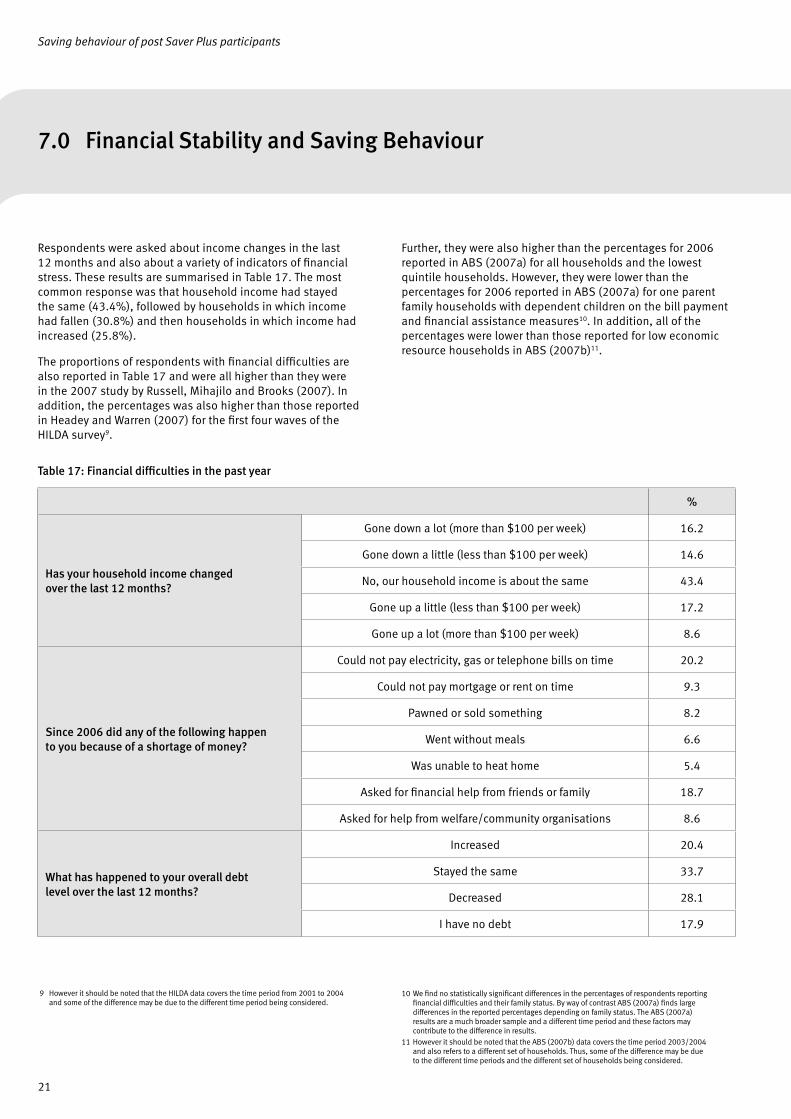
Respondents were asked about income changes in the last 12 months and also about a variety of indicators of financial stress. These results are summarised in Table 17. The most common response was that household income had stayed the same (43.4%), followed by households in which income had fallen (30.8%) and then households in which income had increased (25.8%).
The proportions of respondents with financial difficulties are also reported in Table 17 and were all higher than they were in the 2007 study by Russell, Mihajilo and Brooks (2007). In addition, the percentages was also higher than those reported in Headey and Warren (2007) for the first four waves of the HILDA survey9.
Further, they were also higher than the percentages for 2006 reported in ABS (2007a) for all households and the lowest quintile households. However, they were lower than the percentages for 2006 reported in ABS (2007a) for one parent family households with dependent children on the bill payment and financial assistance measures10. In addition, all of the percentages were lower than those reported for low economic resource households in ABS (2007b)11.
7.0 Financial Stability and Saving Behaviour
9 However it should be noted that the HILDA data covers the time period from 2001 to 2004 and some of the difference may be due to the different time period being considered.
Table 17: Financial difficulties in the past year
%
Has your household income changed over the last 12 months?
Gone down a lot (more than $100 per week) 16.2
Gone down a little (less than $100 per week) 14.6
No, our household income is about the same 43.4
Gone up a little (less than $100 per week) 17.2
Gone up a lot (more than $100 per week) 8.6
Since 2006 did any of the following happen to you because of a shortage of money?
Could not pay electricity, gas or telephone bills on time 20.2
Could not pay mortgage or rent on time 9.3
Pawned or sold something 8.2
Went without meals 6.6
Was unable to heat home 5.4
Asked for financial help from friends or family 18.7
Asked for help from welfare/community organisations 8.6
What has happened to your overall debt level over the last 12 months?
Increased 20.4
Stayed the same 33.7
Decreased 28.1
I have no debt 17.9
10 We find no statistically significant differences in the percentages of respondents reporting financial difficulties and their family status. By way of contrast ABS (2007a) finds large differences in the reported percentages depending on family status. The ABS (2007a) results are a much broader sample and a different time period and these factors may contribute to the difference in results.
11 However it should be noted that the ABS (2007b) data covers the time period 2003/2004 and also refers to a different set of households. Thus, some of the difference may be due to the different time periods and the different set of households being considered.

Saving behaviour of post Saver Plus participants
22
In terms of debt levels, the results reported in Table 17 and Figure 6 are similar to those reported in the 2007 study. The most common response was again that debt levels had stayed the same (33.7%). There was a slight increase in the proportion of respondents who reported an increase in their debt levels across the two years (20% vs. 14%), and a corresponding slight decrease in the proportion of respondents who reported a decrease in their debt levels across the two years (28% vs. 34%).
Figure 6: Changes in overall debt in the last 12 months
7.0 Financial Stability and Saving Behaviour (cont.)
We explored whether there is a relationship between the financial difficulties, changes in income and changes in debt level. The results in Table 18 show the interaction between the financial difficulties questions and changes in income levels. With the exception of one question, the proportion of respondents who reported financial difficulties was higher for all other questions, and in four of these cases the results were statistically significant. Thus, as expected, we found that higher financial difficulties are found in households that reported a drop in income. However, in terms of changing debt levels there does not appear to be any statistically significant interaction with the financial difficulties questions. The only exception is the question on asking for financial help from family and friends where the percentage of respondents who have done this was higher for those whose debt had increased (30.6%) or stayed the same (26.2%) as compared to those whose debt had decreased (9.6%) or had no debt (8.6%)12.
There was an interaction between changing debt levels and changing incomes as shown in the results in Table 19. The results showed that over 30% of respondents who had a drop in income reported an increase in debt levels. In contrast over 30% of respondents who had an increase in income reported a decrease in their debt levels.
Table 18: Financial difficulties and income changes
Has your household income changed over the last 12 months*
Gone down a lot
Gone down a little
About the same
Gone up a little
Gone up a lot
Could not pay electricity, gas or telephone bills on time c2(4)=10.49, p<0.05
36.7% 31.0% 13.9% 12.1% 17.6%
Could not pay mortgage or rent on time c2(4)=11.52, p<0.05
25.9% 11.5% 6.2% 3.1% 5.9%
Pawned or sold something c2(4)=8.40, p>0.05
17.9% 7.4% 10.3% 0.0% 0.0%
Went without meals c2(4)=17.95, p<0.05
21.4% 0.0% 2.6% 3.0% 17.6%
Was unable to heat home c2(4)=5.53, p>0.05
10.7% 11.1% 3.8% 0.0% 5.9%
Asked for financial help from friends or family c2(4)=20.94, p<0.05
41.4% 34.6% 13.4% 6.1% 5.9%
Asked for help from welfare/community organisations c2(4)=12.26, p<0.05
24.1% 7.7% 7.5% 0.0% 5.9%
* In this question, the options for the answer choices are as follows: Gone down a lot (more than $100 per week), Gone down a little (less than $100 per week), No, our household income is about the same, Gone up a little (less than $100 per week) and Gone up a lot (more than $100 per week).
Stayed the same34%
Increased20%
I have no debt18%
Decreased28%
12 The resultant test statistic is a statistically significant c2(3)=10.64, p<0.05

Saving behaviour of post Saver Plus participants
23
We explored the relationship between changing income levels, financial difficulties and changing debt levels and the savings deposit levels and patterns.
The results for savings deposit levels are reported in Table 20, while saving patterns are reported in Table 21.
In considering savings deposit levels, in excess of 60% of those respondents who reported an income increase also reported an increase in their savings.
In contrast, the corresponding percentage of those participants who reported an income decrease of 25% or lower. While this result around the savings deposit levels was statistically significant, the results for saving patterns were not statistically significantly different across the changing income levels.
Table 19: Debt and income changes
c2(12)=23.88, p<0.05 Has your household income changed over the last 12 months*
What has happened to your overall debt level over the last 12 months
Gone down a lot
Gone down a little
About the same Gone up a little Gone up a lot
Increased 31.3% 31.0% 13.1% 20.6% 18.8%
Stayed the same 31.3% 27.6% 45.2% 20.6% 12.5%
Decreased 15.6% 34.5% 28.6% 32.4% 31.3%
I have no debt 21.8% 6.9% 13.1% 26.5% 37.5%
* In this question, the options for the answer choices are as follows: Gone down a lot (more than $100 per week), Gone down a little (less than $100 per week), No, our household income is about the same, Gone up a little (less than $100 per week) and Gone up a lot (more than $100 per week).
Table 20: Changing income levels and savings deposit levels
c2(12)=38.895, p<0.05 Has your household income changed over the last 12 months*
During the last 12 months, have your monthly savings deposits
Gone down a lot
Gone down a little
About the same Gone up a little Gone up a lot
Increased 25.0% 24.1% 27.9% 64.7% 64.7%
Stayed the Same 25.0% 31.0% 45.3% 23.5% 17.6%
Decreased 28.1% 34.5% 18.6% 8.8% 0.0%
Not Saved 21.9% 10.3% 8.1% 2.9% 17.6%
* In this question, the options for the answer choices are as follows: Gone down a lot (more than $100 per week), Gone down a little (less than $100 per week), No, our household income is about the same, Gone up a little (less than $100 per week) and Gone up a lot (more than $100 per week).
Table 21: Changing income levels and saving patterns
c2(8)=9.60, p>0.05 Has your household income changed over the last 12 months*
How would you describe your current saving pattern
Gone down a lot
Gone down a little
About the same Gone up a little Gone up a lot
Saving a set amount on a regular basis 44.4% 51.9% 51.9% 50.0% 68.8%
Saving what is left over after other expenses on a regular basis
11.1% 22.2% 27.8% 23.5% 18.8%
Saving the odd amount when I can 44.4% 25.9% 20.3% 26.5% 12.5%
* In this question, the options for the answer choices are as follows: Gone down a lot (more than $100 per week), Gone down a little (less than $100 per week), No, our household income is about the same, Gone up a little (less than $100 per week) and Gone up a lot (more than $100 per week).
7.0 Financial Stability and Saving Behaviour (cont.)

Saving behaviour of post Saver Plus participants
24
We explored the relationship between the financial difficulties questions and savings deposit levels and patterns. The results for savings deposit levels are reported in Table 22, while the results for saving patterns are reported in Table 23.
Consistent with expectations, a much smaller percentages of respondents reporting financial difficulties were found in the cases where respondents reported an increase in their savings deposit levels.
These results were statistically significant in most cases. In the case for financial difficulties, the results on saving patterns were consistent with the results on savings deposit levels. There were much higher levels of reported financial difficulties amongst the cases where respondents were only saving the odd amount when they can. We again found a number of cases with statistically significant results.
Table 22: Financial difficulties and savings deposit levels
During the last 12 months, have your monthly saving deposits
Increased Stayed the Same
Decreased Not Saved
Could not pay electricity, gas or telephone bills on time c2(3)=28.04, p<0.05
11.3% 11.1% 33.3% 57.1%
Could not pay mortgage or rent on time c2(3)=7.16, p>0.05
2.9% 11.1% 12.9% 21.1%
Pawned or sold something c2(3)=3.07, p>0.05
5.7% 6.5% 12.5% 15.8%
Went without meals c2(3)=11.54, p<0.05
1.4% 4.8% 12.5% 21.1%
Was unable to heat home c2(3)=13.32, p<0.05
0.0% 7.9% 3.1% 20.0%
Asked for financial help from friends or family c2(3)=18.06, p<0.05
10.1% 12.3% 35.3% 42.1%
Asked for help from welfare/community organisations c2(3)=18.59, p<0.05
2.9% 4.8% 15.2% 31.6%
Table 23: Financial difficulties and saving patterns
How would you describe your current saving pattern
Saving a set amount on a regular basis
Saving what is left over after other expenses on
a regular basis
Saving the odd amount when I can
Could not pay electricity, gas or telephone bills on time c2(2)=12.71, p<0.05
11.1% 10.3% 34.1%
Could not pay mortgage or rent on time c2(2)=2.66, p>0.05
7.8% 2.6% 12.5%
Pawned or sold something c2(2)=2.55, p>0.05
4.5% 7.7% 12.2%
Went without meals c2(2)=6.06, p<0.05
4.5% 0.0% 12.2%
Was unable to heat home c2(2)=2.63, p>0.05
4.4% 0.0% 7.1%
Asked for financial help from friends or family c2(2)=12.51, p<0.05
14.1% 5.1% 33.3%
Asked for help from welfare/community organisations c2(2)=15.20, p<0.05
3.3% 0.0% 19.0%
7.0 Financial Stability and Saving Behaviour (cont.)

Saving behaviour of post Saver Plus participants
25
We explored the relationship between changing debt levels and savings deposit levels and patterns. The results for savings deposit levels are reported in Table 24, and the results for saving patterns are reported in Table 25. In terms of savings deposit levels, more than 50% of respondents who reported either decreased debt or no debt reported increased savings deposit levels.
The respondents who had no debt at all reported some savings in the last 12 months. Thus we found a statistically significant relationship between changing debt levels and changing savings deposit levels. The pattern was more complex in terms of the relationship between changing debt levels and saving patterns, although we found a lower proportion of respondents saving the odd amount when they could amongst the respondents who had decreases in their debt or have no debt. This result was statistically significant.
Table 24: Changing debt levels and savings deposit levels
c2(9)=33.29, p<0.05 What has happened to your debt level over the last 12 months
During the last 12 months, have your monthly savings deposits Increased Stayed the same
Decreased I have no debt
Increased 27.5% 19.7% 52.7% 54.3%
Stayed the Same 22.5% 43.9% 30.9% 34.3%
Decreased 32.5% 19.7% 12.7% 11.4%
Not Saved 17.5% 16.7% 3.6% 0.0%
Table 25: Changing debt levels and saving patterns
c2(6)=13.19, p<0.05 What has happened to your debt level over the last 12 months
How would you describe your current saving pattern Increased Stayed the same
Decreased I have no debt
Saving a set amount on a regular basis 61.8% 40.0% 62.3% 51.4%
Saving what is left over after other expenses on a regular basis 8.8% 25.0% 22.6% 31.4%
Saving the odd amount when I can 29.4% 35.0% 15.1% 17.1%
7.0 Financial Stability and Saving Behaviour (cont.)

Saving behaviour of post Saver Plus participants
26
There were also a number of comments (listed in Table 26), from respondents that indicated they were feeling the impact of rising prices and cost of living while others experienced reduced income. These factors affected their saving efforts.
We also explored the preferred source of financial advice in case of financial difficulties as reported by participants. These results are detailed in Table 27. Consistent with the results in the 2007 study we found family members (70.6%) as the most preferred source of advice, and then a clustering of lending organisation (27.5%), friend (27.5%), charity or welfare organisation (22.5%) and community organisation (21.7%).
Table 26: Comments from participants about the factors that have affected their saving efforts
‘Due to higher cost of living, sometimes I find it difficult to save the smaller amount or I have had to dip into my savings on a regular basis.’
‘Current money transferred over to Saver Plus has been less due to increase in payments for household and education. Still benefit from savings as an emergency in a separate account.’
‘I still save but cannot save the same amount or as often due to husband not working and sick kids.’
‘It was great going through the Saver Plus program, although we haven’t been able to put money into savings due to tighter budget. When there’s more income coming in, I’ll be able to get a savings plan going again.’
‘Saver Plus for me was about focusing on education costs and saving for that ahead of time. Unfortunately my income has decreased at the moment. In future when it changes I will continue to focus on education costs and saving for that.’
‘We have money saved in an interest saver account which will have to cover business and personal expenditures for the next 12 months. Due to the drought, we cannot save anymore at present as there is no income coming in.’
Table 27: Preferred sources of advice in case of financial difficulties
% Yes
Community organisation 21.7
Neighbour 3.5
Family member 70.6
Lending organisation e.g. bank 27.5
Friend 27.5
Charity or welfare organisation 22.5
Legal or health service 4.9
Work colleague 2.8
7.0 Financial Stability and Saving Behaviour (cont.)

Saving behaviour of post Saver Plus participants
27
8.0 Current Use of Financial Products
The respondents were also asked about their current levels of usage of financial products relative to 12 months ago. The detailed results for these responses are reported in Table 28. Broadly speaking, our results were similar to those obtained in the 2007 survey. The most commonly used product was an ordinary bank account where only 2.2% of respondents report no use of the product.
Similar to last year’s findings, the product for which the respondents reported the greatest increase in use was superannuation where 14.9% of respondents reported more use. Similar to last year’s findings we again found only a small number of respondents reporting more use of the more complex financial products. There were no statistically significant differences in the results across locations or phases of participation in the program.
Table 28: Financial products – current levels of use
Current level of use relative to previous 12 months
Not at all Use less About the same More use
An ordinary bank account 2.2% 3.2% 81.6% 13.0%
Superannuation 18.8% 6.6% 59.7% 14.9%
Managed investments 74.9% 4.0% 18.9% 2.3%
Shares 72.1% 2.9% 20.3% 4.7%
Term deposits 77.7% 4.0% 16.6% 1.7%
An investment property 93.0% 1.2% 5.2% 0.6%
A home mortgage 42.8% 0.6% 48.9% 7.8%
A personal loan 75.0% 1.7% 16.5% 6.8%
A lease or hire purchase agreement 87.3% 3.5% 6.4% 2.9%
House or contents insurance 12.2% 1.6% 81.0% 5.3%
Vehicle insurance 9.5% 2.1% 79.9% 8.5%
Private health insurance 70.9% 0.6% 24.0% 4.5%

Saving behaviour of post Saver Plus participants
28
9.0 General Impact of Saver Plus on Participant and Family
Each follow-up survey conducted attracts many comments from respondents about the broader impacts of experiencing Saver Plus on themselves and their family. The most commonly reported effects are increased levels of confidence, reduced levels of stress and sharing better financial management skills with their children. Table 29 lists some examples of the longer lasting personal impacts respondents received from participating in Saver Plus.
Table 29: Comments from participants about the longer term impacts from participating in Saver Plus
‘Saver Plus had a positive effect on me. As a participant I met wonderful people and learnt new ideas about budgeting & saving.’
‘Even though my savings has decreased it gave me the confidence to apply for a small loan, something I would not have done before. Once it is paid off I will then commence my saving routine once again.’
‘Saver Plus has given me increased motivation. Enabled me to improve computer skills & access to job search sites, which leads to increased employment.’
‘It gave me back my confidence with money matters. I started to see that I could “get ahead” even as a single parent on a low income and that I could pay off a house.’
‘Saver Plus has given me a sense of achievement, security, purpose - reward.’
‘With being in the program, the main point which stays in mind is if you need more income you either work more or lessen expenses. This has helped me to stay off cigarettes, alcohol and I have made a career move hopefully for the better!’

Saving behaviour of post Saver Plus participants
29
9.1 Reduced StressReduced stress was perhaps the most common flow-on effect participants noticed. Knowing that school costs were covered and having the pressure relieved at the beginning of the school year was an enormous bonus for the participants of Saver Plus. For past participants who were still saving each year for their child’s education they still enjoyed the feeling of relief when the school year began.
Also, stress was reduced because they were now able to provide extra-curricular activities for their children such as music and sport. Many low-income children miss out on these important development activities as the parents struggle to make ends meet and provide basic needs for their family. Following are examples of respondents’ comments.
Table 30: Comments from participants about reduced stress due to participating in Saver Plus
‘Great relief of pressure the first two years my daughter was in grade 7-8. We are continuing to save towards our other children’s costs.’
‘As a single parent Saver Plus helped take the pressure off me by taking care of two years of high school fees for my two eldest children. I was able to discuss the program with my children to increase their financial knowledge. Even though my income has reduced slightly and costs have increased I have helped my eldest buy a car and strategise for her university fees. I did not continue with the ANZ account as I have earned higher interest through online high interest accounts. Thank you for your assistance and the program, I have appreciated it greatly as have my children, and it has been a positive and worthwhile experience, definitely.’
‘Christmas, January and February used to be particularly stressful for me. I used to fret about the costs of school books and fees. Now, I am organised. It is still a worrying time (when I cannot buy Christmas gifts that I would like to) but I have no concern about having the money to buy second hand books in December, then fees in January - because the money is already there.’
‘Less stress, planning ahead and it only take a small amount of money to start saving. The question of “do I want or do I need” really works for me. I see a bright future for me.’
‘Being given the opportunity & incentive to start a regular savings plan has given our family peace of mind and the financial capacity to meet any unforseen money debts.’
‘Knowing that school costs for the year are covered make life less stressful.’
‘My mental health has improved due to less stress.’
‘Participating in the Saver Plus has helped to “ground” me. Previously handling money was not at all organised, now I feel like I have a lot more control. I am a lot less anxious!’
‘It has helped me manage things a bit better and I’m not in as much financial difficulty as I was before starting the Saver Plus program.’
‘It was a life changing experience by doing the saver plus program. I now do so many things that I learnt with this program. Like actually saving and I can now pay my bills on time. My family are happier. And we even saved and had a little holiday - FANTASTIC!’
‘Even though the money I have saved this year has been used - I replaced a car (accident) and took daughter to QLD for skating championships. I automatically put the money away each fortnight ($100 compared to $30 on Saver Plus) I now don’t have the strain of unexpected expenses as usually I have enough in reserve. I am very grateful for being a part of the program.’
‘I don’t worry about school costs as they are always there in the account to pay any costs.’
9.0 General Impact of Saver Plus on Participant and Family (cont.)
Saving behaviour of post Saver Plus participants
30
9.0 General Impact of Saver Plus on Participant and Family (cont.)
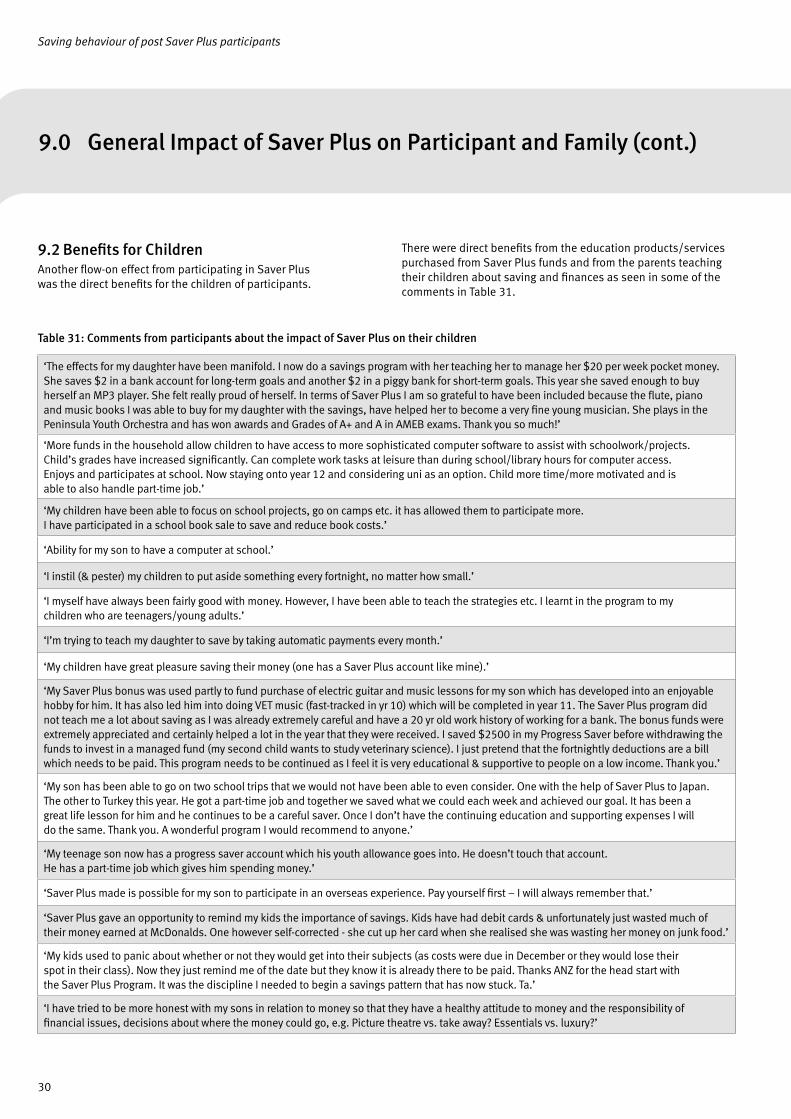
9.2 Benefits for ChildrenAnother flow-on effect from participating in Saver Plus was the direct benefits for the children of participants.
There were direct benefits from the education products/services purchased from Saver Plus funds and from the parents teaching their children about saving and finances as seen in some of the comments in Table 31.
Table 31: Comments from participants about the impact of Saver Plus on their children
‘The effects for my daughter have been manifold. I now do a savings program with her teaching her to manage her $20 per week pocket money. She saves $2 in a bank account for long-term goals and another $2 in a piggy bank for short-term goals. This year she saved enough to buy herself an MP3 player. She felt really proud of herself. In terms of Saver Plus I am so grateful to have been included because the flute, piano and music books I was able to buy for my daughter with the savings, have helped her to become a very fine young musician. She plays in the Peninsula Youth Orchestra and has won awards and Grades of A+ and A in AMEB exams. Thank you so much!’
‘More funds in the household allow children to have access to more sophisticated computer software to assist with schoolwork/projects. Child’s grades have increased significantly. Can complete work tasks at leisure than during school/library hours for computer access. Enjoys and participates at school. Now staying onto year 12 and considering uni as an option. Child more time/more motivated and is able to also handle part-time job.’
‘My children have been able to focus on school projects, go on camps etc. it has allowed them to participate more. I have participated in a school book sale to save and reduce book costs.’
‘Ability for my son to have a computer at school.’
‘I instil (& pester) my children to put aside something every fortnight, no matter how small.’
‘I myself have always been fairly good with money. However, I have been able to teach the strategies etc. I learnt in the program to my children who are teenagers/young adults.’
‘I’m trying to teach my daughter to save by taking automatic payments every month.’
‘My children have great pleasure saving their money (one has a Saver Plus account like mine).’
‘My Saver Plus bonus was used partly to fund purchase of electric guitar and music lessons for my son which has developed into an enjoyable hobby for him. It has also led him into doing VET music (fast-tracked in yr 10) which will be completed in year 11. The Saver Plus program did not teach me a lot about saving as I was already extremely careful and have a 20 yr old work history of working for a bank. The bonus funds were extremely appreciated and certainly helped a lot in the year that they were received. I saved $2500 in my Progress Saver before withdrawing the funds to invest in a managed fund (my second child wants to study veterinary science). I just pretend that the fortnightly deductions are a bill which needs to be paid. This program needs to be continued as I feel it is very educational & supportive to people on a low income. Thank you.’
‘My son has been able to go on two school trips that we would not have been able to even consider. One with the help of Saver Plus to Japan. The other to Turkey this year. He got a part-time job and together we saved what we could each week and achieved our goal. It has been a great life lesson for him and he continues to be a careful saver. Once I don’t have the continuing education and supporting expenses I will do the same. Thank you. A wonderful program I would recommend to anyone.’
‘My teenage son now has a progress saver account which his youth allowance goes into. He doesn’t touch that account. He has a part-time job which gives him spending money.’
‘Saver Plus made is possible for my son to participate in an overseas experience. Pay yourself first – I will always remember that.’
‘Saver Plus gave an opportunity to remind my kids the importance of savings. Kids have had debit cards & unfortunately just wasted much of their money earned at McDonalds. One however self-corrected - she cut up her card when she realised she was wasting her money on junk food.’
‘My kids used to panic about whether or not they would get into their subjects (as costs were due in December or they would lose their spot in their class). Now they just remind me of the date but they know it is already there to be paid. Thanks ANZ for the head start with the Saver Plus Program. It was the discipline I needed to begin a savings pattern that has now stuck. Ta.’
‘I have tried to be more honest with my sons in relation to money so that they have a healthy attitude to money and the responsibility of financial issues, decisions about where the money could go, e.g. Picture theatre vs. take away? Essentials vs. luxury?’
Saving behaviour of post Saver Plus participants
31
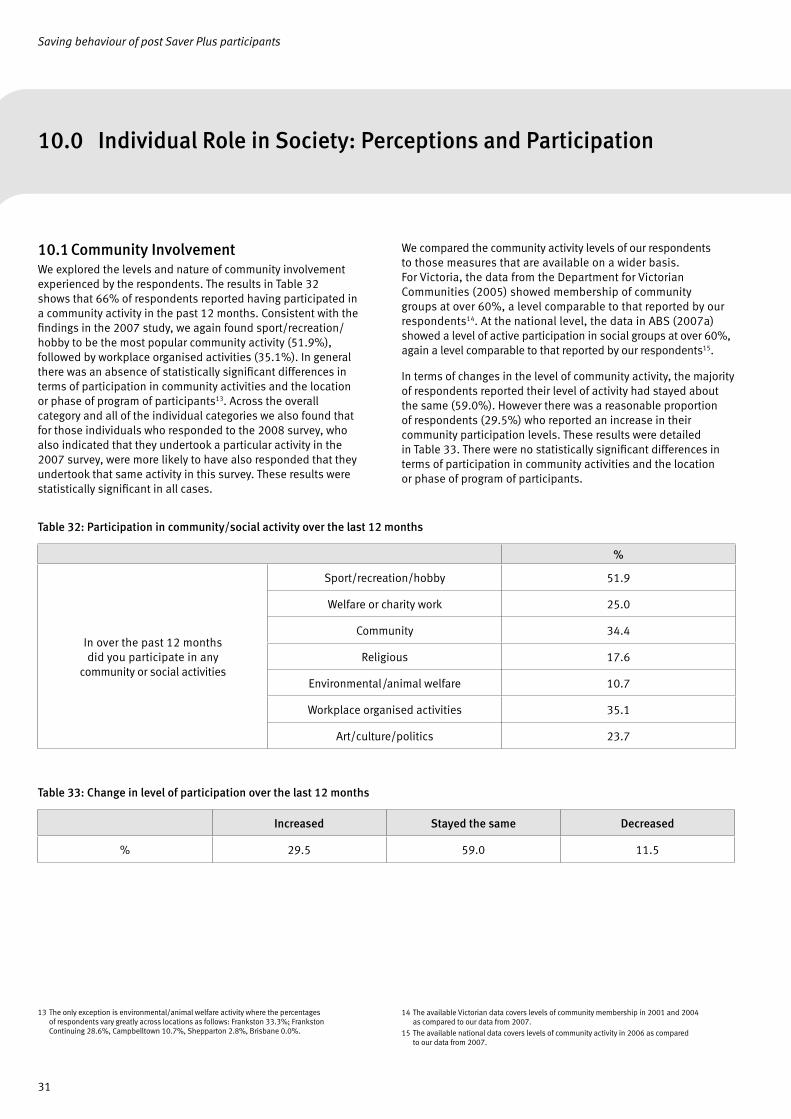
10.0 Individual Role in Society: Perceptions and Participation
10.1 Community InvolvementWe explored the levels and nature of community involvement experienced by the respondents. The results in Table 32 shows that 66% of respondents reported having participated in a community activity in the past 12 months. Consistent with the findings in the 2007 study, we again found sport/recreation/hobby to be the most popular community activity (51.9%), followed by workplace organised activities (35.1%). In general there was an absence of statistically significant differences in terms of participation in community activities and the location or phase of program of participants13. Across the overall category and all of the individual categories we also found that for those individuals who responded to the 2008 survey, who also indicated that they undertook a particular activity in the 2007 survey, were more likely to have also responded that they undertook that same activity in this survey. These results were statistically significant in all cases.
We compared the community activity levels of our respondents to those measures that are available on a wider basis. For Victoria, the data from the Department for Victorian Communities (2005) showed membership of community groups at over 60%, a level comparable to that reported by our respondents14. At the national level, the data in ABS (2007a) showed a level of active participation in social groups at over 60%, again a level comparable to that reported by our respondents15.
In terms of changes in the level of community activity, the majority of respondents reported their level of activity had stayed about the same (59.0%). However there was a reasonable proportion of respondents (29.5%) who reported an increase in their community participation levels. These results were detailed in Table 33. There were no statistically significant differences in terms of participation in community activities and the location or phase of program of participants.
Table 32: Participation in community/social activity over the last 12 months
%
In over the past 12 months did you participate in any
community or social activities
Sport/recreation/hobby 51.9
Welfare or charity work 25.0
Community 34.4
Religious 17.6
Environmental / animal welfare 10.7
Workplace organised activities 35.1
Art/culture/politics 23.7
Table 33: Change in level of participation over the last 12 months
Increased Stayed the same Decreased
% 29.5 59.0 11.5
13 The only exception is environmental/animal welfare activity where the percentages of respondents vary greatly across locations as follows: Frankston 33.3%; Frankston Continuing 28.6%, Campbelltown 10.7%, Shepparton 2.8%, Brisbane 0.0%.
14 The available Victorian data covers levels of community membership in 2001 and 2004 as compared to our data from 2007.
15 The available national data covers levels of community activity in 2006 as compared to our data from 2007.

Saving behaviour of post Saver Plus participants
32
10.0 Individual Role in Society: Perceptions and Participation (cont.)
10.2 Value of Own OpinionWe also explored how respondents rated whether their opinion matters to lending institutions on a range of issues and on societal matters more generally. These results are reported in Table 34. The topic where the greatest percentage of respondents believed their opinion mattered to lending institutions was on `your ability to repay loans during times of financial difficulty’ where 38.2% of respondents believed their opinion matters. On the other issues relating to financial institutions, between 20% and 25% of respondents believed their opinion mattered.
All of these percentages were lower than those reported in the 2007 study. In terms of other societal issues the results were more comparable across the 2007 and 2008 surveys with 55.0% of 2008 respondents believing this to be the case compared to 56.1% in the 2007 survey. There were no statistically significant differences in terms of impact of own opinion across the locations or phases of the program.
Table 34: Impact of own opinion
%
Do you feel that your opinion matters to lending organisations about the following:
Accounts’ fees and charges 20.3
Interest rates on your account 21.9
Interest rates on any loans you have (including credit cards, mortgages, personal loans)
21.2
Insurance costs 24.1
Your ability to repay loans in times of financial difficulty 38.2
Do you feel that your opinion matters on other societal issues 55.0
Saving behaviour of post Saver Plus participants
33
The results of the 2008 survey continued to provide evidence of the success of the Saver Plus program. Past participants of Saver Plus reported high levels of continued saving behaviour, better financial management and improved quality of life. In addition, there were positive benefits to their children and family when financial skills and saving habits were shared.
While there have been many positive results, there were a number of past participants who reported feeling the impacts of rising costs of living, drought induced hardship and increased levels of debt. The results also confirmed a continued significant relationship between income and savings deposit levels. However, amongst those who were unable to save over the past twelve months – mainly due to reduced income, there were still reported instances of feeling more in control of finances and being able to better manage their income to meet their financial commitments.
The past participants appreciated the support from ANZ and the community organisations. The repeated high response rate to the survey, especially after considerable passing of time, is testament to the extraordinary level of engagement participants experience with Saver Plus.
11.0 Conclusion

Saving behaviour of post Saver Plus participants
34
Australian Bureau of Statistics (2007a), General Social Survey: Summary Results, Australia 2006, Australian Bureau of Statistics Catalogue No. 4159.0
Australian Bureau of Statistics (2007b), Australian Social Trends 2007, Article: Low income low wealth households, Australian Bureau of Statistics Catalogue No. 4102.0
Beal, D. (2000), Internal motives for savings in Australia, Economic Papers 19, 1-13.
Department of Victorian Communities (2005), Report Card on Measuring Community Strength in Victoria: 2004.
Harris, M., Loundes, J. and Webster, E. (2002), Determinants of household savings in Australia, Economic Record 78, 207-223.
Headey, B. and Warren, D. (2007), Families, income and jobs, volume 2: A statistical report on waves 1 to 4 of the HILDA survey, Melbourne Institute of Applied Economic and Social Research, University of Melbourne.
Headey, B., Warren, D. and Harding, G. (2006), Families, income and jobs: A statistical report of the HILDA survey, Melbourne Institute of Applied Economic and Social Research, University of Melbourne.
Russell, R., Brooks, R. and Nair, A. (2006), Saver Plus – Improving financial literacy and establishing long-term savings habits.
Russell, R., Mihajilo, S. and Brooks, R. (2007), Saver Plus – Encouraging savings and increasing financial capabilities among low-income families.
12.0 References