saturation of gases by laboratory wet test meters
TRANSCRIPT

U. S. DEPARTMENT OF COMMERCE NATIONAL BUREAU OF STANDARDS
RESEARCH PAPER RP1238
Part of Journal of Research of the National Bureau of Standards, Volume 23, September 1939
SATURATION OF GASES BY LABORATORY WET TEST METERS
By Francis A. Smith and John H. Eiseman
ABSTRACT
A laboratory wet test meter registering Yto cubic foot per revolution has been studied by the National Bureau of Standards, at the request of a committee of the American Society for Testing Materials, to determine: (a) how nearly the gas passing through the meter becomes saturated with water from the meter, (b) the error in the indicated volume resulting from a lack of complete saturation at different rates of flow, and (c) the error in the indicated volume resulting from failure to level the meter.
Saturation of dry air was found to be over 98 percent complete at all practicable rates of flow. The directly observed error in the indicated volume was found to be less than 0.2 percent. Errors resulting from failure to level the meter were found to be less than 0.1 percent, provided the quantity of water in the meter was the same as at calibration.
CONTENTS Page T. Introduction_______________ ______ _________________ ___________ 345
II. Degree of saturation of gas in a wet test meter__ _______________ __ 346 III. Error resulting from incomplete saturation______ _______ _______ __ 349 IV. Effect of tilting a meter on the indication of gas volume__ ___ __ __ __ 351 V. Discussion of results__ __ _ _ _ __ __ _____ _ __ __ __ __ _ _ __ __ __ __ _ __ ___ _ 353
1. INTRODUCTION
In January 1937, at the request of the American Society for Testing Materials (Committee D-3 on Gaseous Fuels, Subcommittee II on Measurement of Gaseous Samples), the National Bureau of Standards undertook to determine (a) how nearly the gas passing through a laboratory wet test meter becomes saturated with water from the meter, (b) to what extent the volume indicated by such a meter might be in error as a result of failure to saturate the gas completely at different rates of flow, and (c) to what extent the volume indicated might be in error as a result of failure to level the meter when moved after proving.
The method chosen for (a) necessitated a sensitive means of determining water vapor in air which is nearly saturated. A gas interferometer was chosen for the purpose, preliminary tests having indicated that it would permit the determination of the water vapor to approximately ±O.05 percent.
The methods chosen for (b) and (c) involved the observation of differences in the indications of the meter. Consequently, the accuracy of the results reported is dependent not on an accurate calibration of the meters but only on their ability to give consistent results when ~ll~ tests were repeated under identical conditions.
~4.5

346 Journal of Research of the National Bureau of Standards [Vol. U
The two meters used were calorimeter meters each of which indicated 0.1 cu ft per revolution. These meters were adjusted and calibrated by the Gas Measuring Instruments Section by comparison with a 5-cu ft oil-sealed meter prover before the beginning of the tests, at rates of flow ranging from 1.4 to 11.4 cu ft per hour. The range used in the tests was 0.7 to 12.4 cu ft. per hour.
II. DEGREE OF SATURATION OF GAS IN A WET TEST METER
The equipment used in this determination is shown diagrammatically in figure 1.
Air from the laboratory compressed-air line entered through cock A,
'. "
H
G Q R
v
o~
c
FIGURE I.-Diagram of apparatus used to test completeness of saturation of air passing through a wet test meter.
opened fully, and passed through cocks B and a in parallel. B alone gave the desired low rate. B and a together gave the desired high rate. Alternate changes from one to the other were then accomplished without readjustment by completely opening or closing cock O. The air then passed through a tower of calcium chloride (D) for preliminary drying and then through two tubes of dehydrated alumina gel (E and F), which reduced the water vapor in the effluent air to less than 0.01 percent.
From this point (cock U being closed) the dried air was divided, part passing through cock G and part through cock H. Cock H was set to give an arbitrary small flow (as indicated by flowmeter L) through tube 11 of the gas interferometer, through cock K, through tube 12 of the interferometer, and out through the flowmeter. Cock H was then closed, isolating in the two tubes of the interferometer a sample of dried air at atmospheric pressure. The reading of the inter-
J

I L
SmUll ] Elaeman Saturation oj Gases by Wet Test Meters 347
ferometer scale under a typical set of conditions was 418.0, which corresponded to ° percent of water vapor in tube I 2 , as compared with that in tube II as a standard for reference.
Cock K was then closed, which isolated the standard of reference in tube II' All the dried air then passed through cock G to saturator M, where most of the water was added , and thence to saturator N, where equilibrium was established. N was immersed in a tall bath of water, 0, whose temperature was measured by thermometer tb' In both M and N the air bubbled into distilled water through a sintered glass frit at the end of the bubbling tube, which produced a large number of very small bubbles and insured complete saturation. The temperature of the water was determined at the level of the frit by thermometer t'D' The top of the bottle was filled with glass wool to catch the droplets thrown by the bursting bubbles; and the temperature of the moist glass wool was determined by a third thermometer, ta , which temperature was taken as the temperature of saturation.
From this point the moist air passed a manometer, P, through cock Q and out through cock R. After equilibrium had been established, a portion was passed through cock U and through tube I2 of the interferometer. When I2 had been thoroughly purged with the moist air, cock U was again closed and K opened to bring II and I2 to the same, as well as to atmospheric, pressure. The reading of the interferometer scale was 345.0, which corresponded to complete saturation under the conditions observed in the saturator.
The barometric pressure (765.7 rom) plus the pressure indicated by manometer P (8 .9 rom) gave the total pressure (774.6 mm) of the mixture of air and water vapor leaving the saturator. The temperature of the saturator bath was 22.0° C, of the saturator water 21.9° CJ and of the glass wool 22.0° C. The latter was taken as the temperature of saturation; and, since the temperature of the room was 24.9° C, no loss of water from the air through condensation could occur. The partial pressure of water vapor at 22.0° C is 19.84 mm, which is 2.56 percent of the total pressure at saturation.
The interferometer-scale reading of 345.0 thus corresponded to 2.56 percent of water vapor, and the above steps have sufficed to determine two points on a curve constituting an empirical calibration of the interferometer. Figure 2 shows the two points on the interferometer calibration curve, indicated by circles, with a straight line drawn through them.
Cocks G and Q were then reversed, which sent the dried air through the wet test meter S. Cock R was adjusted to make the pressure on meter manometer V approximately equal to that indicated by P when the air was passed through the saturator. This made the pressure of saturation approximately the same in both cases, and, after determining the rate of flow by timing the meter, the same rate could be assumed without significant error for the flow through the saturator.
After equilibrium had again been established, a portion of the flow was again diverted through tube I2 of the interferometer by opening U, and the temperatures of the water and air in the meter were read on thermometers TfD and Ta. After closing U and opening K, the interferometer scale was read as before.
In the present illustrative case, the barometric pressure (765.5 mm) plus the meter pressure (8.9 rom) gave a total pressure of 774.4 rom.

348 Journal of Research of the National Bureau of Standards [Vol. t~
The temperature of the air in the meter was 23.8° 0, of the water 23.0° 0, and of the room 24.7° 0. The temperature of the water was taken as the temperature of the unknown degree of saturation. The partial pressure of water vapor at 23.0° ° is 21.09 mm, which was 2.72 percent of the total pressure. However, the interferometer scale read 342.2. This scale reading, on the interferometer calibration in figure 2, corresponded to 2.70 percent of water vapor, as indicated by the cross.
This indicated that only 2.70 percent of water actually was in the air from the wet test meter, while 2.72 percent would have been present had the air been completely saturated. Thus, on passing
c
., o ~
c ., u
3
1
o :3 30
I"
340
~ ~
"'- .......,
~ ~
"'-"'" ~
350 360 370 380 390 400 410
Interferometer Scale Reading
FIGURE 2.-Calibration of gas interferometer.
'120 43 o
through the wet test meter, saturation of the dried air was 2.70/2 .72= 99.4 percent complete at a rate of flow of 12.4 cu ft per hour. i The procedure described above was repeated alternately at high and low rates of flow, with the results shown in table 1.
TABLE I.-Extent of saturation of dried air at high and low rates of flow
Rate of flow (ell it per hr)
12.42 . . .. _. ______ __ •.•. _ .. _ .. . ... . . . .. 0.82 ... __ __ .. __ ____ .. ____ __ _______ . ..
12.30_ .. ..... _. ___ .. __ ___________ ___ _ _ O. SO . .. __ __ . _____ .. _______ ___ ____ __ ..
12.20 . .... _ .. _ .. __ _ ...... _ .. _ .. __ ____ _ 0.86 __ .... _ .... __ .... __ __ ___ ___ ___ _ __
-- ----~-~-
Complete· ness of
saturation
Percent 99.4 97. 2 97.9 98. 7 99. 4 97.3

Smith ] Eiseman Saturation of Gases by Wet Test Meters 349
The completeness of saturation at the high rates of flow averaged 98.9 percent, whereas at the low rates of flow the average was 97.7. This was unexpected, and investigation disclosed the fact that, at low rates of flow, only the tip of the bulb of the water thermometer in the meter projected below the smface of the water. At high rates of flow the water level rose and about half of the bulb was immersed. These circumstances account for the observations of lower waterthermometer readings at high rates of flow than at low rates and indicate that all the thermometer readings of water temperatme were probably slightly high. Because the thermometers were enclosed, bulb and all, in metal shields, it was impossible to alter their position with respect to the water. The regular thermometer was then replaced by a laboratory thermometer inserted through a rubber stopper far enough to immerse the bulb completely at all times, and this was used in the t ests reported in section III. An estimated correction was applied to the thermometer readings observed at the low rates, with the result that the computed completeness of saturation was raised to a few tenths over 100 percent.
It is concluded that the completeness of satmation of dry air is at least 98 percent at any practicable rate of flow. Since the water vapor involved will usually amount to less than 3 percent of the total indicated volume, the error, as a result of incompleteness of satmation, will be less than 0.06 percent of the volume indicated by the meter, provided the degree of satmation at the moment the measured volume of gas is sealed off in the rotating measming chamber is equal to the degree of satmation when the gas finally leaves the meter. However, the measured gas has considerable opportunity to become more nearly satmated within the meter after it has been sealed off, and it seemed necessary, for this reason, to make a fmther test by comparing the relative volumes indicated by the meter when supplied with dry and with saturated air.
III. ERROR RESULTING~FROM INCOMPLETE SATURA TION
The conclusion from the tests described in section II was checked by direct observation of the volumes indicated by the meter, in the following manner. The two meters used in this investigation were connected as indicated in the diagram in figme 3.
Air from the laboratory compressed-air line entered through cock A, had its flow controlled by Band C, and was dried in D, E, and F, as described in section II. Cocks G and Q were turned to pass the dried air through satmators M and N, indicated in figure 3 and described in section II. The air from the saturator passed through meter T, on which the variations were observed, and then through meter S, which was used as a standard for comparison.
Air was passed through the apparatus (with cock C open to give high rate of flow) until temperatme equilibrium had been established, when the flow was stopped by closing A. The reading of each meter was observed, the flow started and continued until meter S had made five revolutions, when the flow was again stopped and the meters read. Observations of temperatme and pressure of both meters were made while the gas was flowing. Cock C was then closed to give a low rate of flow and the procedure repeated.

:150 Journal oj Research oj the::N ational Buteau oj Standards [ Vol.t~
Then with cock 0 open, cocks G and Q were turned to pass the dried air directly into meter T, and the steps described in the above paragraph repeated. This gave four sets of readings, two at a high rate of flow, one with the air entering meter T wet and the other with it dry, and two similar ones at a low rate of flow. All the observed volumes were placed on a comparable basis by correcting each to the arbitrary standard condition of 760 mm and 25.0° C. This represents approximately the average of the temperatures and pressures existing during the tests. The observed temperatures were all within 10 C and the pressures within 2 mm of these conditions. In addition, the corrected volumes passing meter T have been multiplied by the factor required to bring the corrected volume passing meter S to 0.5000 cu ft.
" II 11 II II II
0 Ell F II II \I 11 11 II II
c 10 ~ lJ~
FIGURE 3.-Diagram of apparatus used to detect variations in indication of a wet test meter when supplied with saturated as compared with dried air.
The essential data from four series of observations made as described are shown in table 2. This procedure was repeated three times and comparisons made between the "wet" and "dry" indications of meter T at both high and low rates of flow. A summary of the results is presented in table 3.
TABLE 2.-Data illustrating the method used in computing the results obtained by comparing the indicated volume oj saturated air with the volume indicated when dry air entered the meter
[It will be noted that the volume of air passed by meter S corrected to 2fjo C and 760 mm (shown in line 4) Is not 0.5000 cu ft. The corrected volume passing meter T (line 6) has therefore been multiplied by the lactor required to bring the volumes 01 line 4 to 0.5000 and the result entered in line 7]
Rate 01 flow (eu It/hr) ______ ____ _______ __ ____________________ 10. 46 10. 77 .n J .. 00
Air entering meter T ____________________ ____ ___ __ ____ ____ ___ Wet Dry Wet Dry Volume indicated by meter S (cu It) ______ __________________ 0.5000 0.4996 O. 0000 O. 0003 Volume indicated by meter S corrected to 25° C, 760 mm __ _ .5016 .4990 .5009 .4997 Volume indicated by meter T (ell It) _______ ________ __ _______ .4882 .4876 .4886 .4885 Volume indicated by meter T corrected to 2fj. C, 760 mm ___ . 4008 .4876 .4898 .4877 Volume 01 meter Tequivalent to 0.5000 cu It through meter S- .4892 .4886 .4889 .4880 Difference between wet and dry (ell It) ____________________ _ .0006 • 9 DltIerence (Jl8rcent) ________________ __ ___ ______ __ ___ __ ______ .12 .18

SmUh ] EI6ematl Saturation oj Gases by Wet Test Meters 351
TABLE 3.-Summary of results showing direct effect of incomplete satuTalion on the volume indicated by a one-tenth cubic foot wet test meter
I
Condition oCair Difference In Dlf!erence In Rate oillow entering Indication indication roeter (wet-dry)
T .
elL It/hr eu It Pereent 10.94 WeL .•. _ } 0.0009 0.18 10.67 Dry. __ . • __ 0.81 WeL •... } -.0007 -0.14 1.21 Dry __ .....
10.67 Dry .••.. . . } .0008 .16 10.46 WeL __ ... 1.21 Dry .••.... } .0000 .00 0. 77 WeL •.• __
10.46 WeL .• __ } .0006 .12 10.77 Dry •••••• _ 0.77 WeL ____ }
.0009 .18 1.20 Dry __ • __ __ 10.77 Dry _______ ~ . 0008 . 16 Q. 38 WeL __ __ . 1.20 Dry ____ • __
. 0012 .24 0.73 WeL ____ . 9.38 WeL _____ }
.0008 . 16 11. 03 Dry _______ 0.73 WeL. ____ }
.OOOS .16 1.26 Dry _______
---Average (or high rate of flow. __ __ 0. 16 Average (or low rate oC flow. _____ 0. 09
It will be noted that in 9 of the 10 comparisons the meter under test indicated a greater volume with wet air than with dry air, with a maximum difference of 0.24 percent. The negative difference seems to indicate the possibility of a random error of the order of 0.3 percent superposed on a smaller effect caused by lack of saturation. The consistency of the positive differences, especially those associated with the higher rates of flow, indicates a real effect of the order of 0.15 percent which might be attributed to lack of saturation. The one negative difference is associated with a low rate of flow, under which conditions the relative indications of the two meters had previously been found to differ by as much as 0.5 percent from their relative indications at higher rates of flow. The data of this report do not permit a determination of the cause of this behavior, but it undoubtedly will result in much larger errors than those caused by lack of saturation of the gas with water vapor.
In spite of the variability of the differences associated with low rates of flow, there is little to indicate that there is any real difference which is attributable to rate of flow in the effect of saturation on the indication of the meter.
IV. EFFECT OF TILTING A METER ON THE INDICATION OF GAS VOLUME
In these tests the arrangement of apparatus was the same as that described in section III. The drying equipment was dispensed with and all the air entering the meter to be tested passed through the saturator. The meter to be tilted was fitted with a plumb line, and a scale was mounted horizontally 500 mm below the point of support of the plumb line. The angle of tilt could readily be determined from the deflection of the plumb line on the scale.
352 Journal of Research oj the National Bureau of Standards [Vot, t3
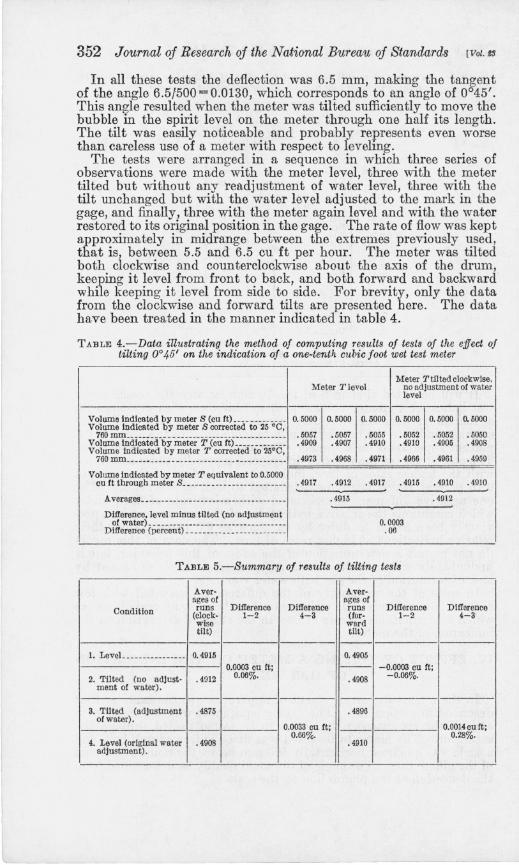
In all these tests the deflection was 6,5 mm, making the tangent of the angle 6,5/500 = 0,0130, which corresponds to an angle of 00 45'. This angle resulted when the meter was tilted sufficiently to move the bubble in the spirit level on the meter through one half its length, The tilt was easily noticeable and probably represents even worse than careless use of a meter with respect to leveling.
The tests were l),rranged in a sequence in which three series of observations were made with the meter level, three with the meter tilted but without any readjustment of water level, three with the tilt unchanged but with the water level adjusted to the mark in the gage, and finally, three with the meter again level and with the water restored to its original position in the gage. The rate of flow was kept approximately in midrange between the extremes previously used, that is, between 5,5 and 6,5 cu ft per hour. The meter was tilted both clockwise and counterclockwise about the axis of the drum, keeping it level from front to back, and both forward and backward while keeping it level from side to side. For brevity, only the data from the clockwise and forward tilts are presented here. The data have been treated in the manner indicated in table 4.
TABLE 4.-Data illustrating the method of computing results of tests of the effect of tilting 0°45' on the indication of a one-tenth cubic foot wet test meter
Meter Ttiltedc\ockwJse, Meter T level no adjustment ot water
level
Volume Indicated by meter S (eu tt) _____________ 0,5000 0,5000 0,5000 0,5000 0,5000 0. 5000 Volume Indicated by meter S corrected to 25°C, 760 = ________________________________________ , 5057 ,5057 ,5055 ,5052 ,5052 ,5050 Volume Indicated by meter T (cu ft)-------- ---- - ,4009 ,4007 ,4910 ,4910 , 4905 ,4908 Volume indicated by meter T corrected to 25°C, 760 mm __________________ _________ _____________ ,4973 ,4968 ,4971 ,4966 ,4961 ,4959
Vol ume Indicated by meter Tequivalent to 0,5000 eu It through meter S _______ ___________________ ,4917 ,4912 ,4917 ,4915 .49lO ,4910
A verages ___________________________ ______ ____ ,4915 ,4912 . DU!erence. level minus tilted (no adjustment of water) ___________________________ ________ 0,0003 Diflerence (percent) ____ .... ____ ____ .. _______ ,06
TABLE 5,-Summary of results of tilting tests
Aver· Aver· ages of ages ot
Condition runs Diflerence Diflerence runs Difference Difference (clock- 1-2 4-3 (for- 1-2 4-3 wise ward tilt) tilt)
1. LeveL ...... ____ .. ___ 0,4915 0,4905
0,0003 cu It; -- -0,0003 cu tt; 2, Tilted (no adJust- ,4912 0,06%, ,4908 -0,06%,
ment ot water).
3, Tilted (adjustment , 4875 ,4896 of water),
0,0033 cu tt; ------- 0,0014 cu It; 0,66%, 0,28%,
4, Level (original water , 4908 ,4910 adjustment) ,
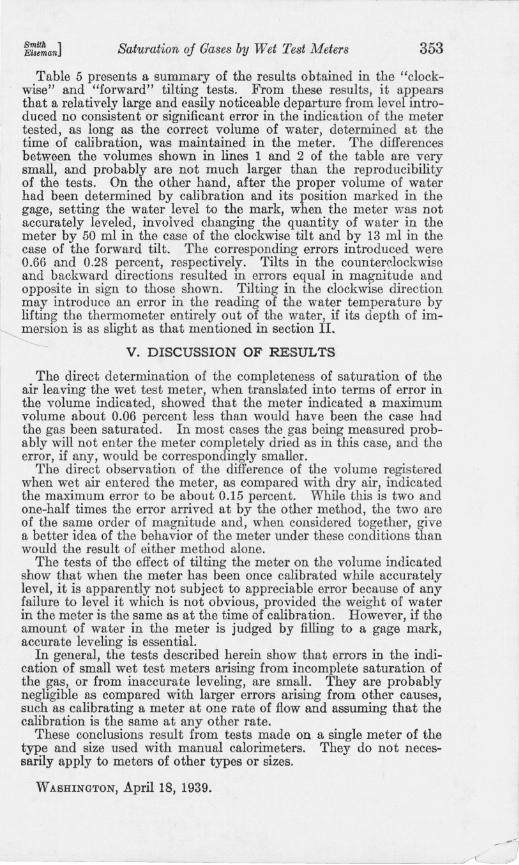
Smitll ] Eiseman Saturation oj Gases by Wet Test Meters 353
Table 5 presents a summary of the results obtained in the "clockwise" and "forward" tilting tests. From these results, it appears that a relatively large and easily noticeable departure from level introduced no consistent or significant error in the indication of the meter tested, as long as the correct volume of water, determined at the time of calibration, was maintained in the meter. The differences between the volumes shown in lines 1 and 2 of the table are very small, and probably are not much larger than the reproducibility of the tests. On the other hand, after the proper volume of water had been determined by calibration and its position marked in the gage, setting the water level to the mark, when the meter was not accurately leveled, involved changing the quantity of water in the meter by 50 ml in the case of the clockwise tilt and by 13 ml in the case of the forward tilt. The corresponding errors introduced were 0.66 and 0.28 percent, respectively. Tilts in the counterclockwise and backward directions resulted in errors equal in magnitude and opposite in sign to those shown. Tilting in the clockwise direction may introduce an error in the reading of the water temperature by lifting the thermometer entirely out of the water, if its depth of im-
~ersion is as slight as that mentioned in section II.
V. DISCUSSION OF RESULTS
The direct determination of the completeness of saturation of the air leaving the wet test meter, when translated into terms of error in the volume indicated, showed that the meter indicated a maximum volume about 0.06 percent less than would have been the case had the gas been saturated. In most cases the gas being measured probably will not enter the meter completely dried as in this case, and the error, if any, would be correspondingly smaller.
The direct observation of the difference of the volume registered when wet air entered the meter, as compared with dry air, indicated the maximum error to be about 0.15 percent. While this is two and one-half times the error arrived at by the other method, the two are of the same order of magnitude and, when considered together, give a better idea of the behavior of the meter under these conditions than would the result of either method alone.
The tests of the effect of tilting the meter on the volume indicated show that when the meter has been once calibrated while accurately level, it is apparently not subject to appreciable error because of any failure to level it which is not obvious, provided the weight of water in the meter is the same as at the time of calibration. However, if the amount of water in the meter is judged by filling to a gage mark, accurate leveling is essential.
In general, the tests described herein show that errors in the indication of small wet test meters arising from incomplete saturation of the gas, or from inaccurate leveling, are small. They are probably negligible as compared with larger errors arising from other causes, such as calibrating a meter at one rate of flow and assuming that the calibration is the same at any other rate.
These conclusions result from tests made on a single meter of the type and size used with manual calorimeters. They do not necessarily apply to meters of other types or sizes.
WASHINGTON, April 18, 1939.
J