saturated hydraulic conductivity of soils in the horqin sand land of inner mongolia, northern china
TRANSCRIPT

Saturated hydraulic conductivity of soils in the HorqinSand Land of Inner Mongolia, northern China
Shuxia Yao & Tonghui Zhang & Chuancheng Zhao &
Xinping Liu
Received: 27 July 2012 /Accepted: 6 November 2012 /Published online: 24 November 2012# Springer Science+Business Media Dordrecht 2012
Abstract Water is a limiting factor to plant growth inHorqin Sand Land of China. Knowledge of soil saturat-ed hydraulic conductivity (Ksat) is of importance be-cause Ksat influences soil evaporation and watercycling at various scales. In order to analyze the varia-tion ofKsat along with sand types and soil depths, and itsrelationship with soil physiochemical properties, sixtypical lands were chosen, including mobile dune, fixeddune, pine woodland, poplar woodland, grassland, andcropland, and Ksat was measured in situ by GuelphPermeameter at each type of land. Soil bulk density,organic matter content, and soil particle size distributionwere determined in parallel with Ksat measurement.The results showed that (1) The averaged Ksat wasdecreased in the order: mobile dune > fixed dune > pinewoodland > poplar woodland > grassland > cropland;changes in Ksat varied considerably as soil depth in-creased, e.g., the changes of Ksat along with soil depthin fixed dune was fitted by exponential model, but it wasfitted by parabola model in the pine woodland and grass-land. (2) The Ksat values of fixed dune and mobile dunewere varied considerably among three slope positions(dune top, windward slope, and leeward slope). (3) Therelationships of Ksat and soil physiochemical propertyrevealed that soil bulk density, organic matter content,
and coarse sand fraction (2∼0.1 mm) were the key factorsaffecting Ksat in Horqin Sand Land. Compared with clayand silt content proportion, sand fraction in this regionshowed a more significant positive correlation with Ksat.
Keywords Saturated hydraulic conductivity .
Guelph Permeameter . Horqin Sand Land
Introduction
Soil saturated hydraulic conductivity (Ksat) is a quanti-tative expression of soil ability to transmit water under agiven hydraulic gradient (Julià et al. 2004). Ksat is also acritical hydraulic property affecting water flow and sol-ute transport in soil (Fares et al. 2000; Julià et al. 2004;Bagarello and Sgroi 2007). Ksat largely determines thepartitioning of precipitation into infiltration of varioussites. This in turn affects the water cycling process andthe amount of water resources at a regional scale. Ksat isused as a constant in many prediction models to simu-late unsaturated hydraulic conductivity in a small areawith uniform soil. The accuracy of the predicted valuesdepends on the precision of the Ksat used in the model.
At the same time, Ksat was influenced by many fac-tors, including vegetation type, terrain and soil physicaland chemical properties, e.g., Rawls et al. (1993) andCerda (1996) suggested that the interrelated soil traits oftexture, bulk density, and macro-porosity impact Ksat inhill slope and watershed hydrology. Aimrun et al. (2004)suggested that effective porosity is the main factor that
Environ Monit Assess (2013) 185:6013–6021DOI 10.1007/s10661-012-3002-5
S. Yao : T. Zhang (*) :C. Zhao :X. LiuCold and Arid Regions of Environmental and EngineeringResearch Institute, Chinese Academy of Sciences,320 Donggang West Road,Lanzhou 730000, Chinae-mail: [email protected]
influences Ksat, and that effective porosity can be used toestimateKsat. Lu et al. (2006) reported thatKsat decreasedwith increasing soil bulk density. Liang et al. (2009)showed that soil organic matter content was the maindriving factor in Ksat improvement, while soil waterstable aggregates content (>0.25 mm), capillary porosity,and clay and silt fractions were the main physical factorsinfluencingKsat. That is,Ksat is especially affected by soiltexture, bulk density, soil porosity, and organic mattercontent (Warrick and Nielsen 1980; Jury et al. 1991;Mohanty and Mousli 2000).
Horqin Sand Land lies in a semiarid area of southeastInner Mongolia. Due to the long-term influence of exten-sive fuelwood gathering, heavy grazing, and reclamation,it has become one of the most severely desertified regionsin China (Zuo et al. 2008). Therefore, most researchstudies focused on desertification and reversion, and onlya few limited studies targeted the changes of Ksat alongsand land type gradient and their relationship with soilproperties in the Horqin Sand Land. The experiment inthis study was designed to answers the following ques-tions: (a) Are soil hydraulic property and soil physical andchemical properties different between sand land types,positions on sand dune slope, and soil depth? (b) Whatis the relationship between Ksat and soil property? (c)What are the key factors that influence Ksat in sand land?
Material and methods
Study site description
The experiment site is located in Niaman DesertificationResearch Station in the Horqin Sand Land (42°55′N,120°42′E, 345 m a.s.l) in the eastern part of InnerMongolia, which belongs to continental semiarid mon-soon climate in the temperate zone. The mean annualprecipitation is 366mm, which was mainly concentratedfrom June to August, while the mean annual potentialevaporation is 1,935 mm. The mean annual temperatureis 6.4 °C. The annual frost-free period is about130∼150 days. The average annual wind speed is3.4 ms−1. The topography is characterized by dunesand interdune lowlands. The soil consists of degradedsandy chestnut soil with loose sand and low organicmatter content. It is thus vulnerable to wind erosionand aeolian soil formation. The sandy grassland in theHorqin Sand Land is ecologically fragile and subject to
desertification. Dunes are covered with native plants,including grasses (Cleistogenes squarrosa L., Setariaviridis L., Phragmites australis L., Digitaria ciliaris L.,and Leymus chinensis L.), forbs (Mellissitus ruthenicusL., Salsola collina L., Agriophyllum squrrosum L., andArtemisia scoparia L.), and shrubs (Caragana micro-phylla L., Lespedeza davurica L., Artemisia haloden-dron L., and Artemisia frigida L.).
Six typical sand lands, including mobile dune(MD), fixed dune (FD), pine woodland (PNW), poplarwoodland (PW), grassland (GL), and cropland (CL),were chosen, and three sites for each type to identifiedfor Ksat measurement. In each site, 15 measuringpoints were set up to provide replications for statisticalanalysis. The basic and natural conditions for the 18sites are listed in Table 1.
Data collection
Ksat measurement
Ksat was calculated by Eq. (1) through inputting theparameter values of R1 and R2, denoting the waterinfiltration velocity (in millimeters per minute),which were determined in situ using a GuelphPermeameter under constant water head at 5 and10 cm separately. Five layers were measured fromthe soil surface to the bottom of the measuredsection (1 m deep, each soil layer was taken at20 cm intervals).
Ksat ¼ 35:22� 0:0041� R2 � 0:0054� R1ð Þ: ð1Þ
Soil sampling and soil properties
For each site, a soil profile of 1 m depth was dug nearthe Ksat measuring points. Three undisturbed soil sam-ples from each layer were taken at an interval of 20 cmusing a cylindrical metal core with a height of 5 cmand a volume of 100 cm3. Soil bulk density was firstmeasured using the volume–mass relationship, and asame soil sample nearby was then to determine otherbasic soil properties. Soil organic matter content wasdetermined using the K2Cr2O7·H2SO4 wet oxidationmethod. Soil particle size distribution was determinedby the dry sieving method. As the Horqin Sand Landis a severely wind-eroded region, soil particles are
6014 Environ Monit Assess (2013) 185:6013–6021
mainly concentrated in 0.25∼0.1 and 0.1∼0.05 mm(Su and Zhao 2003). So, soil particle size fraction inthis study was divided into three groups: coarse sand(2∼0.1 mm), fine sand (0.1∼0.05 mm), and clayand silt (<0.05 mm). The data for bulk density,organic matter content, and distribution of particlesize fractions were averages of the three replicates foreach site.
Data analysis methods
The primary statistical characteristic analysis was per-formed using SPSS software (15.0). Further, one-wayANOVAwas applied to compare the difference in Ksat
among various sand lands, among depths at each typeof sand land, and among slope positions on the sanddunes. Finally, the relationships of Ksat with soil bulkdensity, organic matter content, and soil particle frac-tion were revealed using multiple regression and pathanalysis methods of SPSS software (15.0) at the sig-nificance level of p<0.05. The normality of the Ksat
data in each site at different soil depths was also testedusing the Shapiro–Wilk method by SPSS software(15.0).
Results
Soil physical and chemical properties
All soil parameters determined in this study are dis-played in Table 2. Soil bulk density and total porositywere significantly different (p<0.05) among MD, FD,PNW, PW and GL, and CL, and there was a statisti-cally significant difference in soil organic matter con-tent among six sand lands except for FD vs. PNW. Thedifference of soil particle size distribution in CL wassignificantly different from other typical sand lands,but there was no significant differences (p>0.05)among MD, FD, and PNW because the coarse sandcontent was at least 96 % and the clay and silt contentwas less than 1 % for MD, FD, and PNW, whereas
Table 1 Basic description of the 18 sites selected for this study
Site Main vegetations Vegetationcoverage/canopy density
Type of disturbance Longitude Latitude Altitude (m)
MD 1 Agriophyllum squarrosum 1 % Slight grazing 120.61° 43.15° 342
MD 2 Setaria viridis, Artemisia halodendron 6 % No grazing 120.61° 43.18° 338
MD 3 Agriophyllum squarrosum, Setariaviridis
3 % No grazing 120.40° 43.03° 329
FD 1 Artemisia scoparia, Setaria viridis 70 % 20 years after enclosed 120.70° 42.93° 360
FD 2 Artemisia scoparia, Setaria viridis 85 % 25 years after enclosed 120.69° 42.93° 368
FD 3 Artemisia halodendron, Agriophyllumsquarrosum, Echinops gmelini Turcz
60 % 3 years after enclosed 120.71° 42.94° 363
PNW 1 Pine 0.7 No grazing 120.70° 42.93° 381
PNW 2 Pine 0.8 Heavy grazing 120.68° 42.96° 360
PNW 3 Pine 0.8 Heavy grazing 120.68° 42.96° 357
PW 1 Poplar 0.6 Lightly grazing 120.71° 42.94° 362
PW 2 Poplar 0.7 No grazing 120.71° 42.93° 362
PW 3 Poplar 0.6 No grazing 120.71° 42.93° 356
GL 1 Artemisia scoparia 60 % Moderate interference 120.67° 42.97° 351
GL 2 Artemisia scoparia, Setaria viridis 90 % No grazing 120.71° 42.94° 357
GL 3 Echinops gmelini Turcz 75 % Moderate grazing 120.66° 42.96° 353
CL 1 Millet – Irrigation with crop once a year 120.71° 42.93° 363
CL 2 Corn – Irrigation with crop once a year 120.71° 42.94° 362
CL 3 Corn – Irrigation with crop once a year 120.70° 42.93° 363
Environ Monit Assess (2013) 185:6013–6021 6015

clay and silt content was approximately 6 % for PW,13 % for GL, and 22 % for CL. The coarse sandcontent in all lands generally decreased as soil depth
increased, with the exception of FD. However, therewas an adverse trend for clay and silt content: itincreased as soil depth increased.
Table 2 Soil physical and chemical properties at different depths at six typical sand lands (average±SD)
Type ofsand land
Soil layer (cm) Bulk density(g/cm3)
Total porosity (%) Organic mattercontent (%)
Soil particle size distribution (%)
2∼0.1 mm 0.1∼0.05 mm <0.05 mm
MD 0∼20 1.51±0.02 43.16±0.84 0.47±0.23 97.41±6.09 2.20±0.46 0.06±0.01
20∼40 1.50±0.03 43.22±1.19 0.40±0.13 97.45±9.40 2.14±0.41 0.07±0.02
40∼60 1.51±0.03 43.01±1.14 0.47±0.19 97.28±5.40 2.24±0.86 0.07±0.03
60∼80 1.51±0.04 43.02±1.30 0.36±0.13 97.12±7.02 2.43±0.95 0.08±0.06
80∼100 1.53±0.04 42.37±1.52 0.42±0.15 96.91±5.57 2.43±0.40 0.08±0.04
Average 1.51±0.03 a 42.96±1.20 b 0.42±0.17 e 97.23±6.70 a 2.29±0.62 c 0.07±0.03 d
FD 0∼20 1.51±0.03 43.10±0.96 1.42±0.35 96.44±6.33 2.16±0.80 0.83±0.41
20∼40 1.53±0.03 42.44±1.25 1.02±0.23 96.91±5.23 1.97±0.72 0.55±0.31
40∼60 1.51±0.06 43.00±2.39 1.05±0.41 96.70±6.18 2.15±0.86 0.69±0.41
60∼80 1.53±0.03 42.21±0.97 0.97±0.34 96.70±5.52 1.91±0.77 0.76±0.48
80∼100 1.54±0.03 42.00±1.20 0.89±0.17 96.72±4.98 1.98±0.53 0.68±0.30
Average 1.52±0.04 a 42.55±1.35 b 1.07±0.30 d 96.69±4.65 a 2.03±0.74 c 0.70±0.38 d
PNW 0∼20 1.56±0.06 41.12±2.31 1.65±0.52 97.55±9.46 1.25±0.23 0.55±0.31
20∼40 1.52±0.06 42.56±2.09 0.97±0.24 97.08±5.78 1.57±0.56 0.68±0.30
40∼60 1.56±0.03 41.29±1.02 0.88±0.18 97.02±6.06 1.68±0.25 0.68±0.18
60∼80 1.55±0.03 41.60±0.93 0.81±0.46 97.08±7.14 1.35±0.67 0.83±0.88
80∼100 1.51±0.02 43.12±0.82 1.15±0.64 94.52±3.54 2.28±1.80 2.28±2.45
Average 1.54±0.04 a 41.94±1.43 b 1.10±0.41 d 96.65±6.40 a 1.63±0.70 c 1.00±0.82 d
PW 0∼20 1.56±0.03 41.18±1.06 1.95±0.58 87.17±5.40 9.20±3.04 2.95±1.39
20∼40 1.57±0.03 40.92±1.16 1.65±0.35 84.17±7.02 12.08±1.38 3.07±0.19
40∼60 1.59±0.01 40.06±0.25 1.88±0.37 82.15±3.17 12.58±3.67 4.40±2.43
60∼80 1.53±0.03 42.16±1.24 2.30±0.64 70.30±4.83 20.26±3.92 8.55±5.22
80∼100 1.45±0.13 45.27±4.94 2.41±0.53 61.59±9.93 25.68±9.27 11.78±8.45
Average 1.54±0.05 a 41.92±1.73 b 2.04±0.49 c 77.08±6.07 b 15.96±4.26 b 6.15±3.54 c
GL 0∼20 1.53±0.02 42.34±0.56 3.12±0.13 75.65±7.67 15.67±7.85 7.56±5.74
20∼40 1.49±0.03 43.94±1.14 2.81±0.13 68.96±9.88 20.66±9.65 9.01±8.38
40∼60 1.46±0.04 44.81±1.64 2.93±0.43 66.60±8.17 18.68±8.90 13.50±8.86
60∼80 1.43±0.08 45.99±2.54 2.93±0.39 63.94±8.63 17.49±6.99 17.41±9.21
80∼100 1.38±0.06 48.02±2.08 3.00±0.93 62.75±9.31 19.24±9.04 16.89±9.29
Average 1.46±0.05 b 45.02±1.59 a 2.96±0.40 b 67.58±8.73 b 18.35±8.49 b 12.87±8.30 b
CL 0∼20 1.47±0.09 44.45±3.49 5.12±0.62 55.93±3.37 25.64±1.34 17.36±6.11
20∼40 1.42±0.22 46.50±8.13 4.28±1.88 54.72±7.50 22.70±5.08 20.88±8.39
40∼60 1.45±0.17 45.44±6.41 3.43±0.91 45.05±9.82 31.04±7.27 22.54±9.48
60∼80 1.38±0.19 47.94±7.16 3.93±2.23 43.52±9.00 32.04±8.56 23.19±6.10
80∼100 1.46±0.14 45.06±5.13 4.97±3.72 42.27±9.98 29.23±9.93 26.95±7.31
Average 1.44±0.16 b 45.88±6.06 a 4.35±1.87 a 48.30±7.93 c 28.13±6.44 a 22.18±7.48 a
Different small letters over the same row represent statistically significant differences among sand lands (P<0.05)
MD mobile dune, FD fixed dune, PNW pine woodland, PW poplar woodland, GL grassland, CL cropland
6016 Environ Monit Assess (2013) 185:6013–6021

Soil saturated hydraulic conductivity (Ksat)
Ksat in different sand land
The log transformation of the Ksat data in each typicalsand land by the Shapiro–Wilk method generally fol-lowed a normal distribution, which is consistent withthe results of Mohanty et al. (1994).
There was a statistically significant difference inKsat among six sand lands except for FD vs. MD, FDvs. PNW, and PW vs. GL (Fig. 1). This result indicat-ed that Ksat varied considerably in the complex terrain(the relief including MD, FD, GL, plantation, andfarmland). The average value of Ksat for the soil pro-file in MD, FD, PNW, PW, GL, and CL was 5.89,4.79, 3.99, 2.60, 2.15, and 0.93 mmmin-1, respective-ly. According to the descriptive statistical analysis,the highest value of the standard deviation for Ksat
was 4.01 in MD, and the lowest was 0.86 in CL.In other words, higher Ksat values in severe desert-ification areas have a higher standard deviation. Thecoefficient of deviation of Ksat was less than 1 atsix sand lands, which means that all variations ofKsat were moderate.
The changes of Ksat with soil depths
The trend in Ksat with increasing soil depth was notconsistent among the sand land types (Fig. 1). Forexample, Ksat increased with increasing soil depth forFD except 60∼80 cm layer; however, it showed aninitial decrease followed by a steady increase withincreasing soil depth for PNW and GL. Differencesin Ksat were observed among the five depths, such as0∼20 and 60∼80 cm layers for MD, FD, GL, and CL,and 40∼60 and 80∼100 cm layers for PNW and PW.
The changes in Ksat at different depths in the FDmay be fitted with an exponential model, but in PNWand GL, it may be fitted with a parabola model. Thefitted equation for FD, PNW, and GL was:
Ksat ¼ 3:2802e0:1207x; R2 ¼ 0:8607; ð2Þ
Ksat ¼ 0:4851x2 � 2:5573xþ 6:3258; R2 ¼ 0:7591; ð3Þ
Ksat ¼ 0:2340x2 � 1:5154xþ 4:1202; R2 ¼ 0:8998;
ð4Þ
respectively, where x is soil depth (20, 40, 60, 80, and100 cm), and Ksat is soil saturated hydraulic conduc-tivity (in millimeters per minute). Three equationslisted above have higher determination efficiencies,but the changes of Ksat with different soil layers forMD, PW, and CL were complicated and not well fit toany model.
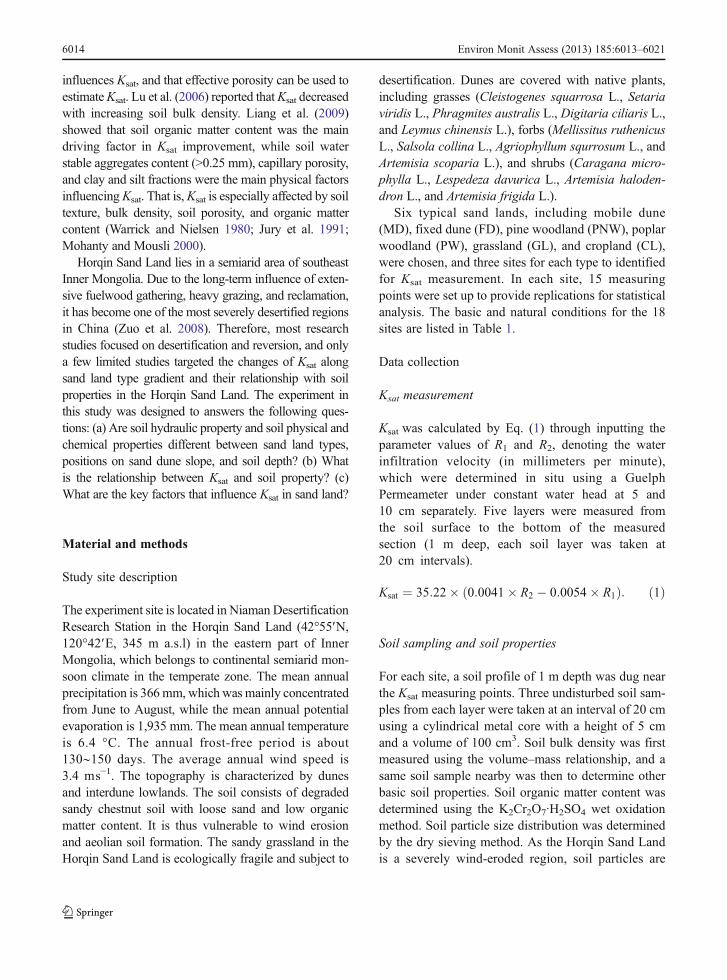
Changes in Ksat over dune slope positions
To gain a closer insight into the changes in Ksat atdifferent slopes on the dune, Ksat on the windwardslope (WS), dune top (DT) and leeward slope (LS)of MD, and FD were measured and analyzed, inwhich, five measuring points were taken at everyWS, DT, and LS. After analysis, we found that themagnitude of Ksat among slope positions on the dunesdecreased in the order: MD-DT >MD-LS> FD-WS>FD-LS> MD-WS> FD-DT (Fig. 2). The highest Ksat
for MD was found at the DT, while the highest Ksat forFD was found at the WS. From Fig. 2, we can also see
b
abc
acb
b
b
bc
acbcb
ab
b
bcbb
bcb
ac
ab
a
a
a
ab
aba
aacb
D
CC
BAB
A
0
1
2
3
4
5
6
7
8
9
MD FD PNW PW GL CL
Sand land type
Ksa
t (m
m/m
in)
0~20cm 20~40cm 40~60cm 60~80cm 80~100cm Avg.
Fig. 1 Change in Ksat withchange in soil depth. Capitalletters over the columns repre-sent statistically significant dif-ferences among sand lands(P<0.05), while lowercase let-ters represent statistically signif-icant differences among layers ateach sand land (P<0.05). Acro-nyms:MD mobile dune, FDfixed dune, PNW pine wood-land, PW poplar woodland, GLgrassland, CL farmland
Environ Monit Assess (2013) 185:6013–6021 6017
that Ksat at the DT position was statistically differentfrom those at the WS and LS positions in FD, but forMD, the difference of Ksat at the WS position wasstatistically significant in comparison to those of theLS and DT positions. The 60∼80 cm layers in the DTand LS positions in both dunes had higher Ksat valuesthan other layers. However, the highest Ksat was foundat the 20∼40 cm layer for the WS.
Relationship of Ksat with soil properties
Relationship of Ksat with soil physical and chemicalproperties
Research studies showed that soil porosity, bulk den-sity, organic matter content, and distribution of soilparticle size fractions were the main factors influenc-ing Ksat (Jury et al. 1991; Warrick and Nielsen 1980;Shan et al. 1998; Lu et al. 2006; Liang et al. 2009). Toreveal the relationship of Ksat with these factors, usinga stepwise regression model, six possible influencingfactors from our data set were chosen as independentvariables: soil bulk density (X1), total porosity (X2),organic matter content (X3), coarse sand fraction (par-ticle size, 2∼0.1 mm) (X4), fine sand fraction (particlesize, 0.1∼0.05 mm) (X5), and clay and silt fraction(particle size, <0.05 mm) (X6). The regression equa-tion listed below has a determination coefficient (R2)of 0.87 and was statistically significant at p=0.0001:
Y ¼ 16:81� 10:50X1 � 0:77X3 þ 0:05X4; ð5Þ
where Y denotes Ksat (in millimeters per minute).Bulk density, organic matter content, and coarse
sand fraction had a significant effect on Ksat at our
experimental sites (Table 3). However, because thesethree variables have different dimensions, the coeffi-cient of each factor impacting Ksat in Eq. (5) cannot bedirectly estimated, requiring further analyses with pathanalysis method.
The residual path coefficient was 0.5 and theDurbin–Watson statistic was 1.57, indicating the pathanalysis result was reliable. The absolute values of thedirect path coefficients with the associated factorsshowed a decreasing sequence of organic matter con-tent > coarse sand fraction > bulk density.
The absolute value of the direct path coefficient fororganic matter content was 0.57. This was the highestof all direct and indirect path coefficients compared toother factors. It had been suggested that organic mattercontent directly affects Ksat. The directivity of the pathcoefficient of organic matter content on Ksat revealedthat Ksat decreased as organic matter content in-creased. The effect of coarse sand fraction on Ksat
was weaker than that of organic matter content be-cause its direct coefficient on Ksat was 0.5; this valuewas smaller than its indirect coefficient from organicmatter content (0.53). According to the acting direc-tion of coarse sand fraction, Ksat increased as thecoarse sand fraction increased. Furthermore, bulk
a
b b
abc ba
b
ba
ab
b
aab
ab
b
abc
ba a
a
ab
a a
a
ab
a
abc
b
B
C
B
C
AAB
0
2
4
6
8
10
12
FD–WS FD–DT FD–LS MD–WS MD–DT MD–LS
Slope position
Ksa
t(m
m/m
in)
0~20cm 20~40cm 40~60cm 60~80cm 80~100cm Avg.
Fig. 2 Change in Ksat overslope position and soil depthin MD and FD.Capital lettersindicate differences amongslope positions in both dunes(P<0.05). Lowercase lettersindicate differences amongsoil layers within a dune (P<0.05). FD-WS, FD-DT, andFD-LS are for a windwardslope, dune top, and leewardslope on the FD; MD-WS,MD-DT, andMD-LS are for awindward slope, dune top,and leeward slope on the MD
Table 3 Path analysis for the effect on Ksat
Effects Direct effects Indirect effects
→X1 →X3 →X4
X1 −0.300 – 0.353 0.366
X3 −0.569 0.186 – −0.462X4 0.497 −0.221 0.529 –
6018 Environ Monit Assess (2013) 185:6013–6021
density also negatively affected Ksat, and its directionwas the same as that of organic matter content. Inother words, the changes in Ksat decreased with in-crease in bulk density, which was consistent with theconclusion of Lu et al. (2006).
Relationship of Ksat with soil organic matter content
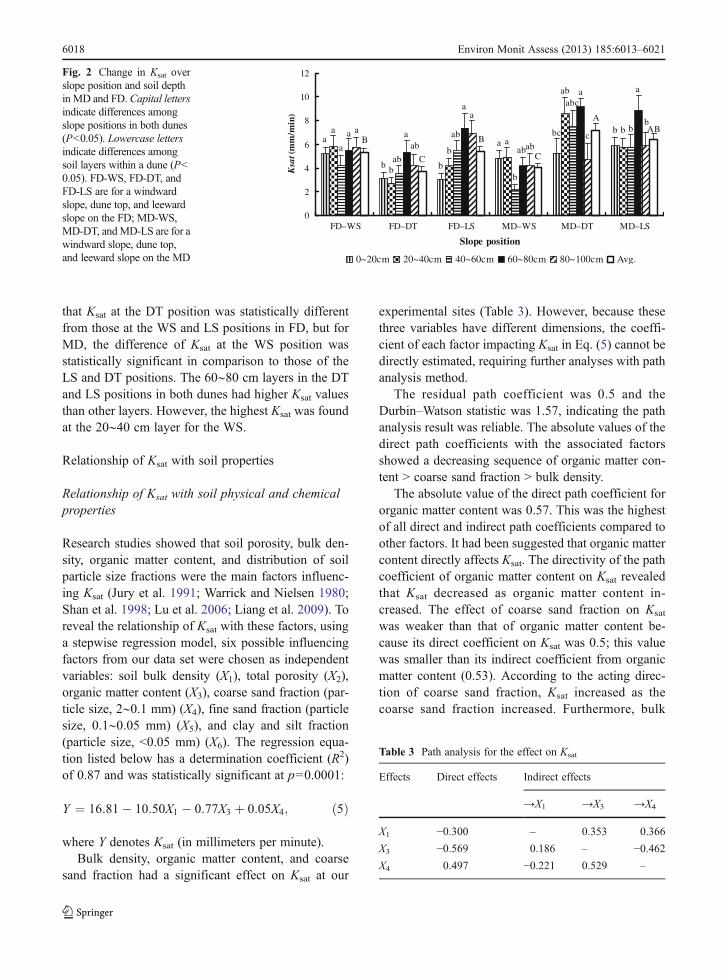
By correlation analyses, we found that there was aclose correlation between Ksat and soil organic mattercontent, their relationship could be fitted by theupward-opening parabola model (Fig. 3).
According to the model equation of Fig. 3, the lowestvalue of Ksat should be obtained when organic mattercontent is 4.8 %. One possible explanation for this maybe that organic matter increased soil swelling, whichdecreased Ksat when the content of soil organic wasbelow 4.8 %. However, organic matter enhanced thesoil porosity, which increased Ksat when the soil organicmatter content was above 4.8% in sandy soil. This resultwas consistent to that analyzed in “Relationship of Ksat
with soil physical and chemical properties” section: Ksat
decreased as organic matter content increased becausethe average value of soil organic matter content in thisstudy was 1.99 %, which was smaller than 4.8 %.
Ksat obtained by soil transfer function method (PTFs)
In recent years, many researchers have attempted toacquire Ksat through indirect methods (van Genuchten1980; Huang and Li 2002; Julià et al. 2004; Li et al.2007). Here, an indirect method was applied to estimateKsat using several soil parameters, such as particle sizefractions, bulk density, organic matter content, and soilporosity because they can be easily measured in thefield. The soil transfer function method (pedotransfer
functions or PTFs) has also been widely applied invarious regions. For example, Julià et al. (2004) reporteda new method to calculate Ksat using sand fraction as anindependent variable, with the expression:
Ksat ¼ 0:920e0:049x; R2 ¼ 0:696: ð6ÞAfter comparing various transfer functions for Ksat
prediction using sand particle size, we found that Eq.(6) improved the prediction. However, the predictedvalues for Ksat by the Eq. (6) were always smaller thanthe measured values (Fig. 4a). To obtain a more suit-able soil transfer function for our experimental sitesand better estimation of Ksat using sand fraction, anexponential expression using the Julià et al. (2004)method was found to have a better fit (Fig. 4b):
Ksat ¼ 0:5192e0:0632x; R2 ¼ 0:7607; ð7Þwhere x is sand fraction (in percent), and the unit ofKsat
was transformed to millimeters per hour by millimetersper minute in corresponding with the results of Julià etal. (2004). Eq. (7) was obtained based on the six typicalsand lands in this study, but its applicability to otherareas still requires further study and confirmation.
Discussion
The Ksat data showed wide variations in the HorqinSand Land. Ksat at MD, FD, PNW, PW, GL, and CLvaried from 0.93 to 5.89 mmmin−1; this range wassmaller than the range of Ksat obtained by Wang et al.(2008) in Sandhill, Nebraska, USA (0.76 to 12.36 mmmin−1). But Jiang (1989) reported that soil with Ksat
values of 1.35∼3.50 mmmin−1 indicated a strong pene-tration area in Loess Plateau of China. The Ksat valuesfor PW and GL in this study were within Jiang’sreported Ksat range. However, Ksat values for MD, FD,and PNW were above that range, while the Ksat for CLwas below. A possible explanation for this was that MD,FD, and PNW had a much higher sand content, and CLa relatively high slit and clay content. This result alsoimplied that MD, FD, and PNW were much strongerpenetration areas, whereas CL was a weak penetrationarea. Generally, the typical process of desertification isthe gradual change of rangeland into MD due to over-grazing or deforestation. An increasing gradient of Ksat
was observed from GL to MD, paralleling a decrease invegetative cover and organic matter content.
y = 0.2438x2 - 2.3513x + 6.6505
R2 = 0.7756P <0.05
0
1
2
3
4
5
6
7
8
0 1 2 3 4 5 6Soil organic matter content (% )
Ksa
t(m
m/m
in)
Fig. 3 The relationship of Ksat with soil organic matter content
Environ Monit Assess (2013) 185:6013–6021 6019
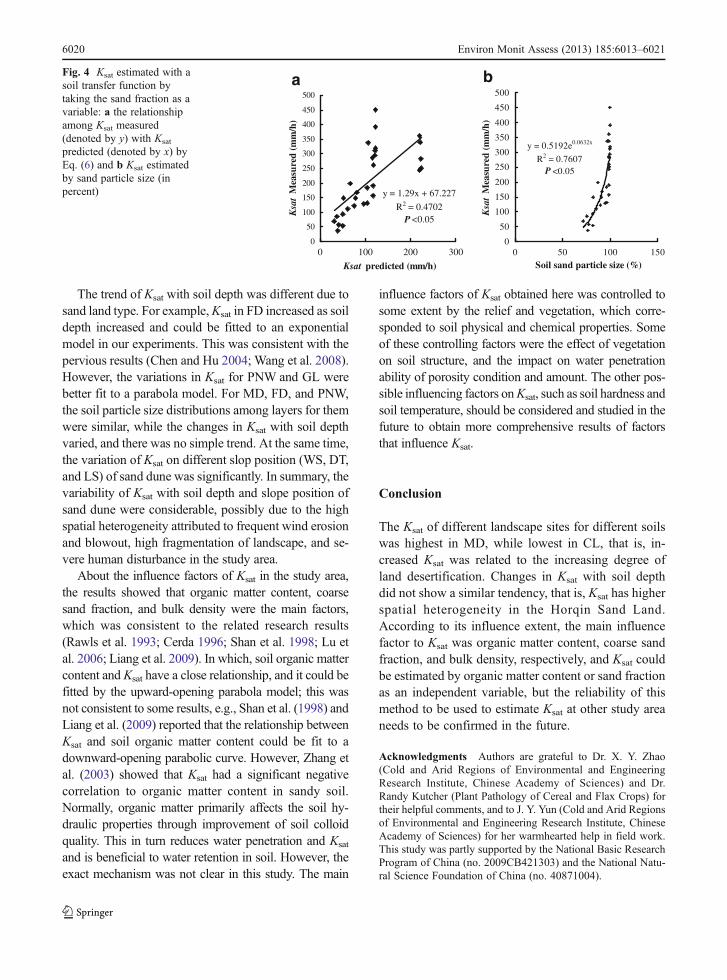
The trend of Ksat with soil depth was different due tosand land type. For example,Ksat in FD increased as soildepth increased and could be fitted to an exponentialmodel in our experiments. This was consistent with thepervious results (Chen and Hu 2004; Wang et al. 2008).However, the variations in Ksat for PNW and GL werebetter fit to a parabola model. For MD, FD, and PNW,the soil particle size distributions among layers for themwere similar, while the changes in Ksat with soil depthvaried, and there was no simple trend. At the same time,the variation of Ksat on different slop position (WS, DT,and LS) of sand dune was significantly. In summary, thevariability of Ksat with soil depth and slope position ofsand dune were considerable, possibly due to the highspatial heterogeneity attributed to frequent wind erosionand blowout, high fragmentation of landscape, and se-vere human disturbance in the study area.
About the influence factors of Ksat in the study area,the results showed that organic matter content, coarsesand fraction, and bulk density were the main factors,which was consistent to the related research results(Rawls et al. 1993; Cerda 1996; Shan et al. 1998; Lu etal. 2006; Liang et al. 2009). In which, soil organic mattercontent and Ksat have a close relationship, and it could befitted by the upward-opening parabola model; this wasnot consistent to some results, e.g., Shan et al. (1998) andLiang et al. (2009) reported that the relationship betweenKsat and soil organic matter content could be fit to adownward-opening parabolic curve. However, Zhang etal. (2003) showed that Ksat had a significant negativecorrelation to organic matter content in sandy soil.Normally, organic matter primarily affects the soil hy-draulic properties through improvement of soil colloidquality. This in turn reduces water penetration and Ksat
and is beneficial to water retention in soil. However, theexact mechanism was not clear in this study. The main
influence factors of Ksat obtained here was controlled tosome extent by the relief and vegetation, which corre-sponded to soil physical and chemical properties. Someof these controlling factors were the effect of vegetationon soil structure, and the impact on water penetrationability of porosity condition and amount. The other pos-sible influencing factors onKsat, such as soil hardness andsoil temperature, should be considered and studied in thefuture to obtain more comprehensive results of factorsthat influence Ksat.
Conclusion
The Ksat of different landscape sites for different soilswas highest in MD, while lowest in CL, that is, in-creased Ksat was related to the increasing degree ofland desertification. Changes in Ksat with soil depthdid not show a similar tendency, that is, Ksat has higherspatial heterogeneity in the Horqin Sand Land.According to its influence extent, the main influencefactor to Ksat was organic matter content, coarse sandfraction, and bulk density, respectively, and Ksat couldbe estimated by organic matter content or sand fractionas an independent variable, but the reliability of thismethod to be used to estimate Ksat at other study areaneeds to be confirmed in the future.
Acknowledgments Authors are grateful to Dr. X. Y. Zhao(Cold and Arid Regions of Environmental and EngineeringResearch Institute, Chinese Academy of Sciences) and Dr.Randy Kutcher (Plant Pathology of Cereal and Flax Crops) fortheir helpful comments, and to J. Y. Yun (Cold and Arid Regionsof Environmental and Engineering Research Institute, ChineseAcademy of Sciences) for her warmhearted help in field work.This study was partly supported by the National Basic ResearchProgram of China (no. 2009CB421303) and the National Natu-ral Science Foundation of China (no. 40871004).
a
y = 1.29x + 67.227
R2 = 0.4702P <0.05
0
50
100
150
200
250
300
350
400
450
500
Ksat predicted (mm/h)
Ksa
t M
easu
red
(mm
/h)
b
y = 0.5192e0.0632x
R2 = 0.7607P <0.05
0
50
100
150
200
250
300
350
400
450
500
0 100 200 300 0 50 100 150Soil sand particle size (%)
Ksa
tM
easu
red
(mm
/h)
Fig. 4 Ksat estimated with asoil transfer function bytaking the sand fraction as avariable: a the relationshipamong Ksat measured(denoted by y) with Ksat
predicted (denoted by x) byEq. (6) and b Ksat estimatedby sand particle size (inpercent)
6020 Environ Monit Assess (2013) 185:6013–6021
References
Aimrun, W., Amin, M. S. M., & Eltaib, S. M. (2004). Effectiveporosity of paddy soils as an estimation of its saturatedhydraulic conductivity. Geoderma, 121, 197–203.
Bagarello, V., & Sgroi, A. (2007). Using the simplified fallinghead technique to detect temporal changes in field-saturated hydraulic conductivity at the surface of a sandyloam soil. Soil & Tillage Research, 94, 283–294.
Cerda, A. (1996). Soil aggregate stability in three Mediterraneanenvironments. Soil Technology, 9, 133–140.
Chen, X., & Hu, Q. (2004). Ground water influences on soilmoisture and surface evaporation. Journal of Hydrology,297, 285–300.
Fares, A., Aiva, A. K., & Nkedi, K. P. (2000). Estimation of soilhydraulic properties of a sandy soil using capacitanceprobes and Guelph Permeameter. Soil Science, 165(10),768–777.
Huang, Y. F., & Li, Y. Z. (2002). Estimation of soil hydraulicproperties-pedo-transfer functions. Acta Pedologica Sinica,39(4), 517–523 (In Chinese with English abstract).
Jiang, D. S. (1989). Regional division of soil infiltration capacityin Loess Plateau, soil and agriculture in Loess Plateau. Bei-jing: Agricultural Press (In Chinese with English abstract).
Julià, M. F., Monreal, T. E., Jiménez, A. S. C., & Meléndez, E.G. (2004). Constructing a saturated hydraulic conductivitymap of Spain using pedotransfer functions and spatialprediction. Geoderma, 123, 257–277.
Jury, W. A., Gardner, W. R., & Gardner, W. H. (1991). Soilphysics. New York: Wiley.
Li, Y., Chen, D., White, R. E., Zhu, A., & Zhang, J. (2007).Estimating soil hydraulic properties of Fengqiu Countysoils in the North China plain using pedo-transfer func-tions. Geoderma, 138, 261–271.
Liang, X. F., Zhao, S. W., Zhang, Y., & Hua, J. (2009). Effectsof vegetation rehabilitation on soil saturated hydraulic con-ductivity in Ziwuling Forest Area. Acta Ecologica Sinica,29(2), 636–642 (In Chinese with English abstract).
Lu, D. Q., Shao, M. A., & Liu, C. P. (2006). Effect of bulkdensity on soil saturated water movement parameters.
Journal of Soil and Water Conservation, 20(3), 154–157(In Chinese with English abstract).
Mohanty, B. P., Kanwar, R. S., & Everts, C. J. (1994). Compar-ison of saturated hydraulic conductivity measurementmethods for a glacial-till soil. Soil Science Society ofAmerica Journal, 58(3), 672–677.
Mohanty, B. P., & Mousli, Z. (2000). Saturated hydraulic conduc-tivity and soil water retention properties across soil-slopetransition. Water Resources Research, 36(11), 311–3324.
Rawls, W. J., Ahuja, L. R., Brakensiek, D., & Shirmohammadi,A. (1993). Infiltration and soil water movement. In D.Maidment (Ed.), Hand book of hydrology (pp. 5.1–5.51).New York: McGraw Hill.
Shan, X. Z., Wei, Y. Q., Yan, H. J., Liu, J. F., & Zhang, R.(1998). Influence of organic matter content on soil hydro-dynamic parameters. Acta Pedologica Sinica, 35(1), 1–9(In Chinese with English abstract).
Su, Y. Z., & Zhao, H. L. (2003). Losses of soil organic carbonand nitrogen and their mechanisms in the desertificationprocess of sandy farmlands in Horqin Sand Land. ScientiaAgricultura Sinica, 36(8), 928–934 (In Chinese with En-glish abstract).
van Genuchten, M. T. (1980). A closed-form equation for pre-dicting the hydraulic conductivity of unsaturated soils. SoilScience Society of America Journal, 44, 892–898.
Wang, T. J., Zlotnik, V. A., Wedin, D., & Wally, K. D. (2008).Spatial trends in saturated hydraulic conductivity of vege-tated dunes in the Nebraska sand hills: effects of depth andtopography. Journal of Hydrology, 349, 88–97.
Warrick, A. W., & Nielsen, D. R. (1980). Spatial variability ofsoil physical properties in the field. Applications of soilphysics (pp. 319–344). New York: Academic.
Zhang, D. H., Zhai, M. P., Jia, L. M., & Lin, P. (2003). Relation-ship between organic matter content in sandy soil and hydro-dynamic parameters. Chinese Journal of Eco-Agriculture, 11(1), 74–77 (In Chinese with English abstract).
Zuo, X. A., Zhao, H. L., Zhao, X. Y., Zhang, T. H., Guo, Y. R.,Wang, S. K., et al. (2008). Spatial pattern and heterogeneityof soil properties in sand dunes under grazing and restora-tion in Horqin Sand Land, Northern China. Soil & TillageResearch, 99, 202–212.
Environ Monit Assess (2013) 185:6013–6021 6021