sato, finland fastighets ab balder interim report january ... filefastighets ab balder interim...
TRANSCRIPT

Fastighets AB BalderInterim reportJanuary-June 2015
• Profit from property management before
tax increased to SEK 763m (537), cor-
responding to an increase per ordinary
share of 51 per cent to SEK 4.08 (2.71)
• Rental income amounted to SEK 1,370m
(1,193)
• Profit after tax amounted to SEK 1,595m
(1,370), corresponding to SEK 9.21 per
ordinary share (7.88)
• Shareholders’ equity amounted to SEK
89.33 per ordinary share (59.17) and the
net asset value amounted to SEK 106.16
per ordinary share (70.82).
Fastighets AB Balder is a listed property
company which shall meet the needs of dif-
ferent customer groups for premises and
housing based on local support. Balder’s
real estate portfolio had a value of SEK 38.1
billion (33.7) as of 30 June 2015. The Balder
share is listed on NASDAQ Stockholm, Large
Cap segment
Sato, Finland

2 FASTIGHETS AB BALDER · INTERIM REPORT JANUARY-JUNE 2015
Net profit for the year in brief
Comparisons stated in parenthesis refer to the corresponding period of the previous year.
April-June 2015
• RentalIncomeamountedtoSEK685m(627).
• Netoperatingincomeincreasedby10percenttoSEK
481m(436).
• Profitfrompropertymanagementincreasedby45per
centtoSEK439m(303),whichcorrespondstoan
increaseperordinaryshareof54percenttoSEK2.40
(1.56).
• Changesinvalueinrespectofinvestmentproperties
amountedtoSEK391m(1,053).Theaverageyieldrequi-
rementamountedto5.3percent(5.8).
• Changesinvalueofinterestratederivativeshaveimpac-
tedtheresultbySEK321m(–179).
• NetprofitaftertaxfortheperiodamountedtoSEK
1,160m(1,087),whichcorrespondstoSEK6.84perordi-
naryshare(6.39).
• 4properties(26)wereacquiredapropertyvalueofSEK
289m.
• 18properties(37)weredivestedforapropertyvalueof
SEK922mwithanareaofapproximately69,000sq.m.
• CollectorBankABwaslistedonJune10,2015.Balders
shareamountsto44.1percentafterthelisting.Share-
holdersequityperordinarysharehasincreasedbySEK
12asaresultofthelisting.
• Balderacquired29.9percentofSatoOyj,Finland`s
secondlargesthousingcompany.
2015 Jan-June
2014 Jan-June
2014 Jan–Dec
2013 Jan–Dec
2012 Jan–Dec
2011 Jan–Dec
2010 Jan–Dec
2009 Jan–Dec
2008 Jan–Dec
2007 Jan–Dec
Rentalincome,SEKm 1,370 1,193 2,525 1,884 1,701 1,466 1,333 854 633 678
Profitfromproperty
managementbeforetax,SEKm 763 537 1,275 854 691 516 417 315 174 179
Changesinvalueofproperties,SEKm 793 1,301 3,050 854 812 990 1,047 4 –201 642
Changesinvalueofderivatives,SEKm 142 –303 –624 433 –71 –520 148 –23 –333 7
Profitaftertax,SEKm 1,595 1,370 3,128 1,738 1,162 812 1,338 248 –388 785
Carryingamountofproperties,SEKm 38,071 33,717 37,382 27,532 22,278 17,556 14,389 12,669 7,086 6,758
Data per ordinary share
Average number of shares, thousands 162,397 161,165 161,786 159,537 159,537 158,656 149,487 112,902 95,910 97,318
Profitaftertax,SEK 9.21 7.88 18.10 10.11 6.69 4.87 8.95 2.20 –4.04 8.07
Profitfromproperty
managementbeforetax,SEK 4.08 2.71 6.64 4.57 3.73 3.00 2.79 2.79 1.81 1.84
Outstanding number of shares, thousands 162,397 162,397 162,397 159,537 159,537 159,537 149,487 149,487 94,458 97,318
Carryingamountofproperties,SEK 234.43 207.62 230.19 172.58 139.64 110.04 96.25 84.75 75.02 69.44
Shareholders’equity,SEK 89.33 59.17 70.10 52.14 42.15 35.57 31.13 22.19 19.63 23.49
Long-termnetassetvalue(EPRANAV),SEK 106.16 70.82 86.33 60.50 50.37 41.83 32.89 22.16 20.95 22.33
Sharepriceonclosingdate,SEK 127.90 90.50 110.25 66.00 37.30 25.30 29.40 12.50 7.00 13.33
January-June 2015
• RentalincomeamountedtoSEK1,370m(1,193).
• Netoperatingincomeincreasedby19percenttoSEK
932m(785).
• Profitfrompropertymanagementincreasedby42per
centtoSEK763m(537),whichcorrespondstoan
increaseperordinarysharewith51percenttoSEK4.08
(2.71).
• Changesinvalueinrespectofinvestmentproperties
amountedtoSEK793m(1,301).Theaverageyield
requirementamountedto5.3percent(5.8).
• Changesinvalueofinterestratederivativeshave
impactedtheresultbySEK142m(–303).
• NetprofitaftertaxfortheperiodamountedtoSEK
1,595m(1,370),whichcorrespondstoSEK9.21perordi-
naryshare(7.88).
• 7properties(32),ofwhichfiveprojectproperties,were
acquiredatapropertyvalueofSEK1,029mwithalet-
tableareaofapproximately23,000sq.m.
• 21properties(40)weredivestedatapropertyvalueof
SEK1,426mwithalettableareaofapproximately
90,000sq.m.
FASTIGHETS AB BALDER · INTERIM REPORT JANUARY-JUNE 2015 3
Comments by the CEO
Q2, 2015
Profitfrompropertymanagementforthesecondquarterandthefirsthalfof2015improvedby54and51percent,respectively,perordinarysharecomparedtothesameperi-odslastyear.Increasingourprofitfrompropertymanage-mentovertimehasbeenthemostimportantfinancialkeyratioforusonaday-daybasiseversinceBalderwasesta-blishedinitspresentform10yearsago.
Duringthesecondquarter,wealsocompletedandagreedonanumberoftransactions.Thesinglemostimportantwastheacquisitionofalmost30percentofthesharesinSatoOyj,whichisoneofFinland’slargestpropertycompa-nieswithresidentialpropertiesinfocus.InSweden,wesoldsomecommercialpropertiesandinvestedinresidentialthroughcontinuedworkwithmanyofourownfuturepro-jectsintheexistingportfolio,acquisitionoftheremainingsharesinBovieranandacquisitionof31percentofthesha-resinTornetBostadsproduktion.Tornetconcentratesonconstructionofrightsoftenancyforthecompany'sownlong-termownership.Atpresent,thepropertyportfolioincludesapproximately700apartmentsandongoingpro-jects/constructionsofafurtherapproximately700apart-ments.OurpartnersinTornetarePeab,FolksamandRiks-byggen.
InearlyJuly,wealsoobtainedthego-aheadforadditionalconstructionprojectsinCopenhagenforSEK1.9billionintotalwithcompletionexpectedby2018.TheseprojectsandotherconstructionworkinprogressmeanthatwenowhaveanoperationinDenmarkthatissatisfactoryintermsofsize(however,wewouldliketoinvestmore).
Turningtoourassociatedcompanies,itwasanintensivesecondquartertosaytheleastforCollector;thecompanyobtainedabankinglicenceandisnowcalledCollectorBankandon10JuneCollectorwasalsolistedonNasdaqStock-holm,MidCapsegment.
Collectorreportedaverygoodresultforthefirsthalfof2015andIamjustasoptimisticnowregardingCollector’spotentialgoingforwardaswhenweacquiredourstakejustover4yearsago.Anewissuewasalsocarriedoutincon-nectionwiththelisting,whichdilutedBalder’sparticipa-tinginterestfrom48to44percent.
Now as Collector is listed,Ithinkthatthemosttrueandfairviewintheaccounts,inadditiontoourshareoftheprofit,whichisrecognisedasprofitfromassociatedcom-panies,wouldhavebeentorecognisetheshareatitsmar-ketprice.However,thisisnotallowedundercurrentrules–althoughthissoundscrazy–unlesswereclassifythesharesasa“treasurymanagement”,whichwouldnotaccordatallwithhowweviewourownershipinCollectoranditwouldalsohaveotherstrangeeffects.ThereforewehavechosentocontinuereportingCollectoraccordingtothesameprin-cipleasbeforebutwewillalsopresenthowourbalancesheetlookswhenwerecogniseCollectoratmarketvalue.Wewillalsocalculateourkeyratios,netassetvalue,equityperordinaryshareandequity/assetsratioetc.basedonCollector’sshareprice.Intheaccounts,ourinterimreportforthesecondquarterincludesanon-recurringitemofSEK126m(inprofitfromassociatedcompanies)whichcomesfromthedilutionofourownershipthroughthenewissuefrom48percentto44percentatapricewhichexceededourbookvalue.CallMagnusBjörndahlorMarcusHanssonifyouhavequestions.
Balder 10 years
Thisinterimreportmeansthatwenowfinallyhavea10yearhistory!Asaninvestor,Inaturallythinkthatthevaluetodayisentirelydependentontheassessmentofthefuture.(Thevaluetodayisthepresentvalueoffuturecashflows).However,asmallpieceofthejigsawwhenthinkingaboutthefuturecanalsobefoundbylookingathistory–personallyIliketodothisifpossible.“Historydoesnotrepeatitself,butitrhymes”isagoodquotetohaveinthebackofone’shead.
Asidefromprofitfrompropertymanagement,Balder’scomprehensiveincomeconsistsofforeigncurrencytransla-tion,relativelysmallamountstodate,changesinvalueofpropertiesaswellaschangesinvalueofderivativesandtaxes.

4 FASTIGHETS AB BALDER · INTERIM REPORT JANUARY-JUNE 2015
Net asset per ordinary share
The change in net asset value per ordinary share reflects comprehensive income and this has developed as follows:
30June2005: 6.59(Balderestablished)30June2006: 11.08 30June2011: 36.0430June2007: 16.46 30June2012: 44.8530June2008: 23.44 30June2013: 54.4130June2009: 22.39 30June2014: 70.8230June2010: 26.57 30June2015: 106.16
Newissues,repurchasesanddividendsalsoaffectthenetassetvaluepershare.Changesinvalueofpropertiesandprofitfrompropertymanagementhadthemostpositiveimpact.
Derivativeshadanegativeimpact.Ihavetakenmanypoordecisionsregardingderivativesovertheyears;wehavetohopeforabetterresultduringthenext10years.Anothernegativeitem,withoutdoubtonaparwithderiva-tives,whichthankGoddonothavetoberecognised,aredealsthatIcouldhavedonewithalltherequirementsinplaceandthatIconsideredtobegoodbutneverthelessdidnotcarryoutforonereasonoranother.Ihavebeenabletofollowmanyofthesetransactionsandcanstatethatalotpassedmebyunnecessarily.Thereisalsopotentialheregoingforward.
We have made the assessment todatethatthebesttotalyieldforBalder’sshareholdershasbeentoreinvestprofitsandnottopayadividend(withtheexceptionofoneyearwhenwepaidadividendequivalentto17öreperordi-naryshare,don’taskmewhatIwasthinking).Lookingahead,thegoalremainsthesame.Despitethestrongpropertymarket,Iamoptimisticaboutthepotentialovertimeoffindinginvestmentswithareasonablygoodyield.
I would also like to take this opportunitytothankeveryonewhoisorhasbeeninvolvedwithusinonewayoranother.IamveryfortunatetobeabletodowhatIreallyenjoydoingtogetherwithpeopleIamveryfondof.
SharamRahi,ViceCEOofBalder,saidtomeonewetautumneveningwhenhecalledfromhiscaronthewayhomefromHelsingborg:“Erik,wehavesuchfunatwork,Ireallyshouldhavetopayafeetodothis”.Icanagreewiththis,Ireallyshouldpaytohavemyjob.
ErikSelinChiefExecutiveOfficer

FASTIGHETS AB BALDER · INTERIM REPORT JANUARY-JUNE 2015 5
Current earning capacity
Balderpresentsit searningcapacityonatwelve-monthbasisinthetablebelow.Itisimportanttonotethatthecur-rentearningcapacityshouldnotbeplacedonaparwithaforecastforthecoming12months.Forinstance,theear-ningcapacitycontainsnoestimateofrental,vacancy,cur-rencyorinterestratechanges.Balder’sincomestatementisalsoimpactedbythedeve-
lopmentinthevalueoftherealestateportfolioaswellasfuturepropertyacquisitionsand/orpropertydivestments.Additionalitemsaffectingtheoperatingresultarechanges
invalueofderivatives.Noneoftheabovehasbeenconside-redinthecurrentearningcapacity.Theearningcapacityisbasedontherealestate
portfolio’scontractedrentalincome,estimatedpropertycostsduringanormalyearaswellasadministrativecosts.Thecostsoftheinterest-bearingliabilitiesarebasedonthegroup'saverageinterestratelevelincludingtheeffectofderivativeinstruments.Thetaxiscalculatedusingtheeffectivetaxrateduringeachperiodandisestimatedtolar-gelyconsistofdeferredtax,whichdoesnotaffectthecashflow.
Current earning capacity on a twelve-months basis
SEKm2015
30 June2015
31 Mar2014
31 Dec2014
30 Sep2014
30 June2014
31 Mar2013
31 Dec2013
30 Sep2013
30 June2013
31 Mar2012
31 Dec
Rentalincome 2,650 2,745 2,730 2,650 2,600 2,310 2,260 1,885 1,865 1,800 1,800
Propertycosts –760 –800 –800 –795 –785 –735 –735 –580 –575 –560 –560
Net operating income 1,890 1,945 1,930 1,855 1,815 1,575 1,525 1,305 1,290 1,240 1,240
Propertyand
administrativeexpenses –175 –170 –165 –165 –165 –165 –165 –125 –120 –120 –120
Profitfromproperty
managementfrom
associatedcompanies 500 410 220 200 180 180 170 150 130 130 120
Operating profit 2,215 2,185 1,985 1,890 1,830 1,590 1,530 1,330 1,300 1,250 1,240
Netfinancialitems –575 –575 –585 –580 –580 –535 –535 –515 –510 –495 –495
Profit from
property management 1,640 1,610 1,400 1,310 1,250 1,055 995 815 790 755 745
Taxes –361 –354 –308 –288 –275 –232 –219 –179 –174 –166 –164
Profit after tax 1,279 1,256 1,092 1,021 975 823 776 636 616 589 581
Profit after tax
attributable to
Ordinaryshareholders 1,079 1,056 892 821 775 623 576 506 486 469 461
Preferenceshareholders 200 200 200 200 200 200 200 130 130 120 120
Profit from property
management before tax
according to current
earning capacity per
ordinary share, SEK 8.87 8.68 7.39 6.83 6.47 5.26 4.99 4.29 4.14 3.98 3.92
Currentearningsasof30JuneexcludingthepropertyOden7inTrollhättan.

6 FASTIGHETS AB BALDER · INTERIM REPORT JANUARY-JUNE 2015
The consolidated statement of financial position including Collector Bank AB at market valueUnderIFRS,CollectorBankABshouldnotberecognisedatmarketvaluewhenBalderreportsitsparticipationintheprofitfromassociatedcompaniesfromCollector.InordertoclarifyCollector’smarketvalue,Collectorisreportedbelowatthesharepriceasof30June.
SEKm2015
30 June
Assets
Investmentproperties 38,071
Otherfixedassets 93
Participationsinassociatedcompanies 6,051
Otherreceivables1) 1,158
Cashandcashequivalentsandfinancialinvestments 1,159
Total assets 46,532
Shareholders’ equity and liabilities
Shareholders’equity 17,384
Deferredtaxliability 1,789
Interest-bearingliabilities2) 25,218
Derivatives 944
Otherliabilities 1,197
Total equity and liabilities 46,532
1)Ofwhichmostpartreferstoreceivablesinassociatedcompanies2)Ofwhichinterest-bearingliabilitiesinrespectofproperties 19,595
Thestatementoffinancialpositionabovehasbeenusedforcalculatingkeyratios.
Consolidated statement of changes in equityAttributable to the Parent Company’s shareholders, SEKm
2015 30 June
Opening equity 14,261
Dividendpreferenceshares –200
Acquisitionofnon-controllinginterests –17
Netprofitfortheperiod/year 1,564
AdjustmentofCollectorBankABtomarketvalue 1,776
Closing equity 17,384
FASTIGHETS AB BALDER · INTERIM REPORT JANUARY-JUNE 2015 7
ResultsProfitfrompropertymanagementincreasedby42percentduringtheperiodandamountedtoSEK763m(537),whichcorrespondstoanincreaseperordinarysharewith51percenttoSEK4.08(2.71).ProfitfrompropertymanagementincludesSEK181m(86)inrespectofassociatedcompanies.ProfitaftertaxfortheperiodamountedtoSEK1,595m
(1,370),correspondingtoSEK9.21perordinaryshare(7.88).Profitbeforetaxwasaffectedbychangesinvalueofpro-pertiesofSEK793m(1,301),changesinvalueofinterestratederivativesofSEK142m(–303)andprofitfrompartici-pationsinassociatedcompaniesofSEK326m(190).
Rental incomeRentalincomeincreasedby15percenttoSEK1,370m(1,193).Theincreasewasprimarilyduetoalargerrealestateportfolio.Theleasingportfoliowasestimatedtohavearentalvalueon30JuneofSEK2,804m(2,738)onanannualbasis.TheaveragerentallevelfortheentirerealestateportfolioamountedtoSEK1,329/sq.m.(1,289).Rentalincomeshowsaconsiderablediversificationof
risksasregardstenants,sectorsandlocations.Theecono-micoccupancyrateamountedto95percent(95)on30June.ThetotalrentalvalueofunletareasattheendoftheperiodamountedtoSEK137m(138)onanannualbasis.
Property costsPropertycostsamountedtoSEK438m(408)duringtheperiod.Theincreaseinpropertycostswasmainlyduetothechangeinthepropertyportfolio.Netoperatingincomeincreasedby19percenttoSEK
932m(785),whichimpliesasurplusratioof68percent(66).Operatingcostsnormallyvarywiththeseasons.Thefirstandfourthquartershavehighercoststhantheotherquarters,whilethethirdquarterusuallyhasthelowestcostlevel.
Changes in value of investment propertiesBaldercarriedoutanindividualinternalvaluationon30June,basedonaten-yearcashflowmodel,oftheentirerealestateportfolio.UnrealisedchangesinvalueduringtheperiodamountedtoSEK723m(1,189).RealisedchangesinvalueamountedtoSEK70m(112).Theaverageyieldrequirementasof30Juneamounted
to5.3percent(5.8),whichisadecreasecomparedtothefirstquarterwith0.2percentagepoints.Thechangeinvalueduringtheperiodisattributabletoimprovedopera-tingsurplusandareducedyieldrequirement.
Management and administrative costsManagementandadministrativecostsamountedtoSEK91m(78)duringtheperiod.Theincreaseisduetothechangeofthepropertyportfolio.
Participations in the profit of associated companiesBalderownspropertymanagingandprojectdevelopingassociatedcompaniesand44.1percentofCollectorBankABthatwaslistedinJune.InconnectionwiththelistinganewissuewascarriedoutthathasaffectedBalder’sprofitfromparticipationsinassociatedcompanieswithSEK126m.Fromthesecondquarter2015BalderalsoreportsaconsolidatedstatementoffinancialpositionincludingCol-lectorBankABatmarketvalue.DuringthesecondquarterBalderhasacquired29.9percentofthesharesinSatoOyj,Finland’ssecondlargesthousingcompany.FromthesecondquarterSatoisincludedintheprofitfromassociatedcom-panies.DuringthequartertheminorityinBovieranHoldingABhasbeenacquired,whichmeansthatthecompanyisnowawhollyownedsubsidiary.On30June,31percentoftheshareswereacquiredinTornetBostadsproduktionAB.Profitfromparticipationsinassociatedcompanies
amountedtoSEK326m(190)duringtheperiodandBalder’sparticipationintheassociatedcompaniesprofitfrompro-pertymanagementamountedtoSEK181m(86).Profitbeforetaxwasimpactedbyunrealisedchangesin
valueinrespectofpropertiesandinterestratederivativesofSEK69m(122).
Net financial items and changes in value of derivativesNetfinancialitemsamountedtoSEK–259m(–257)andunrealisedchangesinvalueofinterestratederivativesamountedtoSEK142m(–303).Thepositivechangeinvalueduringtheperiodwasduetoanincreaseinthelevelofinterestratessinceyear-end.Unrealisedchangesinvaluedonotaffectthecashflow.Netfinancialitemsareequivalenttoborrowingatan
averageinterestrateof2.2percent(2.8)duringtheperiod,includingtheeffectofaccruedinterestfrominterestratederivatives.
TaxesBalderreportedacurrenttaxexpenseofSEK4m(2)fortheperiodandadeferredtaxexpenseofSEK244m(266).Currenttaxonlyarisesinexceptionalcasesduetothe
possibilitiesofmakingtaxwrite-offs,taxdeductionsforcertaininvestmentsinpropertiesanduseofexistinglosscarry-forwards.Currenttaxarisesforsubsidiarieswherenogroupcontributionsfortaxpurposesexist–mainlycompa-niesacquiredanddivestedduringtheperiod.Thegroup’sdeferredtaxliabilityhasbeencalculatedas
thevalueofthenetoffiscaldeficitsandthetemporarydif-ferencesbetweenthecarryingamountsandvaluesfortaxpurposesofpropertiesandinterestratederivatives.DeferredtaxliabilitiesamountedtoSEK1,789m(1,127).Atyear-end,thegroup’soveralltaxdeficitamountedtoaboutSEK1,700m(2,000).
Results, income and costs
8 FASTIGHETS AB BALDER · INTERIM REPORT JANUARY-JUNE 2015
Second quarter, 2015Profitfrompropertymanagementforthesecondquarterof2015increasedby45percentandamountedtoSEK439m(303),whichcorrespondstoanincreaseperordinaryshareof54percenttoSEK2.40(1.56).ProfitfrompropertymanagementincludedSEK126m(47)inrespectofassocia-tedcompanies.RentalincomeamountedtoSEK685m(627)andpropertycostsamountedtoSEK204m(191),whichmeantthatnetoperatingincomeincreasedby10percenttoSEK481m(436).Thesurplusratioamountedto70percent(70).NetprofitaftertaxfortheperiodamountedtoSEK
1,160m(1,087),correspondingtoSEK6.84perordinaryshare(6.39).TheresultwasaffectedbychangesinvalueinrespectofpropertiesofSEK391m(1,053),changesinvalueofinte-restratederivativesofSEK321m(–179)andprofitfrompar-ticipationsinassociatedcompaniesofSEK275m(157).
Cash flowCashflowfromoperatingactivitiesbeforechangesinwor-kingcapitalamountedtoSEK503m(429).Investingactivi-tieshaveburdenedthecashflowbySEK2,583m(4,470).Duringtheperiod,acquisitionofpropertiesofSEK944m(5,128),investmentsinexistingpropertiesandprojectsofSEK386m(403)andinvestmentsinproperty,plantandequipment,financialinvestmentsandassociatedcompanies
etc.ofSEK2,870m(137)anddividendspaidofSEK100m(100)adduptoSEK4,300m(5,768).Thesehavebeenfinan-cedthroughcashflowfromoperatingactivitiesofSEK313m(437)bypropertydivestmentsofSEK1,425m(922),financialinvestmentsofSEK192m(212)andanetborro-winganddisposalofownsharesofSEK2,937m(4,497),addupto4867Mkr(6068).TotalcashflowfortheperiodamountedtoSEK567m
(300).Thegroup’scashandcashequivalents,financialinvestmentsandunutilisedcreditfacilitiesamountedtoSEK1,509m(1,455)on30June.
Employees and organisationThenumberofemployeeson30Juneamountedto444per-sons(297),ofwhich191werewomen(102).Balderisorgani-sedintofiveregionswith16areasintotal.Theheadofficewithgroup-widefunctionsislocatedinGothenburg.
Parent CompanyTheparentcompany’soperationsmainlyconsistofperfor-minggroup-wideservicesbutanimportantpartalsorelatestosalesofservices,principallytoassociatedcompanies.SalesintheparentcompanyamountedtoSEK69m(52).NetprofitaftertaxamountedtoSEK1,057m(603).Divi-
dendofSEK800m(700)fromsubsidiarieswasincludedandchangesinvalueofinterestratederivativesamountedtoSEK130m(–276).

FASTIGHETS AB BALDER · INTERIM REPORT JANUARY-JUNE 2015 9
Distributed by region, % Distributed by property category, %
handel
lag/ind
Stockholm, 33
East, 11
North, 5
Öresund, 18
Gothenburg/West, 33
Residential, 39
Office, 29
Other, 18
Retail, 14
Balder’s real estate holdings on 2015-06-30 1)
Number ofproperties
Lettable area,sq.m.
Rental value,SEKm
Rental value,SEK/sq.m.
Rental income,SEKm
Economicoccupancy
rate, %Carrying
amount, SEKmCarrying
amount, %
Distributed by region
Stockholm 61 446,695 845 1,892 795 94 12,611 33
Gothenburg/
West 206 802,868 968 1,206 928 96 12,464 33
Öresund 51 298,212, 435 1,458 407 94 6,900 18
East 79 395,361 389 984 373 96 4,034 11
North 82 167,026 167 1,002 163 98 2,062 5
Total 479 2,110,162 2,804 1,329 2,667 95 38,071 100
Distributed by property category
Residential 308 1,136,795 1,139 1,002 1,115 98 14,934 39
Office 71 414,364 791 1,909 720 91 11,065 29
Retail 48 232,029 405 1,745 383 95 5,226 14
Other 52 326,974 469 1,435 450 96 6,846 18
Total 479 2,110,162 2,804 1,329 2,667 95 38,071 100
1)TheabovetablereferstothepropertiesownedbyBalderattheendoftheperiod.Soldpropertieshavebeenexcludedandacquiredpropertieshavebeenestimatedusingfull-yearvalues.Otherpropertiesincludehotel,educational,nursing,industrialandmixed-useproperties.Realestateprojectsareincludedinthecarryingamountduringtheconstructionphasebutnotinothercolumns.
On30June,Balderowned479properties(490)withaletta-bleareaofapproximately2,110,000sq.m.(2,125,000)andavalueofSEK38,071m(33,717).Balder’stotalrentalvalueamountedtoSEK2,804m(2,738).
Balder’scommercialpropertiesarelocatedinthecentreandimmediatesuburbsofbigcitiesandsurroundingmuni-cipalareas.Balder’sresidentialpropertiesarelocatedinplacesthataregrowinganddevelopingpositively.Balder’sambitionistocontinuegrowinginselectedmarkets.
Real estate holdings

10 FASTIGHETS AB BALDER · INTERIM REPORT JANUARY-JUNE 2015
Change in real estate portfolio
The value of Balder’s real estate portfolio is based on inter-nal valuations. All properties have been valued using the cash flow based method, which means that each property is valued by discounting the estimated future cash flows. An estimate is also made of the future development of the immediate surroundings and the position of the property within its market segment. On 30 June, Balder’s average yield requirement amounted to 5.3 per cent (5.8) excluding project and development properties.
In order to quality-assure its internal valuations, Balder regularly allows parts of its portfolio to be externally valued during the period or at each year-end. Historically, deviations between external and internal valuations have been insignificant.
Project real estateBalder had five projects under construction as of 30 June. The overall investment will amount to SEK 1,475m, of which SEK 540m remains to be invested up to and inclu-ding the first half of 2016, when the projects should be completed. The projects consist of the construction of approximately 385 apartments in Copenhagen as well as
the construction of 144 tenant-owner’s rights under the Bovieran brand.
Unrealised changes in valueThe overall carrying amount of Balder’s 479 properties (490) amounted to SEK 38,071m (33,717) on 30 June. The unrealised change in value during the period amounted to SEK 723m (1,189) and was attributable to improved net operating income and a lower yield requirement.
Investments, acquisitions and divestmentsDuring the year, a total of SEK 1,415m (5,755) was invested, of which SEK 1,029m (5,352) related to acquisitions and SEK 386m (403) related to investments in existing properties and projects. Properties with a sales value of SEK 1,425m (922) were divested during the period. One of the sold pro-perties, Murmästaren 3, has via a company transaction, been sold to 50 per cent. The property will be a project pro-perty and is now included as an associated company. Profit from property sales amounted to SEK 70m (112). The change in the real estate portfolio during the year may be seen in the table below.
Change in carrying amount of properties 2015 2014
SEKm Number SEKm Number
Real estate portfolio, 1 January 37,382 494 27,532 498
Investments in existing properties and projects 386 403
Acquisitions 1,029 6 5,352 32
Sales –1,354 –21 –810 –40
Change in value of investment properties, unrealised 723 1,189
Currency changes –95 52
Real estate portfolio, 30 June 38,071 479 33,717 490
Property transactions 2015Quarter Number Name of property Municipality Property category Leasable area, sq.m.
Acquisitions
One 1 Snöflingan 3 Stockholm Hotel 22,000
One 1 Inom Vallgraven 54:10 Gothenburg Office 875
One 0 Sundby Overdrev Copenhagen Residential, ground 0
Two 4 Bovieran Residential production 0
Total 6 22,875
Divestments
One 1 Murmästaren 3 Stockholm Office 16,086
One 1 Skultorp 1:58 Skövde Residential 3,229
One 1 Skultorp 36:1 Skövde Residential 1,229
Two 13 All properties Tidaholm Residential 6,768
Two 1 Jakobsberg 2:2583 Järfälla Other 22,054
Two 1 Eken 14 Sundbyberg Office 8,913
Two 1 Vreten 8 Stockholm Office 11,919
Two 1 Vreten 17 Stockholm Office 6,550
Two 1 Vreten 25 Stockholm Office 12,610
Total 21 89,358

FASTIGHETS AB BALDER · INTERIM REPORT JANUARY-JUNE 2015 11
Distributed by region, %
Gothenburg, 20
Öresund, 8
Project, 19
Stockholm, 53
Retail, 36
Office, 22
Other, 21
Project, 19
Residential, 2
Distributed by property category, %
Balder s participation in the balance sheets of 50 per cent-owned
associated companies
SEKm2015
30 June2014
30 June
Assets
Properties 3,750 2,163
Other assets 9 20
Cash and cash equivalents 69 21
Total assets 3,828 2,205
Shareholders’ equity and liabilities
Equity/shareholder loan 1,415 908
Interest-bearing liabilities 2,218 1,130
Other liabilities 195 167
Total equity and liabilities 3,828 2,205
Balder owns 50 percent of a number of companies where Balder handles the management and administration. For further information, see Balder’s Annual Report for 2014. Balder’s 50 per cent-owned associated companies are shown in the table below. Apart from the 50 per cent-
owned associated companies, Balder owns 44.1 per cent of Collector Bank AB, 29.9 per cent of Sato Oyj and 31 per cent of Tornet Bostadsproduktion. For more information about these associated companies, see each company’s website: Colletor.co, Sato.fi and Tornet.se.
Associated companies
Balder’s participation in the 50 per cent-owned associated companies’ property holdings on 2015-06-30
Number ofproperties
Lettable area,sq.m.
Rental value,SEKm
Rental value,SEK/sq.m.
Rental income,SEKm
Economicoccupancy rate,
%
Carryingamount,
SEKmCarrying
amount, %
Distributed by region
Stockholm 33 95,179 146 1,539 143 98 1,975 53
Gothenburg 12 47,401 50 1,059 47 94 753 20
Öresund 6 21,017 22 1,047 21 95 305 8
Total 51 163,597 219 1,337 211 97 3,032 81
Project 7 – – – – – 718 19
Total 58 163,597 219 1,337 211 97 3,750 100
Distributed by property category
Residential 4 3,461 5 1,319 5 99 84 2
Office 8 33,332 59 1,764 54 93 829 22
Retail 31 91,413 99 1,084 97 97 1,366 36
Other 8 35,391 56 1,588 56 99 754 21
Total 51 163,597 219 1,337 211 97 3,032 81
Project 7 – – – – – 718 19
Total 58 163,597 219 1,337 211 97 3,750 100

12 FASTIGHETS AB BALDER · INTERIM REPORT JANUARY-JUNE 2015
CustomersIn order to limit the risk of lower rental income and conse-quently a weakened occupancy rate, Balder strives to deve-lop long-term relationships with the company’s existing customers. Balder has a good diversification as regards the distribution between commercial properties and residential properties as well as the geographical distribution. The diversification strengthens the possibilities of maintaining a steady and satisfactory occupancy rate.
Balder’s commercial leases have an average lease term of 6.4 years (5.6). Balder’s 10 largest leases represent 10.4 per cent (8.6) of total rental income and the average lease term amounts to 13.2 years (9.7).
No individual lease accounts for more than 1.6 per cent (1.5) of Balder’s total rental income and no individual custo-mer accounts for more than 4.9 per cent (5.6) of total rental income.
Lease maturity structure 2015-06-30
Maturity dateNumber of
leases Proportion, %Contractedrent, SEKm Proportion, %
2015 664 24 121 4
2016 750 28 209 8
2017 531 20 227 9
2018 441 16 195 7
2019– 333 12 835 31
Total 2,719 100 1,587 59
Residential 1) 14,249 1,024 39
Car park 1) 5,280 15 1
Garage 1) 4,708 41 2
Total 26,956 2,667 100
1) Normally runs subject to a period of notice of three months.
Balder s ten largest customersper 2015-06-30
• ICA Sverige AB
• Kopparbergs Bryggerier
• Marriott
• ProfilEvents AB
• Rezidor Hotel Group
• Scandic Hotels AB
• Sirius International
Försäkring AB
• Stockholms Kommun
• Stureplansgruppen
• Winn Hotel Group
SEKm
Rental income
Rental income Rolling annual value
201320122011201020092008200720062005 2014
2500
2000
1500
1000
0
3000
2015
SEKm
Maturity structure of commercial lease contracts
500
400
300
200
100
0
2015 2016
2017 2018
2019 2020
2022 2021
2023−
Annual rental income per maturity

FASTIGHETS AB BALDER · INTERIM REPORT JANUARY-JUNE 2015 13
Financing
Interest maturity structure on 2015-06-30
Fixed interest term
Year SEKm Interest, %Proportion,
%
Within one year 15,213 1.3 60.3
1–2 years 0 – –
2–3 years 1,000 5.1 4.0
3–4 years 2,000 5.3 7.9
4–5 years 0 – –
> 5 years 7,006 3.2 27.8
Total 25,218 2.3 100
Shareholders’ equityConsolidated equity, including Collector Bank AB at market value, amounted to SEK 17,384m (12,486) on June 30 and the equity/assets ratio amounted to 37.4 per cent (34.2). During the period, shareholders equity increased by compre-hensive income for the period of SEK 1,564m (1,370) and the market valuation of the holding in Collector Bank AB SEK 1,776m (–), decreased by SEK 200m (200) regarding divi-dends approved and entered as a liability but still unpaid to the preference shareholders and SEK 17m (–) regarding the aquisition of the minority in Bovieran.
Interest-bearing liabilitiesThe group’s interest-bearing liabilities in respect of proper-ties amounted to SEK 19,595m (19,227) on 30 June, cor-responding to a loan-to-value ratio of 51.5 per cent (57.0). The interest-bearing liabilities consist of bonds of SEK 2,650m (1,800), a certificate programme with a framework amount of SEK 2,000m (1,500) and bilateral bank loans with Nordic banks. Balder’s certificate programme had an out-standing volume of SEK 1,996m (750) on 30 June. On 30 June, Balder’s average interest rate refixing period amoun-ted to 2.7 years (2.5).
The fixed credit term amounted to 3.5 years (4.6) and the average interest rate amounted to 2.3 per cent (2.8), inclu-ding the effect of accrued interest from the interest rate derivative instruments, which are recognised as fixed inte-rest borrowing in the table.
Interest rate derivative instruments are deployed in order to obtain preferred interest rate refixing targets. Derivatives are continually recognised at fair value in the balance sheet with changes in value recognised in the income statement without using hedge accounting. Changes in value amoun-ted to SEK 142m (–292) during the period. The remaining deficit on derivatives, SEK 944m (765), will be released during the remainder of the term and recognised as income. This means that Balder has a reserve of SEK 944m which will be reversed in its entirety to equity, adjusted by deferred tax, concurrently with the expiry of interest rate derivatives. All derivatives are classified as Level 2 according to IFRS 13.
LiquidityThe group’s cash and cash equivalents, financial Invest-ments and unutilised credit facilities amounted to SEK 1,509m (1,455) at the end of the accounting period.
Financial targetsThe proportion of equity is impacted by the chosen level of financial risk which in turn is impacted by lenders’ equity requirements for offering market-based financing. Balder’s financial goals are that the equity/assets ratio shall not be less than 35 per cent over time and that the interest cover-age ratio should not be less than 1.5 times. As of 30 June, the equity/assets ratio was 37.4 per cent (34.2) and the inte-rest coverage ratio was 3.9 times (3.1).
50
60
70
80
90
100
Q4Q3Q2Q1Q4Q3Q2Q1Q4Q3Q2Q1Q4Q3Q2Q1Q4Q3Q2Q1Q4Q3Q2Q1Q4Q3Q2Q1Q4Q3Q2Q1Q4Q3Q2
Loan to value ratio, properties , %
%Loan to value ratio, properties
2005 2008 2009 201020072006 2011 2012 2013 2014
Q3
Q3Q2Q1Q4Q3Q2Q1Q4Q3Q2 Q3Q2Q1Q4Q3Q2Q1Q4Q2
Q4Q3Q2Q1Q4Q3Q2Q1Q4Q3Q2Q1Q4Q3Q2Q1Q4Q3Q2Q1Q4Q3Q2Q1Q4Q3Q2Q1Q4Q3Q2Q1Q4Q3Q2Q1Q4Q3Q2
2015
Q1Q4Q3Q2Q1Q4Q3Q2Q1Q4Q3Q2Q1Q4Q3Q2Q1Q4Q3Q2Q1Q4Q3Q2Q1Q4Q3Q2Q1Q4Q3Q2Q1Q4Q3Q2Q1Q4Q3Q2
Q1Q4Q3Q2Q1Q4Q3Q2Q1Q4Q3Q2Q1Q4Q3Q2Q1Q4Q3Q2Q1Q4Q3Q2Q1Q4Q3Q2Q1Q4Q3Q2Q1Q4Q3Q2Q1Q4Q3Q2
0
10
20
30
40
50
60
70
80
Q4Q3Q2Q1Q4Q3Q2Q1Q4Q3Q2Q1Q4Q3Q2Q1Q4Q3Q2Q1Q4Q3Q2Q1Q4Q3Q2Q1Q4Q3Q2Q1Q4Q3Q2
Fixed interest term, month
Month
2005 2008 2009 201020072006
Fixed interest term
2011 2012 2013 2014
Q1Q4Q3Q2Q1Q4Q3Q2Q1Q4Q3Q2Q1Q4Q3Q2Q1Q4Q3Q2Q1Q4Q3Q2
Q4Q3Q2Q1Q4Q3Q2Q1Q4Q3Q2Q1Q4Q3Q2Q1Q4Q3Q2Q1Q4Q3Q2Q1Q4Q3Q2Q1Q4Q3Q2Q1Q4
2015
Q1Q4Q3Q2Q1Q4Q3Q2Q1Q4Q3Q2Q1Q4Q3Q2Q1Q4Q3Q2Q1Q4Q3Q2Q1Q4Q3Q2Q1Q4Q3Q2Q1Q4Q3Q2Q1Q4Q3Q2
Q2Q1Q4Q3Q2Q1Q4Q3Q2Q1Q4Q3Q2Q1Q4Q3Q2Q1Q4Q3Q2Q1Q4Q3Q2Q1Q4Q3Q2Q1Q4Q3Q2Q1Q4Q3Q2Q1Q4Q3Q2
Financial targetsTarget Outcome
Equity/assets ratio, % 35.0 37.4
Interest coverage ratio, times 1.5 3.9

14 FASTIGHETS AB BALDER · INTERIM REPORT JANUARY-JUNE 2015
Events after the end of the periodBalder has obtained building permit for construction of 600 new condominiums in Copenhagen, which will be rented out. Balder will invest SEK 1,900m until the last quarter of 2018. Approximately 160 apartments are built in Örestad Syd, where Balder already owns apartments, and the remaining apartments are built in Amager overlooking Öre-sund. Balder has divested Oden 7 in Trollhättan, at a pro-perty value of SEK 184m. In connection with the divest-ment, Balder has subscribed for shares in Agora AB amounting to SEK 74m.
Related party transactionsBalder receives fees from associated companies and Erik Selin Fastigheter AB for property and company manage-ment services. These fees amounted to SEK 13m (12) during the period and are recognised in management and administrative costs.
Risks and uncertaintiesBalder’s operations, financial position and result may be affected by a number of risks and uncertainty factors. These are described in the Annual Report for 2014, on pages 46-49. Since year-end acquisitions has been made in Finland, which means that a currency position has occurred. Otherwise, no significant changes has been noted.
Accounting policiesBalder applies IFRS (International Financial Reporting Stan-dards) as adopted by the European Union in its consolida-ted accounts and the interpretations of these (IFRIC). This interim report is prepared in accordance with IAS 34, Inte-rim Financial Reporting. In addition, relevant provisions of the Swedish Annual Accounts Act and the Swedish Securi-ties Markets Act have also been applied. The parent com-pany has prepared its financial statements in accordance
with the Annual Accounts Act, the Securities Markets Act and RFR 2, Accounting for Legal Entities.
The accounting policies and calculation methods applied are unchanged compared with the Annual Report for 2014.
The interpretation IFRIC 21 Levies described in the Annual Report for 2014 has been adopted by the EU. IFRIC 21 Levies has therefore been applied by the Group in this interim report, which means that debt accounting of all of the remaining property tax for 2015 has been made.
This interim report has not been subject to review by the company’s auditors.
Signature and verificationThe Board of Directors and the CEO declare that the under-signed interim report provides a true and fair overview of the parent company's and the group's operations, financial position and performance as well as describing material risks and uncertainties facing the parent company and other companies in the group.
Gothenburg, 21 August 2015
Christina RogestamChairman of the Board
Fredrik Svensson Sten DunérBoard member Board member
Anders Wennergren Erik SelinBoard member Board member and CEO
Other disclosures

FASTIGHETS AB BALDER · INTERIM REPORT JANUARY-JUNE 2015 15
Consolidated statement of comprehensive income
SEKm2015
April-June2014
April-June2015
Jan–June2014
Jan–June2014/2015
July–June2014
Jan–dec
Rental income 685 627 1,370 1,193 2,703 2,525
Property costs –204 –191 –438 –408 –790 –760
Net operating income 481 436 932 785 1,912 1,766
Changes in value of properties, realised 70 103 70 112 102 144
Changes in value of properties, unrealised 321 950 723 1,189 2,440 2,906
Other income/costs 0 0 –1 – –1 –
Property and administrative costs –47 –38 –91 –78 –167 –154
Participations in the profits of associated companies 275 157 326 190 453 317
Operating profit 1,101 1,607 1,959 2,197 4,739 4,977
Net financial items –121 –142 –259 –257 –533 –531
Changes in value of derivates 321 –179 142 –303 –179 –624
Profit before tax 1,300 1,286 1,842 1,637 4,027 3,822
Current tax –3 –2 –4 –2 –13 –11
Deferred tax –137 –197 –244 –266 –660 –682
Net profit for the period/year 1,160 1,087 1,595 1,370 3,354 3,128
Other comprehensive income – items that will be
transferred to net profit
Translation difference –18 0 –30 0 –14 16
Participation in other comprehensive income of
associated companies –4 0 –2 0 –1 1
Total comprehensive income for the period/year 1,138 1,087 1,564 1,370 3,339 3,145
Profit from property management before tax, SEKm 439 303 763 537 1,501 1,275
Profit from property management before
tax per ordinary share, SEK 2.40 1.56 4.08 2.71 8.01 6.64
Profit after tax per ordinary share, SEK 6.84 6.39 9.21 7.88 19.42 18.10
All of the comprehensive income for the period/year accrues to the parent company’s shareholders.There is no dilutive effect as no potential shares arise.

16 FASTIGHETS AB BALDER · INTERIM REPORT JANUARY-JUNE 2015
Consolidated statement of financial positionSEKm
2015 30 June
201430 June
2014 31 Dec
Assets
Investment properties 38,071 33,717 37,382
Other fixed assets 93 100 96
Participations in associated companies 1) 4,275 1,033 1,489
Other receivables 2) 1,158 969 760
Cash and cash equivalents and financial investments 1,159 656 456
Total assets 44,756 36,475 40,185
Shareholders’ equity and liabilities
Shareholders’ equity 15,608 12,486 14,261
Deferred tax liability 1,789 1,127 1,549
Interest-bearing liabilities 3) 25,218 21,178 22,378
Derivatives 944 765 1,086
Other liabilities 1,197 919 910
Total equity and liabilities 44,756 36,475 40,185
1) Collector’s consolidated value (Collector’s market value amounted to SEK 2,653m).2) Of which most part refers to receivables in associated companies. 3) Of which interest-bearing liabilities in respect of properties.
877
19,595 19,227 20,317
Consolidated statement of changes in equityAttributable to the Parent Company’s shareholders, SEKm
2015 30 June
201430 June
2014 31 Dec
Opening equity 14,261 11,196 11,196
Dividend for preference shares –200 –300 2) –3001)
Disposal of treasury shares – 220 220
Acquisition of non-controlling interests –17 – –
Net profit for the period/year 1,564 1,370 3,145
Closing equity 15,608 12,486 14,261
1) Of which paid SEK 200m.2) Of which paid SEK 100m.

FASTIGHETS AB BALDER · INTERIM REPORT JANUARY-JUNE 2015 17
Consolidated statement of cash flowsSEKm
2015 April-June
2014 April-June
2015Jan-June
2014Jan-June
2014 Jan–Dec
Net operating income 481 436 932 785 1,766
Other income/costs 0 – –1 – –
Management and administrative expenses –47 –38 –91 –78 –154
Reversal of depreciation 4 5 8 8 18
Adjustment item –2 –1 –9 –1 11
Net financial items paid –160 –160 –333 –286 –591
Taxes paid –3 – –3 – –11
Cash flow from operating activitiesbefore change in working capital 273 242 503 429 1,038
Change in operating receivables –103 –23 –383 –80 148
Change in operating liabilities 115 22 193 88 155
Cash flow from operating activities 285 241 313 437 1,340
Acquisition of properties –204 –3,964 –944 –5,128 –6,835
Acquisition of property, plant and equipment –3 0 –5 –1 –6
Purchase of financial investments –300 –44 –300 –44 –144
Acquisition of shares in associated companies –2,530 –6 –2,548 –92 –420
Investment in existing properties and projects –244 –193 –386 –403 –700
Acquisition, liquidity – 19 – 19 19
Sale of properties 921 876 1,425 922 1,114
Sale of financial investments 36 2 192 212 219
Acquisition of non-controlling interests –17 – –17 – –
Dividend paid from associated companies – 45 – 45 45
Cash flow from investing activities –2,341 –3,266 –2,583 –4,470 –6,708
Dividend paid for preference shares –50 –50 –100 –100 –200
Loans raised 2,464 3,680 3,738 5,114 6,575
Disposal of treasury shares – – – 220 220
Amortisation/redemption of loans
sold properties/changes in overdraft facilities –456 –404 –801 –901 –1,237
Cash flow from financing activities 1,958 3,225 2,837 4,333 5,359
Cash flow for the period/year –99 200 567 300 –8
Cash and cash equivalents at the start of the
period/year 865 308 199 208 208
Cash and cash equivalents at the end of the
period/year 766 508 766 508 199
Unutilised credit facilities 350 800 350 800 350
Financial investments 393 147 393 147 257

18 FASTIGHETS AB BALDER · INTERIM REPORT JANUARY-JUNE 2015
SEKm2015
April-June2014
April-June2015
Jan-June2014
Jan-June2014/2015
July-June2014
Jan–Dec
Rental income
Stockholm 222 183 443 341 867 765
Gothenburg/West 234 215 468 417 908 857
Öresund 100 98 201 188 415 402
East 88 93 176 172 349 345
North 41 39 82 74 164 156
Total 685 627 1,370 1,193 2,703 2,525
Net operating income
Stockholm 169 134 326 243 657 574
Gothenburg/West 162 144 313 271 624 582
Öresund 74 71 143 130 307 294
East 50 62 103 99 223 219
North 26 25 47 42 102 97
Total 481 436 932 785 1,913 1,766
The group’s internal reporting of operations is divided into the above segments. Total net operating income corresponds with reported net operating income in the income statement. The difference between net operating income of SEK 932m (785) and profit before tax of SEK 1,842m (1,637) con-sists of changes in value of properties of SEK 793m (1,301), other income/costs SEK –1m (–), management and administrative costs of SEK –91m (–78), participations in profits of associated companies of SEK 326m (190), net financial items of SEK –259m (–257) and changes in value of derivatives of SEK 142m (–303).
The carrying amounts of properties increased during the period by SEK 63m in the Stockholm region, SEK 285m in the Gothenburg/West region, SEK 241m in the Öresund region, SEK 76m in the North region and reduced by SEK 24m in the East region. The property holdings in Finland are reported in East region.
Segment information
FASTIGHETS AB BALDER · INTERIM REPORT JANUARY-JUNE 2015 19
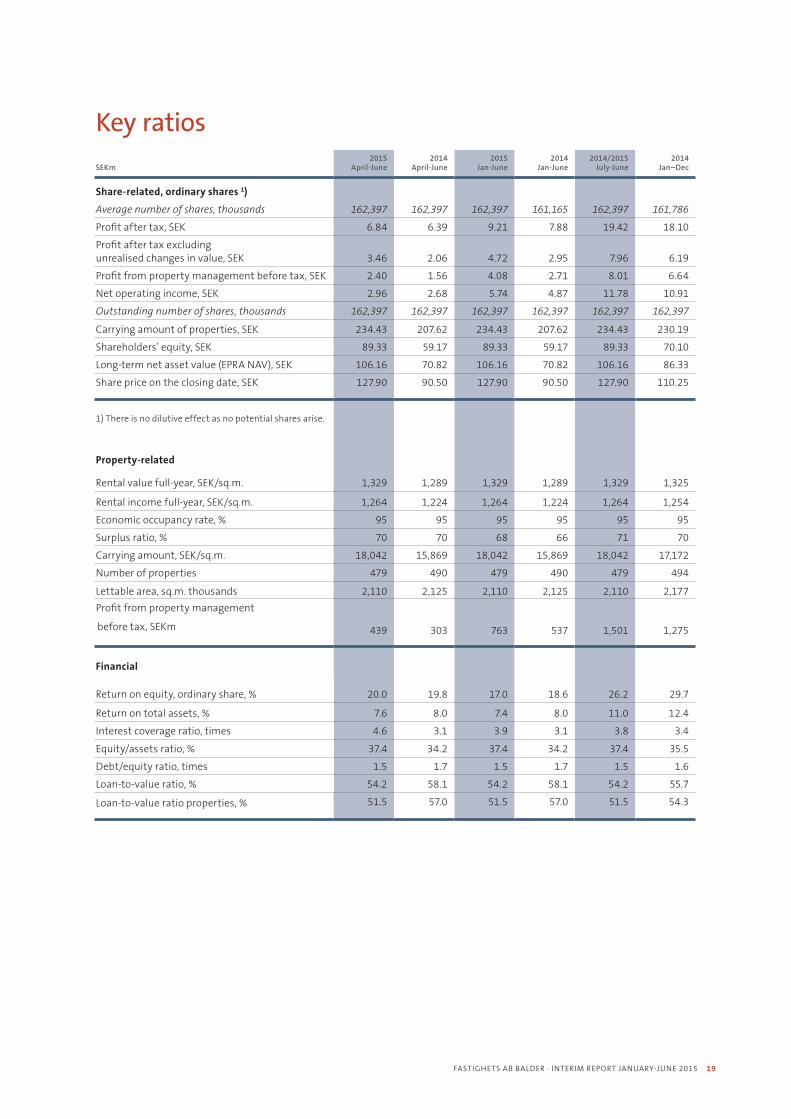
Key ratios
SEKm2015
April-June2014
April-June2015
Jan-June2014
Jan-June2014/2015
July-June2014
Jan–Dec
Share-related, ordinary shares 1)
Average number of shares, thousands 162,397 162,397 162,397 161,165 162,397 161,786
Profit after tax, SEK 6.84 6.39 9.21 7.88 19.42 18.10
Profit after tax excludingunrealised changes in value, SEK 3.46 2.06 4.72 2.95 7.96 6.19
Profit from property management before tax, SEK 2.40 1.56 4.08 2.71 8.01 6.64
Net operating income, SEK 2.96 2.68 5.74 4.87 11.78 10.91
Outstanding number of shares, thousands 162,397 162,397 162,397 162,397 162,397 162,397
Carrying amount of properties, SEK 234.43 207.62 234.43 207.62 234.43 230.19
Shareholders’ equity, SEK 89.33 59.17 89.33 59.17 89.33 70.10
Long-term net asset value (EPRA NAV), SEK 106.16 70.82 106.16 70.82 106.16 86.33
Share price on the closing date, SEK 127.90 90.50 127.90 90.50 127.90 110.25
1) There is no dilutive effect as no potential shares arise.
Property-related
Rental value full-year, SEK/sq.m. 1,329 1,289 1,329 1,289 1,329 1,325
Rental income full-year, SEK/sq.m. 1,264 1,224 1,264 1,224 1,264 1,254
Economic occupancy rate, % 95 95 95 95 95 95
Surplus ratio, % 70 70 68 66 71 70
Carrying amount, SEK/sq.m. 18,042 15,869 18,042 15,869 18,042 17,172
Number of properties 479 490 479 490 479 494
Lettable area, sq.m. thousands 2,110 2,125 2,110 2,125 2,110 2,177
Profit from property management
before tax, SEKm 439 303 763 537 1,501 1,275
Financial
Return on equity, ordinary share, % 20.0 19.8 17.0 18.6 26.2 29.7
Return on total assets, % 7.6 8.0 7.4 8.0 11.0 12.4
Interest coverage ratio, times 4.6 3.1 3.9 3.1 3.8 3.4
Equity/assets ratio, % 37.4 34.2 37.4 34.2 37.4 35.5
Debt/equity ratio, times 1.5 1.7 1.5 1.7 1.5 1.6
Loan-to-value ratio, % 54.2 58.1 54.2 58.1 54.2 55.7
Loan-to-value ratio properties, % 51.5 57.0 51.5 57.0 51.5 54.3

20 FASTIGHETS AB BALDER · INTERIM REPORT JANUARY-JUNE 2015
Condensed parent company income statement
SEKm2015
April-June2014
April-June2015
Jan-June2014
Jan-June2014/2015
July-June2014
Jan–Dec
Net sales 36 23 69 52 141 124
Administrative expenses –42 –30 –80 –62 –158 –139
Operating profit –6 –6 –11 –9 –17 –16
Profit from financial items
Dividends from subsidiaries 800 700 800 700 800 700
Other net financial items 100 93 210 157 391 338
Changes in value of derivatives 307 –165 130 –276 –180 –585
Profit before appropriations and
taxes 1,201 622 1,129 572 995 438
Appropriations
Group contributions paid/received – – – – –250 –250
Profit before tax 1,201 622 1,129 572 745 188
Deferred tax –88 20 –73 31 11 115
Net profit for the period/year 1,113 642 1,057 603 756 302
Condensed parent company balance sheet
SEKm2015
30 June2014
30 June2014
Jan–Dec
Assets
Property, plant and equipment 21 23 22
Financial non-current assets 3,142 3,026 3,193
Receivables from group companies 18,413 14,075 15,777
Current receivables 76 19 8
Cash and cash equivalents and financial investments 1,022 498 422
Total assets 22,673 17,640 19,422
Shareholders’ equity and liabilities
Shareholders’ equity 7,354 6,798 6,497
Interest-bearing liabilities 9,988 7,107 7,843
Liabilities to group companies 4,220 2,855 3,952
Derivatives 806 626 936
Other liabilities 306 253 194
Total equity and liabilities 22,673 17,640 19,422

FASTIGHETS AB BALDER · INTERIM REPORT JANUARY-JUNE 2015 21
Balder’s shares are listed on NASDAQ Stockholm, Large Cap segment. Balder has two listed classes of shares, an ordinary Class B share and a preference share, which pays a dividend of SEK 5 per quarter. The company’s market capitalisation as of 30 June amounted to SEK 24,028m (18,267).
The principal owner in Fastighets AB Balder is Erik Selin Fastigheter AB, which owns 38.0 per cent (38.0) of the capi-tal and 51.3 per cent (51.3) of the votes. Foreign ownership amounts to approximately 17 per cent (18) of outstanding shares.
Ordinary sharesAt the end of the period, approximately 8,413 shareholders (9,275) held ordinary shares. During the period, 35 million shares were traded (35) which corresponds to an average of about 288,000 shares per trading day (285,000). The annual turnover rate amounted to 43 per cent (42). The price of the ordinary share was SEK 127.90 (90.50) on 30 June, cor-responding to a rise of 16 per cent since year-end.
Preference sharesAt the end of the period, approximately 8,266 shareholders (8,242) held preference shares. During the period approx-imately 1.8 million shares were traded (1.7), which cor-responds to an average of about 15,000 shares per trading day (14,000). The annual turnover rate amounted to 37 per cent (34). On 30 June, the market value of the preference share was SEK 325.70 (357.50), corresponding to a decrease of 7 per cent since year-end and a total return of –4 per
cent since year-end.
Share capitalOn 30 June, the share capital in Balder amounted to SEK
172,396,852 distributed among 172,396,852 shares. Each share has a quota value of SEK 1.00, whereof 11,229,432 shares are of Class A, 151,167,420 of Class B and 10,00,000 preference shares. The total number of outstanding shares amounts to 172,396,852. Each Class A share carries one vote and each Class B share and preference share carries one tenth of one vote.
Annual General MeetingThe Annual General Meeting (AGM) of Fastighets AB Balder on 6 May 2015, resolved on the following matters, among others:
The AGM adopted the annual accounts for 2014 and resolved on a dividend of SEK 20 per preference share and that no dividend shall be declared to the ordinary sharehol-ders.
The AGM discharged the Board and the CEO from liability and reelected the Board members Christina Rogestam, Erik Selin, Fredrik Svensson, Sten Dunér and Anders Wennergren according to the nomination committee’s proposal. Chris-tina Rogestam was elected as Chairman.
The meeting resolved to authorise the Board, during the period until the next Annual General Meeting, on one or more occasion, to be able to decide on a new issue of not more than 5,000,000 preference shares and/or shares of Class B corresponding to not more than 10 per cent of the existing share capital.
The AGM further resolved during the period until the next Annual General Meeting, to authorise the Board on one or more occasion, firstly, to decide on acquisition of own shares of Class B but that the combined holdings of own shares in the company may not exceed 10 per cent of all shares in the company and, secondly, to decide on assign-ment of the company’s holdings of its own Class B shares.
The share and owners
0,00
20,00
40,00
60,00
80,00
100,00
120,00
140,00
160,00
Jan-
06
Apr-
06
Jul-0
6
Oct
-06
Jan-
07
Apr-
07
Jul-0
7
Oct
-07
Jan-
08
Apr-
08
Jul-0
8
Oct
-08
Jan-
09
Apr-
09
Jul-0
9
Oct
-09
Jan-
10
Apr-
10
Jul-1
0
Oct
-10
Jan-
11
Apr-
11
Jul-1
1
Oct
-11
Jan-
12
Apr-
12
Jul-1
2
Oct
-12
Jan-
13
Apr-
13
Jul-1
3
Oct
-13
Jan-
14
Apr-
14
Jul-1
4
Oct
-14
Jan-
15
Apr-
15
Jul-1
5
Fastighets AB Balder, 825 %
EPRA Europe Index, 1,9 %
EPRA Sweden Index, 67,6 %
Share price
22 FASTIGHETS AB BALDER · INTERIM REPORT JANUARY-JUNE 2015
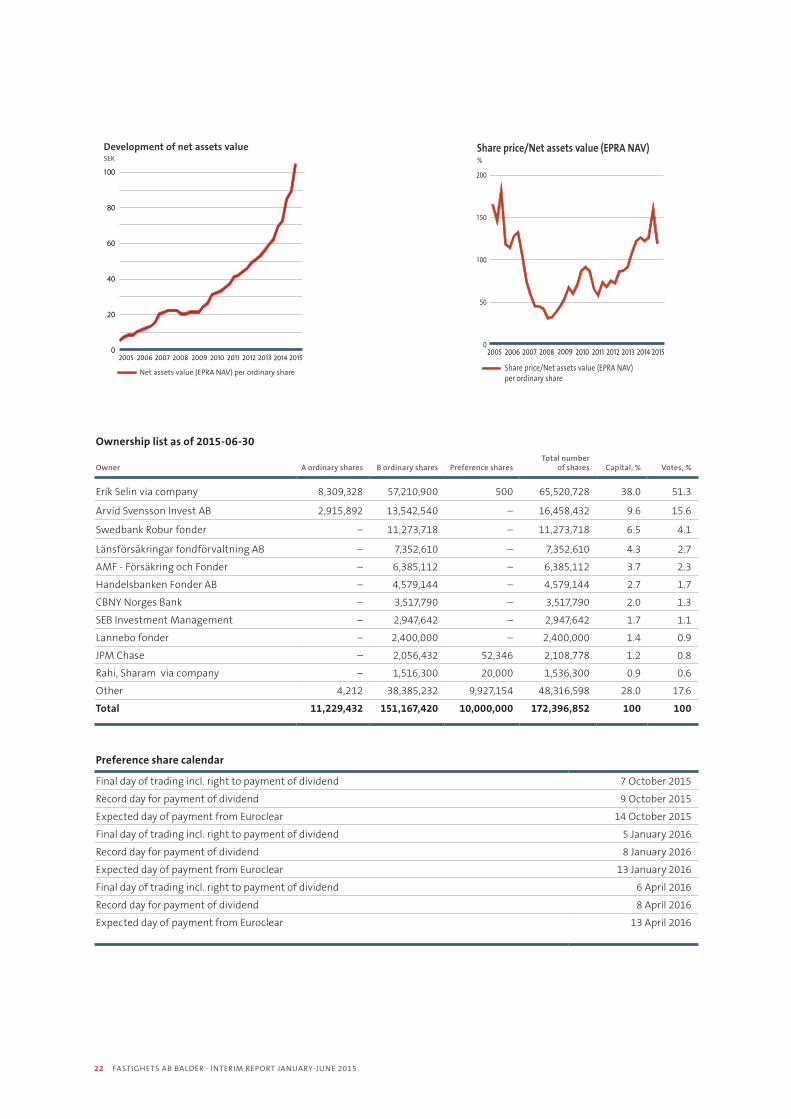
Ownership list as of 2015-06-30
Owner A ordinary shares B ordinary shares Preference sharesTotal number
of shares Capital, % Votes, %
Erik Selin via company 8,309,328 57,210,900 500 65,520,728 38.0 51.3
Arvid Svensson Invest AB 2,915,892 13,542,540 – 16,458,432 9.6 15.6
Swedbank Robur fonder – 11,273,718 – 11,273,718 6.5 4.1
Länsförsäkringar fondförvaltning AB – 7,352,610 – 7,352,610 4.3 2.7
AMF - Försäkring och Fonder – 6,385,112 – 6,385,112 3.7 2.3
Handelsbanken Fonder AB – 4,579,144 – 4,579,144 2.7 1.7
CBNY Norges Bank – 3,517,790 – 3,517,790 2.0 1.3
SEB Investment Management – 2,947,642 – 2,947,642 1.7 1.1
Lannebo fonder – 2,400,000 – 2,400,000 1.4 0.9
JPM Chase – 2,056,432 52,346 2,108,778 1.2 0.8
Rahi, Sharam via company – 1,516,300 20,000 1,536,300 0.9 0.6
Other 4,212 38,385,232 9,927,154 48,316,598 28.0 17.6
Total 11,229,432 151,167,420 10,000,000 172,396,852 100 100
Preference share calendar
Final day of trading incl. right to payment of dividend 7 October 2015
Record day for payment of dividend 9 October 2015
Expected day of payment from Euroclear 14 October 2015
Final day of trading incl. right to payment of dividend 5 January 2016
Record day for payment of dividend 8 January 2016
Expected day of payment from Euroclear 13 January 2016
Final day of trading incl. right to payment of dividend 6 April 2016
Record day for payment of dividend 8 April 2016
Expected day of payment from Euroclear 13 April 2016
Net assets value (EPRA NAV) per ordinary share
SEK
Development of net assets value
Q2Q1Q4Q3Q2Q1Q4Q3Q2Q1Q4Q3Q2Q1Q4Q3Q2Q1Q4Q3Q2Q1Q4Q3Q2Q10
20
40
60
80
100
Q1Q4Q3Q2Q1Q4Q3Q2Q1Q4Q3Q2Q1Q4Q3Q2Q1Q4Q3Q2Q1Q4Q3Q2Q1Q4Q3Q2Q1Q4Q3Q2Q1Q4Q3Q22005 2008 2009 201020072006 2011 2012 2013 2014 2015
0
50
100
150
200
Q1Q4Q3Q2Q1Q4Q3Q2Q1Q4Q3Q2Q1Q4Q3Q2Q1Q4Q3Q2Q1Q4Q3Q2Q1Q4Q3Q2Q1Q4Q3Q2Q1Q4Q3
Share price/Net assets value (EPRA NAV) per ordinary share
%
2005 2008 2009 201020072006
Share price/Net assets value (EPRA NAV)
2011 2012 2013 2014Q1
Q4Q3Q2Q1Q4Q3Q2Q1Q4Q3Q2Q1Q4Q3Q2Q1Q4Q3Q2Q1Q4Q3Q2Q1Q4Q3Q2Q1Q4Q3Q2Q1Q4Q3Q2Q1Q4
Q4Q3Q2Q1Q4Q3Q2Q1Q4Q3Q2Q1Q4Q3Q2Q1Q4Q3Q2Q1Q4Q3Q2Q1Q4Q2Q1Q4Q3Q2Q1Q4Q32015Q1Q4Q3Q2Q1Q4Q3Q2Q1Q4Q3Q2Q1Q4Q3Q2Q1Q4Q3Q2Q1Q4Q3Q2Q1Q4Q3Q2Q1Q4Q3Q2Q1Q4Q3Q2Q1Q4Q3

FASTIGHETS AB BALDER · INTERIM REPORT JANUARY-JUNE 2015 23
FINANCIALS
Return on equity, ordinary share, % 1)
Profit after tax reduced by preference share dividend for the period in relation to average equity after deduction of the preference capital. The values were con-verted to a full-year basis in the interim accounts without taking account of seasonal variations that normally arise in the operations with the exception of changes in value.
Return on total assets, % 1)
Profit before tax with addition of net financial items in relation to average balance sheet total. The values were con-verted to a full-year basis in the interim accounts without taking account of seasonal variations that normally arise in the operations with the exception of changes in value.
Loan-to-value ratio, % 1)
Interest-bearing liabilities at the end of the period in relation to total assets at the end of the period.
Loan-to-value ratio properties, %Interest-bearing liabilities with direct or indirect collateral in properties in rela-tion to the fair value of the properties.
Profit from property management before tax, SEKmProfit before tax with reversal of changes in value and other income/costs. Reversal of changes in value and tax as regards participation in profits of associated companies also takes place.
Interest coverage ratio, timesProfit before tax with reversal of net financial items, changes in value and changes in value and tax as regards parti-cipation in profits of associated compa-nies, in relation to net financial items.
Debt/equity ratio, times 1)
Interest-bearing liabilities in relation to shareholders’ equity.
Equity/assets ratio, % 1)
Shareholders’ equity including minority in relation to the balance sheet total at the end of the period.
SHARE RELATED
Equity per ordinary share, SEK 1)
Shareholders’ equity in relation to the number of outstanding ordinary shares at the end of the period after deduction of the preference capital.
Equity per preference share, SEKShareholders equity’ per preference share is equivalent to the average subs-cription price of the preference share of SEK 287.70 per share.
Profit from property management per ordinary share, SEKProfit from property management redu-ced by preference share dividend for the period divided by the average number of outstanding ordinary shares.
Average number of sharesThe number of outstanding shares at the start of the period, adjusted by the num-ber of shares issued during the period weighted by the number of days that the shares have been outstanding in relation to the total number of days during the period.
Net asset value per ordinary share (EPRA
NAV), SEK 1)
Equity per ordinary share with reversal of interest rate derivatives and deferred tax according to balance sheet.
Profit after tax per ordinary share, SEKProfit attributable to the average num-ber of ordinary shares after consideration of the preference share dividend for the period.
PROPERTY RELATEDYield, % Estimated net operating income on an annual basis in relation to the fair value of the properties at the end of the period.
Net operating income, SEKmRental income less property costs.
Economic occupancy rate, %Contracted rent for leases which are run-ning at the end of the period in relation to rental value.
Property categoryClassified according to the principal use of the property. The break-down is made into office, retail, residential and other properties. Other properties include hotel, educational, care, industrial/ware-house and mixed-use properties. The property category is determined by what the largest part of the property is used for.
Property costs, SEKmThis item includes direct property costs, such as operating expenses, utility expenses, maintenance, ground rent and property tax.
Rental value, SEKmContracted rent and estimated market rent for vacant premises.
Surplus ratio, %Net operating income in relation to ren-tal income
Definitions
1) The Consolidated Statement of Financial Position, including Collector Bank AB at market value, has been used for calculating key ratios.

24 FASTIGHETS AB BALDER · INTERIM REPORT JANUARY-JUNE 2015
ContactFor additional information, please contact CEO Erik Selin,telephone +46 706 074 790 or CFO Magnus Björndahl,telephone +46 735 582 929.
Financial informationOverall information about the company’s operations, boardof directors and management, financial reporting and pressreleases, may be found on Balder’s website, www.balder.se.
CalendarInterim Report Jan-Sep 2015 4 November 2015Year-end report 2015 18 February 2016
Fastighets AB Balder (publ) www.balder.se · [email protected] · Org.nr 556525-6905
Head office Vasagatan 54 · Box 53 121 · 400 15 Gothenburg · Tel +46 31-10 95 70 · Fax +46 31-10 95 99
Regional offices
Stockholm Drottninggatan 108 · 113 60 Stockholm · Tel +46 8-73 53 770
Vårby Allé 14 · 143 40 Vårby · Tel +46 8-73 53 770
Gothenburg
/West Wetterlinsgatan 11G · 521 34 Falköping · Tel +46 515-72 14 80
Timmervägen 9A · 541 64 Skövde · Tel +46 500-47 88 50
Vasagatan 54 · Box 53 121 · 400 15 Göteborg · Tel +46 31-10 95 70
Öresund Esplanaden 15 · 265 34 Åstorp · Tel +46 42-569 40
Gustav Adolfs Torg 8 · 252 25 Helsingborg · Tel +46 42-17 21 30
Kalendegatan 26 · 211 35 Malmö · Tel +46 40-600 96 50
East Hospitalsgatan 11 · 602 27 Norrköping · Tel +46 11-15 88 90
Kapellgatan 29 A · 732 45 Arboga · Tel +46 589-194 50
Rönnbergagatan 10 · 723 46 Västerås · Tel +46 21-14 90 98
Storgatan 51 · 573 32 Tranås · Tel +46 140-654 80
Tunadalsgatan 6 · 731 31 Köping · Tel +46 221-377 80
North Forskarvägen 27 · 804 23 Gävle · Tel +46 26-54 55 80
Sandbäcksgatan 5 · 653 40 Karlstad · Tel +46 54-14 81 80
Tallvägen 8 · 854 66 Sundsvall · Tel +46 60-55 47 10
Letting Tel +46 20-151 151
Customer service Tel +46 774-49 49 49
The information in this report is such that Fastighets ABBalder (publ) is obliged to disclose according to the SwedishSecurities Markets Act and/or the Swedish Financial Instru-ments Trading Act. This information has been published at 14 p.m. on August 21, 2015.
This report is a translation of the SwedishInterim Report January–June 2015. In the event of any disparities between this report and the Swedish version, the latter will have priority.