satellite imagery for classification of rice growth phase ... journal... · satellite imagery for...
TRANSCRIPT

Satellite Imagery for Classification of Rice Growth Phase Using Freeman Decomposition in Indramayu, West Java, Indonesia
Rian Nurtyawan1,2, Asep Saepuloh1,2, Agung Budi Harto1,2, Ketut Wikantika1,2,3*, Akihiko Kondoh4
1Centre for Remote Sensing (CRS), Bandung Institute of Technology (ITB), Bandung, Indonesia2Faculty of Earth Sciences and Technology, Bandung Institute of Technology (ITB), Bandung, Indonesia3ForMIND Institute (Indonesian Young Researcher Forum), Bandung, Indonesia4Center for Environmental Remote Sensing, Chiba University, Japan
1. Introduction
The rice is one of the most important staple foods for a large part of the world. Monitoring its bio-physical variables is valuable for agricultural management and yield prediction (Koppe et al. 2013). With the increase in global food and energy demand, studies on paddy plants aim to provide direct or indirect information for researches on food security, water resource management, and environ-mental sustainability (Wang et al. 2015). The availability of adequate food is the condition of the fulfillment of food needs for households both from the amount and quality, safe, equitable and affordable. Food security can be achieved if food sources from land and sea can be guaranteed continuously. The primary food source for more than half of the world’s population is rice (Oryza sativa) generally a significant proportion of
the intake of other nutrients as well. Food security for Indonesia is closely related to the adequacy of rice supply (Suwarno 2010). The rice is one of the important crops in developing countries since rice is a global staple food for humans supplying a large fraction of the needs for energy-rich materials. Demand for rice is projected to increase by nearly 70% until 2025 (Bouvet et al. 2009). The decline of rice harvested area caused by population increase and intensification of economic development. Changes paddy cropland distribution and management such multi-cropping, water management, fertilizer use, and cultivars are predicted to increase over the coming decades. Understanding the growth phases of the rice growth cycle is crucial in explaining their effect on the SAR system responses (Yuzugullu et al. 2017). The most common rice cultivation practice begins by flooding the fields several weeks before sowing. Rice growing phase is commonly divided into three phases, which consist of a total of ten growth stages. The first phase is the vegetative phase from germination to panicle
ABSTRACT
Monitoring at every growth of rice plants is an important information for determining the grain pro-duction estimation of rice. Monitoring must to be have timely work on the rice plant development. However, timely monitoring and the high accuracy of information is a challenge in remote sensing based on rice agriculture monitoring and observation. With increased quality of synthetic aperture radar (SAR) systems utilizing polarimetric information recently, the development and applications of polarimetric SAR (PolSAR) are one of the current major topics in radar remote sensing. The ad-vantages provided by PolSAR data for agricultural monitoring have been extensively studied for applications such as crop type classification and mapping, crop phenology monitoring, productivity assessment based on the sensitivity of polarimetric parameters to indicators of crop conditions. Freeman and Durden successfully decomposed fully PolSAR data into three components: Single bounce, double bounce, and volume scattering. The three-component scattering provide features for distinguishing between different surface cover types. These sensitivities assist in the identification of growing phase. The observed growing phase development in time series, reflected in the consistent temporal trends in scattering, was generally in agreement with crop phenological development stages. Supervised classification was performed on repeat-pass Radarsat-2 images, with an overall classification accuracy of 77.27% achieved using time series Fine beam data. The study demonstrated that Radarsat-2 Fine mode data provide useful information for crop monitoring and classification of rice plants.
ARTICLE INFO
Article history:Received February 10, 2017Received in revised form November 17, 2017Accepted December 20, 2017
KEYWORDS:Growing phase of rice plants; Freeman-Durden Decomposition Model; Classification of Freeman-Durden Decomposition
Vol. 25 No. 3, July 2018 126-137DOI:10.4308/hjb.25.3.126
ISSN : 1978-3019
* Corresponding Author. E-mail Address: [email protected]
Copyright ©2018 Institut Pertanian Bogor

initiation. The second phase is the reproductive phase consists of the panicle initiation, heading, and flowering stages. The Ripening is the final phase with its milk, dough and mature grain stages (Datta 1981). These stages coincide with changes in growing phase of rice plant that affected by the interaction between surface and microwaves thus can be observed with remote sensing data. Multi temporal remote sensing techniques provide valuable information for the mapping of rice plant and distinguishing rice plant from other land-cover types by monitoring changes in plant morphology (Nguyen et al. 2015). Accurate and timely information on the type of the crop grown and the crop growth conditions are essential parameters for crop production estimations. These estimations are needed for guiding the decision makers in formulating optimal strategies for planning, distribution, marketing, transportation and storage of the essential agricultural product (Taghvakish 2012). Monitoring at every growth of rice plants is an important information for determining the grain production estimation of rice. However, timely monitoring and the high accuracy of information is a challenge in remote sensing based on rice agriculture monitoring and observation. As compared to optical sensors, spaceborne radar synthetic aperture (SAR) instruments can overcome optical inherent limitations of systems owing to its all-weather, day and capabilities night acquisition and sensitivity to surface characteristics (Koppe et al. 2013). Most paddy rice is planted in warm and humid regions in the world, frequent cloud cover or rainfall often occurs in rice growing season (Jing et al. 2013). Synthetic aperture radar (SAR) has great potential, especially in monsoon Asia, since optical observations are often hampered by cloudy conditions. SAR images are useful for classifying rice paddy fields because of the unique specular feature of flooded conditions (Inoue et al. 2002). With the high resolution of spatial and temporal polarimetric data such as Radarsat-2 along with the support of statistical data from the agricultural department and field survey, the issue will be solved (Aishah et al. 2016). Polarimetric SAR data has proved to provide more information on grounds targets than single and multipolarization SAR data because they include both magnitude and phase information. RADATSAT-2 quad-polarization data possess the capability of polarimetric SAR with high spatial resolution, which suggest that it produce more information on rice growth (Chen et al. 2014). Radarsat-2 quad polarimetric consist of more information on the electromagnetic scattering characteristics of the terrain targets compared to conventional single, dual or quad polarization. SAR data Polarimetric decomposition of Radarsat-2 quad polarimetric acquisitions showed promising results regarding not only the binary rice/non-rice classification of images but also the detection growing phase of rice plant (Nguyen et al. 2015).
The SAR capabilities in data acquisition for tropical condition is the most significant advantages for ground surface mapping (Nurtyawan et al. 2016). SAR is an active sensor that transmitted from the sensor toward the terrain, and recorded by the remote sensor’s receiver. SAR is not limited by cloud coverage in tropical and subtropical regions where most rice is grown. SAR has become an indispensable tool which can provide timely and consistent spatial and temporal coverage needed at regional to global scales that capable for monitoring changes in the rice production area and cultivation intensity. The selection of appropriate sensor parameters is crucial for agricultural monitoring. For instance, with SAR systems, one should match the size of the structural parts of the crops with the available wavelength (frequency) of the system to identify the effects of morphological changes (Yuzugullu et al. 2017). The backscatter behavior of rice as function of time is so unique that it can be used to distinguish rice from other crops that can be analyzed the correlation between backscattering coefficient and rice growth parameters from multi-temporal Radarsat-2 polarimetric SAR images (Fan et al. 2015). The backscattering response from natural surfaces and to retrieve the surface parameters such as dielectric permittivity and surface roughness have been undertaken in microwave remote sensing studies (Nurtyawan et al. 2018) . In agricultural fields radar backscattering are also affected by vegetation cover, plant water content, and crop residue (Nurtyawan et al. 2016). The biophysical and quantitative approach of SAR-based technology is very powerful for rice vegetation observation. The quality of synthetic aperture radar (SAR) systems increased with utilizing polarimetric information recently, the development and applications of polarimetric SAR (PolSAR) are one of the current major topics in radar remote sensing. In recent years, the advantages provided by PolSAR data for agricultural monitoring have been extensively studied for applications such as crop-type classification and mapping, crop phenology monitoring, productivity assessment based on the sensitivity of polarimetric parameters to indicators of crop conditions (Yang et al. 2014). The polarimetric decomposition is a useful technique to interpret physically the scattering mechanisms present in the scene when fully PolSAR data are available (Xie et al. 2016). PolSAR is a well-established technique that allows identification and separation of scattering mechanisms in the polarization signature for purposes of classification and parameter estimation (Zhang et al. 2008). Several decomposition techniques have been proposed along with the utilization of fully polarimetric data sets provided by PolSAR platforms. The decomposition techniques can be categorized into either of two main groups. One is based on eigenvalue analysis, and the other employs scattering model-based decomposition
HAYATI J BiosciVol. 25 No. 3, July 2018 127

originally proposed by Freeman and Durden (Sugimoto et al. 2012). The Freeman-Durden decomposition is a physical scattering model-based decomposition, describing the polarimetric backscatter from naturally occurring scatters. It decomposes the backscatter response into three categories of volume scattering (V) modeled as a set of randomly oriented dipoles, the double-bounce scattering (D) modeled by a dihedral with orthogonal surfaces of different dielectric properties, and surface or single-bounce scattering modeled by a first-order Bragg surface scatter (S) (Freeman and Durden 1998). The Freeman–Durden three-component decomposition are the original works of model-based incoherent decomposition methods. Freeman and Durden successfully decomposed fully PolSAR data into three components: Single bounce, double bounce, and volume scattering (Hong et al. 2015). This approach can be used to determine the dominant scattering mechanisms and to facilitate identifying the current state of the surface cover. The three-component scattering provides features for distinguishing between different surface cover types. The advantage of the Freeman-Durden decomposition is that it is based on the underlying physics of radar scattering and not just a purely mathematical construct (Freeman and Durden 1998). This research is aimed at examining of three-component decompositions of Freeman-Durden to classify growing phase of rice plants. We based our study on quad-polarimetric data from Radarsat-2 (C-band, 5.6 cm). A continuous time series of polarimetric data will provide a better understanding of how the backscatter response changes throughout the growing phase, particularly in Indramayu district.
2. Materials and Methods
2.1. Study Area The study area was located in Indramayu district (107°52’-108°36’ BT and 6°15’-6°40’ latitude) (Figure 1). Field experiments were carried out at a typical paddy site in Indramayu. The location of Indramayu district which stretches along the north coast of Java Islands. The network of monitored fields is mainly located in the paddy field. Altitude region generally ranges between 0-18 m above sea level and the low lying areas ranges between 0-6 m above sea level that consists of swamps, ponds, paddy fields, yards. The mean daily air temperature quite high 28°C. This situation is susceptible to drainage, when rainfall is high low areas will occur puddles and when the dry season would cause severe drought (Pemerintah Provinsi Jawa Barat 2017).
2.2. DataFour consecutive fully polarimetric C-band
Radarsat-2 images were acquired in repeat pass during the growing season in 2014. All of them were
acquired with the same beam mode and orbit pass, in order to build a time series in the most consistent way (Table 1). The classification analysis was per-formed on June 18, 2014 when the rice was in the beginning of the heading growing phase, which was proved to be optimal for rice identification in our four-temporal data set. Their acquisition periods cover the most critical growing phase of the crop, from its sowing to its harvest, as shown in Table 2. Original Radarsat-2 images were provided in single look complex (SLC) format with pixel size of 6.89 and 4.83 m in azimuth and ground range directions, respectively.
2.3. Characteristics of Rice Plants and Growing Phase
Based on The International Rice Research Institute, growing phase classifies divided to three stage: (1) the vegetative phase from germination to panicle initiation, (2) the reproductive phase from panicle initiation to flowering, and (3) the ripening phase from flowering to mature grain (Datta 1981). The growing cycle encompasses the three growth phases,
Figure 1. Study area in Indramayu Region, West Java is showed by red rectangular of Radarsat-2 acquisition paths
108o3’0”E 108o13’ 30”E
Jawa sea
Jawa sea
N
Indramayu
Majalengka Cirebon
108o24’0”E 108o24’0”E
108o34’30”E108o24’30”E108o13’30”E108o3’0”E6o 3
1’30
”S
6o 31’
30”S
6o 21’
0”S
6o 21’
0”S
6o 10’
30”S
6o 10’
30”S
0 4 8 8 Km
Table 1. Main parameters of five Radarsat-2 images
Parameter ValuesImaging ModeCenter frequencyIncidence angleResolutionOrbit directionBeam modePolarization
Fine Quad Polarization5.405 GHz31.50°about 8 mAscendingFQ12HH+HV+VH+VV
Table 2. Acquisition dates of four Radarsat-2 images and corresponding growing phase of paddy
Acquisition dates
June 18, 2014August 5, 2014September 22, 2014October 16, 2014
VegetativeReproductiveHarvestAfter harvest/seeding
Growing phase
Nurtyawan R et al.128

which include10 growing phase: 0, germination; 1, seedling; 2, tillering; 3, stemelongation; 4, panicle initiation/booting; 5, heading; 6, flowering; 7, milk stage; 8, dough stage; and 9, mature grain. Stages 0–3 constitute the vegetative phase, stages 4–6 correspond to the reproductive phase, and stages 7–9 describe the ripening phase (Kuenzer and Knauer 2013).
The duration of the growing cycle depends on defined by the length of the vegetative phase, the variety of rice species and the climate conditions. The reproductive phase is about 35 days and the ripening phase is about 30 days in tropical regions. Tropical rice varieties have an average life cycle of 110–120 days, and the duration of the life cycle in temperate regions is about 140–150 days (Toan et al. 1997).
2.4. MethodRadarsat-2 can transmit and receive horizontally or
vertically polarized signals. A combined polarization radar image consist of HH (horizontal transmitting, horizontal receiving), VV (vertical transmitting, vertical receiving), HV (horizontal transmitting, vertical receiving), or VH (the reverse of HV) as presented by Figure 2. Characteristics of scattering depend on the polarization properties of the target, PolSAR image.
Each image was ingested into the S4C scattering matrix using PCI Geomatica version 2016. The single look complex (SLC) data, ingested and stored in a scattering matrix format, were imported to PCIDSK file, and then a boxcar filter with 5 x 5 window size was applied followed by the symmetrization to generate the 3 x 3 covariance matrix before the Freeman-Durden decomposition was performed. The polarimetric Radarsat-2 data converted to the 3 x 3 complex coherency matrix the polarimetric decompositions were orthorectified using the platform orbit information and digital elevation models derived from the SRTM version 4 with spatial resolution 90 m prior to further analyses. To further decrease speckle, the magnitude channels were speckle filtered using
(1)
(2)
(3)
(4)
a 3 x 3 Gamma filter before classification. Finally the decomposition parameters were used for both the classification analysis and to evaluate the effect of growing phase changes. The block scheme of the proposed method is shown in Figure 3.
PolSAR measures the complex scattering matrix [S] in a linear (H:horizontal; V:vertical) polarization basis. The Sinclair scattering matrix [S] for each pixel in a PolSAR image is expressed as: Polarimetric decomposition of Radarsat-2 data were performed by decomposing a single polarization into matrix scattering [S] 2×2 followed by extraction of matrix coherency [T3]. In horizontal polarization (H) and vertical (V), the matrix scattering [S] could be expressed by:
For reciprocal backscaterring case,Shv=Svh, the matrix coherency [T3] could be expressed as follows:
The Freeman decomposition expresses the measured covariance matrix C as follows:
Where Cv, Cd, and Cs are covariance matrix corresponding to each scattering component (volume, double, surface) as presented in Table 3. From these matrices, then the contributions of each scattering mechanisms Pv, Pd, Ps to the span (total power) P can be estimated. These scattered powers Pv, Pd, Ps, can be employed to generate RGB image and can be used as classification features to allow differentiation between different land cover types (Freeman and Durden 1998).
Figure 2. (a) The full and (b) single polarimetric SAR (PolSAR) images and illustration of their electromagnetic propagations
a b
108o12’00”E
108o12’00”E
108o12’00”E108o18’00”E
108o18’00”E
108o18’00”E
Scale 175000 Scale 1750002 2Km KmKm Km0 02 24 46 68 8
108o24’00”E
108o24’00”E
108o24’00”E
6o 18’
00”E
6o 18’
00”E
6o 18’
00”E
6o 18’
00”E
6o 24’
00”E
6o 24’
00”E
6o 24’
00”E
6o 24’
00”E
6o 30’
00”E
6o 30’
00”E
6o 30’
00”E
6o 30’
00”E
HAYATI J BiosciVol. 25 No. 3, July 2018 129
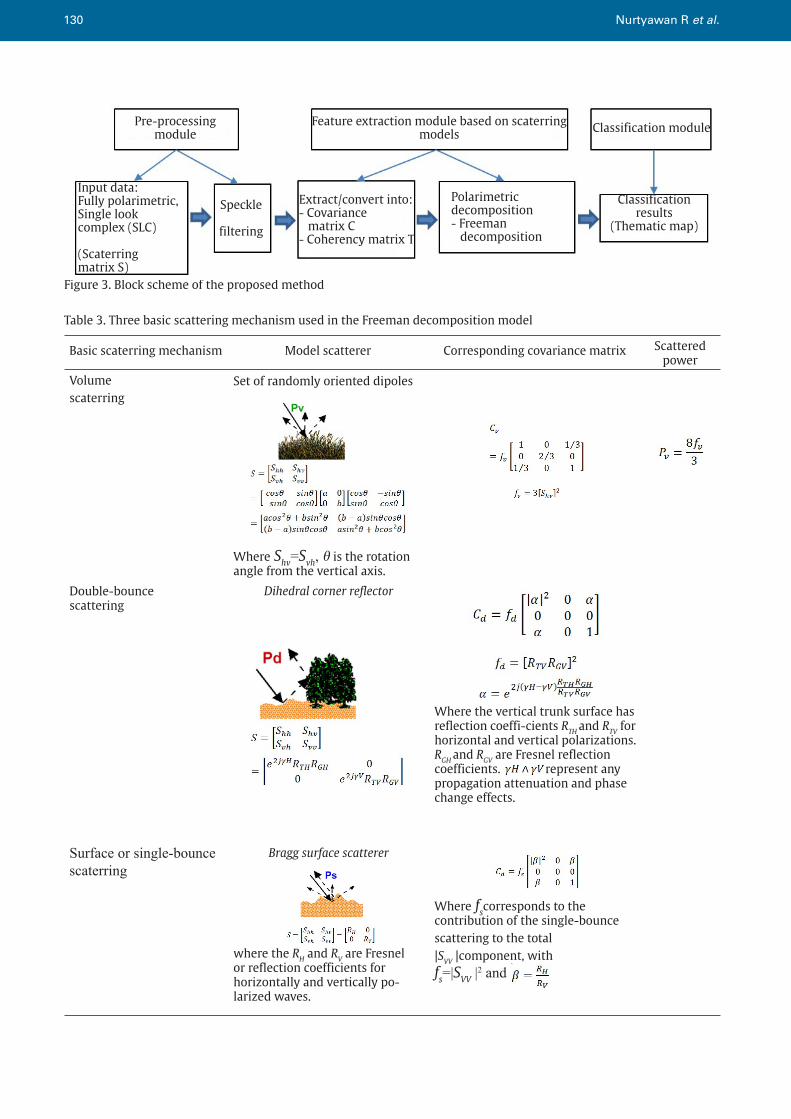
Figure 3. Block scheme of the proposed method
Pre-processing module
Classification results
(Thematic map)
Speckle
filtering
Input data:Fully polarimetric,Single lookcomplex (SLC)
(Scaterring matrix S)
Extract/convert into:- Covariance matrix C- Coherency matrix T
Polarimetric decomposition- Freeman decomposition
Classification moduleFeature extraction module based on scaterring models
Scattered power
Volume scaterring
Set of randomly oriented dipoles
Where Shv=Svh, θ is the rotation angle from the vertical axis.
Double-bounce scattering
Dihedral corner reflector
Where the vertical trunk surface has reflection coeffi-cients RTH and RTV for horizontal and vertical polarizations. RGH and RGV are Fresnel reflection coefficients. represent any propagation attenuation and phase change effects.
Surface or single-bounce scaterring
Bragg surface scatterer
where the RH and RV are Fresnel or reflection coefficients for horizontally and vertically po-larized waves.
Where fscorresponds to the contribution of the single-bounce scattering to the total|SVV |component, with fs=|SVV |2 and
Table 3. Three basic scattering mechanism used in the Freeman decomposition model
Basic scaterring mechanism Model scatterer Corresponding covariance matrix
Nurtyawan R et al.130

3. Result
Time series in the scattering mechanisms in paddy region was investigated using an inte-grated approach involving visual analysis based on Freeman-Durden
decomposition of the test sites. The Freeman-Durden polarimetric decomposition method was applied to the analysis of the PolSAR Radarsat-2 image, resulting in the maps in Figure 4 a-l which show the individual contribution of the double-bounce, volumetric, and
Figure 4. (a-l) Images resulting from the Freeman-Durden decomposition method applied to the Radarsat-2 images, showing the intensity of the different mechanisms in the total backscattering
(a)
(b)
(c)
(d)
(e)
(f)
(g)
(h)
(i)
(j)
(k)
(l)
Double-bounce June 18, 2014
Volume June 18, 2014
Surface June 18, 2014
Double-bounce August 5, 2014
Volume August 5, 2014
Surface August 5, 2014
Double-bounce September 22, 2014
Volume September 22, 2014
Surface September 22, 2014
Double-bounce Ocotber 16, 2014
Volume Ocotber 16, 2014
Surface Ocotber 16, 2014
a
d
g
j k l
h i
b
e f
c
HAYATI J BiosciVol. 25 No. 3, July 2018 131
surface scattering mecha-nisms such time series, respectively. The volumetric mechanisms presents the highest abso-lute values, followed by surface and double-bounce mechanisms.
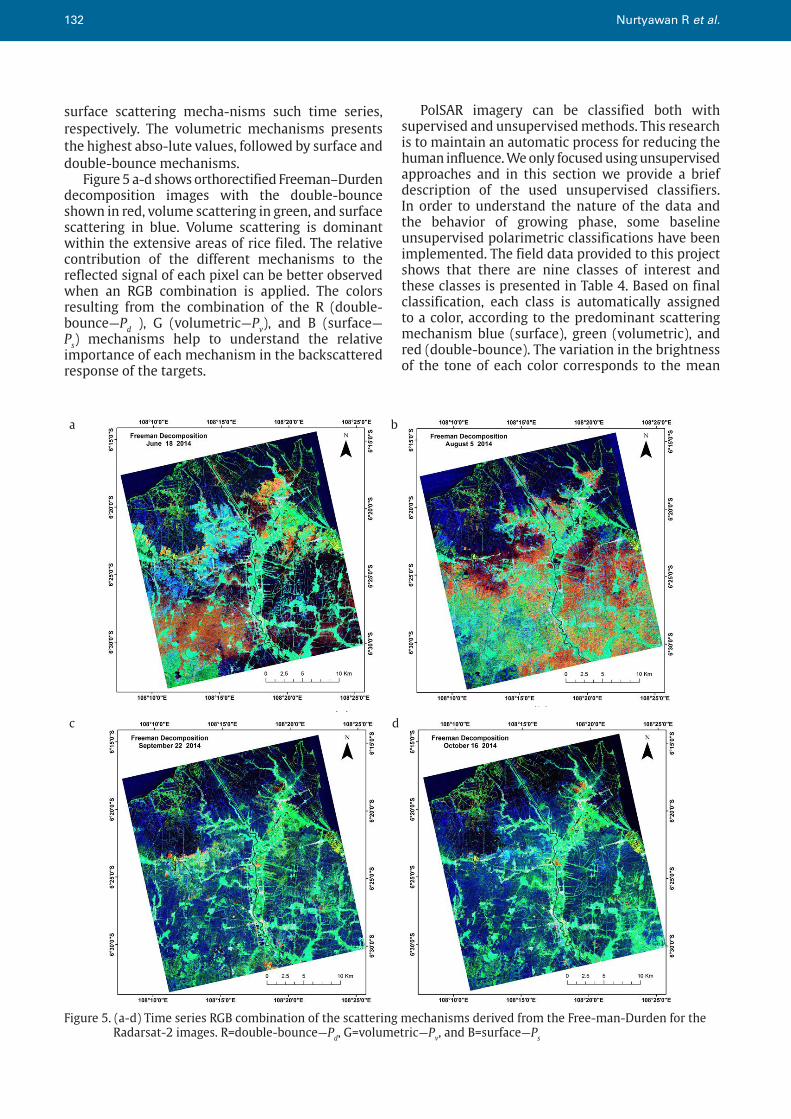
Figure 5 a-d shows orthorectified Freeman–Durden decomposition images with the double-bounce shown in red, volume scattering in green, and surface scattering in blue. Volume scattering is dominant within the extensive areas of rice filed. The relative contribution of the different mechanisms to the reflected signal of each pixel can be better observed when an RGB combination is applied. The colors resulting from the combination of the R (double-bounce—Pd ), G (volumetric—Pv), and B (surface—Ps) mechanisms help to understand the relative importance of each mechanism in the backscattered response of the targets.
PolSAR imagery can be classified both with supervised and unsupervised methods. This research is to maintain an automatic process for reducing the human influence. We only focused using unsupervised approaches and in this section we provide a brief description of the used unsupervised classifiers. In order to understand the nature of the data and the behavior of growing phase, some baseline unsupervised polarimetric classifications have been implemented. The field data provided to this project shows that there are nine classes of interest and these classes is presented in Table 4. Based on final classification, each class is automatically assigned to a color, according to the predominant scattering mechanism blue (surface), green (volumetric), and red (double-bounce). The variation in the brightness of the tone of each color corresponds to the mean
Figure 5. (a-d) Time series RGB combination of the scattering mechanisms derived from the Free-man-Durden for the Radarsat-2 images. R=double-bounce—Pd, G=volumetric—Pv, and B=surface—Ps
(a)
(b)
(d)
(e)
(a)
(b)
(d)
(e)
a
c d
b
Nurtyawan R et al.132

Based on the field documentation shows that the beginning of planting a variety.
4. Discussion
Freeman–Durden decomposition in images separate (Figure 4 a-l) which the volumetric mecha-nisms presents the highest absolute values in green color, followed by surface in blue color and double-bounce mechanisms in red color. Its can be shown visually that on 18 June, double-bounce scattering high, then decreased until October 16. This condition indicates that there has been a change of growth phase from vegetative to reproductive phase until harvest/after harvest. Volumetric mechanisms are available at all acquisition dates, this condition indicates which phase reproductive occurs for all acquisition dates while on for surface mechanisms from on 18 June until October 16 increased, indicates change of growing phase from seeding to germination.
Based on Figure 5 a-d shows that the greenery color indicates the pixels in which volumetric com-ponent is predominant while red color indicates the pixels in which the double-bounce mechanism contributes to total response. In the areas in which the color blue
potential of the class within growing phase (Figure 6 a-d).
The phenological growth stages of these plant from the field survey in 2014 are summarized in Tables 5.
Table 4. Classification based on scattering mechanism used in the freeman decomposition model
Classification of freeman decomposition
Low power contributions due to double-bounceMedium power contributions due to double-bounceHigh power contributions due to double-bounceLow power contributions due to volume scatteringMedium power contributions due to volume scatteringHigh power contributions due to volume scatteringLow power contributions due to rough surfaceMedium power contributions due to rough surfaceHigh power contributions due to rough surface
Vegetative 1
Vegetative 2
Vegetative 3
Reproductive 1
Reproductive 2
Reproductive 3
Germination
Seeding
After Harvest
Classification of growing phase
Figure 6. (a-d) Classification of growing phase
(a)
(b)
(c)
(d)
(a)
(b)
(c)
(d)
a
c d
b
HAYATI J BiosciVol. 25 No. 3, July 2018 133
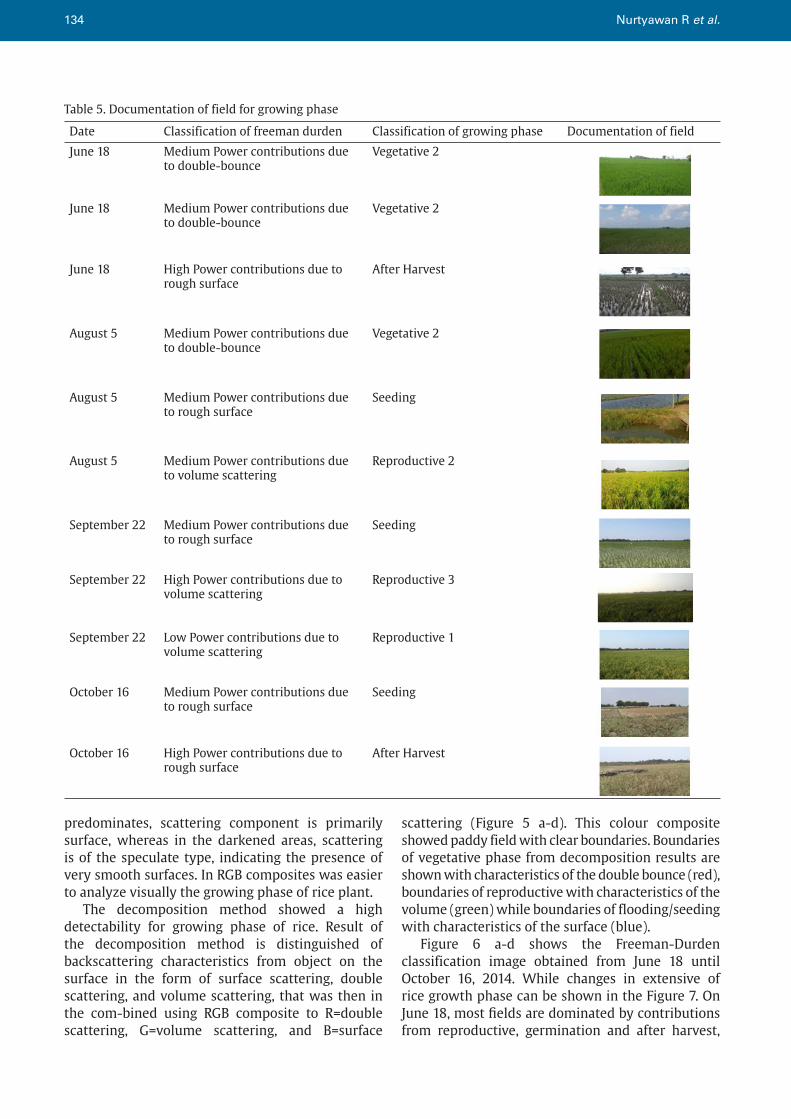
Table 5. Documentation of field for growing phase
Date Classification of freeman durden Classification of growing phase Documentation of field
June 18 Medium Power contributions due to double-bounce
Vegetative 2
June 18 Medium Power contributions due to double-bounce
Vegetative 2
June 18 High Power contributions due to rough surface
After Harvest
August 5 Medium Power contributions due to double-bounce
Vegetative 2
August 5 Medium Power contributions due to rough surface
Seeding
August 5 Medium Power contributions due to volume scattering
Reproductive 2
September 22 Medium Power contributions due to rough surface
Seeding
September 22 High Power contributions due to volume scattering
Reproductive 3
September 22 Low Power contributions due to volume scattering
Reproductive 1
October 16 Medium Power contributions due to rough surface
Seeding
October 16 High Power contributions due to rough surface
After Harvest
predominates, scattering component is primarily surface, whereas in the darkened areas, scattering is of the speculate type, indicating the presence of very smooth surfaces. In RGB composites was easier to analyze visually the growing phase of rice plant.
The decomposition method showed a high detectability for growing phase of rice. Result of the decomposition method is distinguished of backscattering characteristics from object on the surface in the form of surface scattering, double scattering, and volume scattering, that was then in the com-bined using RGB composite to R=double scattering, G=volume scattering, and B=surface
scattering (Figure 5 a-d). This colour composite showed paddy field with clear boundaries. Boundaries of vegetative phase from decomposition results are shown with characteristics of the double bounce (red), boundaries of reproductive with characteristics of the volume (green) while boundaries of flooding/seeding with characteristics of the surface (blue).
Figure 6 a-d shows the Freeman-Durden classification image obtained from June 18 until October 16, 2014. While changes in extensive of rice growth phase can be shown in the Figure 7. On June 18, most fields are dominated by contributions from reproductive, germination and after harvest,
Nurtyawan R et al.134

Figure 7. Extensive of rice growth phase
HAYATI J BiosciVol. 25 No. 3, July 2018 135
Figure 8. (a-f) The rough surface, double-bounce, and volume scattering parameters of the Freeman-Durden decomposition versus growing phase of rice plant
a b
b c
e e
as the plant condition in these fields were in various growth stages. On August 5, some fields dominated by reproductive 2. While September 22 and October 16 some fields dominated by seeding. The results demonstrate that the temporal change of scattering mechanisms based on Free-man-Durden decomposition provides a useful way to visually distinguish different types of paddy growing phase by identifying the stages of their growth cycles. The overall accuracy for classification results was 77.27%.
The scattering mechanism of volume from the Freeman-Durden decomposition is generally stable throughout the growing season until harvest (Figure 8 a-f). This is due to the rice canopy generating double

bounce scattering during each growing phase. The double bounce starts very high but deceases as the canopy matures until a slight increase at harvest. The decrease in double bounce caused by the canopy increases reducing penetration to the surface and the double bounce off the water rice interface. The water level will decrease during the latter stages of rice development and lead to a decrease in the double bounce as some areas are wet soil rather than standing water.
After harvest, about 10 cm or more stubble is left in the fields. Farmers deliberately do flooding the fields to destroy the secondary plant growth. As a result, the flooded vertical stubble with the standing water surface can form a dihedral scatterer and cause increase the contribution of double bounce. When the surface scatter is low then gradually decreases during the rice growing season. There is a slight increase in surface scattering at harvest due to the wet soil and rice residue. These results suggest that the ratio of volume to double bounce scatter from the Freeman Durden decomposition can provide information related to the rice canopy and subsequently yield estimation using growth models.
Radarsat-2 were evaluated for mapping growing phase of rice plant, Indramayu district, West Java, Indonesia. Radarsat-2 images collected under ascending pass (east-looking) and incidence angle 31.50°. Freeman and Durden successfully decomposed fully PolSAR data into three components: Single bounce, double bounce, and volume scattering. The three-component scattering provide features for distinguishing between different surface cover types. These sensitivities assist in the identification of growing phase. The observed growing phase development in time series, reflected in the consistent temporal trends in scattering, was generally in agreement with crop phenological development stages. The polarimetric analysis included target decompositions models Freeman-Durden as well as unsupervised classification Wishart-Freeman-Durden. Time series analysis was applied to the Freeman surface, Freeman double-bounce, and Freeman volume backscatter intensities to monitor growing phase of rice plant from emergence to harvest. It has been found that Freeman double-bounce and Freeman volume scattering intensities are strong indicators of crop growth development. These backscatter intensities are very low during emergence but rise significantly during the vegetative growth phase. In addition, several characteristics of the growth cycle, such as the time to reach a peak and the peak backscatter can be determined. Also, the ratio of the Freeman double-bounce and the Free-man
volume components depends on growing phase. These sensitivities assist in the identification of growing phase. The observed growing phase development in time series, reflected in the consistent temporal trends in scattering, was generally in agreement with crop phenological development stages. Supervised classification was performed on repeat-pass Radarsat-2 images, with an overall classification accuracy of 77.27% achieved using time series Fine beam data. The study demonstrated that Radarsat-2 Fine mode data provide useful information for crop monitoring and classification of rice plant.
Acknowledgements
The Radarsat-2 quad-pol data were provided by MacDonald Dettwiler and Associates (MDA) - Canada, through a distributor in Indonesia, Rasjid A. Aladin.
References
Aishah S et al. 2016. Monitor-ing spatial and temporal variations of the rice backscatter coefficient (σ°) at different phenological stages in Sungai Burong and Sawah Sempadan, Kuala Selangor. IOP 37. https://doi.org/10.1088/1755-1315/37/1/012048
Bouvet A et al. 2009. Monitoring of the rice cropping system in the Mekong Delta using ENVISAT/ASAR dual polarization data. IEEE Trans Geosci Remote Sens 47:517–526.
Chen J et al. 2014. Mapping rice crop fields using C band polarimetric SAR data, In: Agro-Geoinformatics (Agro-Geoinformatics 2014), Third International Conference On. IEEE. pp. 1–4.
Datta D. 1981. Principles and practices of rice production. Int. Rice Res. Inst.
Fan KT et al. 2015. Identification of rice paddy fields from multitem-poral polarimetric SAR images by scattering matrix decomposition, in: Geoscience and Re-mote Sensing Symposium (IGARSS), 2015 IEEE International. IEEE. pp. 3199–3202.
Freeman A, Durden S. 1998. A three-component scattering model for polarimetric SAR data. IEEE Trans Geosci Remote Sens 36:963–973.
Hong SH et al. 2015. Evaluation of Polarimetric SAR Decomposition for Classifying Wetland Vegetation Types. Remote Sens 7:8563–8585. https://doi.org/10.3390/rs70708563
Inoue Y et al. 2002. Season-long daily measurements of multifrequency (Ka, Ku, X, C, and L) and full-polarization backscatter signatures over paddy rice field and their relationship with biological variables. Remote Sens Environ 81:194–204. https://doi.org/10.1016/S0034-4257 (01)00343-1
Jing Z et al. 2013. Estimating Paddy Rice Biomass Using Radarsat-2 Data Based on Artificial Neural Network. Atlantis Press. https://doi.org/10.2991/rsete.2013.103
Koppe W et al. 2013. Rice monitoring with multi-temporal and dual-polarimetric TerraSAR-X data. Int J Appl Earth Obs Geoinformation 21:568–576. https://doi.org/10.1016/j.jag.2012.07.016
Nurtyawan R et al.136

Kuenzer C, Knauer K. 2013. Remote sensing of rice crop areas. Int J Remote Sens 34:2101–2139. https://doi.org/10.1080/01431161.2012.738946
Nguyen D et al. 2015. Mapping Rice Seasonality in the Mekong Delta with Multi-Year Envisat ASAR WSM Data. Remote Sens 7:15868–15893. https://doi.org/10.3390/rs71215808
Nurtyawan R et al. 2018. Modified Campbell-Shepard Model to Retrieve Surface Roughness in Paddy Fields Using Radarsat-2 Data and Field Measurements. Int J Tomogr Simul 31:27-43.
Nurtyawan R et al. 2016. Modeling Surface Roughness to Estimate Surface Moisture Using Radarsat-2 Quad Polarimetric SAR Data. J Phys Conf Ser 739:012105. https://doi.org/10.1088/1742-6596/739/1/012105
Pemerintah Provinsi Jawa Barat. 2017. Kabupaten Indramayu. Jawa Barat.
Sugimoto M et al. 2012. Four-Component Scattering Power Decomposition Algorithm with Rotation of Covariance Matrix Using ALOS-PALSAR Polarimetric Data. Remote Sens 4:2199–2209. https://doi.org/10.3390/rs4082199
Suwarno. 2010. Meningkatkan Produksi Padi Menuju Ketahanan Pangan yang Lestari. PANGAN 19:233–243.
Taghvakish S. 2012. Refined Freeman-Durden for harvest detection using POLSAR data. University of Calgary.
Toan T et al. 1997. Rice Crop Mappingand Monitoring Using ERS-1 Data Basedon Experimentand Modelling Results. IEEE Geosci Remote Sens 35:41–56.
Wang J et al. 2015. Mapping paddy rice planting area in wheat-rice double-cropped areas through integration of Landsat-8 OLI, MODIS and PALSAR images. Sci Rep 5. https://doi.org/10.1038/srep10088
Xie Q et al. 2016. Quantitative Analysis of Polarimetric Model-Based Decomposition Methods. Remote Sens 8:977. https://doi.org/10.3390/rs8120977
Yang H et al. 2014. Temporal Polarimet-ric Behavior of Oilseed Rape (Brassica napus L.) at C-Band for Early Season Sowing Date Monitoring. Remote Sens 6:10375–10394. https://doi.org/10.3390/rs61110375
Yuzugullu O et al. 2017. Determining Rice Growth Stage with X-Band SAR: A Metamodel Based Inversion. Remote Sens 9:460. https://doi.org/10.3390/rs9050460
Zhang L et al. 2008. Multiple-Component Scattering Model for Polarimetric SAR Image Decomposition. IEEE Geosci Remote Sens Lett 5:603–607. https://doi.org/10.1109/LGRS.2008.2000795
HAYATI J BiosciVol. 25 No. 3, July 2018 137