sasfin asset managers - documents.efgroup.co.zadocuments.efgroup.co.za/documents/boutique collective...
TRANSCRIPT

SLIDE TITLE
• Sub Title
Sasfin Asset ManagersPhilip Bradford, CFA
BCI Conference May 2018

Is there life after junk…?… or is it a trainwreck?

“Those who don’t know history are doomed to repeat it.”
Edmund Burke
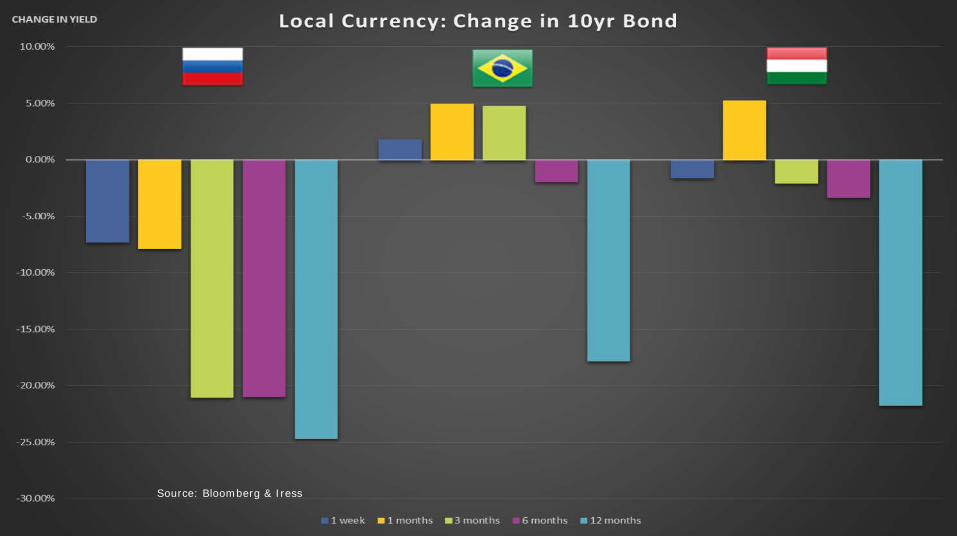
What happens after a downgrade…?
Source: Bloomberg & Iress
8
9
10
11
12
13
14
15
16
17
18
Feb 14 Sep 14 Mar 15 Oct 15 May 16 Nov 16 Jun 17 Jan 18
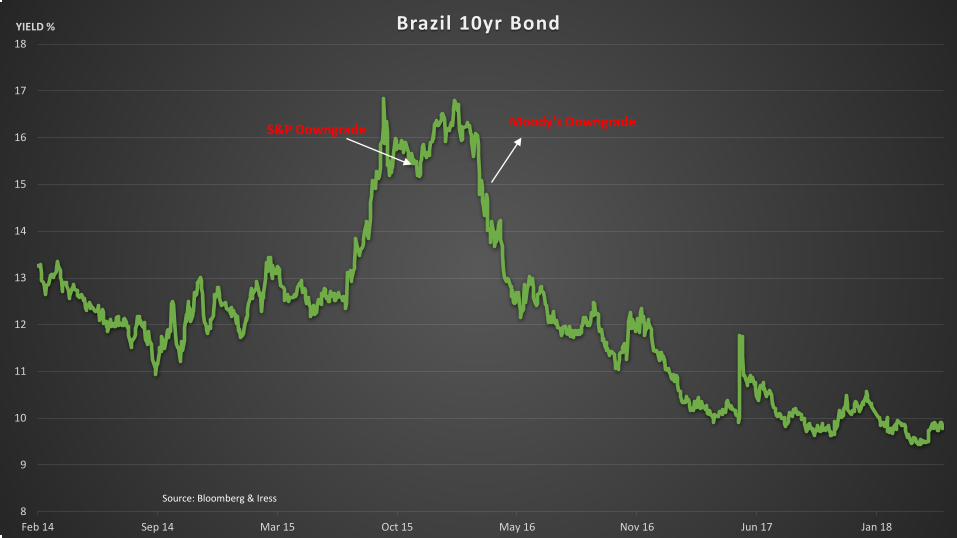
YIELD % Brazil 10yr Bond
S&P Downgrade Moody's Downgrade
Source: Bloomberg & Iress
6
8
10
12
14
16
18
Jan-14 Jul-14 Jan-15 Jul-15 Jan-16 Jul-16 Jan-17 Jul-17 Jan-18
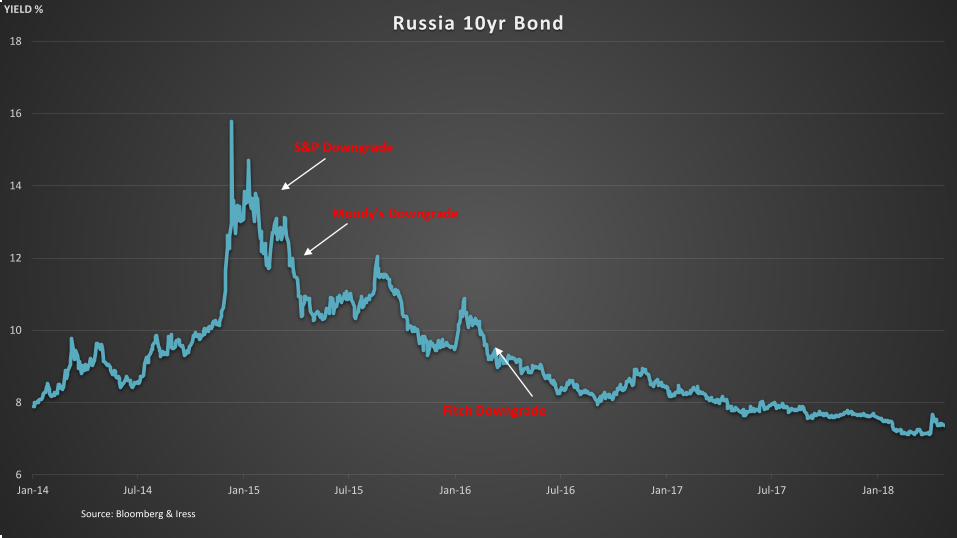
YIELD %Russia 10yr Bond
S&P Downgrade
Moody's Downgrade
Fitch Downgrade
Source: Bloomberg & Iress
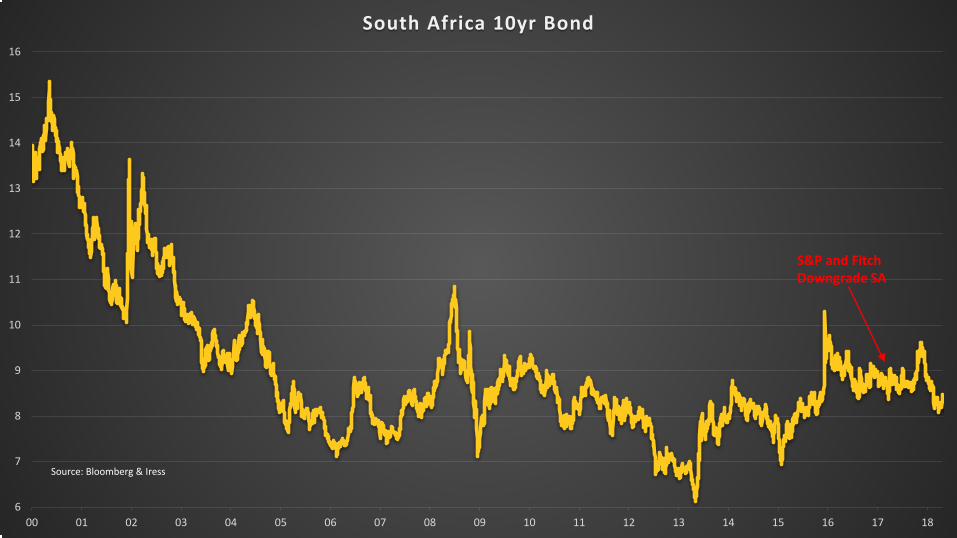
6
7
8
9
10
11
12
13
14
15
16
00 01 02 03 04 05 06 07 08 09 10 11 12 13 14 15 16 17 18
South Africa 10yr Bond
S&P and FitchDowngrade SA
Source: Bloomberg & Iress
Source: Bloomberg
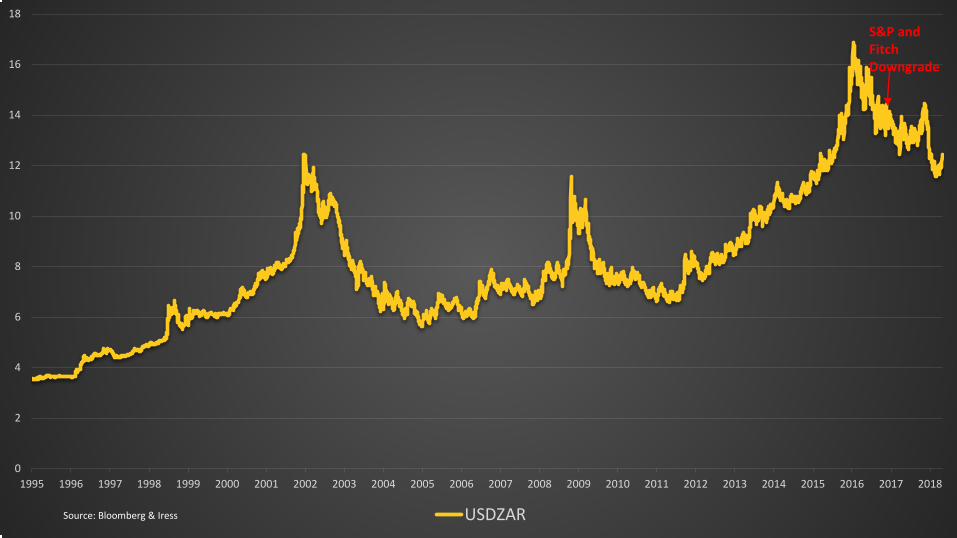
0
2
4
6
8
10
12
14
16
18
1995 1996 1997 1998 1999 2000 2001 2002 2003 2004 2005 2006 2007 2008 2009 2010 2011 2012 2013 2014 2015 2016 2017 2018
USDZAR
S&P and FitchDowngrade
Source: Bloomberg & Iress
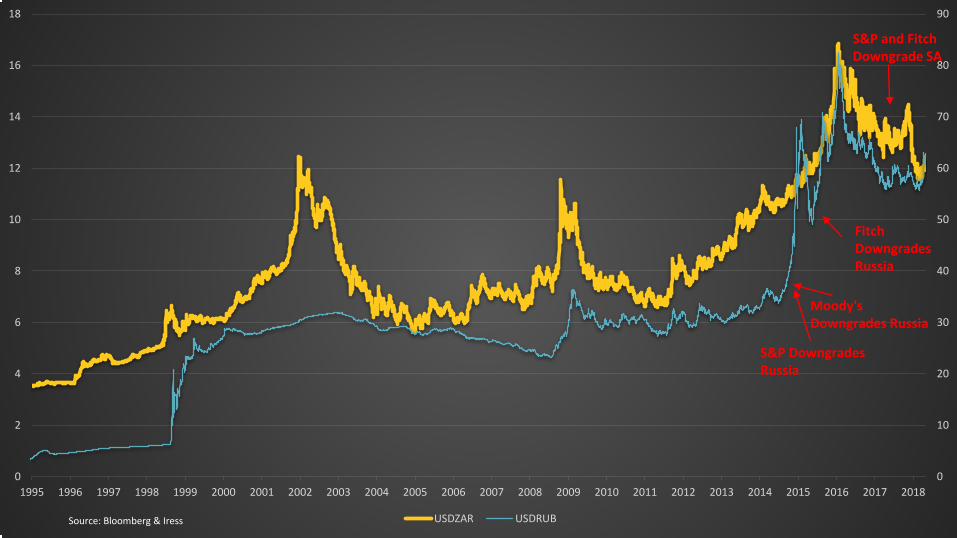
0
10
20
30
40
50
60
70
80
90
0
2
4
6
8
10
12
14
16
18
1995 1996 1997 1998 1999 2000 2001 2002 2003 2004 2005 2006 2007 2008 2009 2010 2011 2012 2013 2014 2015 2016 2017 2018
USDZAR USDRUB
S&P Downgrades Russia
Moody's Downgrades Russia
Fitch Downgrades Russia
S&P and FitchDowngrade SA
Source: Bloomberg & Iress
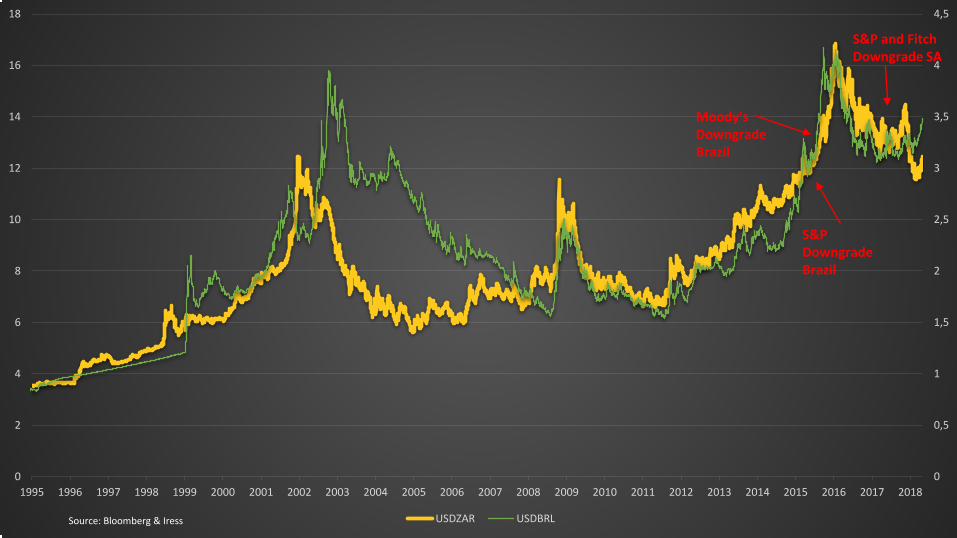
0
0,5
1
1,5
2
2,5
3
3,5
4
4,5
0
2
4
6
8
10
12
14
16
18
1995 1996 1997 1998 1999 2000 2001 2002 2003 2004 2005 2006 2007 2008 2009 2010 2011 2012 2013 2014 2015 2016 2017 2018
USDZAR USDBRL
S&P Downgrade Brazil
Moody's Downgrade Brazil
S&P and FitchDowngrade SA
Source: Bloomberg & Iress

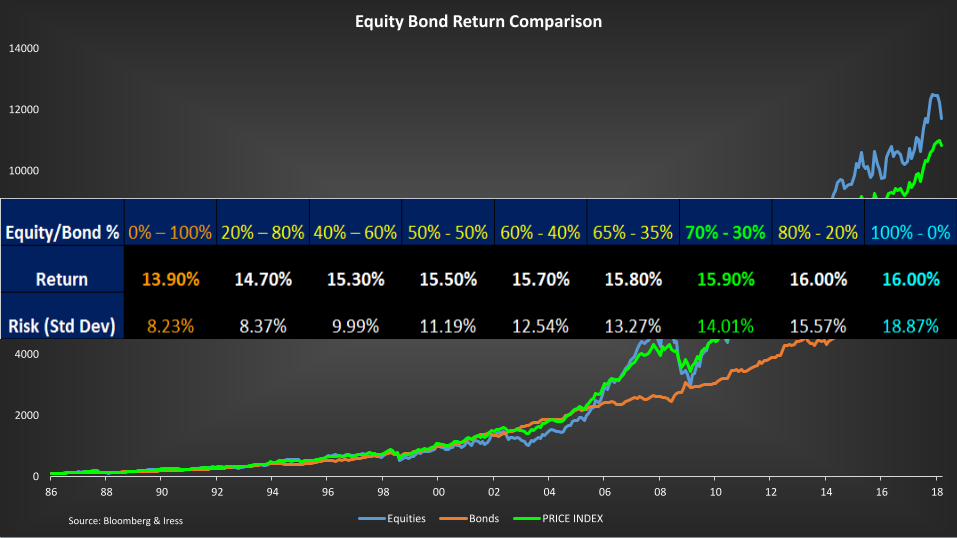
Should I ever buy bonds in a long-term aggressive portfolio?
0
2000
4000
6000
8000
10000
12000
14000
86 88 90 92 94 96 98 00 02 04 06 08 10 12 14 16 18
Equity Bond Return Comparison
Equities Bonds PRICE INDEXSource: Bloomberg & Iress
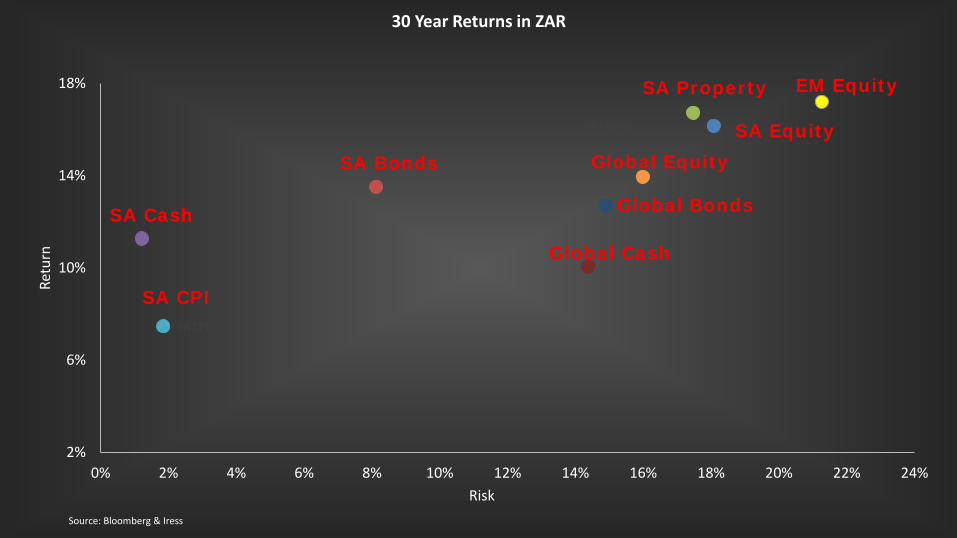
SA Equity
SA CPI
2%
6%
10%
14%
18%
0% 2% 4% 6% 8% 10% 12% 14% 16% 18% 20% 22% 24%
Retu
rn
Risk
30 Year Returns in ZAR
Source: Bloomberg & Iress
SA CPI
SA Bonds
Global Cash
Global Bonds
Global EquitySA Equity
SA Property
SA Cash
EM Equity
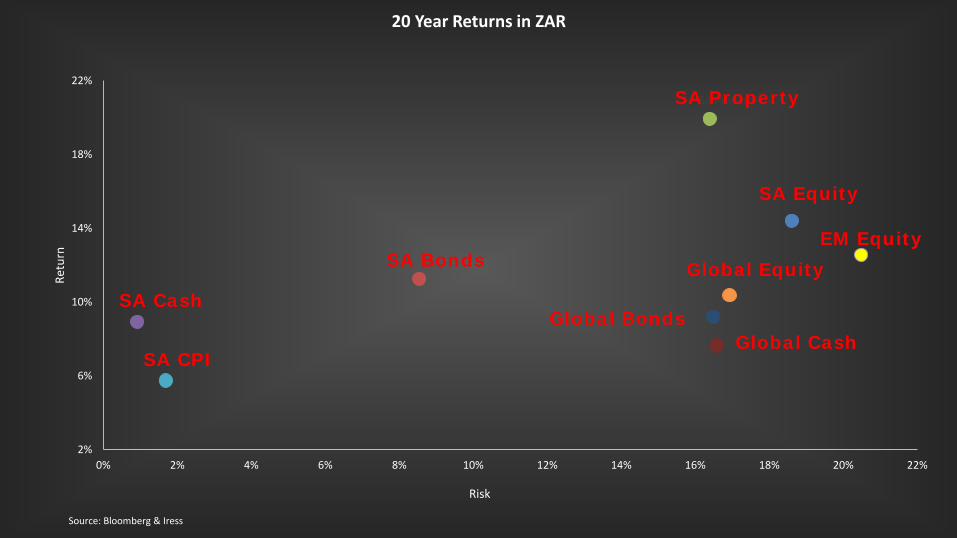
SA Property
2%
6%
10%
14%
18%
22%
0% 2% 4% 6% 8% 10% 12% 14% 16% 18% 20% 22%
Retu
rn
Risk
20 Year Returns in ZAR
Source: Bloomberg & Iress
SA CPI
SA Bonds
Global CashGlobal Bonds
Global Equity
SA Equity
SA Property
SA Cash
EM Equity
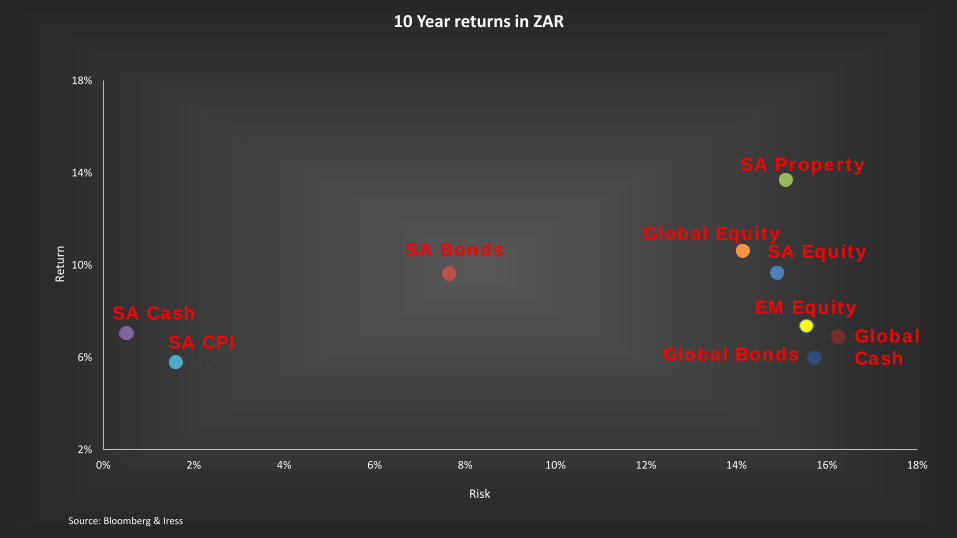
SA CPI
2%
6%
10%
14%
18%
0% 2% 4% 6% 8% 10% 12% 14% 16% 18%
Retu
rn
Risk
10 Year returns in ZAR
Source: Bloomberg & Iress
SA CPI
SA Bonds
Global CashGlobal Bonds
Global EquitySA Equity
SA Property
SA Cash EM Equity
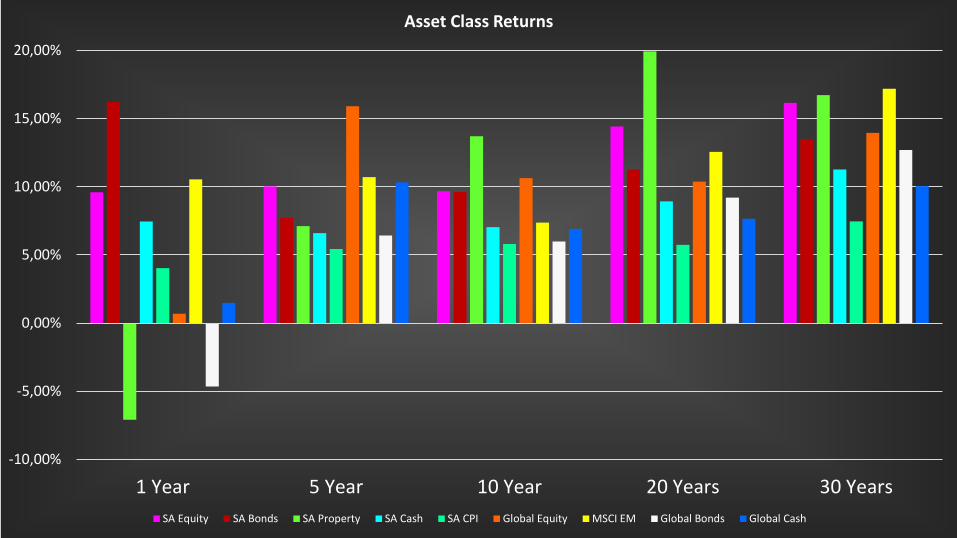
-10,00%
-5,00%
0,00%
5,00%
10,00%
15,00%
20,00%
1 Year 5 Year 10 Year 20 Years 30 Years
Asset Class Returns
SA Equity SA Bonds SA Property SA Cash SA CPI Global Equity MSCI EM Global Bonds Global Cash
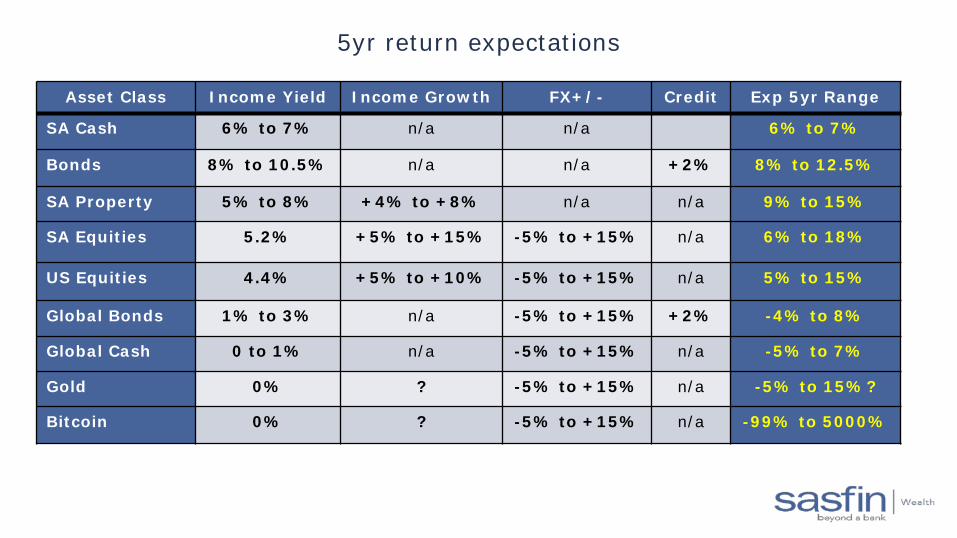
5yr return expectations
Asset Class Income Yield Income Growth FX+/- Credit Exp 5yr Range
SA Cash 6% to 7% n/a n/a 6% to 7%
Bonds 8% to 10.5% n/a n/a +2% 8% to 12.5%
SA Property 5% to 8% +4% to +8% n/a n/a 9% to 15%
SA Equities 5.2% +5% to +15% -5% to +15% n/a 6% to 18%
US Equities 4.4% +5% to +10% -5% to +15% n/a 5% to 15%
Global Bonds 1% to 3% n/a -5% to +15% +2% -4% to 8%
Global Cash 0 to 1% n/a -5% to +15% n/a -5% to 7%
Gold 0% ? -5% to +15% n/a -5% to 15%?
Bitcoin 0% ? -5% to +15% n/a -99% to 5000%
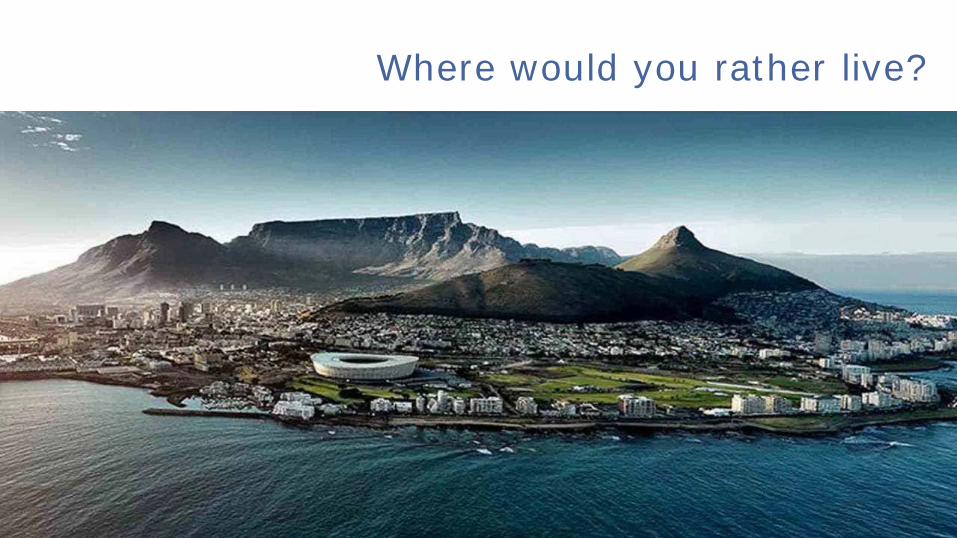
Where would you rather live?
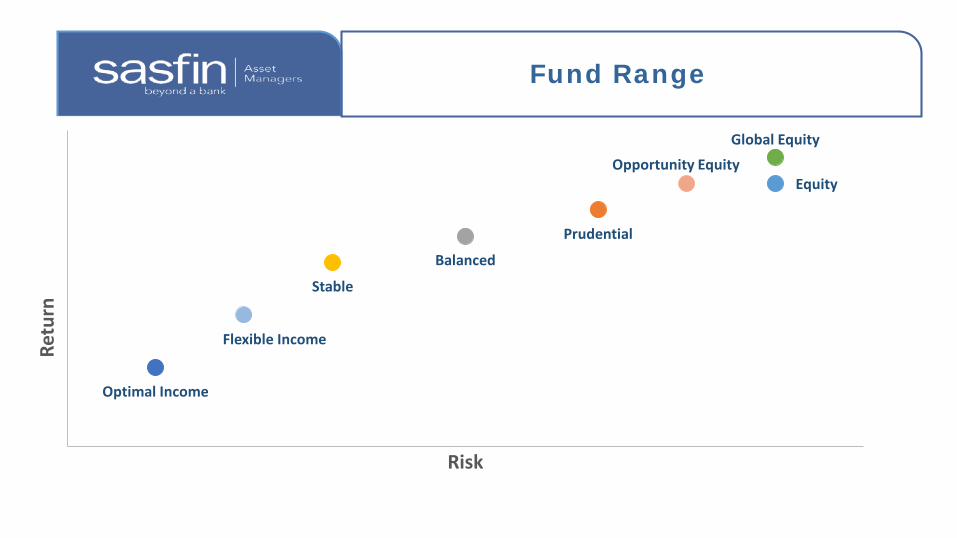
Optimal Income
Stable
Balanced
Prudential
Equity
Global Equity
Flexible Income
Opportunity Equity
Retu
rn
Risk
Fund Range
21
Disclaimer
DisclaimerDisclaimer & Legal
Sasfin Asset Managers (Pty) Ltd, FSP Licence no. 21664 (Co. No. 2002/003307/07) a member of the Sasfin Group of companies (“Sasfin”)29 Scott Street Waverley Johannesburg 2090; PO Box 95104 Grant Park 2051; Tel. +27 11 809 7500; http://www.sasfin.com.
The information in this report may relate to investment or asset consulting services provided by Sasfin. Portfolios may be contained and or administered within a fund policy, collective investment or other third party investment product or platform. Returns have been calculated using the most accurate sources available and while every effort is taken to ensure the accuracy of the information contained herein, Sasfin shall not be liable for any errors or omissions and disclaims any responsibility for any action which may be taken based on such information. Performance returns are generally calculated gross of fees, except where a component yield already includes such fees. Benchmarks are probability indicators for ongoing targeting and assessment purposes and are not guaranteed. Where historical data and reasonable market related assumptions have been used in the construction of data, these are general indicators only for the purpose of ongoing targeting and assessment and are not guaranteed. The portfolio(s) may involve a high degree of risk including, but not limited to, the risk of low or no investment returns, capital loss, counterparty or issuer default, adverse or unanticipated financial market fluctuations and inflation. The value of portfolio(s) may fluctuate daily as a result of these risks and historic yields are not a reliable indicator of future performance. This fact sheet is not intended to be financial advice or a recommendation and investors must consult their advisors and independently assess and confirm all material information and understand all risks and issues before making any decision or taking any action. Any views and opinions expressed in this report do not necessarily reflect the views of Sasfin. The contents of this report are proprietary and have been issued for the use of Sasfin’s clients and may not be distributed, copied or published without permission.
Thank you