sas it resource management 3.2 reporting guide
TRANSCRIPT

SAS® IT ResourceManagement 3.2Reporting GuideSecond Edition
SAS® Documentation

The correct bibliographic citation for this manual is as follows: SAS Institute Inc 2011. SAS® IT Resource Management 3.2: Reporting Guide,Second Edition. Cary, NC: SAS Institute Inc.
SAS® IT Resource Management 3.2: Reporting Guide, Second Edition
Copyright © 2011, SAS Institute Inc., Cary, NC, USA
All rights reserved. Produced in the United States of America.
For a hardcopy book: No part of this publication may be reproduced, stored in a retrieval system, or transmitted, in any form or by any means,electronic, mechanical, photocopying, or otherwise, without the prior written permission of the publisher, SAS Institute Inc.
For a Web download or e-book: Your use of this publication shall be governed by the terms established by the vendor at the time you acquire thispublication.
The scanning, uploading, and distribution of this book via the Internet or any other means without the permission of the publisher is illegal andpunishable by law. Please purchase only authorized electronic editions and do not participate in or encourage electronic piracy of copyrightedmaterials. Your support of others' rights is appreciated.
U.S. Government Restricted Rights Notice: Use, duplication, or disclosure of this software and related documentation by the U.S. government issubject to the Agreement with SAS Institute and the restrictions set forth in FAR 52.227–19, Commercial Computer Software-Restricted Rights(June 1987).
SAS Institute Inc., SAS Campus Drive, Cary, North Carolina 27513.
1st electronic book, May 2011
SAS® Publishing provides a complete selection of books and electronic products to help customers use SAS software to its fullest potential. Formore information about our e-books, e-learning products, CDs, and hard-copy books, visit the SAS Publishing Web site atsupport.sas.com/publishing or call 1-800-727-3228.
SAS® and all other SAS Institute Inc. product or service names are registered trademarks or trademarks of SAS Institute Inc. in the USA and othercountries. ® indicates USA registration.
Other brand and product names are registered trademarks or trademarks of their respective companies.

Contents
About This Book . . . . . . . . . . . . . . . . . . . . . . . . . . . . . . . . . . . . . . . . . . . . . . . . . . . . . . . vii
PART 1 Introduction to SAS IT Resource Management andBatch Reporting 1
Chapter 1 • About SAS IT Resource Management . . . . . . . . . . . . . . . . . . . . . . . . . . . . . . . . . . . . . 3What Is SAS IT Resource Management? . . . . . . . . . . . . . . . . . . . . . . . . . . . . . . . . . . . . . 3Benefits of Using SAS IT Resource Management . . . . . . . . . . . . . . . . . . . . . . . . . . . . . . 4How Does SAS IT Resource Management Work? . . . . . . . . . . . . . . . . . . . . . . . . . . . . . . 4How to Locate Documentation and Help for SAS IT Resource Management . . . . . . . . . 6Accessibility . . . . . . . . . . . . . . . . . . . . . . . . . . . . . . . . . . . . . . . . . . . . . . . . . . . . . . . . . . . 7
Chapter 2 • About Batch Reporting . . . . . . . . . . . . . . . . . . . . . . . . . . . . . . . . . . . . . . . . . . . . . . . . . 9Overview of How SAS IT Resource Management Works to Create Batch Reports . . . . 9Overview of Batch Reporting . . . . . . . . . . . . . . . . . . . . . . . . . . . . . . . . . . . . . . . . . . . . . 10Reporting Components across SAS Products and Applications . . . . . . . . . . . . . . . . . . . 14
Chapter 3 • Working with the Adapter Setup Wizard . . . . . . . . . . . . . . . . . . . . . . . . . . . . . . . . . . 19What Is the Adapter Setup Wizard? . . . . . . . . . . . . . . . . . . . . . . . . . . . . . . . . . . . . . . . . 19How to Use the Adapter Setup Wizard . . . . . . . . . . . . . . . . . . . . . . . . . . . . . . . . . . . . . . 20Reporting Jobs and Objects Created by the Adapter Setup Wizard . . . . . . . . . . . . . . . . 26Using Domain Categories . . . . . . . . . . . . . . . . . . . . . . . . . . . . . . . . . . . . . . . . . . . . . . . . 30Types of Reports That the Adapter Setup Wizard Creates . . . . . . . . . . . . . . . . . . . . . . . 31Viewing Batch Reports . . . . . . . . . . . . . . . . . . . . . . . . . . . . . . . . . . . . . . . . . . . . . . . . . . 31
PART 2 Creating and Modifying Batch Reports 33
Chapter 4 • About Creating and Modifying Batch Reports . . . . . . . . . . . . . . . . . . . . . . . . . . . . . . 35Why Create or Modify Batch Reports? . . . . . . . . . . . . . . . . . . . . . . . . . . . . . . . . . . . . . 35How to Create or Modify Your Own Batch Reports . . . . . . . . . . . . . . . . . . . . . . . . . . . 35
Chapter 5 • Working with Supplied SAS Enterprise Guide Projects . . . . . . . . . . . . . . . . . . . . . . 45About SAS Enterprise Guide Projects . . . . . . . . . . . . . . . . . . . . . . . . . . . . . . . . . . . . . . 45Preparing to Work with SAS Enterprise Guide . . . . . . . . . . . . . . . . . . . . . . . . . . . . . . . 49How to Modify a Report in a Supplied SAS Enterprise Guide Project . . . . . . . . . . . . . 56
Chapter 6 • Working with the ITRM Gallery Task in SAS Enterprise Guide . . . . . . . . . . . . . . . . 59About the ITRM Gallery Task . . . . . . . . . . . . . . . . . . . . . . . . . . . . . . . . . . . . . . . . . . . . 59Working with the ITRM Gallery Task . . . . . . . . . . . . . . . . . . . . . . . . . . . . . . . . . . . . . . 60
Chapter 7 • Working with Gallery Transformations and Report Jobs . . . . . . . . . . . . . . . . . . . . . 69About Report Jobs . . . . . . . . . . . . . . . . . . . . . . . . . . . . . . . . . . . . . . . . . . . . . . . . . . . . . 69Working with Report Jobs . . . . . . . . . . . . . . . . . . . . . . . . . . . . . . . . . . . . . . . . . . . . . . . 71About Gallery Transformations . . . . . . . . . . . . . . . . . . . . . . . . . . . . . . . . . . . . . . . . . . . 74

Working with Gallery Transformations . . . . . . . . . . . . . . . . . . . . . . . . . . . . . . . . . . . . . 76Specifying a Data Source Location . . . . . . . . . . . . . . . . . . . . . . . . . . . . . . . . . . . . . . . . 85About Templates and Style Sheets . . . . . . . . . . . . . . . . . . . . . . . . . . . . . . . . . . . . . . . . . 86Working with Templates and Style Sheets . . . . . . . . . . . . . . . . . . . . . . . . . . . . . . . . . . . 87
PART 3 Viewing and Managing Batch Reports 91
Chapter 8 • Working with the Gallery Manager . . . . . . . . . . . . . . . . . . . . . . . . . . . . . . . . . . . . . . . 93What Is Gallery Manager? . . . . . . . . . . . . . . . . . . . . . . . . . . . . . . . . . . . . . . . . . . . . . . . 93How to Get Help and Documentation for Gallery Manager . . . . . . . . . . . . . . . . . . . . . . 94How Gallery Manager Works . . . . . . . . . . . . . . . . . . . . . . . . . . . . . . . . . . . . . . . . . . . . . 94The Gallery Manager Interface . . . . . . . . . . . . . . . . . . . . . . . . . . . . . . . . . . . . . . . . . . . . 97Sample Reports . . . . . . . . . . . . . . . . . . . . . . . . . . . . . . . . . . . . . . . . . . . . . . . . . . . . . . . 104
Chapter 9 • Working with the SAS Content Server . . . . . . . . . . . . . . . . . . . . . . . . . . . . . . . . . . . 107About the SAS Content Server . . . . . . . . . . . . . . . . . . . . . . . . . . . . . . . . . . . . . . . . . . . 107Working with the SAS Content Server . . . . . . . . . . . . . . . . . . . . . . . . . . . . . . . . . . . . . 108
PART 4 Interactive Reporting and Using the SAS Portaland SAS BI Dashboard 111
Chapter 10 • About Interactive Reporting . . . . . . . . . . . . . . . . . . . . . . . . . . . . . . . . . . . . . . . . . . 113Overview of Interactive Reporting . . . . . . . . . . . . . . . . . . . . . . . . . . . . . . . . . . . . . . . . 113
Chapter 11 • Using SAS Enterprise Guide Interactively . . . . . . . . . . . . . . . . . . . . . . . . . . . . . . . 115Overview of SAS Enterprise Guide . . . . . . . . . . . . . . . . . . . . . . . . . . . . . . . . . . . . . . . 115Accessing SAS IT Resource Management Projects with SAS Enterprise Guide . . . . 116Locating SAS Enterprise Guide Documentation . . . . . . . . . . . . . . . . . . . . . . . . . . . . . 117
Chapter 12 • Using SAS Web Report Studio Interactively . . . . . . . . . . . . . . . . . . . . . . . . . . . . . 119Overview of SAS Web Report Studio . . . . . . . . . . . . . . . . . . . . . . . . . . . . . . . . . . . . . 119Access SAS IT Resource Management Information Maps to
Generate a Report in SAS Web Report Studio . . . . . . . . . . . . . . . . . . . . . . . . . . . . 122E-mailing SAS IT Resource Management Reports . . . . . . . . . . . . . . . . . . . . . . . . . . . 123Locating SAS Web Report Studio Documentation . . . . . . . . . . . . . . . . . . . . . . . . . . . 123
Chapter 13 • Using SAS Add-In for Microsoft Office Interactively . . . . . . . . . . . . . . . . . . . . . . . 125SAS Add-In for Microsoft Office and SAS IT Resource Management Data . . . . . . . . 125Using SAS Add-In for Microsoft Office to Access SAS IT
Resource Management Data . . . . . . . . . . . . . . . . . . . . . . . . . . . . . . . . . . . . . . . . . . 126
Chapter 14 • Using SAS Portal for Communicating IT Domain Intelligence . . . . . . . . . . . . . . . 129Overview of SAS Information Delivery Portal . . . . . . . . . . . . . . . . . . . . . . . . . . . . . . 129Locating SAS Information Delivery Portal Documentation . . . . . . . . . . . . . . . . . . . . 132
Chapter 15 • Using SAS BI Dashboard . . . . . . . . . . . . . . . . . . . . . . . . . . . . . . . . . . . . . . . . . . . . . 133Overview of SAS BI Dashboard . . . . . . . . . . . . . . . . . . . . . . . . . . . . . . . . . . . . . . . . . . 133Locating SAS BI Dashboard Documentation . . . . . . . . . . . . . . . . . . . . . . . . . . . . . . . . 135
iv Contents

PART 5 Appendixes 137
Appendix 1 • Naming Standards for Reporting Objects . . . . . . . . . . . . . . . . . . . . . . . . . . . . . . . 139About Naming Standards for SAS IT Resource Management Reporting Objects . . . . 139Naming Standards and Location of Objects . . . . . . . . . . . . . . . . . . . . . . . . . . . . . . . . . 139
Appendix 2 • Reporting Standards for SAS IT Resource Management Reports . . . . . . . . . . . 145About Reporting Standards for SAS IT Resource Management Reports . . . . . . . . . . . 145Standards for SAS IT Resource Management Report Elements . . . . . . . . . . . . . . . . . 146Standard Specifications for Report Tasks . . . . . . . . . . . . . . . . . . . . . . . . . . . . . . . . . . . 150
Appendix 3 • Troubleshooting and Debugging Tips . . . . . . . . . . . . . . . . . . . . . . . . . . . . . . . . . . 153Invalid User ID or Password Error Message Is Received . . . . . . . . . . . . . . . . . . . . . . 153Invalid User ID and Password Embedded in Generated Code of Report Jobs . . . . . . . 153Backing Up Reports . . . . . . . . . . . . . . . . . . . . . . . . . . . . . . . . . . . . . . . . . . . . . . . . . . . 154Duplicate Reports Are Stored on the SAS Content Server . . . . . . . . . . . . . . . . . . . . . . 154Why Are Reports Missing from the Gallery Manager? . . . . . . . . . . . . . . . . . . . . . . . . 155Why Report Jobs Are Not Generating Reports . . . . . . . . . . . . . . . . . . . . . . . . . . . . . . 155Error Message: Select a SAS Content Server . . . . . . . . . . . . . . . . . . . . . . . . . . . . . . . . 157How to Debug a Middle-tier Connection Problem in a Report Job . . . . . . . . . . . . . . . 158How to Access Gallery Manager Reports in the SAS Content Server . . . . . . . . . . . . . 159How to Refresh the Cache for Gallery Manager Reports . . . . . . . . . . . . . . . . . . . . . . . 160Technical Support . . . . . . . . . . . . . . . . . . . . . . . . . . . . . . . . . . . . . . . . . . . . . . . . . . . . . 160
Appendix 4 • Best Practices . . . . . . . . . . . . . . . . . . . . . . . . . . . . . . . . . . . . . . . . . . . . . . . . . . . . . 161Run Report Jobs at Night or during Low Usage Periods . . . . . . . . . . . . . . . . . . . . . . . 161Limit the Reports That the Filters Can Retrieve When Creating a Gallery . . . . . . . . . 161Managing SAS Enterprise Guide Projects for SAS IT Resource Management . . . . . . 162Designing Reports for Batch Jobs . . . . . . . . . . . . . . . . . . . . . . . . . . . . . . . . . . . . . . . . 165Create Tile Charts with Web Links . . . . . . . . . . . . . . . . . . . . . . . . . . . . . . . . . . . . . . . 166Override Report Expiration Dates to Purge Reports from the SAS Content Server . . 166Back Up Your Data and Reports . . . . . . . . . . . . . . . . . . . . . . . . . . . . . . . . . . . . . . . . . 166Schedule Report Jobs Based on the Available Data . . . . . . . . . . . . . . . . . . . . . . . . . . . 167
Appendix 5 • Report Conversion Guide . . . . . . . . . . . . . . . . . . . . . . . . . . . . . . . . . . . . . . . . . . . . 169Converting Reports . . . . . . . . . . . . . . . . . . . . . . . . . . . . . . . . . . . . . . . . . . . . . . . . . . . . 170Creating Bar and Pie Charts Using SAS Enterprise Guide . . . . . . . . . . . . . . . . . . . . . 177Creating Line and Other Plots Using SAS Enterprise Guide . . . . . . . . . . . . . . . . . . . . 189Creating Tabular Reports Using SAS Enterprise Guide . . . . . . . . . . . . . . . . . . . . . . . . 201Working with SAS IT Resource Management . . . . . . . . . . . . . . . . . . . . . . . . . . . . . . . 210
Appendix 6 • Recommended Reading . . . . . . . . . . . . . . . . . . . . . . . . . . . . . . . . . . . . . . . . . . . . . 213
Index . . . . . . . . . . . . . . . . . . . . . . . . . . . . . . . . . . . . . . . . . . . . . . . . . . . . . . . . 215
Contents v

vi Contents

About This Book
Audience
The purpose of the SAS IT Resource Management: Reporting Guide is to present alltopics that are related to SAS IT Resource Management reporting. For information aboutsystem administration and data preparation topics, see the SAS IT ResourceManagement: Administrator's Guide.
The SAS IT Resource Management: Reporting Guide is designed for the following users:
• Performance analysts are responsible for analyzing IT performance data andcommunicating the results of this analysis. Performance analysts use SAS ITResource Management to design and create reports for the purposes of ITperformance management and capacity planning.
These users understand how to analyze the IT resource measurement data that ismanaged by data administrators. They analyze this data to measure the utilization,availability, and performance of IT resources. They also plan the proper adjustmentsto the IT infrastructure to meet the current and projected demands of the business.Performance analysts often function as capacity planners, system administrators, andbusiness analysts. Their job responsibilities require them to analyze data and tocommunicate IT intelligence by designing, generating, sharing, and viewing reports.
Performance analysts typically use the documentation that is found in this reportingguide. They might also refer to all SAS IT Resource Management documentation orSAS product documentation for those products that are included in the SAS ITResource Management solution such as SAS Enterprise Guide.
• Information consumers are responsible for analyzing report data and makingdecisions based on that data.
These users are business people who are interested in the overall performanceaspects of IT at a company. They often function as system architects, IT managers,and IT executives. Information consumers use the reports that are generated by SASIT Resource Management to support decisions that they make regarding the ITinfrastructure. They need to access IT intelligence reports from the office as well asfrom remote locations.
Information consumers typically use the documentation that is found in this reportingguide, especially the sections about interpreting reports and using SAS Web ReportStudio. They might also refer to the Introduction to SAS IT Resource Managementand the SAS IT Resource Management: Gallery Manager User’s Guide.
• Data administrators are responsible for administering the IT data mart and setting upthe jobs that stage and aggregate IT performance data so that report-ready data isavailable for generating reports.
vii

These users are responsible for administering the IT data mart and adapters; handlingthe extract, transform, and load (ETL) processes; and managing reporting processes.Data administrators typically deploy and schedule the batch production jobs thatprepare and generate IT performance reports. They often function as IT performancemanagers and capacity planners.
Data administrators primarily use the documentation that is found in the SAS ITResource Management: Administrator's Guide. They might also refer to all SAS ITResource Management documentation or SAS product documentation for thoseproducts that are included in the SAS IT Resource Management solution such asSAS Enterprise Guide.
RequirementsHere are the prerequisites for using SAS IT Resource Management:
• A user ID and password that is appropriate for the type of access that is needed toaccomplish designated IT Resource Management functions.
Note: Data administrators use SAS Management Console to define the logins forusers and groups of users, based on their roles and the SAS products with whichthey need to work. For more information, see the “Preparing to Work with theSAS IT Resource Management Client” chapter in the SAS IT ResourceManagement: Administrator’s Guide.
• An operating environment that includes a supported client, middle tier, and server.
• Depending on your role, you might need access to SAS software that is used by SASIT Resource Management.
Note: To log on to the SAS products in the following list, select Programs ð SAS.From the list of software that is displayed, select the application that you want towork with. Then enter your user ID and password.
• SAS IT Resource Management
Note: The SAS IT Resource Management solution provides additional IT-specific features and functionality to the data management capabilities ofSAS Data Integration Studio. These additional features and functions areseamlessly integrated with those of SAS Data Integration Studio. Theenhanced capabilities of SAS Data Integration Studio that are delivered bySAS IT Resource Management are commonly referred to as the SAS ITResource Management client, throughout this document.
• SAS Information Map Studio
• SAS Enterprise Guide with add-in for SAS IT Resource Management
• SAS Management Console
You might also want to access SAS products that are Web-based.
Note: To log on to the SAS products in the following list, open your Web browserand point it to the URL address of the product that you want to use.
• SAS IT Resource Management – Gallery Manager, referred to as GalleryManager throughout the remainder of this document
• SAS Web Report Studio
• SAS BI Dashboard
viii About This Book

• SAS ID Portal
• SAS Add-In for Microsoft Office
Online Help is available for all SAS software. Click Help within the product in orderto access it. In addition, documentation for SAS software is available at http://support.sas.com/documentation/index.html. Use the A-Z index tolocate the documentation that you want to access.
Note: For information about the architecture and the components of SAS ITResource Management, see the Introduction to SAS IT Resource Management.
Requirements ix

x About This Book

Part 1
Introduction to SAS IT ResourceManagement and BatchReporting
Chapter 1About SAS IT Resource Management . . . . . . . . . . . . . . . . . . . . . . . . . . . . . 3
Chapter 2About Batch Reporting . . . . . . . . . . . . . . . . . . . . . . . . . . . . . . . . . . . . . . . . . . . 9
Chapter 3Working with the Adapter Setup Wizard . . . . . . . . . . . . . . . . . . . . . . . . . . 19
1

2

Chapter 1
About SAS IT ResourceManagement
What Is SAS IT Resource Management? . . . . . . . . . . . . . . . . . . . . . . . . . . . . . . . . . . . 3
Benefits of Using SAS IT Resource Management . . . . . . . . . . . . . . . . . . . . . . . . . . . . 4
How Does SAS IT Resource Management Work? . . . . . . . . . . . . . . . . . . . . . . . . . . . 4
How to Locate Documentation and Help for SAS IT Resource Management . . . . . 6Accessing SAS IT Resource Management Online Help . . . . . . . . . . . . . . . . . . . . . . 6Accessing SAS IT Resource Management Documentation . . . . . . . . . . . . . . . . . . . . 6
Accessibility . . . . . . . . . . . . . . . . . . . . . . . . . . . . . . . . . . . . . . . . . . . . . . . . . . . . . . . . . . . 7
What Is SAS IT Resource Management?SAS IT Resource Management is an IT performance management and capacity planningsolution that enables the analysis of any IT data source. The solution creates anintegrated IT performance data warehouse, delivers and applies the advanced analyticcapabilities of SAS to that warehouse for the purposes of IT performance managementand capacity planning, and renders the IT Intelligence necessary to optimize the ITinfrastructure. In addition, the solution leverages the IT performance data warehouse andthe SAS product capabilities that are included in the solution for purposes beyond thescope of IT performance management such as IT financial management or IT servicemanagement. With IT Resource Management, IT departments can manage and plan theusage of their resources to provide a stable yet scalable IT environment for its currentand future operations.
To meet the challenges of today’s competitive business environment, the IT departmentmust solicit information from the leaders of the business about the demands that directlyaffect the IT infrastructure. Concurrently, the IT department must deliver enoughinformation about the performance and capacity of IT resources to allow the business'sdecision makers to understand and evaluate their current consumption of IT. As such, thecommunication of IT performance and capacity information must be in a language andformat that is suitable for its intended purpose and audience. It is the role of ITperformance management and capacity planning software to facilitate thiscommunication so that the IT department can plan and implement adjustments to the ITinfrastructure. In the end, this ensures that the business remains competitive andresponsive to its customers.
3

Benefits of Using SAS IT Resource ManagementSAS IT Resource Management can be used to resolve a variety of systems managementchallenges within an organization. It provides the functionality to do the following tasks:
• Establish IT data marts that contain all the resource management data, over variousperiods of time, that is associated with an enterprise.
• Define and create aggregated data that is specific to a site's analysis and reportingrequirements.
• Create common references to common measurements that are available in disparatedata sources. This ensures that the IT data mart provides an independent set ofmeasurements that can be analyzed across the IT enterprise.
• Provide graphical and textual reports that contain information that is needed tomanage current day IT operations.
• Use SAS IT domain knowledge for performance management, capacity planning, ITresource forecasting, peak period and seasonality analysis, workload analysis, andenterprise IT performance summaries. This information complements existing ITutilization, availability, and performance analysis capabilities.
• Provide a variety of report output mediums to accommodate the needs of the dataadministrators, performance analysts, and high-level information consumers.
How Does SAS IT Resource Management Work?SAS IT Resource Management supports adapters for many of the most popular networksystem and application management tools across the Windows, UNIX, and z/OSoperating environments. It also provides the tooling for the creation of user-writtenadapters for any data source that is not natively supported by the solution. In doing so, ittakes advantage of SAS®9 and the enterprise-class solutions that SAS® 9 provides, suchas:
• SAS Data Integration Studio
This solution provides flexible data integration and specific IT ResourceManagement services for most data sources. These services perform most of the datapreparation and aggregation work that is needed to analyze and report on resourceperformance. These services enable you to perform the following tasks:
• Create and maintain the IT data marts that are the containers for the staging,aggregation, information map, and report jobs as well as the staged tables andlibraries, the aggregation tables and libraries, and the information maps that arecreated by or used by SAS IT Resource Management.
• Create, maintain, and deploy the jobs that populate the IT data mart.
• Calculate new columns and statistics from the input data.
• Create and run the jobs that aggregate the data.
• Create analysis and report-ready data sources from the aggregated data.
• Create and run jobs that produce IT intelligence reports.
4 Chapter 1 • About SAS IT Resource Management

• SAS Enterprise Guide
This solution provides comprehensive reporting definition services. Report tasks canbe run interactively in SAS Enterprise Guide projects by running the branches of aproject that include those report tasks.
Each SAS Enterprise Guide project that SAS IT Resource Management suppliesincludes one or more ITRM Gallery tasks. ITRM Gallery tasks publish the reportdefinitions to the SAS Metadata Server so that the SAS IT Resource Managementclient can include that report definition in a report job. Those jobs are then deployedand scheduled for execution in batch mode. The resulting report output can beaccessed by the Gallery Manager web application.
• Gallery Manager
This Web-based application manages and organizes report output that is stored onthe SAS Content Server. Filters are available to use in organizing the report output.
• SAS Business Intelligence Platform
This platform uses the SAS Foundation technology, which includes the followingsoftware: Base SAS, SAS/GRAPH, the Output Delivery System (ODS), and othertechnologies. It also uses the following components:
• SAS Information Map Studio: This product provides easy access to data usingbusiness-oriented terminology. Information maps that are created by theinformation map transformation in the SAS IT Resource Management client canbe read and modified by SAS Information Map Studio.
• SAS Metadata Repository: This repository of centralized metadata storesinformation about the objects that are created and used by SAS IT ResourceManagement, such as IT data marts, ETL jobs, information maps, report tasks,report jobs, and more.
• SAS Web Report Studio: This Web-based, interactive query and analysis toolsimplifies and standardizes access to and reporting of performance information.
• SAS Information Delivery Portal: This customizable portal provides corporatedecision makers with easy access to the data that is most pertinent to them bymeans of reports and dashboards, such as key performance indicators (KPIs),filter reports, and more. SAS Information Delivery Portal enables the selectiveand secure dissemination of information throughout an organization.
• The BI Dashboard is a Web-based interface that displays within SAS InformationDelivery Portal. Using data and information maps from multiple sources,information consumers and performance analysts users can create dashboardsthat display information that is pertinent to their areas of interest.
• SAS Add-In for Microsoft Office: This product enables integration withcommonly used Microsoft products such as Microsoft Word and MicrosoftExcel.
• SAS Statistics, High Performance Forecasting, and Econometric Time Series:These solutions provide a complete set of SAS statistical methods for IT dataanalysis.
For more information, see Chapter 1, "General Overview" of SAS IT ResourceManagement: Administrator's Guide.
How Does SAS IT Resource Management Work? 5

How to Locate Documentation and Help for SASIT Resource Management
Accessing SAS IT Resource Management Online HelpOnline Help is available for anyone who performs tasks with the user interface.
Note: The Help that is provided with this release of the SAS IT Resource Managementsoftware briefly describes the fields on the windows that are specific to IT ResourceManagement.
To display the field-based Help window for an active window or tab, click Help or pressthe F1 key. To search for topics about concepts or features that are identified by specificwords, such as "information maps," click the Search tab (magnifying glass icon) in theHelp window. Enter the text to be found and press the ENTER key.
Online Help is available for all SAS technology products on which SAS IT ResourceManagement is built.
Accessing SAS IT Resource Management DocumentationThe SAS IT Resource Management: Administrator's Guide can be accessed from theStart menu by selecting Programs ð SAS ð SAS IT Resource Management ð SASIT Resource Management 3.2: Administrator's Guide.
The following SAS IT Resource Management documentation is available fromhttp://support.sas.com/itrm:
• What's New in SAS IT Resource Management
This document provides a brief description of the new features that are included inthis release of the SAS IT Resource Management software and documentation.
• Introduction to SAS IT Resource Management
This document provides information about the extensive domain intelligence that isavailable with SAS IT Resource Management.
The audience for this introductory document is anyone who works with SAS ITResource Management or who uses the reports that are generated by the software.
• SAS IT Resource Management: Administrator's Guide
This document contains detailed information about the tasks that are required to setup and manage the IT data mart. It also describes how to set up the IT ResourceManagement adapters so that they can process the IT resource data that is stored inthe IT data mart. This guide provides information about how to set up and maintainIT data marts, work with simple and summarized aggregations, information maps,and the wizards, especially the Adapter Setup wizard, that facilitate the specificationof the extract, transform, and load (ETL) processes that are required foradministering a site's IT resource data.
This document provides information about the other functional components of thesoftware, such as the SAS Metadata Repository (SMR) and the like.
The audience for this document is SAS IT Resource Management data administratorsor capacity planners.
6 Chapter 1 • About SAS IT Resource Management

• SAS IT Resource Management: Reporting Guide
This document contains detailed information about the tasks that are required togenerate, view, and manage reports. It describes how to work with the ITRM Gallerytask in SAS Enterprise Guide, Gallery transformations that are available from theSAS IT Resource Management client, and the Gallery Manager application. It alsoprovides general information about other SAS products that support the reportingprocesses, such as SAS Web Report Studio, SAS Information Delivery Portal, andSAS Add-in for Microsoft Office.
A “Report Conversion” appendix provides a description of the steps that areperformed in order to recreate reports that were generated using SAS IT ResourceManagement 2.7 report macros. These steps use SAS Enterprise Guide, which isincluded in SAS IT Resource Management. Separate instructions are provided forconverting report macros to SAS Enterprise Guide 4.1 (which is used by SAS ITResource Management 3.1.1) and to SAS Enterprise Guide 4.3 (which is used bySAS IT Resource Management 3.2 and later).
• SAS IT Resource Management: Gallery Manager User's Guide
This document contains detailed information about the tasks that are required tocreate, view, and manage galleries and to view the reports that are included in thosegalleries.
• SAS IT Resource Management: Migration Documentation
This document provides a description of the steps that are performed in order tomove a site's processing from the earlier versions of the software to the currentversion.
• SAS IT Resource Management Glossary
This glossary provides definitions for terms that are used in SAS IT ResourceManagement.
• SAS IT Resource Management: Supplied Staged and Aggregation Tables forSupported Adapters
This HTML resource contains detailed table and column information about thestaged tables and aggregation tables that are generated by the Adapter Setup wizard.
Note: Information about the system requirements, supported adapter metrics, and theSAS IT Resource Management data models is also available at http://support.sas.com/itrm.
Documentation is available for the business intelligence and data integration componentsof the SAS Intelligence Platform and all the SAS products that are referenced in thisdocument. To access this documentation, navigate to the Web site at this location:http://support.sas.com/documentation/onlinedoc/index.html. Onthis page, use the Select a Product drop-down menu to choose the documentation forthe product or solution that you want to view. Then click Go.
AccessibilitySAS IT Resource Management includes the following accessibility and compatibilityfeatures that improve usability of the product for users with disabilities. These featuresare related to accessibility standards for electronic information technology that wereadopted by the U.S. Government under Section 508 of the U.S. Rehabilitation Act of1973, as amended.
Accessibility 7

If you have questions or concerns about the accessibility of SAS products, send e-mail [email protected].
SAS IT Resource Management addresses several areas of 508 compliance:
• Software accessibility compliance applies to software.
In SAS IT Resource Management, software accessibility compliance applies to theSAS Data Integration Studio user interface. SAS IT Resource Management uses thefunctionality of SAS Data Integration Studio for data manipulation functions. Assuch it has the same accessibility features as that product. For information aboutthese features, see SAS Data Integration Studio: User's Guide.
• Windows accessibility compliance applies to Windows applications, such as SASEnterprise Guide and SAS Add-In for Microsoft Office.
SAS Enterprise Guide conforms to accessibility standards for the Windows platform.In addition, SAS Enterprise Guide has keyboard shortcuts for the following areas:the Import Data task, the main workspace, menus, the project tree, a process flow,the properties window for an object, and the code editor. For more information, seethe Keyboard Shortcuts in the Help for SAS Enterprise Guide.
You can also use keyboard navigation to navigate through the options in a drop-down list by pressing ALT and the up and down arrow keys.
In some instances, you can use the Enable accessibility features option to enableadditional accessibility features in the task windows and the windows that appearwhen you run a stored process. This option is available from the Options dialog box.
• Web accessibility compliance applies to browser-based content and Web-basedapplications, such as SAS Web Report Studio, SAS ID Portal, SAS BI Dashboard.
The accessibility features for these products are described in the documentation for theseproducts. To locate the appropriate documentation for a SAS product, use the A-Z indexat this location: http://support.sas.com/documentation/index.html.
8 Chapter 1 • About SAS IT Resource Management

Chapter 2
About Batch Reporting
Overview of How SAS IT Resource Management Works toCreate Batch Reports . . . . . . . . . . . . . . . . . . . . . . . . . . . . . . . . . . . . . . . . . . . . . . . . . . . 9
Overview of Batch Reporting . . . . . . . . . . . . . . . . . . . . . . . . . . . . . . . . . . . . . . . . . . . 10Batch Reporting Architecture . . . . . . . . . . . . . . . . . . . . . . . . . . . . . . . . . . . . . . . . . . 10Information Map . . . . . . . . . . . . . . . . . . . . . . . . . . . . . . . . . . . . . . . . . . . . . . . . . . . . 12SAS Enterprise Guide Project . . . . . . . . . . . . . . . . . . . . . . . . . . . . . . . . . . . . . . . . . 12ITRM Gallery Task . . . . . . . . . . . . . . . . . . . . . . . . . . . . . . . . . . . . . . . . . . . . . . . . . . 12Report Definition . . . . . . . . . . . . . . . . . . . . . . . . . . . . . . . . . . . . . . . . . . . . . . . . . . . 12Gallery Transformation . . . . . . . . . . . . . . . . . . . . . . . . . . . . . . . . . . . . . . . . . . . . . . 13Report Job . . . . . . . . . . . . . . . . . . . . . . . . . . . . . . . . . . . . . . . . . . . . . . . . . . . . . . . . . 13Report Output . . . . . . . . . . . . . . . . . . . . . . . . . . . . . . . . . . . . . . . . . . . . . . . . . . . . . . 13SAS Content Server . . . . . . . . . . . . . . . . . . . . . . . . . . . . . . . . . . . . . . . . . . . . . . . . . 13Gallery Manager . . . . . . . . . . . . . . . . . . . . . . . . . . . . . . . . . . . . . . . . . . . . . . . . . . . . 13
Reporting Components across SAS Products and Applications . . . . . . . . . . . . . . . 14
Overview of How SAS IT Resource ManagementWorks to Create Batch Reports
SAS IT Resource Management provides the processes and the supporting technologythat are required to regularly collect, aggregate, analyze, and report on the ITperformance evaluation data that is vital to the health of an enterprise.
In general, the processes that gather and monitor IT performance evaluation data consistof the following steps.
Prepare IT performance data for reporting:
1. Collect the raw data about a resource.
2. Process (stage) the raw data.
3. Aggregate the data from the staged tables.
4. Generate information maps.
Generate and analyze IT reports:
5. Define and generate the reports.
6. View the reports.
9
The first four steps in the preceding process prepare your IT performance data forreporting. The SAS IT Resource Management: Administrator’s Guide provides detailedinformation about each of these processes and describes how a systems administratormight work with SAS IT Resource Management to prepare raw IT data for reporting.
The last two steps in the process make up the reporting process. These steps define theIT reports that you want to generate and enable you to view the report output to analyzeyour data. This book, the SAS IT Resource Management: Reporting Guide, providesdetailed information about each of these processes and their components.
Overview of Batch Reporting
Batch Reporting ArchitectureThe Adapter Setup wizard in SAS IT Resource Management enables you to easilyinvoke and create the components that are needed for batch reporting on various adaptersand domain categories. These reporting components are either supplied by SAS ITResource Management (such as supplied SAS Enterprise Guide projects and reportdefinitions) or created when the Adapter Setup wizard executes (such as the reportingjobs and gallery transformations).
10 Chapter 2 • About Batch Reporting

The following figure shows the basic components of the batch reporting process andhow these components work together to create batch reports.
Figure 2.1 Overview of Reporting Components and Batch Reporting Architecture
Information Map
can be identified in
ITRM Gallery task component of the
project publishes
resides in metadata and is selected in the
Gallery transformation component of a report job
is executed to generate
is stored in
reads report output from the SAS Content Server
and displays collections of reports
SAS Enterprise Guide Project
Report Definition
Report Job
Report Output
and Metadata
Gallery Manager
SAS
Content Server
Gallery Transformation
ITRM Gallery Task
Overview of Batch Reporting 11

Each component of the batch reporting process contributes to the final report output andspecifies characteristics of the report such as its content, appearance, location, filters forviewing, and expiration date. You can use the supplied components and predefinedprocess flows for your batch reports. You can also use these supplied components astemplates to customize the supplied batch reports for your business needs or create yourown batch reports with different reporting parameters.
The following topics in this section describe how each of the reporting components inthe batch reporting architecture work together to generate IT reports and make themavailable for viewing. After you understand the function of each component, where it fitsin the batch reporting architecture, and how it affects the other reporting components,then you can work with these components to create or modify your own batch reports ifnecessary.
Information MapInformation maps are data sources that include a collection of data items and filters thatdescribe and present a report-ready view of your IT resource data. Information maps arestored in IT data marts.
Report definitions in the report jobs use information maps to locate and filter thephysical data for report input. Pointers to information maps are also included in the SASEnterprise Guide projects that SAS IT Resource Management supplies.
SAS Enterprise Guide ProjectSAS IT Resource Management supplies SAS Enterprise Guide projects for severalsupported adapters and domain categories. These projects manage references to data,related report tasks, code, and report results that determine how data appears in the batchreports that the Adapter Setup wizard creates.
An ITRM Gallery task is appended to each branch of a project. This task extracts thegenerated code of the branch and additional metadata to include it in a report definitionthat it creates and saves on the SAS Metadata Server for use by Gallery transformationsthat are in report jobs.
ITRM Gallery TaskThe ITRM Gallery task is the last component of a supplied SAS Enterprise Guideproject process flow. The ITRM Gallery task specifies the filters and metadata that areused to view the report output in the Gallery Manager. When run, the ITRM Gallery taskcreates a report definition that includes all of the metadata and SAS code from a givenbranch of your SAS Enterprise Guide project. The report definition also includes thefilters and additional metadata that are specified in the task.
The resulting report definitions are saved on the SAS Metadata Server and used byGallery transformations that are in report jobs.
Report DefinitionA report definition, created by an ITRM Gallery task and stored in the SAS MetadataServer, contains the SAS code that defines one or more reports. Report definitionsinclude the metadata values that can be used as filters to subset reports in GalleryManager. These properties, specified in the ITRM Gallery task that creates the reportdefinition, include filter values for domain category, domain subcategory, job schedulefrequency, and possibly other keywords that might be specific to the report.
12 Chapter 2 • About Batch Reporting

The Gallery transformation, a component of a SAS IT Resource Management report job,identifies the report definitions that are used to create the report output when the job isrun.
Gallery TransformationGallery transformations are part of the report jobs that support the reporting functions ofSAS IT Resource Management. A Gallery transformation specifies how to grouptogether report definitions that generate reports and store output on the SAS ContentServer. A Gallery transformation can also adjust the expiration date of report output,overriding the parameter that is specified in the associated report definitions.
When executed, the report job that contains the Gallery transformation uses the reportdefinitions that the transformation identifies to generate report output.
Report JobReport jobs consist of Gallery transformations that, when executed, generate SAS codethat creates reports from the report definitions that are identified in the Gallerytransformation. The report jobs, stored in the IT data mart, create and delete reportoutput.
Report OutputReport output is the report that the report job creates when executed. The reports arestored on the SAS Content Server, a server that SAS IT Resource Management uses forremote content management. The SAS Content Server stores report content and theassociated report properties. It also provides version control and distribution of thestored reports.
After the SAS IT Resource Management reports are available on the SAS ContentServer, you can use Gallery Manager to view the reports.
SAS Content ServerThe SAS Content Server is a content repository where SAS IT Resource Managementstores reports and report metadata that is the output of report jobs. These report jobsinclude Gallery transformations that specify the repository folder path, relative to theSAS Content Server, in which to store the reports. These reports are generated andstored on the SAS Content Server in corresponding subfolders of the sasdav/ITRMfolder.
Gallery ManagerGallery Manager is a Web-based application that enables you to view and organize theSAS IT Resource Management reports that are available in the SAS Content Server.
Overview of Batch Reporting 13

Reporting Components across SAS Products andApplications
When working with batch reporting for SAS IT Resource Management, you might needto work with several of the reporting components that are described in this chapter.These components are accessible in various SAS products and applications that you useto create, modify, and view SAS IT Resource Management reports.
For example, working with a reporting component might require that you access GalleryManager, SAS Enterprise Guide, and the SAS IT Resource Management client tocomplete modifications for the reporting process. The recommended process formodifying a supplied report is to view the properties of a report in Gallery Manager,identify the reporting components that correspond to that report, and modify thereporting components as needed. For more information, see “How to Create or ModifyYour Own Batch Reports” on page 35.
The Report Properties dialog box in Gallery Manager provides the SAS EnterpriseGuide project, process flow, and ITRM Gallery task names. It also provides the domaincategory and information map (the data source from which the report is generated) thatare associated with a report. This report metadata enables you to locate thecorresponding SAS Enterprise Guide project, process flow, information map, and ITRMGallery task from which the report was designed and created. This report metadata alsoenables you to use the SAS IT Resource Management client to locate the domaincategory, information map, report job, and Gallery transformation that are created anddeployed to produce the report.
The following three figures show the relationships of these reporting components as theyare represented in each of the SAS products and applications that you might use toidentify and specify them. A single reporting component is marked with the samenumber in each of the three figures for easy comparison.
14 Chapter 2 • About Batch Reporting

Figure 2.2 Report Properties Dialog Box in Gallery Manager
1
2
3
4
5
information map or data source
SAS Enterprise Guide project name
SAS Enterprise Guide process flow
ITRM Gallery task and report definition name
domain category
1
2
3
4
5
Reporting Components across SAS Products and Applications 15
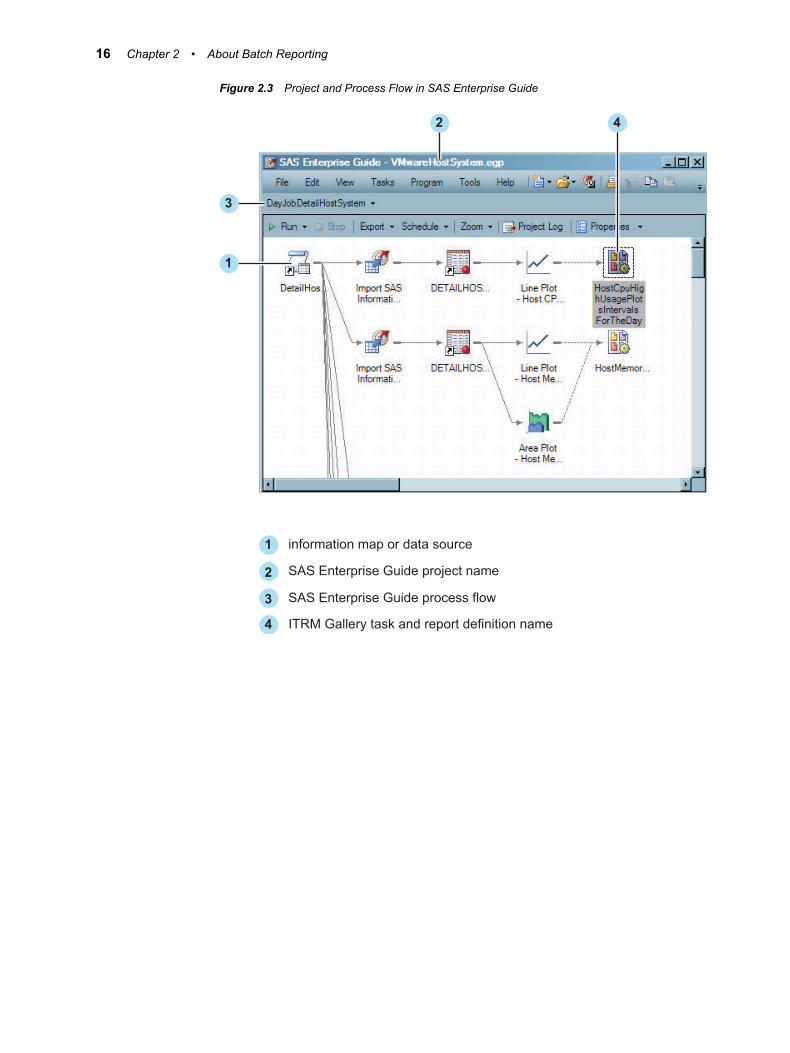
Figure 2.3 Project and Process Flow in SAS Enterprise Guide
3
1
2 4
1
2
3
4
information map or data source
SAS Enterprise Guide project name
SAS Enterprise Guide process flow
ITRM Gallery task and report definition name
16 Chapter 2 • About Batch Reporting

Figure 2.4 Report Job and Gallery Transformation Properties in the SAS IT ResourceManagement Client
5
5
1
2
3
4
5
6
information map or data source
SAS Enterprise Guide project name
SAS Enterprise Guide process flow
ITRM Gallery task and report definition name
domain category
report job and Gallery transformation
1
6
2
3
6 4
Reporting Components across SAS Products and Applications 17

18 Chapter 2 • About Batch Reporting

Chapter 3
Working with the Adapter SetupWizard
What Is the Adapter Setup Wizard? . . . . . . . . . . . . . . . . . . . . . . . . . . . . . . . . . . . . . 19
How to Use the Adapter Setup Wizard . . . . . . . . . . . . . . . . . . . . . . . . . . . . . . . . . . . . 20
Reporting Jobs and Objects Created by the Adapter Setup Wizard . . . . . . . . . . . 26About Reporting Jobs Created by the Adapter Setup Wizard . . . . . . . . . . . . . . . . . 26How to Determine Whether the Adapter Setup Wizard Will
Create Reporting Jobs for Your Selections . . . . . . . . . . . . . . . . . . . . . . . . . . . . . . 27Deploy and Run Jobs That the Adapter Setup Wizard Creates . . . . . . . . . . . . . . . . 29
Using Domain Categories . . . . . . . . . . . . . . . . . . . . . . . . . . . . . . . . . . . . . . . . . . . . . . . 30
Types of Reports That the Adapter Setup Wizard Creates . . . . . . . . . . . . . . . . . . . 31
Viewing Batch Reports . . . . . . . . . . . . . . . . . . . . . . . . . . . . . . . . . . . . . . . . . . . . . . . . . 31
What Is the Adapter Setup Wizard?The SAS IT Resource Management client includes an Adapter Setup wizard. Thiswizard enables you to define and create staging jobs, aggregation jobs, information mapjobs, and reporting jobs that process the raw data for an IT resource. These jobs includepredefined configurations that are based on industry intelligence that represents a bestestimate about the types of aggregations and reports that most sites need for analysis.
The Adapter Setup wizard creates reporting jobs that produce reports that are goodchoices for many users. To examine the reports that SAS IT Resource Managementprovides, you can use the Adapter Setup wizard to process a sample set of data and thencreate and run the resulting report jobs. You can then use Gallery Manager to view thereports that are generated.
If the supplied reports do not meet all of the specific reporting needs for yourenvironment, then you can identify the modifications that you want to make to thereporting jobs. You can then work with the corresponding supplied SAS EnterpriseGuide projects and reporting architecture to implement your modifications. For moreinformation, see “How to Create or Modify Your Own Batch Reports” on page 35.
Note: If your site does not process data from any of the data sources for which SAS ITResource Management provides an adapter, then you can use an alternate data sourceto process a sample set of data to run the Adapter Setup wizard and view the reportsthat it generates. For example, some data sources that are commonly available in ITenterprises are SAR for UNIX systems, SNMP for IP networks, or a trial license ofDemand Technology Performance Sentry for Windows systems.
19

After the wizard creates the appropriate jobs, you can schedule and run each as needed.The jobs process the raw data in a manner that is specified by or based on a selectedadapter and domain category.
For more information about using the Adapter Setup wizard, see “How to Use theAdapter Setup Wizard” on page 20.
How to Use the Adapter Setup WizardThe Adapter Setup wizard guides you through several steps that help define staging,aggregation, and reporting components. These components are used to create the ETLjobs that process your IT resource data.
The following information provides brief instructions for completing the Adapter Setupwizard. For more detailed information about the specific fields and requirements foreach page of the wizard, see the “Creating Jobs Using the Adapter Setup Wizard” topicin the SAS IT Resource Management: Administrator’s Guide.
1. From the SAS IT Resource Management menu, select New ð IT ResourceManagement ð Adapter Setup to open the Adapter Setup wizard.
2. Specify the adapter for which you want to create jobs.
Display 3.1 Specify the Adapter
3. Specify the configuration level that represents the scope of output jobs that you wantthe Adapter Setup wizard to create.
Note: If you are using an adapter that does not include aggregations that arecategorized with configuration levels, then the level is automatically set to createa staging job only and this page does not appear.
20 Chapter 3 • Working with the Adapter Setup Wizard

Display 3.2 Specify the Level of Output
For more information about the metrics and aggregations that are supported for eachadapter, see the SAS IT Resource Management metrics documentation. To locate theSAS IT Resource Management documentation, use the Products Index at http://support.sas.com/documentation/index.html.
4. Specify the IT data mart where you want to save the ETL jobs that the Adapter Setupwizard will create, or create a new IT data mart.
Display 3.3 Specifying the IT Data Mart
5. Specify staging parameters for the selected adapter. Staging parameters vary byadapter as they specify the configurations that are required to extract, transform, and
How to Use the Adapter Setup Wizard 21

load specific raw data into staged tables. The following image is an example of thestaging parameters for the DT Perf Sentry adapter:
Display 3.4 Specifying Staging Parameters for the Adapter
6. Specify one or more domain categories that you want the Adapter Setup wizard touse when creating the resulting jobs.
Note: If you are using an adapter that does not have aggregation and informationmap jobs available from the Adapter Setup wizard, then the wizard creates only astaging job and skips this page.
22 Chapter 3 • Working with the Adapter Setup Wizard

Display 3.5 Select the Domain Categories for the Adapter
For more information, see “Using Domain Categories” on page 30.
7. Select the time periods and key metrics that you want to use for the aggregation andreporting jobs.
Note: If you are using an adapter that does not have aggregation and informationmap jobs available from the Adapter Setup wizard, then the wizard creates only astaging job and skips this page.
How to Use the Adapter Setup Wizard 23

Display 3.6 Select Time Periods and Metrics
8. Specify the location of any user-written formulas to use in addition to the formulasthat SAS IT Resource Management supplies.
Display 3.7 Specify User-Written Formulas
9. Specify the location of the SAS Content Server where the reports that are generatedfrom the resulting jobs are stored. Also specify whether you want the Adapter Setupwizard to automatically deploy the jobs that it creates.
24 Chapter 3 • Working with the Adapter Setup Wizard

This page does not appear if you selected the configuration level Staging Job Onlyon the second page of the wizard. In this case, the Adapter Setup wizard creates onlyone staging job that you must deploy manually.
Display 3.8 Specify SAS Content Server and Job Deployment Page
Note: If you are using domain categories that do not result in reporting jobs, then theSAS Content Server options are not available on this page. For more information,see the “Jobs That the Adapter Setup Wizard Creates for Domain Categories”appendix in the SAS IT Resource Management: Administrator’s Guide.
The report definitions that the Adapter Setup wizard uses to create the report jobs arestored on the SAS Metadata Server. In addition, the report output that is generatedfrom the report jobs is stored on the SAS Content Server.
a. If you are using domain categories that result in reporting jobs, then accept thedefault values for the following parameters for the SAS Content Server:
SAS Content Serverspecifies the name of the server that is used as the SAS Content Server forstoring report definitions and report job outputs.
Repository folder pathspecifies the path within the SAS Content Server where the reports are stored.The default location is /SASContentServer/repository/default/sasdav/ITRM.
URL file name parametersURL file name parameters specifies the parameters that pertain to the URLfilename, such as Proxy, user ID, or password. For example, the contents ofthis field could be user='userID', pass='password', and so on. The contents ofthis field are used to communicate with Gallery Manager. In mostconfigurations, these parameters are not needed.
How to Use the Adapter Setup Wizard 25

A value is optional in this field. The default value for this field is blank.
For information about the contents that can be entered in this field, see the“FILENAME Statement, URL Access Method” topic in the SAS 9.2Language Reference: Dictionary.
Note: The contents of the field are not verified.
b. Specify the parameters to indicate whether you want the Adapter Setup wizard todeploy the jobs that it creates.
10. View a summary of the metadata that you specified with the Adapter Setup wizard.
Display 3.9 View Specifications
11. Click Finish when complete. The wizard creates the jobs and saves them in a foldernamed <adapter><number> within the IT data mart that you selected.
Reporting Jobs and Objects Created by theAdapter Setup Wizard
About Reporting Jobs Created by the Adapter Setup WizardThe Adapter Setup wizard programmatically creates reporting jobs for the domaincategories and time periods that you might select. These reporting jobs are named usingthe convention <domain subcategory> <time period> (such as Daily,Weekly, and Monthly)> Reporting, and they are stored in the same domaincategory folder as the aggregation and information map jobs.
26 Chapter 3 • Working with the Adapter Setup Wizard

Reporting jobs include Gallery transformations that use report definitions andinformation maps to generate reports using data for IT resources. When a reporting jobexecutes, it creates the necessary report packages and reports based on the informationmaps that are in the same domain category folder. The reports are then saved as graphicfiles (such as HTML or .png files) in the SAS Content Server that you selected in theAdapter Setup wizard. For more information about the reporting jobs that the AdapterSetup wizard creates for specific domain categories and time periods, see “How toDetermine Whether the Adapter Setup Wizard Will Create Reporting Jobs for YourSelections”.
Note: The metadata server and SAS Content Server must be running when reportingjobs execute or the jobs will fail to generate output.
After a reporting job is deployed, scheduled, and executed, the resulting report output isavailable for viewing with Gallery Manager. Gallery Manager enables you to access,filter, and manage your report content from a Web browser. For more information, see“Working with the Gallery Manager” on page 93.
How to Determine Whether the Adapter Setup Wizard Will CreateReporting Jobs for Your Selections
SAS IT Resource Management supplies predefined report definitions for several domaincategories and time periods. These report definitions include information such as thenames of the variables, the report style, and other attributes that are used to buildgraphical reports from your IT resource data. The Adapter Setup wizard uses theseprepackaged report definitions in the reporting jobs that it creates for the domaincategories and time periods that you select.
Note: The prepackaged report definitions that the Adapter Setup wizard jobs use werecreated by the supplied SAS Enterprise Guide projects. If you want to modify areport that the Adapter Setup wizard creates, or if you want to create your own reportthat is similar to one that the wizard creates, then you can use the correspondingsupplied SAS Enterprise Guide project as a template. To do so, copy the suppliedproject and make the necessary modifications to create a modified report definition.For more information about how to complete this and other related tasks, see “Howto Create or Modify Your Own Batch Reports” on page 35 and “Managing SASEnterprise Guide Projects for SAS IT Resource Management” on page 162.
If you select a domain category and time period for which SAS IT ResourceManagement supplies report definitions, then the Adapter Setup wizard creates theappropriate reporting jobs. To determine whether the Adapter Setup wizard is going tocreate reporting jobs for the domain category and time periods that you selected, you canview the Summary page of the wizard before you select Finish.
Reporting Jobs and Objects Created by the Adapter Setup Wizard 27

The Summary page lists the report jobs that the Adapter Setup wizard will create and thereport definitions that the report jobs use, as shown in the following image:
Display 3.10 Example of a Summary Page Listing Report Jobs
Note: The Summary page also includes a note if no reporting jobs will be created.
You can also determine whether the Adapter Setup wizard is going to create reportingjobs based on your selections by viewing the list of supplied report definitions for agiven domain category and time period. If SAS IT Resource Management suppliesreport definitions for a given adapter, domain category, and time period, then theAdapter Setup wizard creates a reporting job for those selections based on theconfiguration level that you selected. If there are no supplied report definitions for agiven adapter, domain category, and time period, then the Adapter Setup wizard does notcreate reporting jobs for those selections.
To view the supplied report definitions, perform the following steps:
1. In the Folders tree, select Shared Data ð SAS IT Resource Management ð 3.2 ITReport Definitions.
2. Select an <adapter> folder.
3. Select a <domain category> folder.
4. Select Supplied.
5. Select a <time period> folder.
28 Chapter 3 • Working with the Adapter Setup Wizard
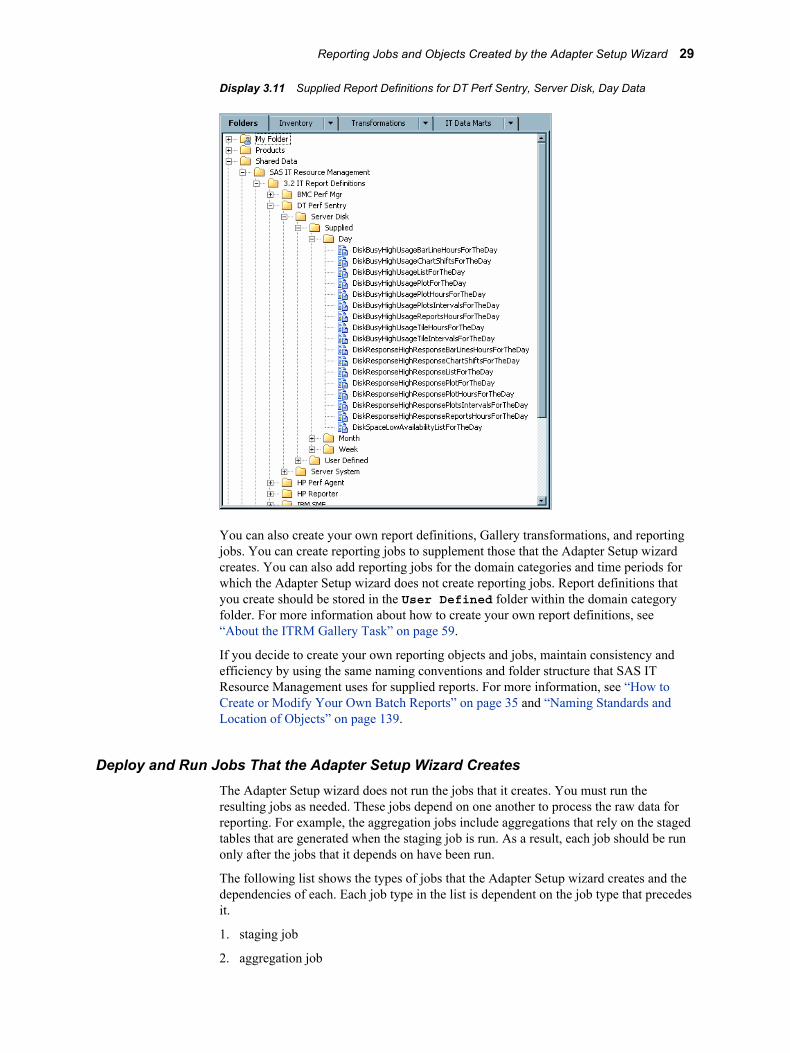
Display 3.11 Supplied Report Definitions for DT Perf Sentry, Server Disk, Day Data
You can also create your own report definitions, Gallery transformations, and reportingjobs. You can create reporting jobs to supplement those that the Adapter Setup wizardcreates. You can also add reporting jobs for the domain categories and time periods forwhich the Adapter Setup wizard does not create reporting jobs. Report definitions thatyou create should be stored in the User Defined folder within the domain categoryfolder. For more information about how to create your own report definitions, see“About the ITRM Gallery Task” on page 59.
If you decide to create your own reporting objects and jobs, maintain consistency andefficiency by using the same naming conventions and folder structure that SAS ITResource Management uses for supplied reports. For more information, see “How toCreate or Modify Your Own Batch Reports” on page 35 and “Naming Standards andLocation of Objects” on page 139.
Deploy and Run Jobs That the Adapter Setup Wizard CreatesThe Adapter Setup wizard does not run the jobs that it creates. You must run theresulting jobs as needed. These jobs depend on one another to process the raw data forreporting. For example, the aggregation jobs include aggregations that rely on the stagedtables that are generated when the staging job is run. As a result, each job should be runonly after the jobs that it depends on have been run.
The following list shows the types of jobs that the Adapter Setup wizard creates and thedependencies of each. Each job type in the list is dependent on the job type that precedesit.
1. staging job
2. aggregation job
Reporting Jobs and Objects Created by the Adapter Setup Wizard 29

3. information map job
4. reporting job
For more information, see “Deploying and Running Report Jobs” on page 73.
Note: Based on your specifications, the Adapter Setup wizard might not create all fourtypes of jobs (staging, aggregation, information map, and reporting) when itexecutes. For example, you might specify in the wizard to create only a staging job.Or, you might select a supported adapter for which the Adapter Setup wizard doesnot create reporting jobs.
Using Domain CategoriesDomain categories are categories of tables that are organized logically to representsubsets of the IT resource measurements that are available from an adapter. Thisorganization helps you create reports from one or more related aggregation tables of ITperformance measurements.
Note: The domain categories that the Adapter Setup wizard displays are not necessarilyall of the available domain categories for an adapter. You can view all of the domaincategories for an adapter by opening the Folders tree view and expanding Productsð SAS IT Resource Management ð Adapters ð <adapter name> ð ITTemplate Tables. The template tables are the metadata used to create staged tablesand are grouped by domain category. All of the domain categories for an adapter arein this list.
The domain categories that are associated with an adapter vary based on therequirements and capabilities of each adapter. If SAS IT Resource Management providesaggregation and information map jobs for a given adapter, then the Adapter Setupwizard enables you to select the domain categories that you want to use. If an adapterdoes not have aggregation and information map jobs available from the Adapter Setupwizard, then the wizard creates only a staging job and does not enable you to select adomain category.
This capability helps you manage system performance by enabling you to select thespecific domain categories that are essential to the performance management andcapacity planning processes for your enterprise. The time that the Adapter Setup wizardtakes to create the resulting jobs varies based on the number of staged tables,aggregation jobs and tables, information map jobs, and reporting jobs that are generatedfor the domain categories that you select.
Note: The Adapter Setup wizard creates ETL jobs based on the domain categories thatyou select. However, the domain categories for some adapters are divided furtherinto domain subcategories. In these cases, the jobs that are created are based on thedomain subcategories instead. This prevents jobs from being too large. Whenworking with the ETL jobs that the Adapter Setup wizard creates, you might noticethat the jobs are categorized into these subcategories.
For more information about the types of jobs that the Adapter Setup wizard creates foreach adapter and domain category, see the “Jobs That the Adapter Setup Wizard Createsfor Domain Categories” appendix in the SAS IT Resource Management: Administrator’sGuide.
30 Chapter 3 • Working with the Adapter Setup Wizard

Types of Reports That the Adapter Setup WizardCreates
The Adapter Setup wizard provides a wide variety of report types that provide analyticalintelligence about IT resources. These reports are designed and configured to show yourIT data in a format that is visually appealing and accurate. The selection of a report typeto communicate an IT domain intelligence fact is best made by understanding both themessage and the audience for which that message is targeted.
Some of the reports that the Adapter Setup wizard creates include tabular and line plots,bar charts, tile charts, and bubble plots. For more information and examples of reporttypes that the Adapter Setup wizard creates, see the “Domain Intelligence Offered bySAS IT Resource Management” topic in the Introduction to SAS IT ResourceManagement.
Viewing Batch ReportsThe Adapter Setup wizard enables you to create reporting jobs that run to generate batchreports. These batch reports are saved on the SAS Content Server. To view, manage, andsort these reports, you can use the Gallery Manager.
Gallery Manager is a Web-based application that enables performance analysts andinformation consumers to access, filter, and manage galleries of report content. For moreinformation, see “Working with the Gallery Manager” on page 93.
Viewing Batch Reports 31

32 Chapter 3 • Working with the Adapter Setup Wizard

Part 2
Creating and Modifying BatchReports
Chapter 4About Creating and Modifying Batch Reports . . . . . . . . . . . . . . . . . . . . 35
Chapter 5Working with Supplied SAS Enterprise Guide Projects . . . . . . . . . . . 45
Chapter 6Working with the ITRM Gallery Task in SAS Enterprise Guide . . . . . 59
Chapter 7Working with Gallery Transformations and Report Jobs . . . . . . . . . . 69
33

34

Chapter 4
About Creating and ModifyingBatch Reports
Why Create or Modify Batch Reports? . . . . . . . . . . . . . . . . . . . . . . . . . . . . . . . . . . . 35
How to Create or Modify Your Own Batch Reports . . . . . . . . . . . . . . . . . . . . . . . . . 35Understanding the Batch Reporting Process . . . . . . . . . . . . . . . . . . . . . . . . . . . . . . 35Prepare to Create or Modify Your Own Batch Reports . . . . . . . . . . . . . . . . . . . . . . 36Modifying the Data Source . . . . . . . . . . . . . . . . . . . . . . . . . . . . . . . . . . . . . . . . . . . . 36Modifying How Batch Reports Look . . . . . . . . . . . . . . . . . . . . . . . . . . . . . . . . . . . . 37Modifying the Metadata for the Reports Generated by a Report Definition . . . . . . 40Creating New Reports Using a Supplied Project as a Template . . . . . . . . . . . . . . . 41Creating New Reports from Scratch . . . . . . . . . . . . . . . . . . . . . . . . . . . . . . . . . . . . . 43
Why Create or Modify Batch Reports?The topics in this chapter describe the various ways that you can create your own batchreports or modify the batch reports that SAS IT Resource Management supplies. Thesetopics also provide information about the reporting components that you must modify toperform various tasks and how to find detailed information about these components.
The recommended process to create or modify batch reports is to first run the AdapterSetup wizard and the jobs that it creates to visually review the reports that SAS ITResource Management offers.
How to Create or Modify Your Own Batch Reports
Understanding the Batch Reporting ProcessThe batch reporting process consists of several reporting components that areinterconnected within a process flow. The components of this process flow are specifiedand then executed in a standard sequence in order to generate batch reports. For anexample of the reporting components and how they work together in the process flow,see “Overview of Batch Reporting” on page 10.
The Adapter Setup wizard enables you to automatically create and connect the reportingcomponents for several adapters and domain categories that you select. However, youmight choose to modify elements of specific reports or add to the existing set of reports.SAS IT Resource Management enables you to do so by making each reporting
35

component modifiable. You can make a copy of the supplied components and thenmodify the copies as needed to accommodate the reporting needs for your organization.
T I P When you modify or add a specific reporting component, you will likely need tomodify the other reporting components downstream in the process flow toaccommodate your change. For example, you might add an ITRM Gallery task in aSAS Enterprise Guide project to create a new report definition. You must then add ormodify a corresponding Gallery transformation in the report job to identify the newreport definition.
Prepare to Create or Modify Your Own Batch ReportsBefore you decide to create or modify your own batch reports, visually review thereports that the Adapter Setup wizard creates and determine whether these reports meetyour needs. To do so, perform the following steps:
1. In SAS IT Resource Management, run the Adapter Setup wizard for selectedadapters and domain categories.
For more information, see “How to Use the Adapter Setup Wizard” on page 20.
T I P For best results, use more than one day of data that spans across the week andmonth boundaries. For example, include data that includes at least the last day ofa week and month as well as the first day of the following week and month. Thisscope of data ensures that you can generate daily, weekly, and monthly reports. Ifyou use data from one day only, then you will not be able to generate weekly ormonthly reports.
2. Deploy and run the resulting jobs.
For more information, see the “Jobs” chapter in the SAS IT Resource Management:Administrator's Guide.
3. In Gallery Manager, review the reports and identify the reports that you want tomodify, if necessary. For more information, see “What Is Gallery Manager?” onpage 93.
Modifying the Data Source
Ways to Modify the Data SourceAn information map is the data source for a batch report that is generated from AdapterSetup wizard report jobs. If you modify the information map that serves as the datasource for a batch report, then you might need to modify the other reporting componentsin the batch reporting process to accommodate your change throughout the process.
The following modifications to an information map do not require that you modify theother reporting components in the process:
• Modify an information map filter expression.
• Add or remove a data item or information map that is not used in any other currentlydeployed jobs or SAS Enterprise Guide projects.
The following modifications to an information map require that you also modify thecorresponding SAS Enterprise Guide project, report definitions, and deployed jobs:
• Change the name of an information map or data item that is used in a SAS EnterpriseGuide project that is in use or a report job that is currently deployed.
36 Chapter 4 • About Creating and Modifying Batch Reports
• Add a data item or information map filter that you want to use in a report.
For instructions about how to perform these tasks, see “How to Modify the Data Source”on page 37.
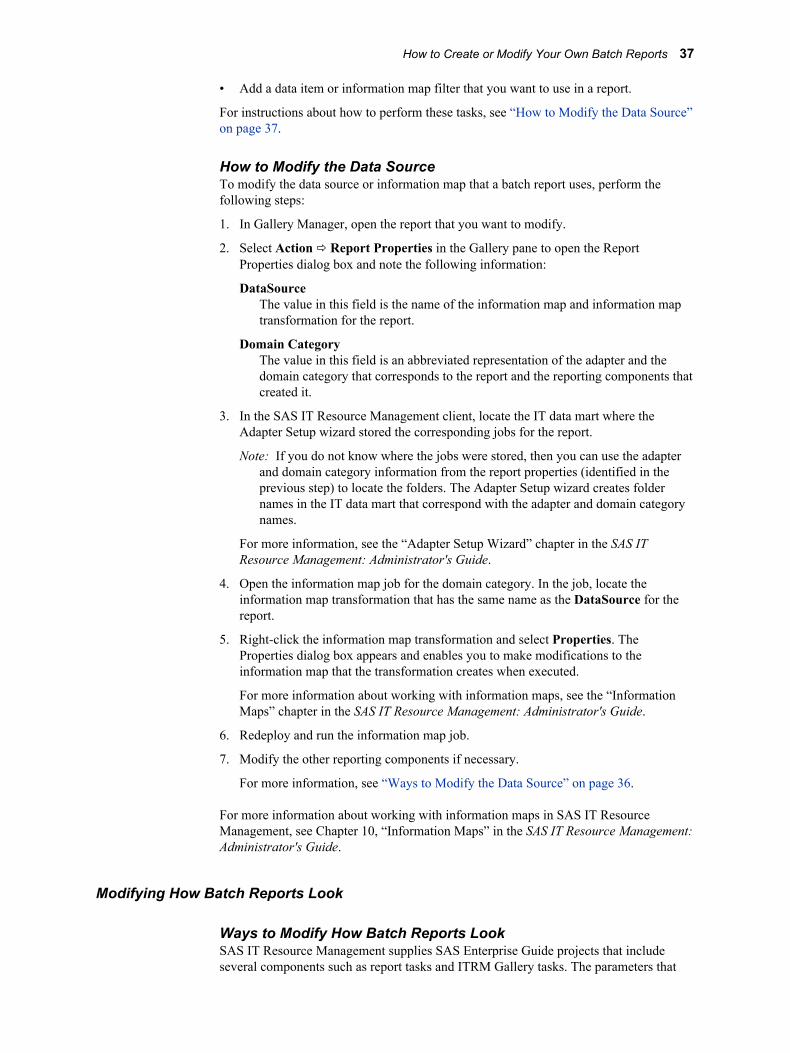
How to Modify the Data SourceTo modify the data source or information map that a batch report uses, perform thefollowing steps:
1. In Gallery Manager, open the report that you want to modify.
2. Select Action ð Report Properties in the Gallery pane to open the ReportProperties dialog box and note the following information:
DataSourceThe value in this field is the name of the information map and information maptransformation for the report.
Domain CategoryThe value in this field is an abbreviated representation of the adapter and thedomain category that corresponds to the report and the reporting components thatcreated it.
3. In the SAS IT Resource Management client, locate the IT data mart where theAdapter Setup wizard stored the corresponding jobs for the report.
Note: If you do not know where the jobs were stored, then you can use the adapterand domain category information from the report properties (identified in theprevious step) to locate the folders. The Adapter Setup wizard creates foldernames in the IT data mart that correspond with the adapter and domain categorynames.
For more information, see the “Adapter Setup Wizard” chapter in the SAS ITResource Management: Administrator's Guide.
4. Open the information map job for the domain category. In the job, locate theinformation map transformation that has the same name as the DataSource for thereport.
5. Right-click the information map transformation and select Properties. TheProperties dialog box appears and enables you to make modifications to theinformation map that the transformation creates when executed.
For more information about working with information maps, see the “InformationMaps” chapter in the SAS IT Resource Management: Administrator's Guide.
6. Redeploy and run the information map job.
7. Modify the other reporting components if necessary.
For more information, see “Ways to Modify the Data Source” on page 36.
For more information about working with information maps in SAS IT ResourceManagement, see Chapter 10, “Information Maps” in the SAS IT Resource Management:Administrator's Guide.
Modifying How Batch Reports Look
Ways to Modify How Batch Reports LookSAS IT Resource Management supplies SAS Enterprise Guide projects that includeseveral components such as report tasks and ITRM Gallery tasks. The parameters that
How to Create or Modify Your Own Batch Reports 37

are specified in these components affect how batch reports look. These parameterspecifications are included in the report definition that the Gallery transformationidentifies in the corresponding report job.
The following modifications require that you modify components in the SAS EnterpriseGuide project, run the ITRM Gallery task to create a new report definition, and thenredeploy the report job:
• Change the title or footnote of a report.
• Change or add a data item in a report such as an analysis variable or a BY variable.
• Change the report style for one report.
• Change the graph format, style sheet, or colors for one report.
If you want to change the style sheet, the graph format, or the colors for all reports in thereport job, then you can modify the Gallery transformation only and then redeploy thereport job.
For instructions about how to perform these tasks, see “How to Modify the Way aSpecific Batch Report Looks”.
How to Modify the Way a Specific Batch Report LooksTo modify how a specific batch report looks, perform the following steps:
1. In Gallery Manager, locate and open the report that you want to modify. For moreinformation, see “What Is Gallery Manager?” on page 93.
2. Select Action ð Report Properties in the Gallery pane to open the ReportProperties dialog box and note the following information:
ProjectThe value in this field is the name of the supplied SAS Enterprise Guide projectthat is associated with the report.
ProcessFlowThe value in this field is the page of the SAS Enterprise Guide project that isassociated with the report. This page includes the ITRM Gallery task that createsthe report definition for the report.
GalleryTaskThe value in this field is the name of the report definition and the ITRM Gallerytask that creates the report definition for the report.
3. From the client workstation where SAS IT Resource Management and SASEnterprise Guide is installed, navigate to <SAS install location>\SAS\ITRMEG\3.2 (such as c:\Program Files\SAS\ITRMEG\3.2 for Windows)where the supplied SAS Enterprise Guide projects are stored.
4. Copy the supplied SAS Enterprise Guide project that you want to modify.
CAUTION:Modify a copy of a supplied SAS Enterprise Guide project only. Do notmodify a supplied SAS Enterprise Guide project directly. The supplied SASEnterprise Guide projects include specifications and IT domain intelligence thatSAS IT Resource Management provides for reporting. If you modify suppliedprojects directly, then you will lose the specifications and benefits that theseprojects provide for future reference. Also, when SAS IT Resource Managementprovides project updates, your modifications will be overwritten. For moreinformation, see “Managing SAS Enterprise Guide Projects for SAS IT ResourceManagement” on page 162.
38 Chapter 4 • About Creating and Modifying Batch Reports

5. Verify that you have set up SAS Enterprise Guide and migrated your projects so thatthey can work with the SAS IT Resource Management 3.2 IT data marts. For moreinformation about how to perform these tasks, see “About Preparing to Work withSAS Enterprise Guide” on page 49.
6. Review the Project Notes and Process Flow Notes for the project if they areavailable. You can use the information in these notes files to determine the types ofreports that the project creates and understand the general conventions that are usedto specify the reports.
7. Modify the reports in the copy of the supplied project. You can use the ProcessFlowand GalleryTask properties that you identified previously to locate the specificbranch of components in the project that affect the report.
For more information, see “Working with Supplied SAS Enterprise Guide Projects”on page 45.
8. Open the ITRM Gallery task and click Finish to run it and create an updated reportdefinition.
Note: Report definitions that you create are stored in a User Defined folder.Report definitions that you create do not and should not overwrite the suppliedreport definitions that are in a Supplied folder.
For more information, see “Working with the ITRM Gallery Task” on page 60.
9. If your modifications included adding a new report definition or changing the nameof an existing report definition, then you must also update the Gallery transformationin the corresponding report job to add the new report definition or specify theupdated report definition with the new name.
For more information, see “Working with Gallery Transformations” on page 76.
10. Redeploy and run the corresponding report job.
For more information, see “Deploying and Running Report Jobs” on page 73.
How to Modify the Look of All Batch Reports That a Report JobCreatesIf you want to change only the style sheet, the graph format, or the colors for all reportsthat a report job creates, then you can modify the Gallery transformation of the reportjob and redeploy the job. To do so, perform the following tasks:
1. In SAS IT Resource Management, locate the IT data mart where the Adapter Setupwizard stored the report job that you want to modify.
Note: If you do not know where the report job is stored, then you can use theGallery Manager to view the properties for one of the reports that the report jobcreates. Use the DomainCategory and GalleryTask properties to deduce the ITdata mart folder where the job is stored and the report definition that the reportjob uses to create the report. For more information, see “What Is GalleryManager?” on page 93.
For more information, see the “What Does the Adapter Setup Wizard Create” topicin the SAS IT Resource Management: Administrator's Guide.
2. Double click the report job to open it in the process flow window.
3. Right-click the Gallery transformation in the process flow window and selectProperties. The Properties dialog box appears.
4. Click the Report Parameters tab. The parameters on this tab enable you to specifythe style sheet and graph format that affect the look for all of the reports that the
How to Create or Modify Your Own Batch Reports 39

corresponding Gallery transformation and report job create. You can create your ownstyle sheet and design template to change the look of the report output.
For more information about designating the style sheet that a report uses, see“Working with Gallery Transformations” on page 76.
5. Redeploy and run the report job.
For more information, see “Deploying and Running Report Jobs” on page 73.
Modifying the Metadata for the Reports Generated by a ReportDefinition
About Modifying Report Definitions for Batch ReportsYou might choose to create or modify report definitions for your batch reports if youwant to perform the following tasks:
• Change the report content by adding or removing reports from the list of reports inthe report definition.
• Change a setting or property that is used in a filter.
• Modify how a report graph looks (graph type) or how many instances of a report arekept (aging).
For more information, see “How to Modify a Report Definition for Batch Reports” onpage 40.
How to Modify a Report Definition for Batch ReportsTo modify the report definition for batch reports, perform the following steps:
1. In Gallery Manager, locate and open one of the batch reports that you want tomodify. For more information, see “What Is Gallery Manager?” on page 93.
2. Select Action ð Report Properties in the Gallery pane to open the ReportProperties dialog box and note the following information:
ProjectThe value in this field is the name of the supplied SAS Enterprise Guide projectthat is associated with the report.
ProcessFlowThe value in this field is the page of the SAS Enterprise Guide project that isassociated with the report. This page includes the ITRM Gallery task that createsthe report definition for the report.
GalleryTaskThe value in this field is the name of the report definition and the ITRM Gallerytask that creates the report definition for the report.
3. From the client workstation where SAS IT Resource Management is installed,navigate to <SAS install location>\SAS\ITRMEG\3.2 (such as c:\Program Files\SAS\ITRMEG\3.2 for Windows) where the supplied SASEnterprise Guide projects are stored.
4. Copy the supplied SAS Enterprise Guide project that you want to modify.
CAUTION:Modify a copy of a supplied SAS Enterprise Guide project only. Do notmodify a supplied SAS Enterprise Guide project directly. The supplied SAS
40 Chapter 4 • About Creating and Modifying Batch Reports

Enterprise Guide projects include specifications and IT domain intelligence thatSAS IT Resource Management provides for reporting. If you modify suppliedprojects and do not maintain a copy of the original supplied projects, then youwill lose the specifications and benefits that these projects provide for futurereference. For more information, see “Managing SAS Enterprise Guide Projectsfor SAS IT Resource Management” on page 162.
5. Verify that you have set up SAS Enterprise Guide and migrated your projects so thatthey can work with the SAS IT Resource Management 3.2 IT data marts. For moreinformation about how to perform these tasks, see “About Preparing to Work withSAS Enterprise Guide” on page 49.
6. Review the Project Notes and Process Flow Notes for the project if they areavailable. You can use the information in these notes files to determine the types ofreports that the project creates and understand the general conventions that are usedto specify the reports.
7. In the copy of the supplied project, modify the ITRM Gallery task that correspondswith the report.
For more information, see “Working with the ITRM Gallery Task” on page 60.
8. Select Finish in the ITRM Gallery task to create an updated report definition.
Note: Report definitions that you create should be stored in a User Definedfolder. Report definitions that you create do not and should not overwrite thesupplied report definitions that are in a Supplied folder.
9. If your modifications included adding a new report definition or changing the nameof an existing report definition, then you must also update the Gallery transformationin the corresponding report job to add the new report definition or specify theupdated report definition with the new name.
For more information, see “Working with Gallery Transformations” on page 76.
10. Redeploy and run the corresponding report job.
For more information, see “Deploying and Running Report Jobs” on page 73.
Creating New Reports Using a Supplied Project as a Template
Why Use a Supplied Project as a Template When Creating NewReports?The batch reports that the Adapter Setup wizard jobs create include supplied reportdefinitions that are based on IT domain intelligence. These reports also include standardand consistent styles, colors, and filters that are proven to improve legibility and reportcategorization in the Gallery Manager. All of these report definitions are specified in thesupplied SAS Enterprise Guide projects that are used to create them for the batchreports. These SAS Enterprise Guide projects are supplied by SAS IT ResourceManagement and stored on the client workstation during installation.
If you want to create a new batch report that the Adapter Setup wizard jobs do notcreate, then you can use a supplied SAS Enterprise Guide project as a template to buildthe report definition for your new report. You can make a copy of the supplied projectthat is most closely associated with the type of report that you want to create and thenmodify only the parameters that are necessary.
T I P The supplied SAS Enterprise Guide projects include standard titles, footnotes, axisstatements, names, labels, styles, colors, and filters that SAS IT Resource
How to Create or Modify Your Own Batch Reports 41

Managements supports and recommends for a given adapter and domain category. Ifyou use these supplied projects as templates for the new reports that you create, thenyou can maintain consistency among the reports that you create and those that SASIT Resource Management provides.
For example, you might choose to create a new report using a supplied SAS EnterpriseGuide project as a template if you want to perform the following tasks:
• Replicate reports for a domain category for which the Adapter Setup wizard does notalready provide reports.
• Create reports for a user-written adapter.
For more information, see “How to Create New Reports Using a Supplied Project as aTemplate” on page 42.
How to Create New Reports Using a Supplied Project as a TemplateTo create a new report by using a supplied SAS Enterprise Guide project as a template,perform the following steps:
1. From the client workstation where SAS IT Resource Management is installed,navigate to <SAS install location>\SAS\ITRMEG\3.2 (such as c:\Program Files\SAS\ITRMEG\3.2 for Windows) where the supplied SASEnterprise Guide projects are stored.
2. Identify the supplied SAS Enterprise Guide project that most closely resembles thetype of adapter and domain category that you want to work with. You can use one ofthe following two methods to determine the supplied project that is most appropriatefor your new reports:
• Use the supplied project that corresponds to the adapter and domain category foryour new report. The name of each supplied project begins with the adapter namefollowed by the domain category. For example, if you are creating a report forthe DT Perf Sentry adapter and the Server Disk domain category, then you mightchoose the DTPerfSentryServerDisk.egp supplied project.
• Use a supplied project that creates reports that are similar to the report that youwant to create. SAS IT Resource Management does not supply a SAS EnterpriseGuide project for every domain category. If a project for your domain categorydoes not already exist, then you can use a project for the same adapter. You canalso review the reports that SAS IT Resource Management does provide andidentify the supplied project for a report that you want to imitate.
3. Copy the supplied SAS Enterprise Guide project that you want to use as a template.
CAUTION:Modify a copy of a supplied SAS Enterprise Guide project only. Do notmodify a supplied SAS Enterprise Guide project directly. The supplied SASEnterprise Guide projects include specifications and IT domain intelligence thatSAS IT Resource Management provides for reporting. If you modify suppliedprojects and do not maintain a copy of the original supplied projects, then youwill lose the specifications and benefits that these projects provide for futurereference. For more information, see “Managing SAS Enterprise Guide Projectsfor SAS IT Resource Management” on page 162.
4. Verify that you have set up SAS Enterprise Guide and migrated your projects so thatthey can work with the SAS IT Resource Management 3.2 IT data marts. For moreinformation about how to perform these tasks, see “About Preparing to Work withSAS Enterprise Guide” on page 49.
42 Chapter 4 • About Creating and Modifying Batch Reports
5. Review the Project Notes and Process Flow Notes for the project if they areavailable. You can use the information in these notes files to determine the types ofreports that the project creates and understand the general conventions that are usedto specify the reports.
6. In the copy of the supplied project, modify the components as needed to specify thereport configurations for the new report.
For more information, see “Working with Supplied SAS Enterprise Guide Projects”on page 45 and “Working with the ITRM Gallery Task” on page 60.
7. Run the SAS Enterprise Guide project and then run the ITRM Gallery task separatelyto create a new report definition.
8. Create a new report job or modify the Gallery transformation in an existing reportjob. The Gallery transformation in the report job must specify the name and locationof the report definition that the modified SAS Enterprise Guide project creates.
For more information, see “Working with Gallery Transformations” on page 76.
9. Deploy and run the report job.
For more information, see “Deploying and Running Report Jobs” on page 73.
Creating New Reports from Scratch
Why Create a New Report from Scratch?SAS IT Resource Management and SAS Enterprise Guide enable you to create batchreports from scratch, without using supplied SAS Enterprise Guide projects or reportingcomponents as templates or models. You might choose to create your own reports fromscratch if they are so unique that they do not have a similar counterpart provided by SASIT Resource Management.
To create new reports from scratch, you must identify or create all of the reportingcomponents that are required to generate reports. For more information, see “How toCreate a New Report from Scratch”.
How to Create a New Report from ScratchT I P SAS IT Resource Management uses specific naming conventions and locations
when naming and saving reporting objects such as tables, information maps,information map filters, data items, report titles, report footnotes, and reportdefinitions. These conventions simplify the management and maintenance of thevarious objects that are interrelated. For best results, if you choose to create or editreporting objects, then use the same naming and storage conventions that SAS ITResource Management uses for consistency and efficiency. For more information,see “About Naming Standards for SAS IT Resource Management ReportingObjects” on page 139 and “About Reporting Standards for SAS IT ResourceManagement Reports” on page 145.
To create a new report from scratch, perform the following steps:
1. Identify a data source for the report. The Adapter Setup wizard reports useinformation maps as data sources. However, SAS IT Resource Management supportsother SAS data sets as sources such as aggregation tables.
For more information, see the ”Aggregating Your Data” or “Information Maps”chapters in the SAS IT Resource Management: Administrator's Guide.
How to Create or Modify Your Own Batch Reports 43

2. Create a SAS Enterprise Guide project that includes at least the followingcomponents:
• the input data source
• one or more report tasks to specify the report parameters
• one or more ITRM Gallery tasks to specify the report definitions
For more information, see “Working with Supplied SAS Enterprise Guide Projects”on page 45 and “Working with the ITRM Gallery Task” on page 60.
3. Run the SAS Enterprise Guide project interactively to verify that the report outputmeets your needs.
4. Then run the ITRM Gallery task manually to create a new report definition.
5. Create a new report job that includes a Gallery transformation. The Gallerytransformation must specify the name and location of the report definition that theSAS Enterprise Guide project created.
For more information, see “Working with Gallery Transformations” on page 76.
6. Deploy and run the report job.
For more information, see “Deploying and Running Report Jobs” on page 73.
44 Chapter 4 • About Creating and Modifying Batch Reports

Chapter 5
Working with Supplied SASEnterprise Guide Projects
About SAS Enterprise Guide Projects . . . . . . . . . . . . . . . . . . . . . . . . . . . . . . . . . . . . 45What Are SAS Enterprise Guide Projects? . . . . . . . . . . . . . . . . . . . . . . . . . . . . . . . 45SAS Enterprise Guide Projects Supplied by SAS IT Resource Management . . . . . 46Properties of Supplied SAS Enterprise Guide Reports . . . . . . . . . . . . . . . . . . . . . . . 48
Preparing to Work with SAS Enterprise Guide . . . . . . . . . . . . . . . . . . . . . . . . . . . . 49About Preparing to Work with SAS Enterprise Guide . . . . . . . . . . . . . . . . . . . . . . . 49Setting Up SAS Enterprise Guide for SAS IT Resource Management Data . . . . . . 49Migrating SAS Enterprise Guide Projects to Work with SAS
IT Resource Management 3.2 . . . . . . . . . . . . . . . . . . . . . . . . . . . . . . . . . . . . . . . . 51
How to Modify a Report in a Supplied SAS Enterprise Guide Project . . . . . . . . . . 56
About SAS Enterprise Guide Projects
What Are SAS Enterprise Guide Projects?In SAS Enterprise Guide, you can work with projects, process flows, branches, and tasksin order to manage the reporting process.
Here are some of the SAS Enterprise Guide components that are used in SAS ITResource Management reporting:
• Projects
Projects are used by SAS Enterprise Guide to manage each collection of relatedtasks, code, references to data, and results.
• Process Flows
A process flow is a view within a project that shows a set of related data sets, tasks,and results that are linked and can be executed in a single stream. You can run aportion of the process flow or the entire process flow. A project can have multipleprocess flows that can be selected from the Project Tree.
• Branches
A branch is a set of related tasks that are linked and can be executed in a singlestream. Branches can be accessed from a process flow window in SAS EnterpriseGuide.
• Tasks
45
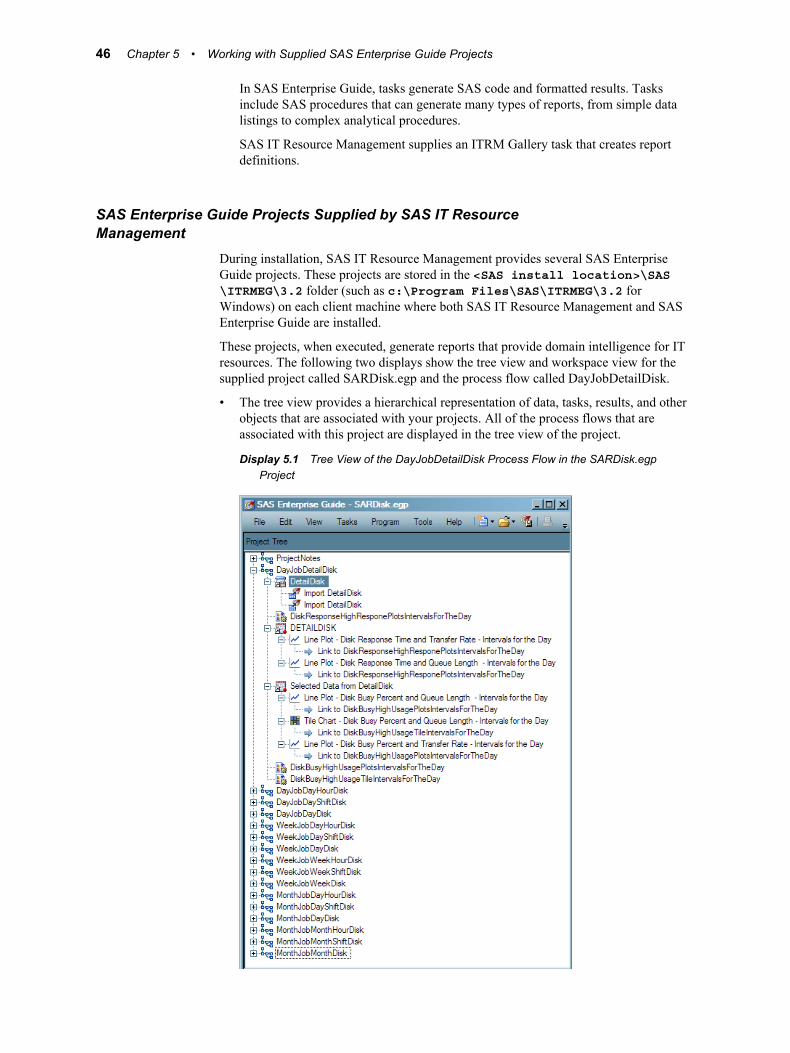
In SAS Enterprise Guide, tasks generate SAS code and formatted results. Tasksinclude SAS procedures that can generate many types of reports, from simple datalistings to complex analytical procedures.
SAS IT Resource Management supplies an ITRM Gallery task that creates reportdefinitions.
SAS Enterprise Guide Projects Supplied by SAS IT ResourceManagement
During installation, SAS IT Resource Management provides several SAS EnterpriseGuide projects. These projects are stored in the <SAS install location>\SAS\ITRMEG\3.2 folder (such as c:\Program Files\SAS\ITRMEG\3.2 forWindows) on each client machine where both SAS IT Resource Management and SASEnterprise Guide are installed.
These projects, when executed, generate reports that provide domain intelligence for ITresources. The following two displays show the tree view and workspace view for thesupplied project called SARDisk.egp and the process flow called DayJobDetailDisk.
• The tree view provides a hierarchical representation of data, tasks, results, and otherobjects that are associated with your projects. All of the process flows that areassociated with this project are displayed in the tree view of the project.
Display 5.1 Tree View of the DayJobDetailDisk Process Flow in the SARDisk.egpProject
46 Chapter 5 • Working with Supplied SAS Enterprise Guide Projects

• The workspace view shows the process flow diagram of the objects in one processflow of your project.
Display 5.2 Workspace View of the DayJobDetailDisk Process Flow in the SARDisk.egpProject
About SAS Enterprise Guide Projects 47

The tree and workspace views of the SARDisk.egp project provide examples of theseterms:
• The project name is SARDisk.egp.
• The process flow name is DayJobDetailDisk.
• The first task in the process flow is the information map called DetailDisk.
• The process flow contains two branches that each start with a Map Import task calledImportDetailDisk.
• The import task in the first branch creates a table that provides the source data forthe three report tasks that generate line plots and a tile chart .
• The import task in the second branch creates a table that provides the source datafor two report tasks that generate two lines plots.
Note: After the SAS Enterprise Guide project is run, the resulting reports arerendered in HTML.
• An ITRM Gallery task is appended to each branch. This task creates the generatedcode of the branch as a report definition. When the report definition is run in a reportjob, it creates output on the SAS Content Server.
T I P Many supplied SAS Enterprise Guide projects include Project Notes and ProcessFlow Notes. The Project Notes file provides useful information about the reports thatthe project creates for the adapter and domain category. The Process Flow Notes fileprovides specific information about the columns and filters that are used in thevarious process flows of the project. You can use the information in these notes filesto determine the types of reports that the project creates and understand the generalconventions that are used to specify the reports.
Properties of Supplied SAS Enterprise Guide ReportsSAS Enterprise Guide reports that are supplied by SAS IT Resource Managementconform to a set of reporting standards. These conventions, based on IT intelligence andbest practices, designate standard specifications for report footnotes, titles, fonts, colors,filters, and so on.
Supplied projects use process flow names that typically suggest which job the reportsshould run in (for example, the daily job , the weekly job , or the monthly job). Theprocess flow name also indicates the name of the information map that is used. Thesupplied SAS Enterprise Guide project called SARDisk.egp includes a process flownamed DayJobDetailDisk. The name of this process flow suggests that it contains reportsthat should run in a daily job and that use the DetailDisk information map. This namingconvention enables you to associate reports with their report jobs and identify theinformation maps and SAS tables on which the reports are based.
If you choose to create or edit IT reports, then it is recommended that you follow thesereporting standards so that the reports that you create have the same look as those thatSAS IT Resource Management supplies.
For more information, see “Naming Standards for Reporting Objects” on page 139 and “About Reporting Standards for SAS IT Resource Management Reports” on page 145.
48 Chapter 5 • Working with Supplied SAS Enterprise Guide Projects

Preparing to Work with SAS Enterprise Guide
About Preparing to Work with SAS Enterprise GuideBefore you begin working with the supplied SAS Enterprise Guide projects, you mustuse the functions of SAS Enterprise Guide in order to perform the following tasks:
• Set up SAS Enterprise Guide so that it can work with SAS IT Resource Managementdata.
• Migrate SAS Enterprise Guide projects so that they can work with your SAS ITResource Management 3.2 IT data marts, in which you created the report data
Note: Supplied SAS Enterprise Guide projects include pointers to information maps.These information maps are created when you run the corresponding informationmap jobs that the Adapter Setup wizard creates. Before you begin working with asupplied SAS Enterprise Guide project, you should run the Adapter Setup wizard forthe corresponding adapter and domain category. You must then run the jobs,including the information map job, to create the information map that the suppliedproject uses.
Setting Up SAS Enterprise Guide for SAS IT Resource ManagementData
In order to work with the data from SAS IT Resource Management, SAS EnterpriseGuide needs to access the SAS Metadata Repository. To access a SAS MetadataRepository for use by SAS Enterprise Guide, perform the following steps:
1. Invoke SAS Enterprise Guide. To do so, from the Start menu, select Programs ðSAS ð Enterprise Guide.
2. From the menu bar, select Tools ð Options. The Options dialog box appears. Fromthe list in the left pane, select Administration.
Preparing to Work with SAS Enterprise Guide 49

Display 5.3 Administration Window of the Options Dialog Box
3. If you want to create a profile or change your profile, click Modify, which opens theConnections window. Select the profile that you want to change and click Modify.
4. The Modify Profile window appears and enables you to create or revise the profile.Enter or revise the following information.
a. The name of the profile is required. The description is optional.
b. Specify whether the machine is remote or local by clicking the appropriatebutton.
c. Enter the machine and port number of the server that you want to connect to.
d. Enter the user ID and password for the person who can access this server.
e. Click Save to save all specified values and close the window, or Cancel todiscard all values and close the window.
5. To connect to the server, select the appropriate profile and click Set active. Theactive server is the source for all resource definitions (such as servers and libraries).
If the Credentials Required dialog box appears, enter your user ID and password andclick OK.
The selected repository is identified by the active repository icon: .
6. Click Close to return to the Administration window.
50 Chapter 5 • Working with Supplied SAS Enterprise Guide Projects

7. Click OK to return to the main SAS Enterprise Guide workspace.
For information, see Administering SAS Enterprise Guide. To locate this documentation,navigate to http://support.sas.com/documentation/onlinedoc/index.html. From the list of products, select the SAS Enterprise Guide.
Migrating SAS Enterprise Guide Projects to Work with SAS ITResource Management 3.2
About the Migration WizardThe Migration Wizard for SAS Enterprise Guide and the SAS Add-in for MicrosoftOffice is a migration utility. It enables you to upgrade two types of reporting projects sothat they work with the latest versions of SAS Enterprise Guide and SAS IT ResourceManagement.
• The migration wizard converts projects that were created with SAS Enterprise Guide4.1 to projects that can work in SAS Enterprise Guide 4.3.
Note: SAS IT Resource Management 3.1.1 information maps and report data wereinput to SAS Enterprise Guide 4.1 report projects. SAS IT ResourceManagement 3.2 information maps and report data are input to SAS EnterpriseGuide 4.3 report projects.
• The migration wizard migrates SAS Enterprise Guide projects that are supplied bySAS IT Resource Management 3.2 so that they can run in a customer's environment.
SAS Enterprise Guide projects that are supplied by SAS IT Resource Management useinformation maps to access the data in your IT data marts. SAS Enterprise Guide storesthe path of the information maps in the report projects. Therefore, you must change themap paths of the supplied information maps to point to the information maps that youcreated with the Adapter Setup wizard. The easiest way to change the map paths is to usethe Migration Wizard for SAS Enterprise Guide and the SAS Add-in for MicrosoftOffice.
Prerequisites to Running the Migration WizardBefore you run the migration wizard, you must run the staging, aggregation, andinformation map jobs that create the information maps for the adapter and domaincategory that you want to work with.
You also need to locate the supplied SAS Enterprise Guide projects. When installed,these projects can be found in the <SAS install location>\SAS\ITRMEG\3.2folder (such as c:\Program Files\SAS\ITRMEG\3.2 for Windows). Make surethe projects are not read-only projects. To do this, right-click each project and selectProperties. On the General tab, make sure that the Attributes box is not checked. Thenclick OK.
T I P Make a copy of the SAS Enterprise Guide projects and migrate only the copiedprojects. The original projects should be kept unchanged as a backup.
Running the Migration WizardTo run the migration wizard, navigate to the location where you installed SAS EnterpriseGuide. Then select \4.3\MigrationWizard.exe. Click Enter to invoke themigration wizard. The first page of the migration wizard opens. This page containsinformation about why you should use this wizard and what you should do before yourun the wizard.
Preparing to Work with SAS Enterprise Guide 51

Display 5.4 Page 1 of the SAS Enterprise Guide Migration Wizard
On page 2 of the wizard, verify the connection profile of the application server whereyour information maps are located. You can click Modify to change your connectionprofile.
On page 3 of the wizard, select the files that you want to migrate. To do so, perform thefollowing steps:
1. To facilitate the selection of files, from the drop-down list in the Show field, selectSAS Enterprise Guide Projects (*.egp). This action causes only SASEnterprise Guide projects to be displayed in the Available files column.
2. In the Available files column, navigate to the location of the SAS Enterprise Guideprojects that you want to migrate.
3. Check the boxes next to the projects to be migrated.
4. Click the right arrow to move the projects to the Selected files column.
On page 4 of the wizard, information is displayed that explains the next steps of themigration process. Click Next to run the process that parses the files. The progress of thewizard is displayed as it locates all the references to the projects that you selected.
52 Chapter 5 • Working with Supplied SAS Enterprise Guide Projects

Display 5.5 Parsing Files Information Box
Click Done when the progress indicator shows that this task is complete.
On page 5 of the wizard, you must enter the new mapping information for the selectedprojects. To do so, perform the following steps:
1. Use the Show field to shorten the number of entries on this page. From the drop-down list, select Global references only. (This setting removes theinformation maps from this page, which significantly simplifies the contents of thispage.)
Display 5.6 Selecting Only Global References
Preparing to Work with SAS Enterprise Guide 53

2. Expand the page to the full width of your screen. This action enables you to havespace to see the complete path information for the current and new mappings.
3. If necessary, resize the Current Mapping column width so that you can see thecomplete path. This path is the path that was used in the SAS Enterprise Guideproject when it was last saved. It identifies the adapter and domain category forwhich the project was developed. As shown in the following display, a typical path isquite long (for example, /Shared Data/SAS IT Resource Management/ITData Marts/VMwareForReporting2/VMware vCenter 1/DomainCategories/Guest System/).
Display 5.7 Expanded Current Mapping Column
4. If you want to globally change all references to the server, click the ellipsis button(...) in the New Mapping column. The Change Resource dialog box appears. Use theBrowse button to display the list of servers from which you can select the Servername that you want to use in your paths. If you want to apply this change to all theobject references that contain this value, check the corresponding box.
5. You must enter the mapping information for your new IT data mart in the NewMapping column for each of the project folders that are shown on this page. To doso, perform the following steps:
a. Select the folder and click the ellipsis button (...) in the New Mapping column.The Change Resource dialog box appears.
b. Use the Browse button to display the list of folders to which the projects can bemigrated. Expand the SAS Folders tree until you locate the IT data mart fromwhich you ran the Adapter Setup wizard for these projects.
54 Chapter 5 • Working with Supplied SAS Enterprise Guide Projects

Display 5.8 Locating the IT Data Mart
c. Continue expanding the folders within the IT data mart until you find the locationof the adapter and the domain category that corresponds to the path in theCurrent Mapping field. In the Select a Location dialog box, the Selectedlocation field displays the complete path for the new location.
d. Make sure that the box is checked that specifies to apply this change to all objectreferences that contain this value.
6. When you have entered the new mapping information for all the SAS EnterpriseGuide project folders, click Next.
7. On the Begin the migration process page, you can also enter the path to yourMigration Record File. You can also change the path to the Log File, specifywhether to create automatic backups of the original files, and specify whether toverify the existence of all resources that were changed.
T I P For best results, specify that the original files should be backed upautomatically.
8. Click Finish to perform the migration. The Migrating files window displays theprogress of your migration. When the migration is complete, the status of theprocessing is displayed. If a processing error occurred, you can view the log file.Otherwise, click Done to exit from the migration wizard. The jobs that contain theprojects that were successfully migrated can be opened in the IT data mart and run.
Preparing to Work with SAS Enterprise Guide 55
How to Modify a Report in a Supplied SASEnterprise Guide Project
The supplied SAS Enterprise Guide projects are the source of the reports that theAdapter Setup wizard creates. Each report in a supplied SAS Enterprise Guide projectcorresponds to a report definition that SAS IT Resource Management provides. Afteryou have run the Adapter Setup wizard for a given adapter and run the resulting reportjobs, you can review the reports that these jobs create. You can then determine whetherthe reports that SAS IT Resource Management provides meet the needs of yourorganization.
Note: If your site does not process data from any of the data sources for which SAS ITResource Management provides an adapter, then you can use an alternate data sourceto process a sample set of data to run the Adapter Setup wizard and view the reportsthat it generates. For example, some data sources that are commonly available in ITenterprises are SAR for UNIX systems, SNMP for IP networks, or a trial license ofDemand Technology Performance Sentry for Windows systems.
If you want to modify a supplied report that you view in the Gallery Manager, then youcan use the report properties to identify the supplied project that is associated with it.You can then copy the corresponding SAS Enterprise Guide project and modify thecopied project as needed. To do so, perform the following steps:
1. In Gallery Manager, locate and open the report that you want to modify.
For more information, see “Working with the Gallery Manager” on page 93.
2. Select Action ð Report Properties in the Gallery pane to open the ReportProperties dialog box and note the following information:
ProjectThe value in this field is the name of the supplied SAS Enterprise Guide projectthat is associated with the report.
ProcessFlowThe value in this field is the page of the SAS Enterprise Guide project that isassociated with the report. This page includes the ITRM Gallery task that createsthe report definition for the report.
GalleryTaskThe value in this field is the name of the report definition and the ITRM Gallerytask that creates the report definition for the report.
3. From the client workstation where SAS IT Resource Management is installed,navigate to the <SAS install location>\SAS\ITRMEG\3.2 folder (such asc:\Program Files\SAS\ITRMEG\3.2 for Windows) where the supplied SASEnterprise Guide projects are stored.
4. Copy the supplied SAS Enterprise Guide project that you want to modify.
CAUTION:Modify a copy of a supplied SAS Enterprise Guide project only. Do notmodify a supplied SAS Enterprise Guide project directly. The supplied SASEnterprise Guide projects include specifications and IT domain intelligence thatSAS IT Resource Management provides for reporting. If you modify suppliedprojects and do not maintain a copy of the original supplied projects, then youwill lose the specifications and benefits that these projects provide for future
56 Chapter 5 • Working with Supplied SAS Enterprise Guide Projects

reference. For best results, maintain and save the original copies of all suppliedprojects and report definitions in the Supplied folder and save your modifiedcopies in the User Defined folder. For more information, see “Managing SASEnterprise Guide Projects for SAS IT Resource Management” on page 162.
5. If the project includes notes, then review the Project Notes and Process Flow Notesfiles. You can use the information in these notes files to determine the types ofreports that the project creates and understand the general conventions that are usedto specify the reports.
6. Modify the reports in the copy of the supplied project. You can use the ProcessFlowand GalleryTask properties that you identified previously to locate the specificbranch of components in the project that affect the report.
For more information, see “Working with Supplied SAS Enterprise Guide Projects”on page 45.
7. Run the ITRM Gallery task to create an updated report definition.
For more information, see “Working with the ITRM Gallery Task” on page 60.
8. If your modifications included adding a new report definition or changing the nameof an existing report definition, then you must also update the Gallery transformationin the corresponding report job to add the new report definition or specify theupdated report definition with the new name.
For more information, see “Working with Gallery Transformations” on page 76.
9. Redeploy and run the corresponding report job.
For more information, see “Deploying and Running Report Jobs” on page 73.
How to Modify a Report in a Supplied SAS Enterprise Guide Project 57

58 Chapter 5 • Working with Supplied SAS Enterprise Guide Projects

Chapter 6
Working with the ITRM GalleryTask in SAS Enterprise Guide
About the ITRM Gallery Task . . . . . . . . . . . . . . . . . . . . . . . . . . . . . . . . . . . . . . . . . . 59
Working with the ITRM Gallery Task . . . . . . . . . . . . . . . . . . . . . . . . . . . . . . . . . . . . 60Access and Navigate the ITRM Gallery Task . . . . . . . . . . . . . . . . . . . . . . . . . . . . . 60Create Report Definitions Using the ITRM Gallery Task . . . . . . . . . . . . . . . . . . . . 61Managing User-Defined Settings for Report Filters . . . . . . . . . . . . . . . . . . . . . . . . . 65Modify Report Definitions Using the ITRM Gallery Task . . . . . . . . . . . . . . . . . . . 67
About the ITRM Gallery TaskThe ITRM Gallery task enables you to use SAS Enterprise Guide to specify and createreport definitions. These report definitions include all of the metadata and SAS codefrom a given branch of your SAS Enterprise Guide project. After the ITRM Gallery taskcreates the report definition, you can use the Gallery transformation that is available inthe SAS IT Resource Management client to include the report definition in your reportjobs.
Report definitions provide greater flexibility when executing and specifying your reportjobs and output. For example, report definitions perform the following actions:
• run in a report job that can execute on any SAS application server such as Windows,UNIX variants, and z/OS. This provides the flexibility of using the batch capabilitiesof enterprise class systems instead of a Windows client when running the largenumber of reports that are necessary for IT performance management and capacityplanning activities.
• attach metadata to each report so that the Gallery Manager can locate, subset, andfilter all of the reports individually. This metadata includes values that you specify asfilters when using the Gallery Manager to view and sort only a portion of theavailable reports.
• create separate pages, metadata, and filters for each report so that every report can beeasily searched within the Gallery Manager.
After you use the ITRM Gallery task to define and create a report definition, the reportdefinition is stored on the SAS Metadata Server. You can use the SAS IT ResourceManagement client to access the report definition later and include it in a Gallerytransformation that is part of a report job. When the report job executes, the reportdefinition generates reports and report metadata that are written to the SAS ContentServer. You can then use the Gallery Manager to view these reports or subsets of thesereports.
59

In addition to enabling you to create your own report definitions, SAS IT ResourceManagement supplies report definitions that were generated from the supplied projectsin SAS Enterprise Guide. The supplied report definitions provide extensive domainintelligence about IT resources for the supported adapters. The Adapter Setup wizarduses these report definitions in the report jobs that it creates. You can use these suppliedreport definitions instead of or in addition to the report definitions that you create withthe ITRM Gallery task. The supplied report definitions are loaded into a predefinedfolder for supplied report definitions on the SAS Metadata Server after SAS IT ResourceManagement is installed. For more information about supplied projects in SASEnterprise Guide, see “SAS Enterprise Guide Projects Supplied by SAS IT ResourceManagement” on page 46.
Working with the ITRM Gallery Task
Access and Navigate the ITRM Gallery TaskTo access the ITRM Gallery task, perform the following steps:
1. Open or create a SAS Enterprise Guide project that includes one or more reporttasks, custom tasks, or program nodes.
2. Select Tools ð Add-In ð ITRM Gallery.
To navigate through the pages of the ITRM Gallery task, use the following buttons:
Backdisplays the previous window in the ITRM Gallery task.
Nextdisplays the next window in the ITRM Gallery task.
Savesaves the current specifications set in the ITRM Gallery task and creates an ITRMGallery task object in the process flow diagram of the SAS Enterprise Guide project.The save option does not create a report definition. It simply saves the ITRM Gallerytask object that you can use to create a report definition.
CAUTION:When working with SAS Enterprise Guide, you must always save yourprojects frequently to keep updates to the tasks in the project. If you selectSave in the ITRM Gallery task, then the specifications for the ITRM Gallery taskare saved for the current instance of the project. However, if you do not also savethe SAS Enterprise Guide project, then the updates are lost when the project isre-opened.
Finishperforms the same functions as Save and creates a report definition that is stored onthe SAS Metadata Server.
Note: You must click Finish to create a report definition. The save option alonedoes not create a report definition.
Cancelabandons changes that were made since the last save and closes the current page.
60 Chapter 6 • Working with the ITRM Gallery Task in SAS Enterprise Guide

Helpdisplays a Help topic for the current page. For information about each field on theITRM Gallery task pages, see the Help.
Create Report Definitions Using the ITRM Gallery TaskTo name and define report definitions for a SAS Enterprise Guide project, perform thefollowing steps:
1. Open or create a SAS Enterprise Guide project that includes one or more reporttasks, custom tasks, or program nodes.
2. Select Tools ð Add-In ð ITRM Gallery from the task list in SAS Enterprise Guideto display the Name page of the ITRM Gallery task.
3. In the Name field, enter the name of the ITRM Gallery task. This is the name thatthe ITRM Gallery task assigns to the report definition that it creates. The name mustbe unique for the current metadata path, or the new ITRM Gallery task will overwritethe report definition that has the same name.
Note: SAS IT Resource Management supplies sample projects that name ITRMGallery task objects and report definitions by using descriptive words thatindicate the following: the measures that are reported, the filters that are used,and the time period that is reported. For example,SystemCpuHighUsagePlotIntervalsForTheDay. For best results, usethis naming convention or your own to create consistent names that are easy tounderstand and locate in the SAS Metadata Server.
4. In the Description field, enter a description of the ITRM Gallery task. Entering adescription in this field is optional but recommended.
5. In the Specify path for report definition field, specify a metadata path where youwant to save the report definition. Click Browse to select the folder that you want tocontain the report definition for the reports that are included in the ITRM Gallerytask.
The metadata folder that you select resides in the SAS Metadata Repository and isavailable from the SAS IT Resource Management client. The folder that you select
Working with the ITRM Gallery Task 61

will contain the report definitions for the reports that are included in the ITRMGallery task.
For best results, save your report definitions in /Shared Data/SAS ITResource Management/<SAS IT Resource Management versionnumber> IT Report Definitions/<adapter>/<domain category>/User Defined/<time period>.
CAUTION:Do not save your user-defined report definitions in the folder that is namedSupplied in the preceding path. The Adapter Setup wizard uses the reportdefinitions in the Supplied folder when generating reporting jobs. If you add ormodify report definitions in the Supplied folder, then the associated AdapterSetup wizard jobs might lose the IT intelligence that SAS IT ResourceManagement provides. Your modified report definitions might also beoverwritten when you install any software updates for SAS IT ResourceManagement.
6. Use the Include data path in report definition option to enable or disable thestoring of the current data path in the report definition. The default andrecommended value is No because it provides greater flexibility and portability ofreport definitions. In this case, the data path value in the report definition is leftblank, and the Gallery transformation that uses the report definition will search forthe data within the corresponding folder for the given job.
The Yes value indicates that the report definition explicitly specifies the data path asthe current data path that was used when the report definition was created. SelectYes only if your data path is unique, unchanging, and outside the job folder for thereport definition. The Gallery transformation that uses the report definition will thensearch for the data within the same data path that was used when the report definitionwas created.
For more information, see “Specifying a Data Source Location” on page 85.
7. Click Next to access the Options page.
8. On the Options page, you must select one or more reports from the list of report tasksthat are in the current process flow. All of the reports that you select will use thesame specifications and report filter settings.
62 Chapter 6 • Working with the ITRM Gallery Task in SAS Enterprise Guide
Note: If you want to assign different settings to various reports, you must create aseparate ITRM Gallery task. For example, line plots use the graph format ofActiveX for dynamic features while tile charts are most useful when Java is used.If you have a project that includes both line plots and tile charts, then youperform the following steps:
• Create at least one ITRM Gallery task for the line plots that use ActiveX.
• Create one ITRM Gallery task for the tile charts that use Java.
9. In the Specifications box, specify the following options:
Graph Formatdetermines the type of graph that you want to generate (ActiveX, Java, or PNG)for the report definition. The default value is ActiveX.
Note: List reports that are included in your ITRM Gallery task ignore thisoption.
Expire Reports After N Dayscalculates the expiration date, relative to the system date at the time that thereport is generated. If a report is expired and its report job is run again, theexpired report is deleted and replaced with the new report. If a report is notexpired and its report job is run again, the previous report remains in the systemwith the new report that is generated. You can specify an expiration range from 1to 9999 days. The default value is 1. In this case, reports that are older than oneday are deleted when the report job is run.
Note: This parameter calculates expiration by number of days. When setting theexpiration for reports that are run on a schedule other than daily, account forthe number of days within the time period in which the reports are run. Forexample, the expiration value for a weekly report should be some multiple ofseven because there are seven days in a week.
10. In the Report Filters box, specify the filter values that you want to use whenviewing reports in the Gallery Manager. These values do not appear on the report.However, they do appear as filter options in the Gallery Manager.
The options for each filter type can include supplied values and user-defined values.To create, delete, save, or share user-defined values for the filter types, clickManage User-Defined Settings. For more information about managing user-definedvalues, see “Managing User-Defined Settings for Report Filters” on page 65.
CAUTION:Carefully select the appropriate filters for your reports and ensure that youuse correct spellings for user-defined values. Assigning an incorrect ormisspelled filter to a report does not affect the data or the accuracy of the reportcontent. However, an incorrect filter makes the corresponding report difficult tolocate when filtering subsets of reports in the Gallery Manager.
Domain Categoryspecifies the adapter and domain category that you assign to the reports forfiltering in the Gallery Manager. The options for this field include the values forthe adapters that the Adapter Setup wizard supports as well as any user-definedvalues. The values are sorted alphabetically in this list. For best results, do notleave this field blank.
Domain Subcategoryspecifies the report category, a subset of the domain category that you selected.The options for this field include only the subcategories for the domain categorythat you selected as well as any user-defined values. If the Domain Categoryvalue is blank or if the supplied domain category does not include supplied
Working with the ITRM Gallery Task 63

subcategories, then only the user-defined values for domain subcategory areavailable.
Job Schedule Frequencyindicates when the corresponding reports should be scheduled to run andspecifies the time period that you assign to the reports for filtering in the GalleryManager. The options for this field include daily, weekly, monthly, quarterly,yearly, and any user-defined values.
Note: This value is a report filter in metadata only. It does not schedule reportjobs. You can use this value as an indicator to include this report definition inreport jobs that are scheduled to run on an interval that corresponds with thisvalue. This value is also used as a filter in Gallery Manager.
Keywords Availablelists the keywords that you can assign to reports for filtering in the GalleryManager. This list includes supplied and user-defined keywords. To addkeywords to reports, select one or more keywords from the Keywords Available
list and then click . The keywords are added to the Selected Keywords list.To remove keywords from the Selected Keywords list, select one or more
variables from the Selected Keywords list and click .
11. Click Finish. All values are saved in the ITRM Gallery task object, a reportdefinition is created on the metadata server, and an ITRM Gallery task objectappears in the process flow diagram with a link to all of the selected reports tasksand program nodes. A message box notifies you when the report definition is createdsuccessfully.
CAUTION:Running a SAS Enterprise Guide process flow or project does notautomatically run the ITRM Gallery task and create a report definition. Youmust open the ITRM Gallery task separately and click Finish to create andpublish a report definition.
When a report definition is created successfully, it does not appear as a separateobject in the process flow or in a format that is viewable from SAS Enterprise Guide.SAS Enterprise Guide manages the ITRM Gallery tasks that create report definitionsbut it does not manage the report definitions. You can use SAS IT ResourceManagement and SAS Management Console to view and access the reportdefinitions that the ITRM Gallery tasks create.
The following display shows two ITRM Gallery task objects, boxed in red, in a SASEnterprise Guide process flow.
Display 6.1 ITRM Gallery Task Objects in a Process Flow
64 Chapter 6 • Working with the ITRM Gallery Task in SAS Enterprise Guide

12. Save the SAS Enterprise Guide project.
CAUTION:Do not create multiple ITRM Gallery tasks in a single process flow and then usethe report definitions that they create in multiple report jobs that are run inparallel. Report jobs save reports in root folders of the SAS Content Server that arenamed according to the corresponding project name and process flow name. Ifseparate jobs attempt to update the same root level folders at the same time, then aconflict can occur. For example, do not create daily and weekly report definitions ina single process flow and then create daily and weekly report jobs that run inparallel.
Managing User-Defined Settings for Report Filters
About the Manage User-Defined Settings WindowWhen planning to filter and subset your reports, you might need to create domaincategories and keyword values that are unique to your business. The ITRM Gallery taskenables you to create and manage your own unique filter values that you can assign toreport definitions and use later in the Gallery Manager when viewing and searching forreports. You can also share these user-defined filters with other clients that might wantto filter reports in a similar way.
The Manage User-Defined Settings window of the ITRM Gallery task enables you toshare, add, and delete user-defined values for report filters. The user-defined values thatyou specify on this window are then available from the Gallery Manager and for reportdefinitions that are created with an ITRM Gallery task in SAS Enterprise Guide.
Create User-Defined ValuesTo create user-defined values, perform the following steps:
1. Open an ITRM Gallery task in a SAS Enterprise Guide project.
2. Click Next to navigate to the Options page.
3. Click Manage User-Defined Settings.
Display 6.2 Manage User-Defined Settings Option on the Options Page
The Manage User-Defined Settings window appears.
4. From the list on the left of the pane, select the type of filter (for example, DomainCategory, Domain Subcategory, Job Schedule Frequency, or Keywords) forwhich you want to add a value.
Working with the ITRM Gallery Task 65

5. Enter the new filter value in the field at the top of the window. This field acceptsonly letters, numbers, hyphens, and underscores.
Note: Misspellings, typing errors, and differences in capitalization standards cancreate inconsistencies in this field. An error in the value can make the associatedreports difficult to find when using the Gallery Manager to filter your reports.Inconsistencies can also lead to multiple filter values that mean the same thingbut are listed separately.
6. Click Add to create the filter value.
7. Click Save to add the user-defined value to the list of available filters in the ITRMGallery task. New filter values appear in the Gallery Manager after they are used in areport definition that is part of a run report job.
8. Save the SAS Enterprise Guide project.
Delete User-Defined ValuesWhen you delete a user-defined value, the value is removed from the list of availablefilters in an ITRM Gallery task. If an ITRM Gallery task uses the deleted value, then thesetting is replaced with a blank value the next time you open the ITRM Gallery task.However, the deleted value will still be available for selection in the Gallery Manageruntil all of the reports that include the deleted value are purged from the SAS ContentServer. It will also still be in the metadata of report definitions and report output thatwere generated before the change.
To delete a user-defined value, perform the following steps:
1. From the Manage User-Defined Settings window of the ITRM Gallery task, selectthe type of filter (for example, Domain Category, Domain Subcategory, JobSchedule Frequency, or Keywords) for which you want to delete a value.
2. Select the value that you want to delete.
3. Click Delete.
4. Click Save to delete the user-defined value from the list of available filters in theITRM Gallery task and the Gallery Manager.
66 Chapter 6 • Working with the ITRM Gallery Task in SAS Enterprise Guide
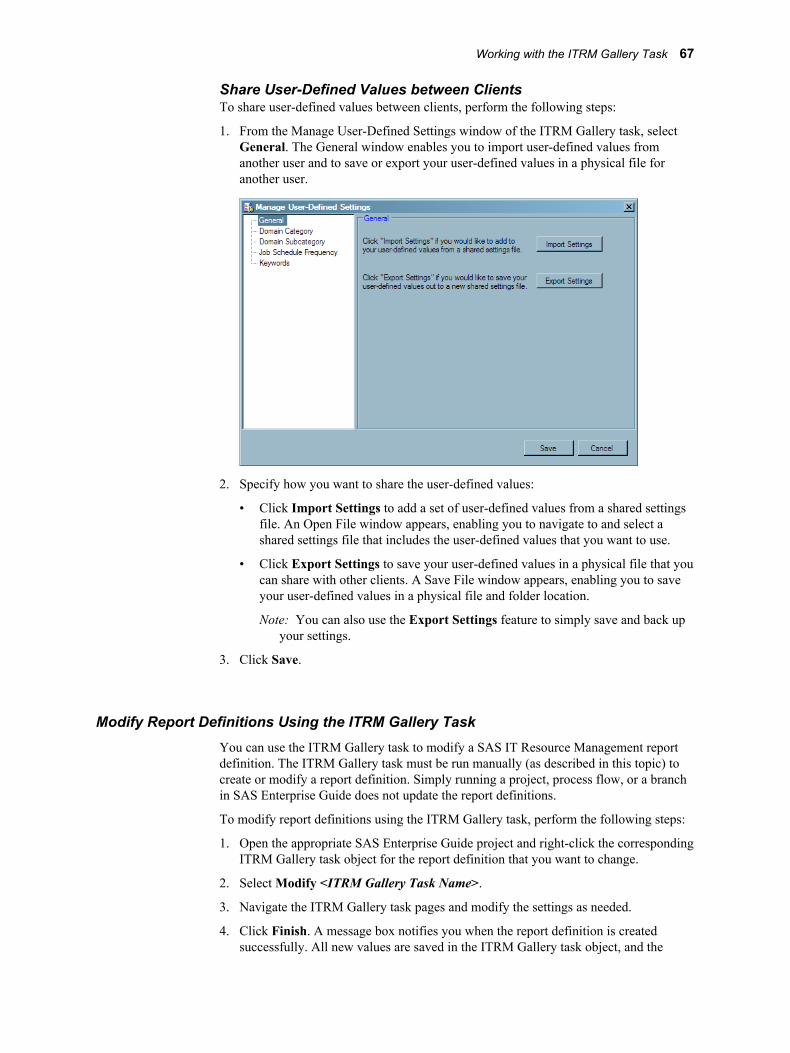
Share User-Defined Values between ClientsTo share user-defined values between clients, perform the following steps:
1. From the Manage User-Defined Settings window of the ITRM Gallery task, selectGeneral. The General window enables you to import user-defined values fromanother user and to save or export your user-defined values in a physical file foranother user.
2. Specify how you want to share the user-defined values:
• Click Import Settings to add a set of user-defined values from a shared settingsfile. An Open File window appears, enabling you to navigate to and select ashared settings file that includes the user-defined values that you want to use.
• Click Export Settings to save your user-defined values in a physical file that youcan share with other clients. A Save File window appears, enabling you to saveyour user-defined values in a physical file and folder location.
Note: You can also use the Export Settings feature to simply save and back upyour settings.
3. Click Save.
Modify Report Definitions Using the ITRM Gallery TaskYou can use the ITRM Gallery task to modify a SAS IT Resource Management reportdefinition. The ITRM Gallery task must be run manually (as described in this topic) tocreate or modify a report definition. Simply running a project, process flow, or a branchin SAS Enterprise Guide does not update the report definitions.
To modify report definitions using the ITRM Gallery task, perform the following steps:
1. Open the appropriate SAS Enterprise Guide project and right-click the correspondingITRM Gallery task object for the report definition that you want to change.
2. Select Modify <ITRM Gallery Task Name>.
3. Navigate the ITRM Gallery task pages and modify the settings as needed.
4. Click Finish. A message box notifies you when the report definition is createdsuccessfully. All new values are saved in the ITRM Gallery task object, and the
Working with the ITRM Gallery Task 67

report definition is updated on the metadata server. You must then run thecorresponding report job to see updates in the report output.
Note: Save does not create a report definition. It simply saves the ITRM Gallerytask object that you can use to create a report definition later.
5. Save the SAS Enterprise Guide project to save the ITRM Gallery task update.
68 Chapter 6 • Working with the ITRM Gallery Task in SAS Enterprise Guide

Chapter 7
Working with GalleryTransformations and Report Jobs
About Report Jobs . . . . . . . . . . . . . . . . . . . . . . . . . . . . . . . . . . . . . . . . . . . . . . . . . . . . 69What is a Report Job? . . . . . . . . . . . . . . . . . . . . . . . . . . . . . . . . . . . . . . . . . . . . . . . . 69Report Jobs Created by the Adapter Setup Wizard . . . . . . . . . . . . . . . . . . . . . . . . . 70
Working with Report Jobs . . . . . . . . . . . . . . . . . . . . . . . . . . . . . . . . . . . . . . . . . . . . . . 71Create a Report Job . . . . . . . . . . . . . . . . . . . . . . . . . . . . . . . . . . . . . . . . . . . . . . . . . . 71Modify a Report Job . . . . . . . . . . . . . . . . . . . . . . . . . . . . . . . . . . . . . . . . . . . . . . . . . 71Copy a Report Job . . . . . . . . . . . . . . . . . . . . . . . . . . . . . . . . . . . . . . . . . . . . . . . . . . 72Delete a Report Job . . . . . . . . . . . . . . . . . . . . . . . . . . . . . . . . . . . . . . . . . . . . . . . . . . 72Deploying and Running Report Jobs . . . . . . . . . . . . . . . . . . . . . . . . . . . . . . . . . . . . 73
About Gallery Transformations . . . . . . . . . . . . . . . . . . . . . . . . . . . . . . . . . . . . . . . . . 74What Is a Gallery Transformation? . . . . . . . . . . . . . . . . . . . . . . . . . . . . . . . . . . . . . 74Properties of Gallery Transformations . . . . . . . . . . . . . . . . . . . . . . . . . . . . . . . . . . . 75Gallery Transformations Created by the Adapter Setup Wizard . . . . . . . . . . . . . . . 76
Working with Gallery Transformations . . . . . . . . . . . . . . . . . . . . . . . . . . . . . . . . . . . 76Add a Gallery Transformation to a Report Job . . . . . . . . . . . . . . . . . . . . . . . . . . . . 76Edit a Gallery Transformation . . . . . . . . . . . . . . . . . . . . . . . . . . . . . . . . . . . . . . . . . 84Delete a Gallery Transformation . . . . . . . . . . . . . . . . . . . . . . . . . . . . . . . . . . . . . . . 85
Specifying a Data Source Location . . . . . . . . . . . . . . . . . . . . . . . . . . . . . . . . . . . . . . . 85
About Templates and Style Sheets . . . . . . . . . . . . . . . . . . . . . . . . . . . . . . . . . . . . . . . 86What Are Templates and Style Sheets . . . . . . . . . . . . . . . . . . . . . . . . . . . . . . . . . . . 86About the Default Template for SAS IT Resource Management Reports . . . . . . . . 86About the Default Style Sheets for SAS IT Resource Management Reports . . . . . . 87
Working with Templates and Style Sheets . . . . . . . . . . . . . . . . . . . . . . . . . . . . . . . . . 87Overview . . . . . . . . . . . . . . . . . . . . . . . . . . . . . . . . . . . . . . . . . . . . . . . . . . . . . . . . . . 87Create or Specify a Different Template for Batch Reports . . . . . . . . . . . . . . . . . . . 88Create or Specify a Different Style Sheet for Batch Reports . . . . . . . . . . . . . . . . . . 88
About Report Jobs
What is a Report Job?Report jobs can be run from the SAS IT Resource Management client or can bedeployed and run in a batch process. When run, these jobs create reports and save themto the SAS Content Server. Each report job includes a Gallery transformation that, whenexecuted, generates SAS code to perform the following tasks:
69

• create reports
• delete and replace associated reports that have expired
• save report output to the SAS Content Server
• update the Gallery Manager cache
For more information, see “About Gallery Transformations” on page 74.
Report jobs can be generated in two ways:
• automatically, by using the Adapter Setup wizard
• manually, by using the Gallery transformation that is in the ITRMTransformations folder of the Transformations tree in SAS IT ResourceManagement
Report Jobs Created by the Adapter Setup WizardThe Adapter Setup wizard creates report jobs that contain Gallery transformations forseveral of the adapters and domain categories that SAS IT Resource Managementsupports. For more information about the specific adapters and domain categories forwhich the Adapter Setup wizard creates reporting jobs, see the “Jobs That the AdapterSetup Wizard Creates for Domain Categories” appendix in the SAS IT ResourceManagement: Administrator's Guide.
For example, the following image shows the report job that the Adapter Setup wizardcreated for the Server Disk domain category of the DT Perf Sentry adapter. The reportjob (Disk Daily Reporting) is located in the Domain Categories subfolder ofthe IT data mart folder. The Gallery transformation (Disk Daily) is available from theprocess flow diagram of the open report job.
Display 7.1 Report Job Created by the Adapter Setup Wizard
Using the Adapter Setup wizard is the most convenient way to create report jobs forselected adapters. When generated by the Adapter Setup wizard, report jobs use Gallerytransformations that reference supplied report definitions. These report definitionsprovide extensive domain intelligence about IT resources for the supported adapters. Formore information, see the “Adapter Setup Wizard” chapter in the SAS IT ResourceManagement: Administrator's Guide.
However, you might choose to create your own report jobs or modify those that theAdapter Setup wizard creates. For more information, see “Working with Report Jobs” onpage 71.
70 Chapter 7 • Working with Gallery Transformations and Report Jobs

Working with Report Jobs
Create a Report JobAlthough the Adapter Setup wizard creates report jobs for several adapters and domaincategories, you might need to create or modify your own report job. For example, youmight want to create batch reports for a domain category for which SAS IT ResourceManagement does not already provide reports.
Creating a report job requires that you first create a job and then add a Gallerytransformations to the job. To do so, perform the following steps:
1. In the SAS IT Resource Management client, open a job. If you want to work with anexisting job, double-click on that job to open it on the Diagram tab of the Job Editorwindow of SAS IT Resource Management.
If you need to create a new job, you can invoke the New Object wizard from the Filemenu of SAS IT Resource Management. For information about how to perform thistask, see the “Create a Job” topic in the SAS IT Resource Management:Administrator's Guide.
The new job opens on the Diagram tab of the Job Editor window.
2. Navigate to the ITRM Transformations folder of the Transformations tree ofSAS IT Resource Management.
3. Drag the Gallery transformation onto the job in the Diagram tab of the Job Editorwindow.
Note: A Gallery transformation does not have an input or output object in theprocess flow diagram of a report job. Thus, a report job can include one Gallerytransformation as the only object in the process flow diagram of the job and stillbe valid.
4. Modify the Gallery transformation parameters as needed to meet the reporting needsof your organization. For more information, see “Add a Gallery Transformation to aReport Job” on page 76. Then save the job.
5. Deploy and run the report job. For more information, see “Deploying and RunningReport Jobs” on page 73.
Note: You can deploy and run report jobs to create reports, remove the reports that areexpired from the SAS Content Server, and load the new reports onto the SASContent Server for the Gallery Manager to access.
Modify a Report JobTo edit an existing report job, perform the following steps:
1. In the IT Data Marts tree of SAS IT Resource Management, double-click the reportjob that you want to edit.
2. Edit the report job.
To Edit the Properties of the Report Job
a. Right-click the report job in the IT Data Marts tree.
Working with Report Jobs 71

b. To rename the report job, select Rename.
c. To view and modify the properties of the report job, select Properties. For moreinformation about the properties for a report job, see the Help for SAS ITResource Management.
d. Click OK. Save the job.
To Edit the Properties of a Gallery Transformation in the Report Job
a. Right-click the Gallery transformation in the process flow diagram and selectProperties. A Properties dialog box displays and enables you to modify thevarious parameters that are specified for the Gallery transformation and the codethat it generates. For more information, see “Edit a Gallery Transformation” onpage 84.
b. Click OK. Save the job.
For more information about the specific parameters that are available forconfiguration in the Gallery transformation, see the detailed steps in “Add a GalleryTransformation to a Report Job” on page 76.
3. Deploy and run the report job. For more information, see “Deploying and RunningReport Jobs” on page 73.
Copy a Report JobTo copy a report job, perform the following steps:
1. Navigate to the location of the job in the IT Data Marts tree.
2. Right-click the job.
3. Select Copy.
4. Right-click the folder where you want the copy of the job to reside.
5. Select Paste. A copy of the report job is saved in the folder and is assigned thedefault name Copy of <original job name>.
6. Double-click the new job to open it in the Diagram tab of the Job Editor.
7. Right-click the Gallery transformation in the process flow and select the Server tab.
8. Specify the name and location of the SAS Content Server for the Gallerytransformation.
9. Click OK. Save the job.
Delete a Report JobTo delete a report job, perform the following steps:
1. Navigate to the location of the job in the IT Data Marts tree.
2. Right-click the job.
3. From the menu that is displayed, select Delete.
4. In the confirmation box, click Yes to delete the job.
If you delete a report job that has already run, then the reports that the job created willremain on the SAS Content Server until you delete them manually. The only way that a
72 Chapter 7 • Working with Gallery Transformations and Report Jobs

report is programmatically deleted from the SAS Content Server is when the report hasexpired and its report job is rerun to remove and replace the report. For moreinformation, see “Working with the SAS Content Server” on page 108.
Note: If you delete a report job in an IT data mart but the report job has already beendeployed, then the deployed job can still be run in batch.
Deploying and Running Report Jobs
About Deploying and Running Report JobsAfter you create or modify a report job, you can deploy and run the job to create reports,delete and replace expired reports, and save reports on the SAS Content Server wherethe Gallery Manager can access them. Report jobs are the last step in the batch reportingprocess flow and thus rely on all of the jobs and components that precede it in the dataextraction, transformation, loading, and reporting process.
Deploying a job enables you to execute the job outside of SAS IT ResourceManagement, such as when scheduling a job to run at a specified time. SAS IT ResourceManagement enables you to deploy as well as run jobs. For more information about howto deploy and run jobs, see the “Jobs” chapter in the SAS IT Resource Management:Administrator's Guide.
Deploy and Run Report Jobs That the Adapter Setup WizardCreatesThe Adapter Setup wizard creates a set of jobs that compartmentalize each step of theextract, transform, load, and reporting process for IT data. These jobs depend on oneanother to process the raw data for reporting. For example, aggregation jobs includeaggregations that rely on the staged tables that are generated when the staging job is run.As a result, each job should be run only after the jobs that it depends on have been run.The following list shows the types of jobs that the Adapter Setup wizard creates and thedependencies of each. Each job type in the list is dependent on the job type that precedesit.
1. staging job
2. aggregation job
3. information map job
4. reporting job
For more information, see “Working with the Adapter Setup Wizard” on page 19.
Deploy and Run Your Own Report JobsYou can create, deploy, and run your own report jobs manually, without using theAdapter Setup wizard. However, like the report jobs that the Adapter Setup wizardcreates, your report jobs must also rely on other processing components that extract,transform, and load your IT data. For consistency and efficiency, use the same namingconventions and job structure that the Adapter Setup wizard uses when you create yourown jobs and components for this process. For information about what the AdapterSetup wizard creates, see the “Adapter Setup Wizard” chapter in the SAS IT ResourceManagement: Administrator's Guide.
After you confirm that all of the extract, transform, and load components for your reportjob are prepared and executed, then you can deploy and run your report job.
Working with Report Jobs 73

About Gallery Transformations
What Is a Gallery Transformation?Gallery transformations are among the final components of the batch reporting process.These transformations are part of report jobs, and they identify one or more of the reportdefinitions that a report job uses to create report output. This process enables you to runreport jobs and their report definitions in batch mode.
Although report definitions provide a majority of the specifications for report output, theGallery transformation enables you to specify (and in some cases, override) a fewadditional parameters for all of the reports that the corresponding report job creates. AGallery transformation enables you to specify the following values for all of the reportsthat the corresponding report job creates:
• SAS Content Server where the corresponding reports will be stored
• style sheet and location
• graph format (overrides the graph format that is specified in the report definition)
• report definitions
• the purging criteria for a report (overrides the expiration date that is specified in thereport definition)
The Gallery transformation compiles the specified values and generates the SASprogram that will be run as scheduled in the report job. In the following example, aGallery transformation named System Monthly is in the System MonthlyReporting job for the DT Perf Sentry adapter and the Server System domain category.
Display 7.2 A Gallery Transformation in a Report Job
For more information, see “About Report Jobs” on page 69.
74 Chapter 7 • Working with Gallery Transformations and Report Jobs

Properties of Gallery TransformationsTo access the Gallery transformation properties, right-click a Gallery transformation in areport job and select Properties. A Properties dialog box appears and enables you toview properties and specifications for the SAS Content Server, report parameters, andreport definitions.
The Properties dialog box contains the following tabs:
• The General tab displays information that identifies the Gallery transformation suchas name and description.
• The Server tab enables you to specify the name and location of the SAS ContentServer for the Gallery transformation and the advanced URL filename parameters.
• The Report Parameters tab enables you to view or modify the parameters thatapply to the reports that the transformation generates.
• The Report Definitions tab enables you to identify the report definitions that youwant to use.
• The Options tab displays information about how to further customize and generatethe code.
• The Code tab enables you to manage the code that is generated by thetransformation.
Note: This tab should not be used to modify the code that is generated by theGallery transformation. Changes that you make can result in code that is errorprone and is out of alignment with the report definition that was created by SASEnterprise Guide.
• The Precode and Postcode tab enables you to specify that user-written code shouldbe inserted at the beginning or end of the current transformation.
• The Notes tab displays any notes or documents that are associated with thetransformation.
• The Extended Attributes tab displays the custom properties that are available forthe transformation.
For more information about the tabs that are available from the Properties dialog box,see the Help for SAS IT Resource Management.
About Gallery Transformations 75

Gallery Transformations Created by the Adapter Setup WizardThe Adapter Setup wizard creates Gallery transformations for several of the adapters anddomain categories that SAS IT Resource Management supports. Gallery transformationsare saved as components of the reporting jobs that are stored in the IT data mart foldersthat the Adapter Setup wizard creates. These Gallery transformations reference suppliedreport definitions that provide extensive domain intelligence about IT resources for thesupported adapters. For more information, see the “Adapter Setup Wizard” chapter inthe SAS IT Resource Management: Administrator's Guide.
Using the Adapter Setup wizard is the most convenient way to create Gallerytransformations and report jobs for selected adapters. However, you might choose tocreate your own Gallery transformations or modify those that the Adapter Setup wizardcreates. For more information, see “Working with Gallery Transformations” on page76.
For more information about the Gallery transformations and report jobs that the AdapterSetup wizard creates, see “Report Jobs Created by the Adapter Setup Wizard” on page70. For more information about the specific adapters and domain categories for whichthe Adapter Setup wizard creates reporting jobs, see the “Jobs That the Adapter SetupWizard Creates for Domain Categories” appendix in the SAS IT Resource Management:Administrator's Guide.
Working with Gallery Transformations
Add a Gallery Transformation to a Report JobThe Adapter Setup wizard creates Gallery transformations and report jobs automaticallyfor a number of supplied adapters and domain categories. However, you might need tocreate your own Gallery transformation and report job. For example, you might want tocreate batch reports for domain categories for which SAS IT Resource Managementdoes not already provide reports.
To create a Gallery transformation and add it to a report job, perform the followingsteps:
1. In SAS IT Resource Management, open the report job that is to contain the newGallery transformation. The job shows on the Diagram tab of the Job Editorwindow.
Note: If you want to add a Gallery transformation to a new job, you must first createthe job. For more information about how to create a job, see the “Create a Job”topic in the SAS IT Resource Management: Administrator's Guide.
2. In the Transformations tree of SAS IT Resource Management, expand the ITRMTransformations folder.
76 Chapter 7 • Working with Gallery Transformations and Report Jobs

Display 7.3 ITRM Transformations Folder
3. Drag and drop the Gallery transformation onto the Job Editor window. The Gallerytransformation appears in the process flow diagram for the job.
Display 7.4 Sample Job with a New Gallery Transformation
4. Right-click the Gallery transformation and select Properties.
5. On the General tab, specify the name and description of the transformation.
Note: SAS IT Resource Management uses the naming convention <domaincategory> <time period> to name Gallery transformations. For example,a Gallery transformation that generates weekly reports for the Server Systemdomain category of DT Perf Sentry is named System Weekly. For best results,use the same naming convention that SAS IT Resource Management uses forconsistency and efficiency.
Working with Gallery Transformations 77
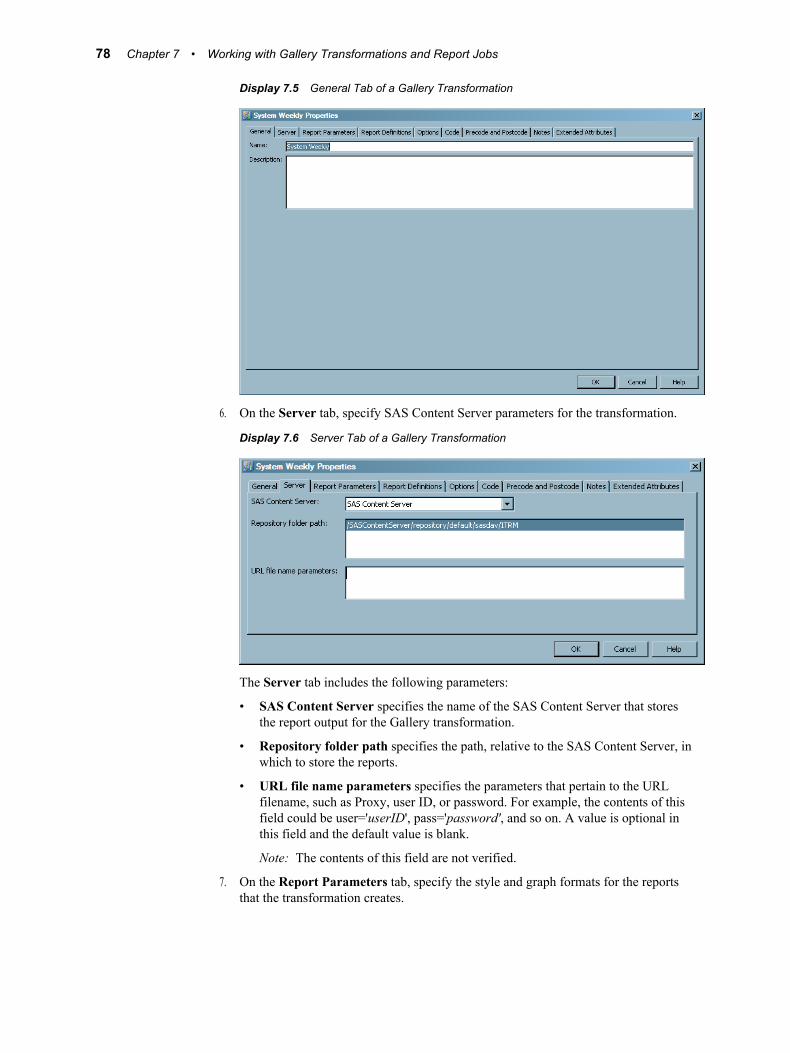
Display 7.5 General Tab of a Gallery Transformation
6. On the Server tab, specify SAS Content Server parameters for the transformation.
Display 7.6 Server Tab of a Gallery Transformation
The Server tab includes the following parameters:
• SAS Content Server specifies the name of the SAS Content Server that storesthe report output for the Gallery transformation.
• Repository folder path specifies the path, relative to the SAS Content Server, inwhich to store the reports.
• URL file name parameters specifies the parameters that pertain to the URLfilename, such as Proxy, user ID, or password. For example, the contents of thisfield could be user='userID', pass='password', and so on. A value is optional inthis field and the default value is blank.
Note: The contents of this field are not verified.
7. On the Report Parameters tab, specify the style and graph formats for the reportsthat the transformation creates.
78 Chapter 7 • Working with Gallery Transformations and Report Jobs

Display 7.7 Report Parameters Tab of a Gallery Transformation
The Report Parameters tab includes the following parameters:
• Style template specifies the name of the style template that is used by all of thereports that the Gallery transformation creates. The style template determinesgraph colors and other attributes inside the graph portion of a report.
You can use the standard style template that SAS IT Resource Managementprovides (named ITRMDefault) or create your own style template that includesyour own custom colors and visual design. For more information, see “AboutTemplates and Style Sheets” on page 86.
• Location for style sheet specifies the cascading style sheet (.css file) that is usedwhen viewing a report. It controls colors and other attributes outside of the graphportion of a report.
Any of the following location types are valid values for this field:
• a full URL to the style sheet folder on a specified server (such as http://<server>:8080/<folder name>/).
• a URL to a style sheet folder on all the clients where the Web browser wasinitiated (such as file://c:/programfiles/<folder name>/).
• a relative URL to the style sheet folder on the middle tier where the graphsare installed (such as /<folder name>/<subfolder name>). Theoption to use only the relative path provides portability of this value. Forexample, if the name or location of the middle tier changes, the location valuedoes not need to change as long as the folder names in the middle tier remainthe same.
The default value (/SASContentServer/repository/default/sasdav/ITRM/styles/ITRMDefault.css) provides a path to the default style sheetfor SAS IT Resource Management reports . You can create a style sheet thatincludes your own custom colors, logos, and visual design. For moreinformation, see “About Templates and Style Sheets” on page 86.
• Graph format override specifies the graph format to use when generating thereports, regardless of the graph format indicated in the corresponding reportdefinition. The available formats are ActiveX, PNG, or JAVA type images. A
Working with Gallery Transformations 79

value is optional in this field, and the default value is blank. When this field isblank, the reports use the graph format that is specified in the report definition.
• Location for graph applet jar files specifies the path to the SAS code that isused only to render reports that are specified as Java reports. A value is optionalin this field, and the default value is /sasweb/graph.
Any of the following location types are valid values for this field:
• a full URL on a specified server.
• a URL to a folder on all the clients where the Web browser was initiated(such as file://c:/programfiles/<folder name>/).
• a relative URL to a folder on the middle tier where the graphs are installed(such as /<folder name>/<subfolder name>). The option to use onlythe relative path provides portability of this value. For example, if the nameor location of the middle tier changes, the location value does not need tochange as long as the folder names in the middle tier remain the same.
Note: If this field is blank, then the Gallery transformation uses the path that isspecified for the –APPLETLOC option in the SAS configuration file.
The Report Parameters tab also enables you to reset the parameter values on thetab to their original default values. To do so, select Reset next to a specific field toreset the value for that parameter to the default value. Or, select Reset to defaults toreinstate the default value for all parameters on the tab.
8. On the Report Definitions tab, you can specify the report definitions and expirationdate criteria for the reports that the transformation creates.
Display 7.8 Report Definitions Tab of a Gallery Transformation
80 Chapter 7 • Working with Gallery Transformations and Report Jobs
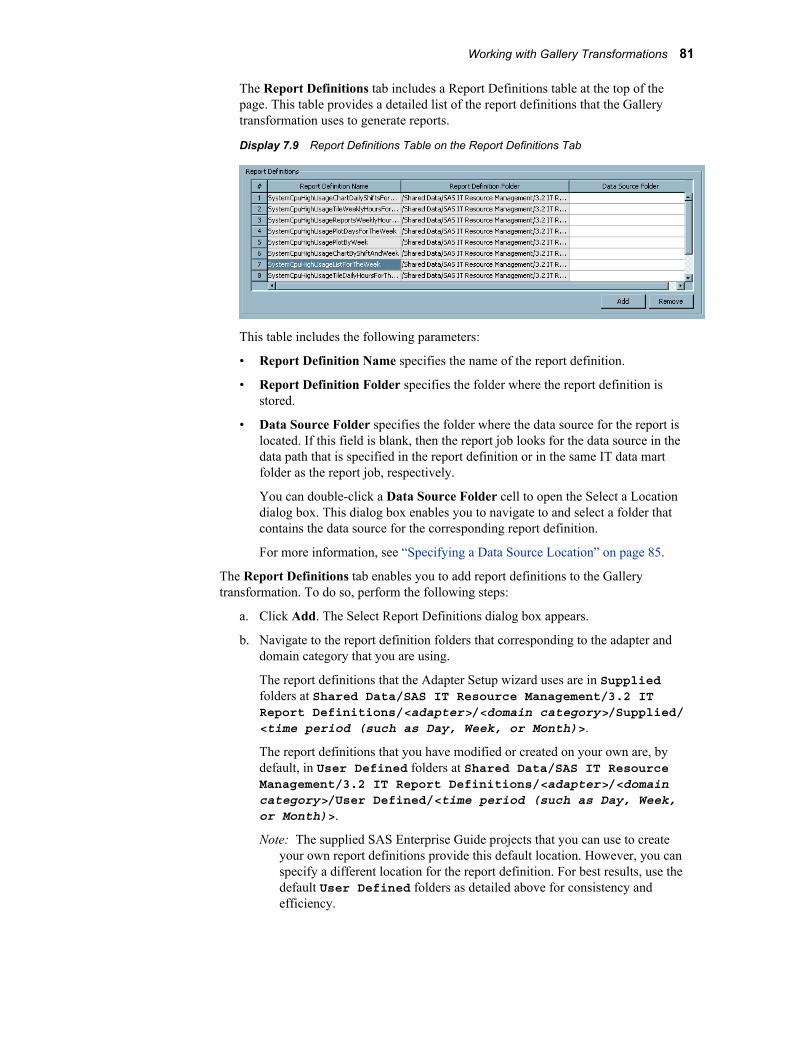
The Report Definitions tab includes a Report Definitions table at the top of thepage. This table provides a detailed list of the report definitions that the Gallerytransformation uses to generate reports.
Display 7.9 Report Definitions Table on the Report Definitions Tab
This table includes the following parameters:
• Report Definition Name specifies the name of the report definition.
• Report Definition Folder specifies the folder where the report definition isstored.
• Data Source Folder specifies the folder where the data source for the report islocated. If this field is blank, then the report job looks for the data source in thedata path that is specified in the report definition or in the same IT data martfolder as the report job, respectively.
You can double-click a Data Source Folder cell to open the Select a Locationdialog box. This dialog box enables you to navigate to and select a folder thatcontains the data source for the corresponding report definition.
For more information, see “Specifying a Data Source Location” on page 85.
The Report Definitions tab enables you to add report definitions to the Gallerytransformation. To do so, perform the following steps:
a. Click Add. The Select Report Definitions dialog box appears.
b. Navigate to the report definition folders that corresponding to the adapter anddomain category that you are using.
The report definitions that the Adapter Setup wizard uses are in Suppliedfolders at Shared Data/SAS IT Resource Management/3.2 ITReport Definitions/<adapter>/<domain category>/Supplied/<time period (such as Day, Week, or Month)>.
The report definitions that you have modified or created on your own are, bydefault, in User Defined folders at Shared Data/SAS IT ResourceManagement/3.2 IT Report Definitions/<adapter>/<domaincategory>/User Defined/<time period (such as Day, Week,or Month)>.
Note: The supplied SAS Enterprise Guide projects that you can use to createyour own report definitions provide this default location. However, you canspecify a different location for the report definition. For best results, use thedefault User Defined folders as detailed above for consistency andefficiency.
Working with Gallery Transformations 81
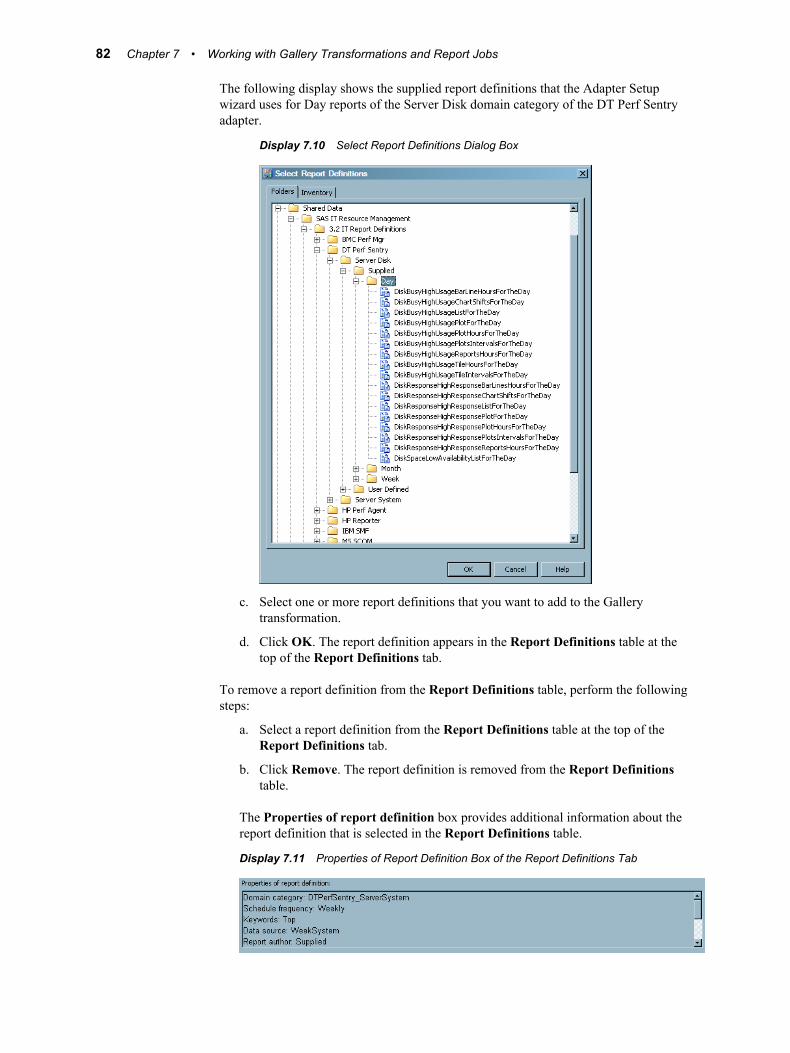
The following display shows the supplied report definitions that the Adapter Setupwizard uses for Day reports of the Server Disk domain category of the DT Perf Sentryadapter.
Display 7.10 Select Report Definitions Dialog Box
c. Select one or more report definitions that you want to add to the Gallerytransformation.
d. Click OK. The report definition appears in the Report Definitions table at thetop of the Report Definitions tab.
To remove a report definition from the Report Definitions table, perform the followingsteps:
a. Select a report definition from the Report Definitions table at the top of theReport Definitions tab.
b. Click Remove. The report definition is removed from the Report Definitionstable.
The Properties of report definition box provides additional information about thereport definition that is selected in the Report Definitions table.
Display 7.11 Properties of Report Definition Box of the Report Definitions Tab
82 Chapter 7 • Working with Gallery Transformations and Report Jobs

T I P Report definition names are unique within a domain category. However, theyare not unique across all domain categories. The only means of distinguishingbetween two report definitions with the same name is by viewing their properties.You can use the information in the Properties of report definitions box toconfirm that you have selected the correct report definition for your report job.
Table 7.1 Properties of Report Definitions on the Report Definitions Tab
Property Notes
Data path (Optional) Specifies the path to the data source.
Data source Specifies the data source such as an information map. Verifythat the data source is in the same folder as the report job. If itis not, verify that the data source is in the data path of thereport definition or in the Data Source Folder of the Gallerytransformation.
Domain category Specifies the adapter and domain category for the reportdefinition. For example, the valueDTPerfSentry_ServerDisk indicates that the reportdefinition corresponds to the Server Disk domain category ofthe DT Perf Sentry adapter. This value is a primary filter thatis specified for the report definition in the ITRM Gallery task.
Verify that the adapter and domain category is correct for theIT data that you are using and the reports that you want tocreate.
Domain subcategory (Optional) Specifies the domain subcategory that correspondsto the domain category for the report definition. This value is aprimary filter that is specified for the report definition in theITRM Gallery task.
Expire after Specifies the number of days that the corresponding reports arestored on the SAS Content Server before they are expired. If areport is expired and its report job is run again, the expiredreport is deleted and replaced with the new report.
Note: The Override Expiration Date options in the Gallerytransformation can override this value.
Gallery task Specifies the name of the ITRM Gallery task that created thereport definition. The ITRM Gallery task and the reportdefinition have the same name.
Keywords Specifies the keywords that the report definition assigns to thereports that it creates. Keywords are primary filters that arespecified for the report definition in the ITRM Gallery task.
Process flow Specifies the name of the process flow that includes the ITRMGallery task that created the report definition.
Project Specifies the name of the SAS Enterprise Guide project thatincludes the ITRM Gallery task that created the reportdefinition.
Working with Gallery Transformations 83

Property Notes
Report author Specifies the user ID of the person who created the reportdefinition. If the value is Supplied, then the reportdefinition was supplied by SAS IT Resource Management andis used by the Adapter Setup wizard.
Schedule frequency Specifies when the corresponding reports for the reportdefinition should be scheduled to run. This value is a primaryfilter that is specified for the report definition in the ITRMGallery task.
Note: This value is a report filter in metadata only. It does notaffect the schedule for the corresponding report job. However,for best results, you should schedule the corresponding reportjob to run according to this filter. For example, if the schedulefrequency is Weekly, then schedule the report job to runweekly.
For more information about the naming standards that SAS IT ResourceManagement uses for reporting components, see “About Naming Standards for SASIT Resource Management Reporting Objects” on page 139.
The Override Expiration Date group box provides the ability to override theexpiration date that is specified in the report definition.
Display 7.12 Override Expiration Date Options on the Report Definitions Tab
The following override options take effect the next time the report job is deployedand run.
• Delete report content based on the expiration date in the report definitioncauses the expiration date that is specified in the report definition to take effect.This option is the default.
• Delete report content that is older than specified days enables you overridethe expiration data that is specified in the report definition and enter the numberof days that must elapse before the reports are deleted.
9. Click OK. The Gallery transformation icon in the process flow diagram of the reportjob appears with a green check to indicate that it is complete and ready for execution.
10. Deploy and run the report job. For more information, see “About Report Jobs” onpage 69.
Edit a Gallery TransformationTo edit an existing Gallery transformation, perform the following steps:
1. In the IT Data Marts tree of SAS IT Resource Management, double-click the job thatcontains the Gallery transformation that you want to edit.
2. Right-click the Gallery transformation in the process flow diagram and selectProperties. A Properties dialog box displays and enables you to modify the various
84 Chapter 7 • Working with Gallery Transformations and Report Jobs
parameters that are specified for the Gallery transformation and the code that itgenerates.
For more information about the specific parameters that are available forconfiguration in the Gallery transformation, see the detailed steps in “Add a GalleryTransformation to a Report Job” on page 76.
3. Click OK to save your changes.
4. Deploy and run the report job. For more information, see “About Report Jobs” onpage 69.
Delete a Gallery TransformationTo delete a Gallery transformation from a job, perform the following steps:
1. In the IT Data Marts tree in SAS IT Resource Management, double-click the job thatcontains the Gallery transformation that you want to delete.
2. Right-click the Gallery transformation in the process flow diagram and select Delete.The Gallery transformation object is deleted from the job.
3. Click OK to save your changes.
4. Deploy and run the report job. For more information, see “About Report Jobs” onpage 69.
Specifying a Data Source LocationSAS IT Resource Management provides flexibility and portability of report jobs, Gallerytransformations, and report definitions by enabling you to specify the location of thesource data for a report in various ways.
Here are the ways that you can specify the data source location and how the report jobuses these paths to find the data source:
• In the Gallery transformation and ITRM Gallery task, do not specify a data path.
If a data source location is not specified within the Gallery transformation or reportdefinition from an ITRM Gallery task, then the report job looks for the data source inthe same IT data mart folder as the report job. This is the default and recommendedscenario.
T I P The Adapter Setup wizard stores data sources (or information maps) in thesame folder as their corresponding report jobs. Thus, a Gallery transformationthat the Adapter Setup wizard creates does not include values in the Data SourceFolder column, and the report definitions that the Adapter Setup wizard uses donot include data path locations. For consistency and portability of your reportingcomponents, save your information maps in the same folder as theircorresponding report jobs and do not specify a data source location in yourGallery transformations or report definitions.
• In a Gallery transformation, specify a data path by using the Data Source Folderfield for a report definition. For more information, see “Add a GalleryTransformation to a Report Job” on page 76.
Specifying a Data Source Location 85

If you enter a data path in this field, then the report job uses this path, regardless ofwhether a data source location is specified in the report definition from the ITRMGallery task. If this field is blank, then the report job checks the corresponding reportdefinition to identify a data source location.
The default value is blank.
• In an ITRM Gallery task, specify a data path by selecting Yes for the option Includedata path in report definition. For more information, see “Create ReportDefinitions Using the ITRM Gallery Task” on page 61.
If you select Yes to include the data path in the report definition, then the path ishard coded with the report definition and the data path appears in the Properties ofreport definition box of the Gallery transformation. The report job uses this path,unless the corresponding Gallery transformation includes a value for the DataSource Folder that overrides the report definition.
By default, the ITRM Gallery task does not specify a data path in the reportdefinition that it creates.
About Templates and Style Sheets
What Are Templates and Style SheetsThe visual appearance of the reports that SAS IT Resource Management creates iscontrolled by the following two style components:
templatedescribes the default visual aspects (colors, fonts, lines, markers, and so on) of thereport graph. The template resides on the server.
style sheetdescribes the default visual aspect of report elements that are outside of the grapharea such as borders, banners, titles, footnotes, and so on. The style sheet is a *.cssfile that resides on the client workstation and on the middle tier.
SAS IT Resource Management provides a default template and style sheet for your ITreports. The Adapter Setup wizard and the supplied SAS Enterprise Guide projects usethe default template and style sheet to specify the visual style of the reports that theycreate.
About the Default Template for SAS IT Resource ManagementReports
SAS IT Resource Management provides a default template file namedtmplitrm.sas7bitm that includes a default template named ITRMDefault. Thisdefault template includes updates to a parent template called styles.analysis that SASprovides. These updates include specifications for graph colors in charts and plots.
During installation, SAS IT Resource Management saves the default template files andtheir source code in folders on the server tier.
Here are the locations of the source code for the templates, based on operating system:
• Windows: <sashome>\SASFoundation\9.2\itrmmvadata\sasmisc
• UNIX: <sashome>/SASFoundation/9.2/misc/itrmmvadata
86 Chapter 7 • Working with Gallery Transformations and Report Jobs

• z/OS: &prefix.ITRM.CPMISC
Here are the locations of the template, based on operating system:
• Windows: <sashome>\SASFoundation\9.2\itrmmvadata\sashelp
• UNIX: <sashome>/SASFoundation/9.2/sashelp
• z/OS: &prefix.nnnn.SASHELP where nnnn is the country encoding. Forexample, if nnnn=ENW0 for English, then the location is&prefix.ENW0.SASHELP.
About the Default Style Sheets for SAS IT Resource ManagementReports
Default style sheets for SAS IT Resource Management reports are namedITRMDefault.css. These style sheets include report specifications that are unique to SASIT Resource Management. For example, the report banners represent SAS IT ResourceManagement and the title fonts as well as border colors complement the visual propertiesthat are specified in the default template for SAS IT Resource Management reports.
SAS IT Resource Management provides two default style sheets. One style sheetspecifies the properties for the reports that the supplied SAS Enterprise Guide projectsgenerate. The other style sheet specifies the properties for batch reports. These two stylesheets include identical specifications except for the report banner.
The default style sheet that is used in the supplied SAS Enterprise Guide projectsincludes a SAS IT Resource Management banner. This enables you to see the bannerwhen you run reports interactively with SAS Enterprise Guide. This default style sheet issaved in the same location as the SAS Enterprise Guide style sheets on the clientworkstation. For example, for a Windows 32-bit system, the location for the style sheetis in the <SAS install location>\SAS\EnterpriseGuide\4.3\Stylesfolder (such as C:\Program Files\SAS\EnterpriseGuide\4.3\Styles forWindows).
The default style sheet that batch reports use is stored on the SAS Content Server, and itdoes not include specifications for a report banner. This enables the batch reports to begenerated without a banner and thus be easier to view in the Gallery Manager. Thisversion of the style sheet is saved in the Web application server directory on the middletier at <Web application root>/SASContentServer/repository/default/sasdav/ITRM/styles/.
For more information about how to include your own corporate logo in a banner on aninteractive style sheet, see the “Editing Styles: Using Background and Banner Images”topic in the SAS Enterprise Guide Help.
Working with Templates and Style Sheets
OverviewYou can use the default templates and style sheets that SAS IT Resource Managementprovides or create your own. For best results, if you choose to create your own templateor style sheet, use the defaults as a parent or model and make only the necessaryadjustments for your custom needs.
Working with Templates and Style Sheets 87

T I P Before you modify a template, style sheet, or any other reporting component thatSAS IT Resource Management provides, make a copy of the supplied component asa backup and modify the copy.
SAS IT Resource Management enables you to identify the templates and style sheets thatyou want to use for reports. However, these components are created and specified withother SAS products. For example, you can use Base SAS to create and specify atemplate by invoking and specifying the TEMPLATE procedure. You can use SASEnterprise Guide to work with style sheets.
As you work with templates and style sheets for your IT reports, refer to thedocumentation in the appropriate SAS product for more information. For moreinformation about how to work with templates, see the documentation for theTEMPLATE procedure in the SAS 9.2 Output Delivery System: User’s Guide athttp:\\support.sas.com. For more information about how to work with stylesheets, see the Help for SAS Enterprise Guide.
Create or Specify a Different Template for Batch ReportsTo create or specify a different template for batch reports, perform the following steps:
1. Use Base SAS to create a new template by modifying the template source file. Forbest results, save the new source file and template file with the new name in the samelocation as the default template at <SAS install location>\SAS\SASFoundation\9.2\itrmmvadata\sasmisc (such as C:\ProgramFiles\SAS\SASFoundation\9.2\itrmmvadata\sasmisc) and <SASinstall location>\SAS\SASFoundation\9.2\itrmmvadata\sashelp.
For more information about modifying a report template, see the documentation forPROC TEMPLATE at http:\\support.sas.com.
2. Modify the Gallery transformation in your report jobs to specify the new templatename.
3. Redeploy your report jobs.
Note: For best results, use the same template when working with SAS Enterprise Guideinteractively. For more information about working with style sheets in SASEnterprise Guide, see the Help for SAS Enterprise Guide.
Create or Specify a Different Style Sheet for Batch ReportsIf you want to use a style sheet other than the one that is already specified in your reportjobs, perform the following steps:
1. Make a copy of the default style sheet and use a text editor or SAS Enterprise Guideto modify the style sheet specifications. For more information about working withstyle sheets in SAS Enterprise Guide, see the Help for SAS Enterprise Guide.
2. Copy your new style sheet to one of the following supported locations:
• the Web application server directory on your middle tier (such as<webapp root>/SASContentServer/).
• a folder on all clients where the Web browser is initiated (such asfile://c:/programfiles/<folder name>/).
Note: For ease-of-use and portability of report jobs, use the Web applicationserver location.
88 Chapter 7 • Working with Gallery Transformations and Report Jobs

3. Modify the Gallery transformation in your report jobs to point to the new style sheetname and location.
4. Redeploy your report jobs
Note: For best results, use the same style sheet when working with SAS EnterpriseGuide interactively. For more information about working with style sheets in SASEnterprise Guide, see the Help for SAS Enterprise Guide.
Working with Templates and Style Sheets 89

90 Chapter 7 • Working with Gallery Transformations and Report Jobs

Part 3
Viewing and Managing BatchReports
Chapter 8Working with the Gallery Manager . . . . . . . . . . . . . . . . . . . . . . . . . . . . . . . 93
Chapter 9Working with the SAS Content Server . . . . . . . . . . . . . . . . . . . . . . . . . . . 107
91

92
Chapter 8
Working with the Gallery Manager
What Is Gallery Manager? . . . . . . . . . . . . . . . . . . . . . . . . . . . . . . . . . . . . . . . . . . . . . 93
How to Get Help and Documentation for Gallery Manager . . . . . . . . . . . . . . . . . . 94
How Gallery Manager Works . . . . . . . . . . . . . . . . . . . . . . . . . . . . . . . . . . . . . . . . . . . 94Organizing Reports . . . . . . . . . . . . . . . . . . . . . . . . . . . . . . . . . . . . . . . . . . . . . . . . . . 94Viewing Reports . . . . . . . . . . . . . . . . . . . . . . . . . . . . . . . . . . . . . . . . . . . . . . . . . . . . 95Copying and E-mailing Reports . . . . . . . . . . . . . . . . . . . . . . . . . . . . . . . . . . . . . . . . 97
The Gallery Manager Interface . . . . . . . . . . . . . . . . . . . . . . . . . . . . . . . . . . . . . . . . . . 97Log On as a Registered User . . . . . . . . . . . . . . . . . . . . . . . . . . . . . . . . . . . . . . . . . . 97Your First Look at the Gallery Manager Interface . . . . . . . . . . . . . . . . . . . . . . . . . . 97Gallery Manager Banner . . . . . . . . . . . . . . . . . . . . . . . . . . . . . . . . . . . . . . . . . . . . . . 98Browse Pane . . . . . . . . . . . . . . . . . . . . . . . . . . . . . . . . . . . . . . . . . . . . . . . . . . . . . . . 98Filters Pane . . . . . . . . . . . . . . . . . . . . . . . . . . . . . . . . . . . . . . . . . . . . . . . . . . . . . . . . 99Gallery Pane . . . . . . . . . . . . . . . . . . . . . . . . . . . . . . . . . . . . . . . . . . . . . . . . . . . . . . 100Favorites Pane . . . . . . . . . . . . . . . . . . . . . . . . . . . . . . . . . . . . . . . . . . . . . . . . . . . . . 103Status Bar . . . . . . . . . . . . . . . . . . . . . . . . . . . . . . . . . . . . . . . . . . . . . . . . . . . . . . . . 103Action Buttons . . . . . . . . . . . . . . . . . . . . . . . . . . . . . . . . . . . . . . . . . . . . . . . . . . . . 104
Sample Reports . . . . . . . . . . . . . . . . . . . . . . . . . . . . . . . . . . . . . . . . . . . . . . . . . . . . . . 104
What Is Gallery Manager?Gallery Manager is a Web application that is available with SAS IT ResourceManagement. This application enables users to view, organize, filter, save, and e-mailSAS IT Resource Management reports. You can use Gallery Manger to group reportsinto galleries and then further filter or subset the reports for viewing.
Gallery Manager enables you, based on your login permissions, to designate galleryfolders as public or private. These settings control who has access to the gallery foldersand galleries that you create. You can save reports as Favorites and keep them forviewing later or e-mail them to others.
93
How to Get Help and Documentation for GalleryManager
This chapter provides a brief overview and introduction to the Gallery Manager.However, more documentation available for this application.
You can use the following two types of documentation to find more information aboutthe features, benefits, and capabilities of the Gallery Manager:
Embedded HelpHelp pop-ups and tooltips provide brief descriptions of various tasks and fields tohelp you use Gallery Manager effectively.
To access a Help pop-up for more information about a current topic, click the Helpicon ( ) when it appears next to a field or area in the user interface. You can alsoplace the mouse pointer over an element in the user interface to view the associatedtooltip for more information.
SAS IT Resource Management: Gallery Manager User's GuideThis document, available as a PDF file, provides detailed information about theconcepts and tasks that are related to using Gallery Manager. To access thisdocument, click Help ð User's Guide (PDF) in the application.
Additional documentation and references are also available from the Help menu inGallery Manager. To access these resources, click Help in the Gallery Managerapplication and select from the following menu options:
• SAS on the Web includes the following two help options:
• IT Resource Management — Gallery Manager opens the SAS IT ResourceManagement documentation page on the Web (http://support.sas.com/itrm). This page includes the SAS IT Resource Management: Gallery ManagerUser's Guide as well as additional documentation for SAS IT ResourceManagement.
• SAS Home Page opens the SAS home page at http://www.sas.com.
• About IT Resource Management — Gallery Manager provides more informationabout the version of the application and related details.
How Gallery Manager Works
Organizing ReportsYou can organize SAS IT Resource Management reports with the following twocomponents:
• Galleries
A gallery is a group of reports that share common filter values. You can organizeSAS IT Resource Management reports by creating a gallery that includes all of thereports that meet a specific criterion. For example, you might create a gallery to
94 Chapter 8 • Working with the Gallery Manager

include all available reports for a particular machine, adapter data source, orkeyword.
Gallery Manager also enables you to further subset or filter the reports in a galleryfor viewing. Thus, you can quickly view a smaller set of reports in a gallery tomeasure and analyze the utilization, availability, performance, and statistical trendsof IT resources for your enterprise.
• Gallery Folders
A gallery folder is a container for galleries and other gallery folders. These foldersfunction like typical folders in a tree. You can use these folders to group relatedgalleries and gallery folders. For example, you might create a single gallery folder toinclude all of your galleries for DT Perf Sentry reports.
Viewing ReportsGallery Manager provides three gallery views that enable you to view and sort thereports in different ways:
• The Table view displays the reports and their associated metadata in a grid. You canquickly scan these reports for similarities and double-click an individual report toview a large image of it in a separate browser window.
Display 8.1 A Gallery in the Table View
• The Thumbnail view displays a thumbnail of each report and enables you tominimize, expand, and arrange the reports in the gallery.
How Gallery Manager Works 95

Display 8.2 A Gallery in the Thumbnail View
• The Flow view displays the reports as moveable pages so you can navigate through asequence of reports that are stacked together.
Display 8.3 A Gallery in the Flow View
96 Chapter 8 • Working with the Gallery Manager

Copying and E-mailing ReportsGallery Manager enables you to copy reports of particular interest into Favorites folders.Until deleted manually, report copies in the Favorites folders are saved on the SASContent Server in a physical folder that is unique to each Gallery Manager user. Thereport copies in the Favorites folders are not purged, expired, or updated as part of anysubsequent executions of their associated report jobs. You can e-mail the reports that arein Favorites folders.
The Gallery Manager Interface
Log On as a Registered UserTo log on to Gallery Manager, perform the following steps:
1. In the address bar of your Web browser, enter the URL for Gallery Manager andpress ENTER. The logon window for Gallery Manager appears.
Note: Contact your system administrator if you do not have the URL for GalleryManager.
Display 8.4 Gallery Manager Log On Window
2. Enter a user ID and password. Your user ID might be case-sensitive, depending onthe operating system that is used to host the application server. Your password iscase-sensitive.
3. Click Log On. The Gallery Manager interface appears.
Your First Look at the Gallery Manager InterfaceThe Gallery Manager interface is divided into several parts that enable you to manageyour gallery folders and galleries. The following image shows a Gallery Managerinterface and its five primary parts:
The Gallery Manager Interface 97

Figure 8.1 Gallery Manager Interface
3
5
2 4
1
1 Gallery Manager banner
2 Browse pane
Note: The Filters pane (not shown above) also resides in this area of the GalleryManager interface. When you select a gallery in the Browse pane, you can usethe icons at the top of the pane to toggle back and forth from the Browse pane tothe Filters pane.
3 Gallery pane
4 Favorites pane
5 Status bar
Note: Each pane includes an Action button that provides task options that are related tothe objects in the pane.
Gallery Manager BannerThe Gallery Manager banner provides identifiers (the application name and SAS logo), alink to more Gallery Manager documentation, and the Log Off option. These featureshelp you to identify and use the application effectively.
Browse PaneThe Browse pane, located on the left side of the Gallery Manager interface, includes atree view of gallery folders and galleries that you can browse and navigate. This paneappears by default when you open the Gallery Manager.
98 Chapter 8 • Working with the Gallery Manager

Display 8.5 Browse Pane
The Browse pane consists of a tree view that has the following two main folders:
• My Galleries contains folders and galleries that a user creates and defines. Thecontent of the My Galleries folder is different for each individual user based onthe gallery folders and galleries that the user creates.
Note: A My Galleries folder is not available to users who are not members ofthe IT Resource Management Administrator or IT Resource Management Usergroups.
• Public Galleries contains folders and galleries that are designated as public.All Gallery Manager users can see the folders and galleries in the PublicGalleries folder.
The Browse pane shares space with the Filters pane. The icons at the top of these panesenable you to toggle back and forth from the Browse pane to the Filters pane. If the
Filters pane is visible, then click the Browse icon ( ) to view the Browse pane.
Filters PaneThe Filters pane, located on the left side of the Gallery Manager interface, enables you tosubset the view of reports in a gallery by one or more criteria. This process reduces thenumber of reports that are shown in the Gallery pane so that you can limit the display tothose specific reports that meet the filter criteria that you specify.
To access the Filters pane, select a gallery in the Browse pane and then click the Filtersicon ( ).
The Gallery Manager Interface 99

Display 8.6 Filters Pane
The Filters pane shares space with the Browse pane. The icons at the top of these panesenable you to toggle back and forth from the Filters pane to the Browse pane.
Gallery PaneThe Gallery pane is the center pane of the Gallery Manager interface. This pane enablesyou to view the details about the gallery folders and galleries that you select in theBrowse or Favorites panes. The Gallery pane also enables you to view the reports thatyou select in a gallery.
The information in the Gallery pane varies based on whether you select to view galleryfolders, a gallery, or a report. Here are the ways that the Gallery pane displaysinformation based on the object that you select:
• If you select a gallery folder in the Browse pane, then the Gallery pane displays thename of the gallery folder in its banner. The Gallery pane also displays the next levelof gallery folders or galleries that the selected folder contains.
100 Chapter 8 • Working with the Gallery Manager

In the following example, the My Galleries folder is selected in the Browse pane.This folder's first level of contents (the Sample Reports gallery and the DEVAMachine Galleries folder) is displayed in the Gallery pane.
Display 8.7 Contents of a Gallery Folder Displayed in the Gallery Pane
• If you select a gallery in the Browse pane, then the Gallery pane displays the name ofthe gallery in its banner. The Gallery pane also displays information about eachreport in the gallery or each report that meets the filter criteria that you specified onthe Filters pane. The status bar provides the number of reports that are available incurrent instance of the Gallery pane.
The Gallery pane provides three formats for viewing reports. You can click one ofthe View icons at the top of the Gallery pane to select the view that you want to usewhen viewing the reports. In each view, you can double-click any report to open it ina separate browser window.
Display 8.8 View Icons in the Gallery Pane
Here are the three views that the Gallery pane provides for viewing the reports in agallery:
• Table view ( ) displays a list or grid of the reports. This is the default view.The following image shows a gallery named My Sample Reports in thebanner and the associated reports in the gallery are listed in the Table view.
Display 8.9 A Gallery Displayed in the Table View
The Gallery Manager Interface 101

• Thumbnail view ( ) displays small images or thumbnails of the reports. Thefollowing image shows a gallery named My Sample Reports in the bannerand the associated reports in the gallery are displayed in the Thumbnail view.
Display 8.10 A Gallery Displayed in the Thumbnail View
• Flow view ( ) displays images of the reports in a stacked sequence. Thefollowing image shows a gallery named My Sample Reports in the bannerand the associated reports in the gallery are displayed in the Flow view.
102 Chapter 8 • Working with the Gallery Manager

Display 8.11 A Gallery Displayed in the Flow View
Favorites PaneThe Favorites pane, located on the right side of the Gallery Manager interface, containscopies of the reports that you choose to save for your personal records or to e-mailothers. The Favorites pane enables you to create and name Favorites folders. In thesefolders, you can organize and store the report copies that show data of a particularinterest.
Display 8.12 Favorites Pane
Status BarThe status bar, located at the bottom of the Gallery Manager interface, displays the userID that is logged on the application. This bar also displays various messages that relateto the current processes, views, or user actions that are running on the application.
The Gallery Manager Interface 103

For example, the following status bar provides the number of reports that are containedin the selected gallery and the current user ID that is logged on the application.
Display 8.13 Status Bar
Action ButtonsEach pane of the Gallery Manager includes an Action button. This button enables you toperform tasks that are related to the given pane. The options that are available for eachAction button vary based on the permissions of the user, the pane where the buttonresides, and the capabilities of the selected objects in the respective pane. For example,the Action button for the Browse and Filters panes enables you to perform the followingtasks that are related to gallery folders and galleries:
• Create a new gallery folder or gallery.
• Edit, copy, or delete a gallery folder or gallery.
• Mark a gallery folder as public or private.
Note: This option is available only if the selected gallery folder is in the first level ofthe My Galleries folder.
These options vary based on the current Gallery Manager selections. For example, ifnothing is selected in the Browse pane when you click the Action button in that pane,then the Edit, Copy, Delete, Public, and Private options are not available.
In addition, the Action buttons in other panes enable you to perform different tasks thatare related to their respective pane. For example, the Action button in the Favorites paneprovides task options that are related to Favorites folders and reports.
Sample ReportsDuring the SAS IT Resource Management installation, 30 sample reports are saved onyour SAS Content Server. These reports provide an example of the different types ofreports that SAS IT Resource Management can create. They also enable you to practiceusing Gallery Manager before you have generated your own reports.
To create a gallery of these sample reports, perform the following steps:
1. Open Gallery Manager.
2. In the Browse pane, click the arrow next to the Action button and select NewGallery.
3. Enter a Name and Description for the new gallery.
4. Click Next.
5. Click the arrow next to Keywords to expand the folder.
6. Select ITRMDomainIntelligence and click the right arrow to move this selection tothe Selected Items list.
Note: All sample reports include the keyword ITRMDomainIntelligence. If thiskeyword does not appear as an available option in your Gallery Manager session,then the sample reports are no longer on your SAS Content Server. For
104 Chapter 8 • Working with the Gallery Manager

information about how to delete the sample reports, see “Delete Sample Reports”on page 109.
7. Click Finish to create the gallery.
Sample Reports 105

106 Chapter 8 • Working with the Gallery Manager

Chapter 9
Working with the SAS ContentServer
About the SAS Content Server . . . . . . . . . . . . . . . . . . . . . . . . . . . . . . . . . . . . . . . . . 107What Is the SAS Content Server? . . . . . . . . . . . . . . . . . . . . . . . . . . . . . . . . . . . . . . 107How Does SAS IT Resource Management Use the SAS Content Server? . . . . . . 107How Does Gallery Manager Use the SAS Content Server . . . . . . . . . . . . . . . . . . . 108
Working with the SAS Content Server . . . . . . . . . . . . . . . . . . . . . . . . . . . . . . . . . . . 108Overview of Working with the SAS Content Server . . . . . . . . . . . . . . . . . . . . . . . 108How Does the Gallery Manager Cache Work? . . . . . . . . . . . . . . . . . . . . . . . . . . . 108Back Up Reports on the SAS Content Server . . . . . . . . . . . . . . . . . . . . . . . . . . . . 109Delete Sample Reports . . . . . . . . . . . . . . . . . . . . . . . . . . . . . . . . . . . . . . . . . . . . . . 109
About the SAS Content Server
What Is the SAS Content Server?The SAS Content Server, a Web-based Distributed Authoring and Versioning(WebDAV) server, is a content repository that stores digital content (such as documents,reports, and images) that is created and used by several SAS client applications. SAS ITResource Management, and other SAS products such as SAS Web Report Studio andSAS Information Delivery Portal, use SAS Content Server for storage of their reportsand supporting files.
How Does SAS IT Resource Management Use the SAS ContentServer?
SAS IT Resource Management uses the SAS Content Server to store reports and reportmetadata that is the output of report jobs.
SAS IT Resource Management enables you to create report jobs with the Adapter Setupwizard or manually. These report jobs include Gallery transformations that specify therepository folder path, relative to the SAS Content Server, in which to store the reports.When these report jobs run, the resulting report outputs are considered batch reports.These reports are generated and stored on the SAS Content Server in correspondingsubfolders of the sasdav/ITRM folder.
The default folder path that SAS IT Resource Management uses to store the reportoutput corresponds to the project name, process flow name, and ITRM Gallery taskname that are associated with the report. For example, the Adapter Setup wizard storesreports in the following standard location on the SAS Content Server: sasdav/ITRM/
107

<SAS Enterprise Guide project name>_<process flow name>/<ITRMGallery task name (which is also the name of the reportdefinition)>. Thus, you can easily navigate to a report on the SAS Content Server ifyou know the project name, process flow name, and ITRM Gallery task name that isassociated with the report.
Note: Meaningful and unique names for SAS Enterprise Guide projects, process flows,and ITRM Gallery tasks enable you to easily identify the reports and theircomponents in the SAS Content Server. For best results, use the same namingconventions that SAS IT Resource Management uses. These conventions maintainconsistency among your SAS IT Resource Management reports and provide a clearstructure for storing and navigating report folders in the SAS Content Server. Formore information, see “Naming Standards and Location of Objects” on page 139.
How Does Gallery Manager Use the SAS Content ServerGallery Manager reads the IT reports that are stored in the SAS Content Server, enablingyou to view and manage all of the reports that are stored within the ITRM folder. GalleryManager connects to the ITRM folder on the SAS Content Server and stores each of thereports within that folder in a cache memory for easy retrieval. When you use theGallery Manager to create a gallery or view available reports, the Gallery Managerenables you to view and work with all of the reports within the ITRM folder.
Working with the SAS Content Server
Overview of Working with the SAS Content ServerGallery Manager enables you to view and work with the SAS IT Resource Managementreports that are on the SAS Content Server. However, if you are a system administrator,then you might need to clean up and delete reports folders that are no longer in use. Forexample, while report jobs purge old reports by default, some report jobs might bediscontinued and become obsolete. In this case, you might delete these reports manually.
CAUTION:Do not delete the ITRM folder or the styles folder in the SAS Content Server.SAS IT Resource Management and the Gallery Manager use the ITRM folder to storeand retrieve IT reports. SAS IT Resource Management reports use theITRMDefault style sheet that is stored in the styles folder. If you remove theITRM folder, then the Adapter Setup wizard report jobs no longer work and theGallery Manager cannot start. If you remove the styles folder, then your reportsmight lose their SAS IT Resource Management styles.
For more information about working with the SAS Content Server, see the chapter aboutadministering the SAS Content Server in the SAS 9.2 Intelligence Platform: WebApplication Administration Guide.
How Does the Gallery Manager Cache Work?Gallery Manager enables you to access, view, and manage all of the SAS IT ResourceManagement reports that are stored within the ITRM folder or its subfolders. GalleryManager scans the ITRM folder on the SAS Content Server to retrieve report metadata
108 Chapter 9 • Working with the SAS Content Server

that it stores in cache memory. Using this cache enables Gallery Manager to retrievereports from the SAS Content Server more quickly.
The Gallery Manager cache is updated during the following events:
• when the Gallery Manager starts.
• when a SAS IT Resource Management report job is run.
• when you force a Gallery Manager cache update. To do so, enter http://<YourMidTierName>:<port number>/ITRMGalleryManager/WebdavUpdate.do?job=job1&status=COMPLETED in the address field ofyour Web browser and press ENTER.
When the Gallery Manager cache is being updated, a message appears at the bottom ofthe user interface.
T I P For best results, make sure that the cache update is invoked when users are notlogged on to Gallery Manager.
Back Up Reports on the SAS Content ServerTo back up your SAS IT Resource Management reports, you must back up the SASContent Server that stores the reports. If you are a system administrator, then back up theSAS Content Server before you manually delete any reports from the SAS ContentServer.
For more information about backing up reports, see Appendix 10, “Best Practices andTroubleshooting Tips” in the SAS IT Resource Management: Administrator's Guide.
Delete Sample ReportsSAS IT Resource Management provides 30 sample reports during installation. Thesesample reports provide examples of the type of reports that SAS IT ResourceManagement provides. They also enable you to see how the Gallery Manager worksbefore you begin processing your own data. For more information, see “SampleReports” on page 104.
After you have viewed the sample reports and have your own reports, you might chooseto delete these sample reports from the SAS Content Server if you no longer need them.You can do so from the SAS Content Server Admin Console, which is located athttp://<YourMidTierName>:<port number>/SASContentServer/dircontents.jsp?path=/sasdav/ITRM. The sample reports are in a folder calledSampleReports. For more information, see the chapter about administering the SASContent Server in the SAS 9.2 Intelligence Platform: Web Application AdministrationGuide.
If you remove reports manually from the SAS Content Server, be sure to refresh thecache. To perform this task, enter http://<YourMidTierName>:<portnumber>/ITRMGalleryManager/WebdavUpdate.do?job=job1&status=COMPLETED in the address field of your Web browser and pressENTER.
T I P For best results, make sure that the cache update is invoked when users are notlogged on to Gallery Manager.
Working with the SAS Content Server 109

110 Chapter 9 • Working with the SAS Content Server

Part 4
Interactive Reporting and Usingthe SAS Portal and SAS BIDashboard
Chapter 10About Interactive Reporting . . . . . . . . . . . . . . . . . . . . . . . . . . . . . . . . . . . . . 113
Chapter 11Using SAS Enterprise Guide Interactively . . . . . . . . . . . . . . . . . . . . . . . 115
Chapter 12Using SAS Web Report Studio Interactively . . . . . . . . . . . . . . . . . . . . . 119
Chapter 13Using SAS Add-In for Microsoft Office Interactively . . . . . . . . . . . . . . 125
Chapter 14Using SAS Portal for Communicating IT Domain Intelligence . . . . 129
Chapter 15Using SAS BI Dashboard . . . . . . . . . . . . . . . . . . . . . . . . . . . . . . . . . . . . . . . 133
111

112
Chapter 10
About Interactive Reporting
Overview of Interactive Reporting . . . . . . . . . . . . . . . . . . . . . . . . . . . . . . . . . . . . . . 113
Overview of Interactive ReportingThe recommended method for generating, managing, and viewing SAS IT ResourceManagement reports is to run the report jobs that were created by the Adapter Setupwizard or by user-specified Gallery transformations. The report jobs are typically run inbatch mode and the resulting reports are managed and viewed in Gallery Manager.However, there are situations that require reports to be generated interactively (forexample, when performing specific IT performance analysis or when developing a newreport). SAS provides the following solutions that enable you to run or view reportsinteractively:
• SAS Enterprise Guide
• SAS Web Report Studio
• SAS Add-In for Microsoft Office
• SAS Information Delivery Portal
• SAS BI Dashboard
These solutions are discussed briefly in the following chapters of this reporting guide.
113

114 Chapter 10 • About Interactive Reporting

Chapter 11
Using SAS Enterprise GuideInteractively
Overview of SAS Enterprise Guide . . . . . . . . . . . . . . . . . . . . . . . . . . . . . . . . . . . . . . 115What Is SAS Enterprise Guide? . . . . . . . . . . . . . . . . . . . . . . . . . . . . . . . . . . . . . . . 115How to Start SAS Enterprise Guide . . . . . . . . . . . . . . . . . . . . . . . . . . . . . . . . . . . . 115Accessing IT Data Marts Using SAS Enterprise Guide . . . . . . . . . . . . . . . . . . . . . 116
Accessing SAS IT Resource Management Projects with SAS Enterprise Guide . 116
Locating SAS Enterprise Guide Documentation . . . . . . . . . . . . . . . . . . . . . . . . . . . 117
Overview of SAS Enterprise Guide
What Is SAS Enterprise Guide?SAS Enterprise Guide is a Microsoft Windows client application that provides a guidedmechanism to exploit the power of SAS. SAS Enterprise Guide uses projects to managea collection of related data, tasks, code, and results. With projects, you can run multipletasks on the same group of data files and create interactive or ad hoc reports.
All report definitions that are supplied by SAS IT Resource Management were generatedusing SAS Enterprise Guide projects similar to those that SAS IT Resource Managementprovides. For more information, see “SAS Enterprise Guide Projects Supplied by SASIT Resource Management” on page 46.
SAS Enterprise Guide provides comprehensive report definition and reporting servicesthat SAS IT Resource Management uses to generate analysis and intelligence about yourIT resources. Report definitions can be run interactively within SAS Enterprise Guide, orthey can be packaged using the ITRM Gallery task and scheduled to run in batch mode.For more information about report definitions and the ITRM Gallery task, see “Aboutthe ITRM Gallery Task” on page 59.
How to Start SAS Enterprise GuideTo start SAS Enterprise Guide, from the Start menu, select Programs ð SAS ðEnterprise Guide.
The Welcome to SAS Enterprise Guide dialog box appears.
115

Display 11.1 Welcome to SAS Enterprise Guide Dialog Box
You can select any of the options in the Welcome window.
Note: Make sure you have access to the project that you want to work with.
Accessing IT Data Marts Using SAS Enterprise GuideBefore you begin working with SAS Enterprise Guide projects, you must use thefunctions of SAS Enterprise Guide in order to perform the following tasks:
• Set up SAS Enterprise Guide so that it can work with SAS IT Resource Managementdata.
• Migrate SAS Enterprise Guide projects so that they can work with your SAS ITResource Management 3.2 IT data marts, in which you created the report data
For more information about how to complete these tasks, see “Preparing to Work withSAS Enterprise Guide” on page 49.
Accessing SAS IT Resource ManagementProjects with SAS Enterprise Guide
The report projects that are supplied by SAS IT Resource Management are available oneach client where SAS IT Resource Management is installed. These projects areavailable in the directory <SAS install location>\SAS\ITRMEG\3.2 (such asc:\Program Files\SAS\ITRMEG\3.2).
Only copies of those projects that are supplied by SAS IT Resource Management shouldbe edited. Copy the projects to a location on your client and then work with thoseprojects by navigating to them in the Server List window. Then, double-click the projectto open it.
Note: If the Server List window is not displayed on your desktop, click View on theSAS Enterprise Guide menu bar. From the drop-down list, select Server List.
116 Chapter 11 • Using SAS Enterprise Guide Interactively

For more information, see Chapter 5, “Working with Supplied SAS Enterprise GuideProjects,” on page 45 and “Managing SAS Enterprise Guide Projects for SAS ITResource Management” on page 162.
Locating SAS Enterprise Guide DocumentationFrom the menu bar of SAS Enterprise Guide, you can click Help to access the Help anda getting started tutorial. You can also access the following resources by selecting Helpð SAS on the Web:
• the home page for SAS Enterprise Guide
• the product documentation page for SAS Enterprise Guide
• SAS online resources for statistics education
• SAS Technical Support resources
• the form for submitting feedback about any SAS product
• hotfixes for SAS Enterprise Guide
• the SAS home page
These Web pages open in your default Web browser.
For information about administrative tasks that are associated with SAS EnterpriseGuide, use the A-Z index at http://support.sas.com/documentation/index.html to locate the documentation that is available for this product.
Locating SAS Enterprise Guide Documentation 117

118 Chapter 11 • Using SAS Enterprise Guide Interactively

Chapter 12
Using SAS Web Report StudioInteractively
Overview of SAS Web Report Studio . . . . . . . . . . . . . . . . . . . . . . . . . . . . . . . . . . . . 119About SAS Web Report Studio . . . . . . . . . . . . . . . . . . . . . . . . . . . . . . . . . . . . . . . 119Log On to SAS Web Report Studio as a Registered User . . . . . . . . . . . . . . . . . . . 119
Access SAS IT Resource Management Information Maps toGenerate a Report in SAS Web Report Studio . . . . . . . . . . . . . . . . . . . . . . . . . . . . 122
E-mailing SAS IT Resource Management Reports . . . . . . . . . . . . . . . . . . . . . . . . . 123
Locating SAS Web Report Studio Documentation . . . . . . . . . . . . . . . . . . . . . . . . . 123
Overview of SAS Web Report Studio
About SAS Web Report StudioSAS Web Report Studio is a Web-based query and reporting application that is providedby the business intelligence components of the SAS Intelligence Platform. It is designedfor users who want to generate reports, view them, and share them with others on theWeb. The application provides several ways to create reports by using a wizard andtemplates. It can also execute stored processes.
SAS Web Report Studio uses as its reporting data source information maps that translatetechnical data structures into user-friendly business terminology. Specific to SAS ITResource Management, information maps are supplied for most aggregated tables andcan be created for any other tables available in the IT data mart. Information maps canbe created through the SAS IT Resource Management Information Map transformationthat is available from the SAS IT Resource Management client or directly through SASInformation Map Studio.
Log On to SAS Web Report Studio as a Registered UserTo log on to SAS Web Report Studio, perform the following steps:
1. To display the SAS Web Report Studio logon window, click on the URL that issupplied by your system administrator or paste it into the address field of yourbrowser. For example, you might enterhttp://server01.abc.com:8080/SASWebReportStudio. The followingwindow appears.
119
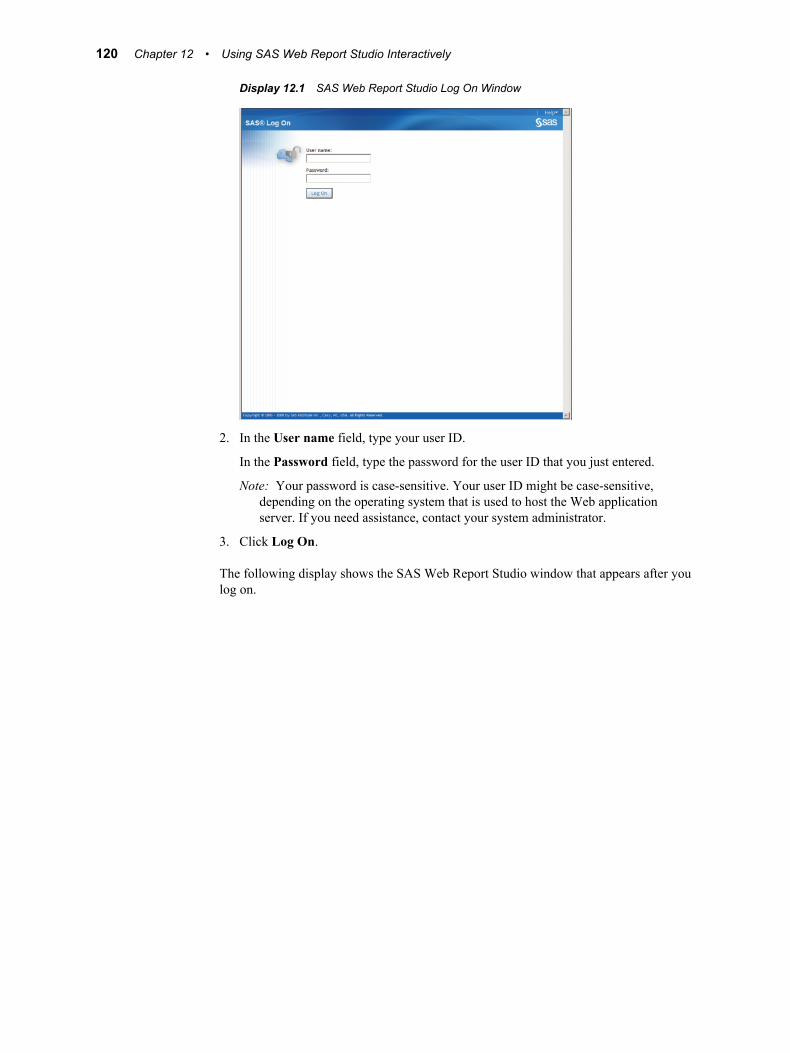
Display 12.1 SAS Web Report Studio Log On Window
2. In the User name field, type your user ID.
In the Password field, type the password for the user ID that you just entered.
Note: Your password is case-sensitive. Your user ID might be case-sensitive,depending on the operating system that is used to host the Web applicationserver. If you need assistance, contact your system administrator.
3. Click Log On.
The following display shows the SAS Web Report Studio window that appears after youlog on.
120 Chapter 12 • Using SAS Web Report Studio Interactively

Figure 12.1 The Welcome Window
7
65
4
8
9
10
1 32
The following actions, which correspond to the numbers on the preceding display, canbe invoked from this window:
1 Click Log Off to exit SAS Web Report Studio. When you select log off, you arelogged off all environments, including the SAS OLAP server and other Webenvironments.
2 Click Preferences to personalize your use of SAS Web Report Studio.
3 Select the Help menu to get help on using SAS Web Report Studio.
4 Click New report to create a new report using the Edit tab.
5 Click New using Report Wizard to access the Report Wizard. The wizard guidesyou in defining a query; selecting a table and graph for the layout; and addingoptional features such as group breaks, a header, and a footer.
6 Click New using Template to access the Select a Template dialog box. When youselect a template, you start creating your report with a predefined layout.
7 Click More Reports to access the Open dialog box. The Open dialog box enablesyou to search for reports, and it lists reports, stored processes, folders, andinformation maps.
8 Click Open to access the Open dialog box. The Open dialog box enables you tosearch for reports, and it lists reports, stored processes, and folders.
9 Click New to create a new report using the Edit tab.
10 Select the File menu to access task options, such as Open and Manage Files.
Note: For more information about these actions, see the SAS Web Report Studio: User’sGuide.
Overview of SAS Web Report Studio 121
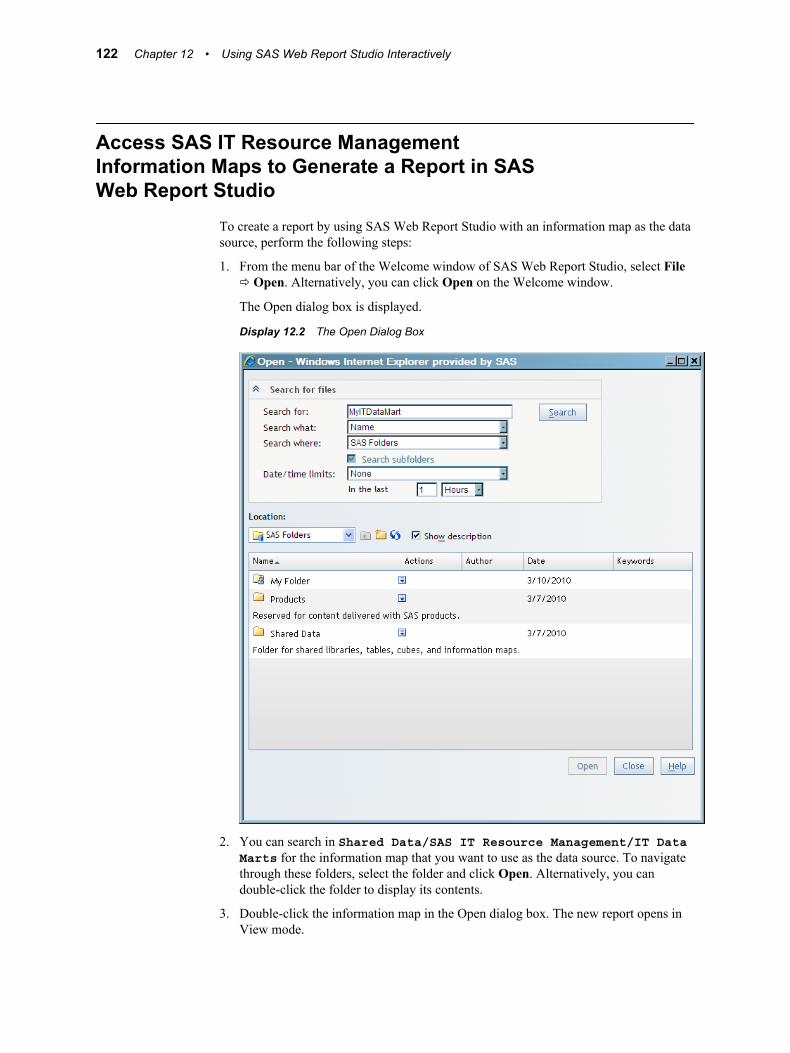
Access SAS IT Resource ManagementInformation Maps to Generate a Report in SASWeb Report Studio
To create a report by using SAS Web Report Studio with an information map as the datasource, perform the following steps:
1. From the menu bar of the Welcome window of SAS Web Report Studio, select Fileð Open. Alternatively, you can click Open on the Welcome window.
The Open dialog box is displayed.
Display 12.2 The Open Dialog Box
2. You can search in Shared Data/SAS IT Resource Management/IT DataMarts for the information map that you want to use as the data source. To navigatethrough these folders, select the folder and click Open. Alternatively, you candouble-click the folder to display its contents.
3. Double-click the information map in the Open dialog box. The new report opens inView mode.
122 Chapter 12 • Using SAS Web Report Studio Interactively

Note: When the information map is run, it accesses the corresponding data itemsthat are in the source tables of aggregation data that are the input to the job thatgenerated the information map.
E-mailing SAS IT Resource Management ReportsReports can be shared with others or kept in private folders based on security settings.Certain pages of reports can be distributed to authorized users via e-mail. Forinformation about how to e-mail reports, see Chapter 24, “Sharing Reports” in the SASWeb Report Studio: User's Guide.
Locating SAS Web Report Studio DocumentationThere are two ways to access Help from within SAS Web Report Studio:
• Select Help ð Contents or Help ð Using this Window.
Note: The Contents tab enables you to access the SAS Web Report Studio: User'sGuide.
• Click Help, which is available from any SAS Web Report Studio dialog box orwizard page.
For information about administrative tasks that are associated with SAS Web ReportStudio, use the A-Z index at http://support.sas.com/documentation/index.html to locate the documentation that is available for this product.
Locating SAS Web Report Studio Documentation 123

124 Chapter 12 • Using SAS Web Report Studio Interactively

Chapter 13
Using SAS Add-In for MicrosoftOffice Interactively
SAS Add-In for Microsoft Office and SAS IT Resource Management Data . . . . 125About SAS Add-In for Microsoft Office . . . . . . . . . . . . . . . . . . . . . . . . . . . . . . . . 125How to Access SAS Add-In for Microsoft Office . . . . . . . . . . . . . . . . . . . . . . . . . 125
Using SAS Add-In for Microsoft Office to Access SAS ITResource Management Data . . . . . . . . . . . . . . . . . . . . . . . . . . . . . . . . . . . . . . . . . . . 126
Use SAS Tools to Analyze Your Data in Microsoft Excel . . . . . . . . . . . . . . . . . . 126Create Stored Processes . . . . . . . . . . . . . . . . . . . . . . . . . . . . . . . . . . . . . . . . . . . . . 127Execute a Stored Process from SAS Add-In for Microsoft Office . . . . . . . . . . . . . 127Publish Results to a Central Location . . . . . . . . . . . . . . . . . . . . . . . . . . . . . . . . . . . 128Locating SAS Add-In for Microsoft Office Documentation . . . . . . . . . . . . . . . . . 128
SAS Add-In for Microsoft Office and SAS ITResource Management Data
About SAS Add-In for Microsoft OfficeThe SAS Add-In for Microsoft Office extends the functionality of Microsoft Excel,Microsoft Word, and Microsoft PowerPoint by enabling you to access SAS analytics andSAS reporting functionality without any SAS programming experience.
The SAS add-in includes approximately 80 SAS tasks that enable you to perform avariety of analyses. Examples of analyses that you can perform include linear andnonlinear regressions, multivariate analyses, time series analyses, one-way frequencies,and summary statistics. The SAS add-in enables you to refresh these analyses so thatyour results include the most up-to-date information. You can also easily share theresults with others at your site.
How to Access SAS Add-In for Microsoft OfficeAs the SAS IT Resource Management client is installed, the SAS add-in is installed onyour computer. As such, a SAS tab is automatically integrated into the Ribbon inMicrosoft Excel, Word, and PowerPoint 2010. The SAS tab enables you to access SASanalytics and reporting functionality directly from these Microsoft Office programswithout having to open a separate SAS interface.
When you select the SAS tab from the Microsoft Excel menu bar, the Ribbon menu barwith SAS options and functionality is displayed:
125

Display 13.1 SAS Tab Functionality in the Microsoft Excel Ribbon
As shown in the following two displays, similar functions and options are availablewhen the SAS tab is selected from the menu bars of Microsoft Word and MicrosoftPowerPoint.
Display 13.2 SAS Tab Functionality in the Microsoft Word Ribbon
Display 13.3 SAS Tab Functionality in the Microsoft PowerPoint Ribbon
Note: The instructions and screenshots in this chapter are specific to Microsoft Office2007-2010. If you are using Microsoft Office 2000-2003, you can perform the tasksdescribed in this chapter. However, the SAS options are located in the SAS menurather than the SAS tab.
To locate more information about using SAS Add-In for Microsoft Office, navigate tothe Web site at http://support.sas.com/documentation/index.html. Usethe A-Z index to select SAS Add-In for Microsoft Office.
Using SAS Add-In for Microsoft Office to AccessSAS IT Resource Management Data
Use SAS Tools to Analyze Your Data in Microsoft ExcelWhen you open Microsoft Excel 2010, you should see a SAS tab in the Ribbon. Youaccess the SAS add-in from the menu options on this tab.
You can perform a variety of tasks using the SAS add-in. The following process brieflyexplains how you would run a SAS analysis:
1. Open Microsoft Excel.
2. Select the data source that you want to work with. In Excel, you can use data in anexisting Excel worksheet or in a SAS data source. If you select a SAS data source,you can choose to filter and sort the data before the analysis.
Note: If the SAS data source is open in an Excel worksheet, then the task uses thefilter and sort criteria that you specified when opening the data source.
3. Select the analysis that you want to perform.
126 Chapter 13 • Using SAS Add-In for Microsoft Office Interactively

Note: After you select the analysis, you might be prompted to log on to the SASserver if you have not previously logged on during the current session. You mustbe connected to a SAS server to run an analysis or to access a SAS data source.
4. Select the options in the analysis that you want to use and then run the analysis.
5. Specify the location of the output. For example, in Excel, you can choose to includethe results in the existing worksheet, in a new worksheet, or in a new workbook. Theresults automatically open in Excel in the location that you chose.
Note: The SAS add-in is also available in Microsoft Word and PowerPoint.
Create Stored ProcessesSAS Add-In for Microsoft Office enables users to run stored processes and customizethe appearance of results that are returned by Microsoft Word or Microsoft Excel. Astored process is a SAS program that is hosted on a server and described by metadata.Stored processes can be written by anyone who is familiar with the SAS programminglanguage or with the aid of a SAS code generator such as SAS Enterprise Guide. Thebasic steps to creating a stored process are as follows:
• Write the stored process.
• Choose or define a server.
• Register the metadata.
For information about how to perform these steps to create a stored process, see the SASStored Processes Developer’s Guide, which can be found at http://support.sas.com/documentation/index.html. Use the A-Z index to locatethis documentation.
Execute a Stored Process from SAS Add-In for Microsoft OfficeTo run a stored process from SAS Add-In for Microsoft Office, perform the followingsteps:
1. If you are using Microsoft Office 2007-2010, select the SAS tab in the Ribbon.
If you are using Microsoft Office 2000-2003, select SAS ð Reports.
The Reports window appears.
2. Select the stored process that you want to run and click Open. If the stored processthat you want to run is not available, you might want to refresh your list of storedprocesses.
Note: You can also run the stored process by right-clicking the stored process andselecting Open from the pop-up menu.
3. Specify information for any prompts that appear. These prompts for user-suppliedvalues are defined when the stored process is created.
After you have specified values for any required parameters, the results of the storedprocess open in the worksheet, document, or presentation.
Note: If the stored process produces streaming results and your image format is not setto ActiveX, then any graphs that the stored process generates cannot be displayed.For more information, see the "Troubleshooting: Working with Stored Processes"topic in the Help for SAS Add-in for Microsoft Office.
Using SAS Add-In for Microsoft Office to Access SAS IT Resource Management Data127

Publish Results to a Central LocationBy publishing a document, you can share it with others without having to e-mail it. Ifyou publish the document to a metadata repository, then you can perform an impactanalysis on the document. Impact analysis enables you to see where a data source camefrom and the items that are dependent on this source. This analysis enables you to knowhow changing a data source might affect other documents.
Note: To publish a document, the SAS support personnel at your site must haveinstalled SAS Web Report Studio on the same metadata server.
For detailed information about how to publish a report, see the “Working with PublishedDocuments” topic in Chapter 6, “Next Steps: A Quick Look at Additional Features” inSAS Add-In for Microsoft Office: Getting Started with Data Analysis.
Locating SAS Add-In for Microsoft Office DocumentationFrom the SAS Ribbon bar of Microsoft Word, Excel, or PowerPoint, you can click Helpto access the SAS Help for the products that are included in SAS Add-In for MicrosoftOffice. In addition, SAS Add-In for Microsoft Office: Getting Started with Data Analysiscan be found at http://support.sas.com/documentation/index.html.
Use the A-Z index to locate the documentation that is available for this product.
128 Chapter 13 • Using SAS Add-In for Microsoft Office Interactively
Chapter 14
Using SAS Portal forCommunicating IT DomainIntelligence
Overview of SAS Information Delivery Portal . . . . . . . . . . . . . . . . . . . . . . . . . . . . 129About SAS Information Delivery Portal . . . . . . . . . . . . . . . . . . . . . . . . . . . . . . . . 129How to Access SAS Information Delivery Portal . . . . . . . . . . . . . . . . . . . . . . . . . 129How to Log Off from the Portal . . . . . . . . . . . . . . . . . . . . . . . . . . . . . . . . . . . . . . . 130How to Content Is Organized in the Portal . . . . . . . . . . . . . . . . . . . . . . . . . . . . . . . 130
Locating SAS Information Delivery Portal Documentation . . . . . . . . . . . . . . . . . . 132
Overview of SAS Information Delivery Portal
About SAS Information Delivery PortalThe SAS Information Delivery Portal (or simply, the portal) is a Web application thatprovides a single, easy-to-use interface from which you can access a broad range ofenterprise information. This information includes reports, charts, Web applications,documents, and links to internal or external Web pages. The portal gives you access toinformation that is produced through the analytical capabilities of SAS, and provides asingle access point to SAS output.
Your organization can use the portal to deliver important and timely businessintelligence efficiently to employees, customers, partners, and vendors. The portalprovides a secure environment for your business intelligence so that users see only theinformation that they have security rights to access.
The portal's personalization features enable you to create and customize your own Webpages and content. You can organize your personal portal so that it contains only theinformation that you need, in the format that makes the most sense to you. From theportal, you can subscribe to publication channels that deliver continually updatedinformation to your desktop. The portal also provides a secure environment for sharinginformation with other users.
How to Access SAS Information Delivery PortalTo open the SAS Information Delivery Portal, open your Web browser and point it tothe portal's URL address. To obtain the URL, contact your administrator.
To identify yourself to the portal, you must log on with your user name and password.(If you do not have a user name and password, contact your administrator to obtainthem.)
129

After you log on, you can do the following tasks:
• Personalize your view of the portal by adding pages, portlets, and content items andmodifying or rearranging them to meet your unique needs. Each time you log on,your own personalized view of the portal is displayed.
• Search for and view protected content that your user name and password authorizeyou to access.
• Launch other applications that might be available from the portal, without the needto re-enter your user name and password.
The logon procedure varies depending on how your organization has installed the portal.Use either the portal logon procedure or the Web server logon procedure, as appropriate.
• If your organization uses the portal's logon feature, open your browser and point tothe portal's URL. When the portal's logon page appears, enter your User Name andPassword. Then click Log On to open your personal portal.
• Organizations that use the Web Server Logon, have different logon procedures. Afteryou have logged on to the Web server, open your personal portlet by pointing yourbrowser to the portal's URL.
Note: The portal supports only one user session per browser instance. Different portalusers can have different sessions in separate browser instances, but not in separatetabs in the same browser instance.
How to Log Off from the PortalWhen you are finished using the portal, you should log off in order to close your portalsession. Logging off releases the system resources that you were using. (Your portalsession continues to use system resources until the session expires, even if you closedthe browser window.)
To log off, click Log Off in the banner. Then close the browser window.
How to Content Is Organized in the PortalThe following figure is an example of a portal.
Note: Your organization might customize the portal so that it looks different from theexample shown here.
130 Chapter 14 • Using SAS Portal for Communicating IT Domain Intelligence

Figure 14.1 Information Delivery Portal
1 The navigation bar contains links for your portal Web pages. You open a differentpage by clicking its name in the navigation bar. In the display, the portal's Homepage is the active Web page. Notice that the Home link is highlighted on thenavigation bar.
2 Portlets are the rectangular display components of a portal page that contain links,graphs, reports, and other information that is available in the portal. You can edit thecontents of some portlets. To edit, remove, or minimize a portlet, use the icons in theportlet title bar.
3 The banner provides links that enable you to customize your portal and personalizeyour portal by means of the Options button. The banner also provides search, logoff, demonstration, and help features.
4 The portal links enable you to view information or launch applications that areavailable to you through the portal by clicking any active link that is displayed insidea portlet.
For information about the type of content that the portal can contain and how to add,view, and manage the portal's content, see the documentation that is available for SASInformation Delivery Portal.
Overview of SAS Information Delivery Portal 131

Locating SAS Information Delivery PortalDocumentation
To access Help from within SAS Information Delivery Portal, click Help in the banner.
For more information about SAS Information Delivery Portal, use the A-Z index athttp://support.sas.com/documentation/index.html to locate thedocumentation that is available for this product.
132 Chapter 14 • Using SAS Portal for Communicating IT Domain Intelligence
Chapter 15
Using SAS BI Dashboard
Overview of SAS BI Dashboard . . . . . . . . . . . . . . . . . . . . . . . . . . . . . . . . . . . . . . . . 133About SAS BI Dashboard . . . . . . . . . . . . . . . . . . . . . . . . . . . . . . . . . . . . . . . . . . . . 133Log On to SAS BI Dashboard . . . . . . . . . . . . . . . . . . . . . . . . . . . . . . . . . . . . . . . . 134
Locating SAS BI Dashboard Documentation . . . . . . . . . . . . . . . . . . . . . . . . . . . . . . 135
Overview of SAS BI Dashboard
About SAS BI DashboardA dashboard is a container that is nested within a portlet and that contains one or moreindicators. An indicator is a composite of one or more related objects. Each indicator hasa data source, one or more gauges, hyperlinks to additional information, and rangesettings for the gauges. Dashboards display critical information in such a way that theinformation can be interpreted and monitored at a glance. Dashboards can also containlinks to other pertinent information, important summary and highlights, and personalizedinformation such as weather, news, and stock news. Here is an example dashboard thatcontains three dashboards that use different data sources:
133

Display 15.1 Example of the SAS BI Dashboard
The SAS BI Dashboard enables users to use dashboards to monitor key performanceindicators that convey how well an organization is performing. As shown in thepreceding display, dashboards include graphics, text, colors, and hyperlinks. Thepreceding dashboard shows multiple indicators, each with its own data modelunderneath. These indicators are driven by six different SQL queries, but the datamodels could be all information maps, all scorecards, or some combination of thesetypes. This dashboard displays gauges, graphs, bar charts, line plots, and a map.
Dashboards are created, maintained, and viewed through an easy-to-use Web-basedinterface. All content is displayed in a role-based, secure, customizable, and extensibleenvironment. Information consumers and performance analysts can customize howinformation appears on their personal dashboards.
SAS BI Dashboard enables users to create their own dashboards from a variety of datasources, including information maps and SAS data sets. Users can link dashboards toSAS business intelligence objects or to external URLs, and users can customize thevisualization of the data in a number of ways. For more information about the SAS BIDashboard, see the SAS BI Dashboard: User's Guide.
Log On to SAS BI DashboardThe SAS BI Dashboard is accessed from within the SAS Information Delivery Portal.The current logon information from the portal is provided to the SAS BI Dashboard.Therefore, the SAS BI Dashboard appears immediately, without the need to log on. Formore information, see the Help for SAS Information Delivery Portal.
To access SAS BI Dashboard, open the SAS Information Delivery Portal and log on. Todo so, perform the following steps:
134 Chapter 15 • Using SAS BI Dashboard

1. Open your Web browser and point it to the portal's URL address. To obtain the URL,contact your portal administrator.
2. To identify yourself to the portal, log on with your user name and password. If youdo not have a user name and password, contact your system administrator to obtainthem.
The logon procedure varies depending on how your organization has installed theportal. Use either the portal logon procedure or the Web server logon procedure, asappropriate.
3. If your organization uses the portal's logon feature, do the following:
a. Open your browser and point to the portal's URL. Either a public page or theportal's logon page appears.
b. If a public page appears, click Log On in the banner.
c. On the logon page, enter your user name and password.
d. Click Log On. Your personal portal opens.
4. If your organization uses a Web server to identify each user, do the following:
a. Use the Web server logon procedure specified for your organization. (Thisprocedure is different in each organization.)
b. After you have logged on to the Web server, point your browser to the portal'sURL. Your personal portal opens.
Locating SAS BI Dashboard DocumentationOnline Help for the SAS BI Dashboard is available from within the product. For moreinformation, see the SAS BI Dashboard: User’s Guide, which is available at http://support.sas.com/documentation/index.html. Use the A-Z index to locatethe documentation for this product.
Locating SAS BI Dashboard Documentation 135

136 Chapter 15 • Using SAS BI Dashboard

Part 5
Appendixes
Appendix 1Naming Standards for Reporting Objects . . . . . . . . . . . . . . . . . . . . . . . . 139
Appendix 2Reporting Standards for SAS IT Resource Management Reports . 145
Appendix 3Troubleshooting and Debugging Tips . . . . . . . . . . . . . . . . . . . . . . . . . . . 153
Appendix 4Best Practices . . . . . . . . . . . . . . . . . . . . . . . . . . . . . . . . . . . . . . . . . . . . . . . . . . 161
Appendix 5Report Conversion Guide . . . . . . . . . . . . . . . . . . . . . . . . . . . . . . . . . . . . . . . 169
Appendix 6Recommended Reading . . . . . . . . . . . . . . . . . . . . . . . . . . . . . . . . . . . . . . . . 213
137

138

Appendix 1
Naming Standards for ReportingObjects
About Naming Standards for SAS IT Resource ManagementReporting Objects . . . . . . . . . . . . . . . . . . . . . . . . . . . . . . . . . . . . . . . . . . . . . . . . . . . . 139
Naming Standards and Location of Objects . . . . . . . . . . . . . . . . . . . . . . . . . . . . . . 139Information Maps . . . . . . . . . . . . . . . . . . . . . . . . . . . . . . . . . . . . . . . . . . . . . . . . . . 139Supplied SAS Enterprise Guide Projects . . . . . . . . . . . . . . . . . . . . . . . . . . . . . . . . 142Gallery Transformations and Report Jobs . . . . . . . . . . . . . . . . . . . . . . . . . . . . . . . 143
About Naming Standards for SAS IT ResourceManagement Reporting Objects
SAS IT Resource Management uses specific naming conventions and locations whennaming and saving the various reporting components that it supplies and creates. Theseconventions simplify the management and maintenance of the objects that areinterrelated for IT reporting in SAS Enterprise Guide, the SAS IT Resource Managementclient, and Gallery Manager.
For consistency and efficiency, if you choose to create or edit SAS Enterprise Guideprojects, report definitions, Gallery transformations, or any other reporting componentfor your IT resource data, then use the same naming and storage conventions that SASIT Resource Management uses.
Naming Standards and Location of Objects
Information MapsThe following table describes the standard naming conventions and storage locationsthat SAS IT Resource Management uses when creating and saving the various objectsthat are associated with information maps.
139

ObjectNamingConvention Location Notes
information map An information maphas the same name asits correspondingsource table.(Example:MonthShiftDisk)
In the IT Data Martstree: <IT data martname> ð <adaptertype><number> ðDomain Categoriesð <domaincategory>.
information map filter(date type)
Includes descriptivewords that show theperformance areafirst, then adescriptor, the type ofmetric, and a statistic.(Examples:MemoryUsagePctWMean,PagesFreedRateMax)
In the InformationMap transformationthat is part of theinformation map job.Information mapfilters are availableon the InformationMap Parameters tabof the InformationMap transformationproperties.
Mixed case with nospaces.
140 Appendix 1 • Naming Standards for Reporting Objects

ObjectNamingConvention Location Notes
information map filter(statistic type)
Includes descriptivewords andcomponents that arebased on thefollowing guidelines:
• The first twocharacters (if thefilter is based on arank column froma joined table)show which levelthe column comesfrom. Forexample, D_ forDay level table,W_ for Week leveltable, M_ forMonth level table,or nothing when itis not from ajoined table.
• The text stringTop or Botcorresponds toascending ordescending order.
• The data itemname on whichthe column isbased, whenappropriate, isincluded.
• The text stringDescRank orAscRank isincluded to showthe rank orderwhen appropriate.
(Examples:BotMemoryAvailableMB,TopCpuBusyPct)
In the InformationMap transformationthat is part of theinformation map job.Information mapfilters are availableon the InformationMap Parameters tabof the InformationMap transformationproperties.
Mixed case with nospaces.
information map job <domaincategory>InformationMap (Example: DiskInformation Map)
In the IT Data Martstree: <IT data martname> ð <adaptertype><number> ðDomain Categoriesð <domaincategory>.
Naming Standards and Location of Objects 141

ObjectNamingConvention Location Notes
Information Maptransformation
<timeperiod><measurementcategory>(Example:MonthShiftDisk)
An activeInformation Maptransformation is inthe information mapjob. A template tocreate your ownInformation Maptransformation is inthe Transformationstree in ITRMTransformations.
• The same name asthe aggregationtable that it uses.
• Cannot containdouble quotationmarks.
Supplied SAS Enterprise Guide ProjectsThe following table describes the standard naming conventions and storage locationsthat SAS IT Resource Management uses to name and save the various objects that areassociated with the supplied SAS Enterprise Guide projects.
ObjectNamingConvention Location Notes
project <Adapter><DomainCategory>(Example:DTPerfSentryServerSystem.egp)
Windows: programfiles/sas/itrmeg/3.2.
process flow <TimePeriod>Job<DataSourceName> (Example:DayJobDetailSystem)
An active Gallerytransformation is inthe reporting job. Atemplate to createyour own Gallerytransformation is inthe Transformationstree in ITRMTransformations.
Transformationnames cannot containdouble quotationmarks.
ITRM Gallery task <Resource><FilterDescription><GraphType><TimePeriod>(Example:SystemCpuHighUsagePlotForTheDay)
The last object in abranch of a processflow in a SASEnterprise Guideproject.
The ITRM Gallerytask name is the sameas the reportdefinition that itcreates.
142 Appendix 1 • Naming Standards for Reporting Objects
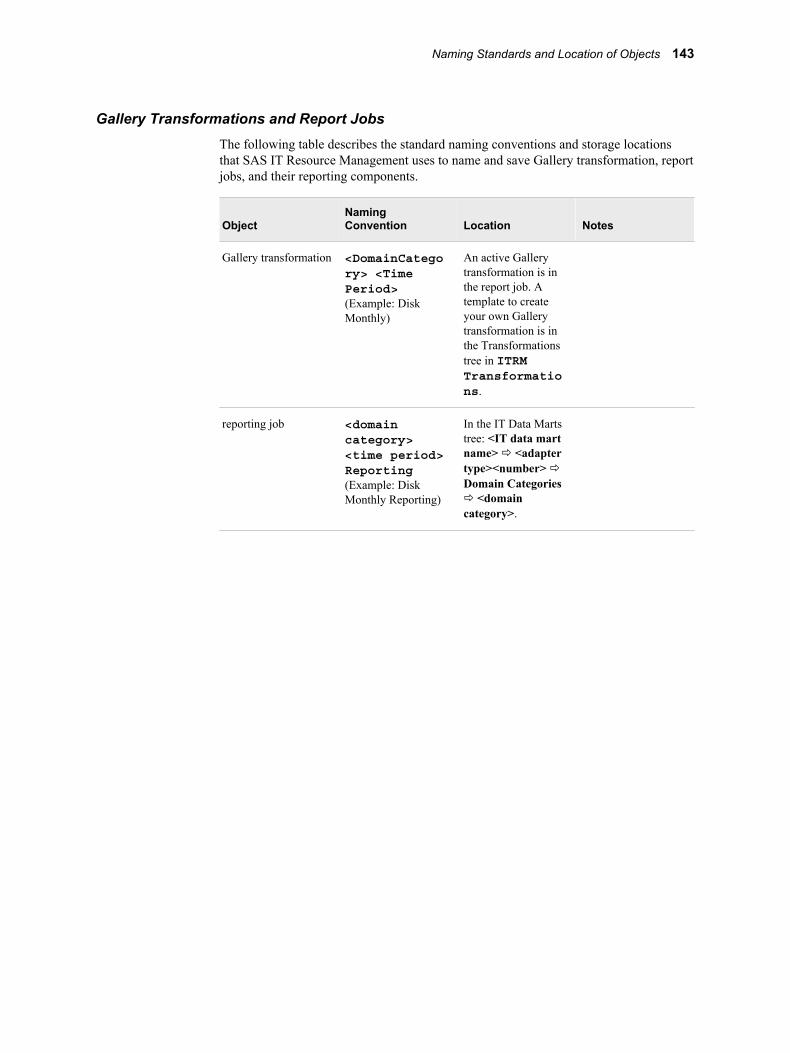
Gallery Transformations and Report JobsThe following table describes the standard naming conventions and storage locationsthat SAS IT Resource Management uses to name and save Gallery transformation, reportjobs, and their reporting components.
ObjectNamingConvention Location Notes
Gallery transformation <DomainCategory> <TimePeriod>(Example: DiskMonthly)
An active Gallerytransformation is inthe report job. Atemplate to createyour own Gallerytransformation is inthe Transformationstree in ITRMTransformations.
reporting job <domaincategory><time period>Reporting(Example: DiskMonthly Reporting)
In the IT Data Martstree: <IT data martname> ð <adaptertype><number> ðDomain Categoriesð <domaincategory>.
Naming Standards and Location of Objects 143

144 Appendix 1 • Naming Standards for Reporting Objects

Appendix 2
Reporting Standards for SAS ITResource Management Reports
About Reporting Standards for SAS IT Resource Management Reports . . . . . . 145
Standards for SAS IT Resource Management Report Elements . . . . . . . . . . . . . . 146Titles . . . . . . . . . . . . . . . . . . . . . . . . . . . . . . . . . . . . . . . . . . . . . . . . . . . . . . . . . . . . 146Footnotes . . . . . . . . . . . . . . . . . . . . . . . . . . . . . . . . . . . . . . . . . . . . . . . . . . . . . . . . . 147Axis . . . . . . . . . . . . . . . . . . . . . . . . . . . . . . . . . . . . . . . . . . . . . . . . . . . . . . . . . . . . . 148Colors . . . . . . . . . . . . . . . . . . . . . . . . . . . . . . . . . . . . . . . . . . . . . . . . . . . . . . . . . . . 148Group BY . . . . . . . . . . . . . . . . . . . . . . . . . . . . . . . . . . . . . . . . . . . . . . . . . . . . . . . . 149Reference Lines . . . . . . . . . . . . . . . . . . . . . . . . . . . . . . . . . . . . . . . . . . . . . . . . . . . 149Fonts . . . . . . . . . . . . . . . . . . . . . . . . . . . . . . . . . . . . . . . . . . . . . . . . . . . . . . . . . . . . 149Formats . . . . . . . . . . . . . . . . . . . . . . . . . . . . . . . . . . . . . . . . . . . . . . . . . . . . . . . . . . 149Symbols . . . . . . . . . . . . . . . . . . . . . . . . . . . . . . . . . . . . . . . . . . . . . . . . . . . . . . . . . 149
Standard Specifications for Report Tasks . . . . . . . . . . . . . . . . . . . . . . . . . . . . . . . . 150Line Plots . . . . . . . . . . . . . . . . . . . . . . . . . . . . . . . . . . . . . . . . . . . . . . . . . . . . . . . . 1502XY Plots . . . . . . . . . . . . . . . . . . . . . . . . . . . . . . . . . . . . . . . . . . . . . . . . . . . . . . . . 150Needle Plots . . . . . . . . . . . . . . . . . . . . . . . . . . . . . . . . . . . . . . . . . . . . . . . . . . . . . . 150Box Plots . . . . . . . . . . . . . . . . . . . . . . . . . . . . . . . . . . . . . . . . . . . . . . . . . . . . . . . . . 151Bar Lines . . . . . . . . . . . . . . . . . . . . . . . . . . . . . . . . . . . . . . . . . . . . . . . . . . . . . . . . . 151Bar Charts . . . . . . . . . . . . . . . . . . . . . . . . . . . . . . . . . . . . . . . . . . . . . . . . . . . . . . . . 151List Data . . . . . . . . . . . . . . . . . . . . . . . . . . . . . . . . . . . . . . . . . . . . . . . . . . . . . . . . . 151
About Reporting Standards for SAS IT ResourceManagement Reports
SAS IT Resource Management uses several reporting standards to design and specify theproperties for various report types. These conventions provide a consistency in the lookof SAS IT Resource Management reports while espousing best practices for rendering ITreports. The reports that SAS IT Resource Management supplies include the types ofreporting standards:
• standards for report elements
• standard specifications for report tasks
For best results, if you choose to create or edit your own IT reports, then use the samereporting standards that SAS IT Resource Management uses for consistency andefficiency.
145

Standards for SAS IT Resource ManagementReport Elements
TitlesMany reports have the following two titles:
• Title1 shows the report metrics.
• Title2 provides information about the level of data that is being reported.
Note: The BY line and the axis of the report also help the report viewer to determinethe level of data that is being reported.
The following figure provides an example of Title1 and Title2 in a SAS IT ResourceManagement report with a BY Line.
Figure A2.1 Titles and BY Line in a SAS IT Resource Management Report
The following table provides information about how Title2 standards map to theaggregation level for the report.
Job Title2 Sample Aggregation Level
Day Job Intervals for the Day Detail
Hours for the Day DayHour
Hours for last 3 Days DayHour
Hours for last 7 Days DayHour
Shifts for the Day DayShift
For the Day Day
146 Appendix 2 • Reporting Standards for SAS IT Resource Management Reports

Job Title2 Sample Aggregation Level
Week Job Daily Hours for the Week DayHour
Daily Peak Hours for the Week DayHour
Daily Shifts for the Week DayShift
Days for the Week Day
Days for last 4 Weeks Day
Weekly Hours for last 4 Weeks WeekHour
Weekly Hours for the Week WeekHour
By Shift and Week WeekShift
For the Week Week
By Week Week
Month Job Daily Hours for the Month DayHour
Daily Peak Hours for the Month DayHour
Daily Shifts for the Month DayShift
Days for the Month Day
Days for last 2 Months Day
Monthly Hours for the Month MonthHour
Monthly Hours for last 3 Months MonthHour
By Shift and Month MonthShift
For the Month Month
By Month Month
FootnotesUse a footnote to indicate that a filter was used to subset the report data. Here are someexamples:
• Server with high CpuBusyPctWMean for the day
• Server with high CpuBusyPctWMean for the week
• Server with high CpuBusyPctWMean for the month
• Server with high CpuBusyPctWMean for one or more days
Standards for SAS IT Resource Management Report Elements 147

• Servers with highest CpuBusyPctWMean for the day
• Servers with highest CpuBusyPctWMean for one or more days
Use the following default as the second line of the footnote:
Generated on %TRIM(%QSYSFUNC(DATE(), NLDATE20.)) at %SYSFUNC(TIME(), NLTIMAP20.)
The following figure provides an example of a footnote in a SAS IT ResourceManagement report.
Display A2.1 Footnote in a SAS IT Resource Management Report
AxisTo imitate the axis standards for SAS IT Resource Management reports, implement thefollowing specifications:
• Specify a generic axis label for reports that contain legends, when you are plottingmultiple statistics, or when the default labels on the axis are ambiguous.
• Turn off minor tick marks.
• For reports with hour on the horizontal axis, use 0 to 23 by 1.
• For reports with hour on the vertical axis, use 0 to 24 by 2.
• For reports with time on the horizontal axis, use “00:00”t to “24:00”t by“02:00”t.
• For reports with percentages on the vertical axis, use 0 to 100 by 20.
ColorsA template named ITRMDefault is used for default colors in SAS IT ResourceManagement reports. However, most reports do not require that colors be specifiedexplicitly in the report task.
Most of the colors that are defined in the ITRMDefault template were selected fromthe autumn color scheme and from a set of the SAS Enterprise Guide window defaultcolors.
If you want to specify a color in a report task, the following colors (in SAS EnterpriseGuide) complement the colors in the ITRMDefault template:
• blue gray
• dark yellow
• light orange
• teal
• pale blue
• lavender
• tan
148 Appendix 2 • Reporting Standards for SAS IT Resource Management Reports

• gold
• light yellow
• lime
• light green
Use black for needle plots that include a symbol for a standard deviation metric.
Group BYBe consistent with the placement of BY variables in your reports. SAS IT ResourceManagement reports use the following order to place BY variables in reports:
1. date, if used
2. date-related ID columns such as DayOfWeek
3. other classification columns
Reference LinesTo imitate the reference line standards for SAS IT Resource Management reports,implement the following specifications:
• Use reference lines when possible.
• When plotting two metrics on the left and right axis, use a reference line for the mostimportant metric that is plotted on the left vertical axis.
• Use values 20, 40, 60, 80 and 100 when using a reference line for a percent metric.
• Do not specify values when using reference lines if you do not know the minimumand maximum values for the metric.
• Use the style Dashed.
• Use the color Gray - 25%.
• Include a footnote about the reference if needed.
FontsSAS IT Resource Management reports use the default fonts for SAS Enterprise Guide.
FormatsSAS IT Resource Management reports use the default formats that are inherited fromtheir aggregation tables or information maps.
SymbolsTo imitate the symbols standards for SAS IT Resource Management reports, implementthe following specifications:
• Use the dot symbol with size 8.
• Use the triangle symbol when plotting a standard deviation statistic.
• Use symbols when they do not overcrowd the graph.
Standards for SAS IT Resource Management Report Elements 149

Standard Specifications for Report Tasks
Line PlotsTo imitate the standards for SAS IT Resource Management line plots, implement thefollowing specifications:
• Use line width of 3.
• Break the plot line at missing values.
• Use the symbol dot with size 8 when plotting a small number of points.
2XY PlotsTo imitate the standards for SAS IT Resource Management 2XY plots, implement thefollowing specifications:
• Use a standard line plot, not an overlay.
• Plot the most important variable on the left. If both variables are important, plotpercent variables on the left.
• Specify a corresponding color in the task for the labels of axis variables, ifappropriate.
Needle PlotsTo imitate the standards for SAS IT Resource Management needle plots, implement thefollowing specifications:
• Use needle plots when you want to plot two or three statistics of a single metric.
• Do not use needle plots if you expect a small number of points, such as in a currentweek report that can have as few as one point on the first day of the week.
Needle plots are used in the following two formats: One that shows two statistics andone that shows three:
• needle plots that show two statistics.
For the reports that show two statistics, use the following guidelines:
• Both statistics should be needle lines with a size of 12 to 16.
• The size should be as large as possible without bleeding onto the axis line.
• The variable with the larger number should always be first. The variable with thesmaller number should be second. For example, Maximum is always larger thanor equal to Mean, which is equal to or larger than Minimum.
• needle plots that show three statistics.
For reports that show three statistics, use the following guidelines:
• The two most important statistics should be needle lines with a size of 12 to 16.
• The size should be as large as possible without bleeding onto the axis line.
150 Appendix 2 • Reporting Standards for SAS IT Resource Management Reports

• The statistic with the larger number should be first. The smaller statistics shouldbe second. The third statistic, such as the standard deviation, should have aninterpolation of scatter. For example, Maximum is always larger than or equal toMean, which is equal to or larger than Minimum.
• Use the dot symbol when plotting a standard deviation. The dot should be blackand size 9 to 12. The dot symbol should be narrower than the needle width.
Box PlotsTo imitate the standards for SAS IT Resource Management box plots, implement thefollowing specifications:
• Use extreme high and low for the whisker length percentile.
• Specify the color in the task to be light orange.
Bar LinesTo imitate the standards for SAS IT Resource Management bar lines, implement thefollowing specifications:
• Use bar lines when you want to plot two statistics of a single metric or of twodifferent metrics, where the bar is the most important statistic or metric.
• Specify complementary colors in the task for the variable labels because a legend isnot available.
• Chart the most important statistic or the percent statistic on the left hand side, ifpossible.
• Verify the statistic that is used in the advanced window.
• Use line width of 3.
• Use the symbol dot with a size of 8.
Bar ChartsTo imitate the standards for SAS IT Resource Management bar charts, implement thefollowing specifications:
• Chart one bar for each discrete variable.
• When the bar chart has a subgroup or is an interleave bar chart, you can add code tothe task to include a legend. Use the insert code feature to add the code.
List DataTo imitate the standards for a SAS IT Resource Management data list, modify the labelsto add spaces between capitalized words. This ensures that the header row of the HTMLpage can wrap and that the columns can resize as you enlarge and shrink the HTMLpage.
Standard Specifications for Report Tasks 151

152 Appendix 2 • Reporting Standards for SAS IT Resource Management Reports
Appendix 3
Troubleshooting and DebuggingTips
Invalid User ID or Password Error Message Is Received . . . . . . . . . . . . . . . . . . . . 153
Invalid User ID and Password Embedded in Generated Code of Report Jobs . . 153
Backing Up Reports . . . . . . . . . . . . . . . . . . . . . . . . . . . . . . . . . . . . . . . . . . . . . . . . . . 154
Duplicate Reports Are Stored on the SAS Content Server . . . . . . . . . . . . . . . . . . . 154
Why Are Reports Missing from the Gallery Manager? . . . . . . . . . . . . . . . . . . . . . 155
Why Report Jobs Are Not Generating Reports . . . . . . . . . . . . . . . . . . . . . . . . . . . . 155Overview of Report Jobs Not Generating Reports . . . . . . . . . . . . . . . . . . . . . . . . . 155Possible Causes of Missing Data . . . . . . . . . . . . . . . . . . . . . . . . . . . . . . . . . . . . . . 156How to Determine Why Data Is Missing . . . . . . . . . . . . . . . . . . . . . . . . . . . . . . . . 156
Error Message: Select a SAS Content Server . . . . . . . . . . . . . . . . . . . . . . . . . . . . . 157
How to Debug a Middle-tier Connection Problem in a Report Job . . . . . . . . . . . . 158
How to Access Gallery Manager Reports in the SAS Content Server . . . . . . . . . . 159
How to Refresh the Cache for Gallery Manager Reports . . . . . . . . . . . . . . . . . . . . 160
Technical Support . . . . . . . . . . . . . . . . . . . . . . . . . . . . . . . . . . . . . . . . . . . . . . . . . . . . 160
Invalid User ID or Password Error Message IsReceived
To correct this problem, verify that the user has permission to access the metadataserver, the SAS Content Server and the Gallery Manager. If the user’s password wasrecently changed, then the report job might need to be redeployed. For information abouthow to specify a user ID and password, see “Invalid User ID and Password Embedded inGenerated Code of Report Jobs”.
Invalid User ID and Password Embedded inGenerated Code of Report Jobs
The SAS IT Resource Management Gallery Transformation embeds the metadata serveruser ID and encoded password of the SAS Data Integration Studio user into thegenerated code that is produced for inclusion in the report jobs. If the user ID or
153

password is changed, then the generated code must change for all of the correspondingjobs.
There are two ways to handle this issue:
1. Redeploy the jobs with the updated credentials. To do so, perform the followingsteps:
a. Open the SAS IT Resource Management client with the correct credentials.
b. Redeploy the reporting jobs. The newly deployed jobs will have the correctcredentials.
2. Use an autoexec file to set the user ID and password. To do so, perform thefollowing steps:
a. Add the following statements to the autoexec file for the deployed jobs:
%global metauser metapass;%let metauser=<userid>;%let metapass=<password>;
Note: The password can be entered in open text or can be encoded using thePWENCODE procedure.
b. If the deployed jobs are being run with the batch server, then add this code to theautoexec_usermods.sas file for the batch server.
c. If the jobs are being run with native SAS (using the SAS command or ininteractive SAS), then create an autoexec file that contains the preceding codeand use the –autoexec option.
For more information about the configuration file and how autoexec files should be setup so that they can be located by SAS, see the SAS documentation for your operatingenvironment.
Backing Up ReportsTo back up your SAS IT Resource Management reports, you must back up the SASContent Server that stores the reports. For more information about backing up reports,see Appendix 10, “Best Practices and Troubleshooting Tips” in the SAS IT ResourceManagement: Administrator's Guide.
Duplicate Reports Are Stored on the SAS ContentServer
If you rerun a report job multiple times in a day without processing additional days ofdata in between, then the report job generates multiple instances of the same reports onthe SAS Content Server. These reports remain on the SAS Content Server until theyexpire and the corresponding report job is rerun.
To eliminate duplicate reports from the SAS Content Server, you can perform one of thefollowing tasks:
• Allow the duplicate reports to expire as you continue to run the report job that addedthem.
154 Appendix 3 • Troubleshooting and Debugging Tips

• Remove the reports manually by using the SAS Content Server AdministratorConsole. For more information, see the chapter about administering the SAS ContentServer in the SAS 9.2 Intelligence Platform: Web Application Administration Guide.
Note: Update the cache after deleting reports from the SAS Content Server.Forinformation about how to do this, see “How to Refresh the Cache for GalleryManager Reports” on page 160.
• Override the expiration date by using the Gallery transformation and rerunning thejob. Use caution when implementing this option. Depending on your settings, thisimplementation can delete duplicates as well as all previous versions of the reportthat were created by the report job.
Why Are Reports Missing from the GalleryManager?
Gallery Manager maintains an internal index or cache of the reports that are stored onthe SAS Content Server. In some cases, you might not be able to see new reports if theGallery Manager cache has not yet been updated. In other cases, you might see a 404error message for reports that have been deleted if the Gallery Manager cache has not yetbeen updated.
To force an update of the cache, see “How to Refresh the Cache for Gallery ManagerReports” on page 160.
T I P For best results, make sure that the cache update is invoked when users are notlogged on to Gallery Manager.
If you notice that reports are still missing from the gallery manager after you update thecache, see “Why Report Jobs Are Not Generating Reports”.
Why Report Jobs Are Not Generating Reports
Overview of Report Jobs Not Generating ReportsIf your report jobs are not generating reports, the following conditions might need to beresolved.
• You might be experiencing a problem with your middle-tier connection. Forinformation about how to correct this problem, see “How to Debug a Middle-tierConnection Problem in a Report Job” on page 158.
Note: If your server and network are experiencing problems, make sure thoseproblems are resolved before you rerun the report job.
• An information map might have been moved. To resolve this problem, make surethat the information maps that are used by the report job are accessible and arereferencing the correct data source.
To locate the information map, review the report job log and find the reportdefinition that is associated with the first error. Search backward in the log until youfind the following textual string:
Why Report Jobs Are Not Generating Reports 155

--- Report: ReportDefinitionNameHere
Continue searching backward until you find the source code for the report definition.The source code of the report definition identifies the information map that is thedata source for this report definition. The source code begins with the comment:
/*---- Report: ReportDefinitionNameHere ----*/
• Data that is required by the report is missing from the data source. To resolve thisproblem, see “Possible Causes of Missing Data”.
Possible Causes of Missing DataWarnings or error messages in your SAS log can help determine why your report jobsfail to generate reports. Any one of the following three scenarios can produce a warningor an error message in the SAS log. To determine which of these scenarios is responsiblefor causing the problem, see “How to Determine Why Data Is Missing” on page 156.
Note: The SAS/GRAPH procedure that was invoked in the report job determineswhether an error message or a warning is produced.
• A report definition is using an information map with a filter that subsets data thatdoes not yet exist.
Most of the report definitions that SAS IT Resource Management supplies useinformation map filters to subset the data for reporting. In some cases, the filtersresult in missing data and some SAS/GRAPH procedures generate warnings or errorsthat can be prevented only by rerunning the report when data is available.
For example, most report definitions that are designed to run on a weekly basis aredesigned to run at the beginning of the week for the previous full week. When the ITdata mart does not contain any data for the previous week, the report definition doesnot produce any reports. The same is true for monthly reports. Most monthly reportsare designed to be run at the beginning of a month for the previous month. In thesecases, you should wait until the IT data mart contains the data for the designated timeperiod before scheduling the job.
• A report definition is using a filter that always results in missing data for a particularreport.
In this case, you might need to update or eliminate the filter to ensure that data isavailable for a specific report definition.
• A report definition reports on a specific metric that is not be collected at a particularsite.
In this case, you should modify the report to use a metric that is available oreliminate the report definition from their report job.
How to Determine Why Data Is MissingWarnings or error messages that are written to your SAS log can help you resolve whydata is missing. To locate the problem, perform the following steps.
1. Review the report job log and find the report definition that is associated with thefirst error. Search backward in the log until you find the following textual string:
--- Report: ReportDefinitionNameHere
156 Appendix 3 • Troubleshooting and Debugging Tips

2. If you find data in the aggregation table for the data items that are used by the reportdefinition, you need to determine whether an information map filter is responsiblefor the absence of data. To do so, perform the following actions:
a. Find the supplied project, process flow and gallery task that was used to createthe report definition.
You can find this information in the SAS log. Continue searching backward untilyou find the source code for the report definition. The source code begins withthe comment:
/*---- Report: ReportDefinitionNameHere ----*/
b. Using a copy of the supplied project, connect to your data source.
Note: You might need to use the migration wizard if the project was notpreviously used to connect to the data source.
For information about this wizard, see the “Migrating SAS Enterprise GuideProjects to Work with SAS IT Resource Management 3.2” topic in Chapter 2,“Preparing to Work with the SAS IT Resource Management Client” in the SASIT Resource Management 3.2: Administrator’s Guide.
c. In SAS Enterprise Guide, run the branch that includes the report definition thatcaused the warning or error.
If you see the same warning or error, then open the data source that is used in thereport task that caused the warning or error.
d. If the data source is empty, you need to determine whether a filter is causing thedata to be missing. To do so, modify the information map, remove all filters, andrerun the information map and the report task. Check the resulting output to seewhether the data is now present in the data set.
e. If eliminating the filter solves the problem, then you need to determine whetherone or more of the filters should be eliminated, whether the filter expressionshould be modified, or whether additional dates of data must be processed.
f. If eliminating the filter still produces no data, then determine whether themeasure is not being processed and make necessary adjustments to the reportdefinition. For example, use another measure or eliminate the report definitionfrom the report job.
g. Make any required changes. Then, create a user-defined report definition, updatethe report job to use the new report definition, and redeploy the report job.
Error Message: Select a SAS Content ServerWhen a report job runs, it creates reports and stores reports on the SAS Content Server.If a copy of a report job is made, and an attempt is made to open the copy of the reportjob, the following error message is displayed: Select a SAS content server.
Note: The error can also occur for a report job of a data mart that is imported.
The message is issued because the association to a valid SAS Content Server is lost. Tocorrect this situation, perform the following steps:
1. Double-click the new job to open it in the Diagram tab of the Job Editor.
2. Right-click the Gallery transformation in the process flow and select the Server tab.
Error Message: Select a SAS Content Server 157
3. Specify the name and location of the SAS Content Server for the Gallerytransformation.
4. Click OK and save the job.
How to Debug a Middle-tier Connection Problemin a Report Job
CAUTION:The command to restart services should be issued only with the approval of anITRM administrator. Everyone using Gallery Manager might be affected by thisaction.
If your report job shows an error that appears to be related to a middle-tier connectionproblem, verify that the SAS Content Server and the Gallery Manager are available. Todo so, perform these two steps:
1. Connect to the SAS Content Server Administrative Console at http://<YourMiddle-TierName>:<port number>/SASContentServer/dircontents.jsp?path=/sasdav. If you are not able to connect to the SASContent Server Administrative Console, restart the SAS Remote Services, the SASContent Server service, and the Gallery Manager services.
2. Logon to Gallery Manager at http://<YourMiddle-TierName>:<portnumber>/SASLogon/index.jsp?_sasapp=ITRM+Gallery+Manager+3.2&. If you are not able to connect toGallery Manager, then restart the Gallery Manager service.
If you had to restart any services, then rerun the report job. If you continue to see thesame middle-tier connection errors after restarting the middle-tier connection services,then follow the steps below to continue debugging the middle tier using a small,temporary report job.
Then run the jobs, save the logs, and contact the SAS Technical Support Division. Forinformation about how to do so, see “Technical Support” on page 160.
If after restarting any services, you encounter a different type of error, then see “WhyReport Jobs Are Not Generating Reports” on page 155.
1. In the SAS IT Resource Management client, open your IT data mart. Then navigateto the folder that contains the report job that caused the error.
2. Create a new report job in the same folder. Add any report definition from theoriginal job.
3. Click the Code tab in the Job Editor. Click Code generation mode and select Userwritten body.
158 Appendix 3 • Troubleshooting and Debugging Tips

Display A3.1 Select the Code Generation Mode
4. Search through the SAS log for the following text:
/* setup */%global ITRMErr;%global ITRMDebug;%global ITRMNoWebdavUpdate;
Add the following debugging statements after the previous %globalITRMNoWebdavUpdate; code.
/* Add debugging statement */%let ITRMDebug=1;/* Disable Gallery Manager communications */%let ITRMNoWebdavUpdate=1;
Then, run the report job. Save the log.
5. Run the report job a second time with the following set of debugging statements:
/* Add debugging statement */%let ITRMDebug=1;/* Enable Gallery Manager communications */%let ITRMNoWebdavUpdate=0;
6. Save the log and contact the SAS Technical Support Division. For information abouthow to do so, see “Technical Support” on page 160.
How to Access Gallery Manager Reports in theSAS Content Server
Gallery Manager maintains an internal index or cache of the SAS IT ResourceManagement reports that are stored on the SAS Content Server. You can access the
How to Access Gallery Manager Reports in the SAS Content Server 159

reports on the cache from the SAS Content Server Admin Console, which is located athttp://<YourMiddle-TierName>:<port number>/SASContentServer/dircontents.jsp?path=/sasdav/ITRM.
If you remove reports manually from the SAS Content Server, be sure to refresh thecache.
How to Refresh the Cache for Gallery ManagerReports
CAUTION:The command to refresh the cache should be issued only with the approval ofan ITRM administrator. Refreshing the cache affects everyone using GalleryManager. Make sure that this command is invoked when users are not logged on toGallery Manager.
If you remove reports manually from the SAS Content Server, be sure to refresh thecache. To perform this task, enter http://<YourMiddle-TierName>:<portnumber>/ITRMGalleryManager/WebdavUpdate.do?job=job1&status=COMPLETED in the address field of your Web browser and pressENTER.
Note: For more information, see the chapter about administering the SAS ContentServer in the SAS 9.2 Intelligence Platform: Web Application Administration Guide.
Technical Support• If you need assistance with the software, we ask that only the on-site SAS support
personnel call our Technical Support Division. For U.S. and Canadian customers,support is provided from our corporate headquarters in Cary, North Carolina. Youcan call (919) 677‐8008, Monday through Friday. Customers outside of the U.S. canobtain local‐language technical support through the local office in their countries.Customers in these locations should contact their local office for specific supporthours. See http://support.sas.com/techsup/contact/index.html forcontact information for local offices.
• Before calling, you might want to explore the SAS Institute Technical Support Website at http://support.sas.com/techsup/. The Technical Support Web siteoffers a Knowledge Base, FAQs, Technical Support Documents and more that cananswer your questions. This Web site also provides a mechanism for reportingproblems.
160 Appendix 3 • Troubleshooting and Debugging Tips

Appendix 4
Best Practices
Run Report Jobs at Night or during Low Usage Periods . . . . . . . . . . . . . . . . . . . . 161
Limit the Reports That the Filters Can Retrieve When Creating a Gallery . . . . 161
Managing SAS Enterprise Guide Projects for SAS IT Resource Management . . 162About SAS Enterprise Guide Projects for SAS IT Resource Management . . . . . . 162Maintain SAS Enterprise Guide Projects for SAS IT Resource Management . . . . 163
Designing Reports for Batch Jobs . . . . . . . . . . . . . . . . . . . . . . . . . . . . . . . . . . . . . . . 165
Create Tile Charts with Web Links . . . . . . . . . . . . . . . . . . . . . . . . . . . . . . . . . . . . . 166
Override Report Expiration Dates to Purge Reports from theSAS Content Server . . . . . . . . . . . . . . . . . . . . . . . . . . . . . . . . . . . . . . . . . . . . . . . . . . 166
Back Up Your Data and Reports . . . . . . . . . . . . . . . . . . . . . . . . . . . . . . . . . . . . . . . 166
Schedule Report Jobs Based on the Available Data . . . . . . . . . . . . . . . . . . . . . . . . 167
Run Report Jobs at Night or during Low UsagePeriods
The beginning and end of SAS IT Resource Management reporting code includes a flagto inform Gallery Manager that the report job has started and ended. If you run multiplejobs during the day while you are also working with the Gallery Manager, the report jobruns might overlap and the subsequent Gallery Manager cache updates can be delayed asthey overlap.
For best results, run multiple report jobs at night or when there is little activity on theGallery Manager. This ensures that there is little or no overlap of separate report jobsrunning, which can delay the update of the cache.
Note: Run your report jobs only after the corresponding aggregation jobs are complete.
Limit the Reports That the Filters Can RetrieveWhen Creating a Gallery
When you create a gallery in Gallery Manager, you use primary and secondary filters tosubset the reports that are on the SAS Content Server. By default, primary filters must
161
reduce the number of reports to no more than 4,000 before you can continue with thenext step to subset the reports further with secondary filters. Secondary filters mustreduce the number of reports to no more than 2,000 before you can finish creating thegallery.
The default limits are specified to help manage the size of galleries and avoidunnecessarily large report sets that make it difficult to locate specific reports. However,you can specify the default limits to meet the needs of your organization if you needlarger or smaller galleries.
To specify your own default limits, perform the following steps:
1. Open SAS Management Console with administrator login credentials.
2. On the Plug-ins tab, expand Application Management ð Configuration Manager.
Note: The Configuration Manager is installed as part of the SAS Web InfrastructureClient. If you do not see this plug-in in SAS Management Console, then you caninstall it in the Software Deployment Wizard by selecting Install AdditionalSoftware and selecting the SAS Web Infrastructure Client.
3. Right-click ITRM Gallery Manager 3.2 and select Properties.
4. On the Advanced tab, specify the following parameters:
• itrmgm.PrimaryRptCnt specifies the limit for primary filters.
• itrmgm.SecondaryRptCnt specifies the limit for secondary filters.
Managing SAS Enterprise Guide Projects for SASIT Resource Management
About SAS Enterprise Guide Projects for SAS IT ResourceManagement
The reports that are available from Gallery Manager and used for the purposes ofperformance management and capacity planning have their beginnings in SASEnterprise Guide projects. These projects and their tasks produce reports that must bemanaged to ensure the integrity of the operational reporting environment for SAS ITResource Management.
SAS makes the following recommendations as best practices for managing the SASEnterprise Guide projects that SAS IT Resource Management provides at installation.These best practices assume that the SAS Enterprise Guide projects are maintained byseveral people referred to as “report developers” in this appendix.
The best practices described here provide suggestions for managing the following twosources of SAS Enterprise Guide projects:
supplied projectsSupplied projects, also called supplied SAS Enterprise Guide projects, are deliveredwith the SAS IT Resource Management solution. These projects are installed on eachclient machine to which SAS Enterprise Guide is deployed during the installation ofSAS IT Resource Management. These projects are made available in the <SASinstall location>\SAS\ITRMEG\3.2 folder (such as c:\Program Files\SAS\ITRMEG\3.2).
162 Appendix 4 • Best Practices
Supplied projects are assumed to be owned and managed by SAS. When updates tothe SAS IT Resource Management solution are released, the entire contents of thisfolder might be overwritten to deliver product enhancements.
user projectsUser projects are those SAS Enterprise Guide projects that are created by users of theSAS IT Resource Management solution and stored in a location other than that of thesupplied projects. A suggested folder is <SAS install location>\SAS\ITRMEG\3.2\User (such as c:\Program Files\SAS\ITRMEG\3.2\User).
The report definitions that are created by these SAS Enterprise Guide projects differ inthe following ways:
• Supplied report definitions that are delivered with the SAS IT Resource Managementsolution are written to the SAS Metadata Server and are stored in folders such asShared Data/SAS IT Resource Management/3.2 IT ReportDefinitions/<Adapter Name>/Supplied/<Time Period>.
• User report definitions that a generated from user projects should be written to alocation other than that of the supplied report definitions. A suggested location is /Shared Data/SAS IT Resource Management/3.2 IT ReportDefinitions/<Adapter Name>/User Defined/<Time Period>.
Note: As SAS releases updates to supplied SAS Enterprise Guide projects andcorresponding report definitions, you can run the jobs that the Adapter Setup wizardgenerates and view the report output in Gallery Manger. Any updates that SASdelivers can be incorporated into your production reporting jobs by executing thebest practices that are described in the following topic.
Maintain SAS Enterprise Guide Projects for SAS IT ResourceManagement
The following steps are recommended to maintain the SAS Enterprise Guide projectsthat SAS IT Resource Management uses.
1. Identify all SAS Enterprise Guide projects that are used to produce reports from theoperational SAS IT Resource Management System. You can obtain this informationfrom Gallery Manager by viewing the report properties of each report after the reportjobs are run.
2. Make copies of the supplied SAS Enterprise Guide projects and establish a set ofmaster SAS Enterprise Guide projects for your site. Store these master copies of theprojects in a location that is accessible by all report developers.
3. Use the Migration Wizard for SAS Enterprise Guide to update the mapping to theinformation map or SAS table that serves as the source data for the report. For moreinformation, see “Preparing to Work with SAS Enterprise Guide” on page 49.
4. Use any method of version control to manage a set of master SAS Enterprise Guideprojects. All report developers can use the master copies to make their own copies ofthe projects and publish their results after they have implemented and promotedchanges to the report definitions that they produce.
5. Report developers perform the following steps when working with a SAS EnterpriseGuide project:
a. Check out a copy of a master SAS Enterprise Guide project.
b. In SAS Enterprise Guide, select File ð New ð Notes to create a version notesfile of the project. If a notes file already exists, then open the existing file.
Managing SAS Enterprise Guide Projects for SAS IT Resource Management 163

c. Add the following entries to this notes file:
• Project Updated By
• Date of Changes
• Tasks Modified
6. Implement and validate changes to the process flows and report tasks in the project.
7. Perform the following steps to publish new report definitions to the SAS MetadataServer:
Note: The suggested path for new report definitions is /Shared Data/SAS ITResource Management/3.2 IT Report Definitions/<AdapterName>/User Defined/<Time Period>.
a. Right-click an ITRM Gallery task and select Modify <ITRM Gallery taskname>.
b. Click Next to navigate through the ITRM Gallery task wizard until the last pageappears.
c. Click Finish. The new report definition is created and published to the SASMetadata Server.
8. Save, close, and check-in the SAS Enterprise Guide project.
9. If the change to the project resulted in an update to a report definition that alreadyexisted in metadata and was used in a Gallery transformation in a report job, thenperform the following steps:
a. Open the SAS IT Resource Management client.
b. Use the IT Data Marts tree to navigate to the report job in the appropriate IT datamart, adapter, and domain category folders.
c. Open the report job.
d. Right-click the Gallery transformation and select Properties.
e. Select the Notes tab and add the following entries to the notes:
• Transformation Updated By
• Date of Changes
• Report Definition Changes (such as Updated: <report definition name>
10. If the change involved the creation of a new report definition, then perform thefollowing steps:
a. Open the SAS IT Resource Management client.
b. Use the IT Data Marts tree to navigate to the report job that will deploy the newreport definition. The report job is in the corresponding IT data mart, adapter,and domain category folders.
c. Open the report job.
d. Right-click the Gallery transformation and select Properties.
e. Select the Report Definitions tab and add the report definition as needed.
f. Select the Notes tab and add the following entries to the notes:
• Transformation Updated By
• Date of Changes
164 Appendix 4 • Best Practices

• Report Definition Changes (such as Added: <report definition name> orDeleted: <report definition name>
11. If your changes included replacing a report definition, then perform the followingsteps:
a. Open the SAS IT Resource Management client.
b. Use the IT Data Marts tree to navigate to the report job that contains the reportdefinition to be deleted. The report job is in the corresponding IT data mart,adapter, and domain category folders.
c. Open the report job.
d. Right-click the Gallery transformation and select Properties.
e. Select the Report Definitions tab and delete the report definition as needed.
f. Select the Notes tab and add the following entries to the notes:
• Transformation Updated By
• Date of Changes
• Report Definition Changes (such as Deleted: <report definition name>)
12. Save and close the Gallery transformation.
13. Deploy the new report job.
14. Close the SAS IT Resource Management client.
Designing Reports for Batch JobsWhen you design reports and create a report definition that will run in a batch job,consider the following questions:
• Is the report definition intended to run in a daily, weekly, or monthly job?
• How long do you want to keep the generated report in the SAS Content Server?
Based on your answers to these questions, specify the appropriate values in the ITRMGallery task.
For example, if you design a report that should run daily and replace the previousversion in the SAS Content Server, then specify the following values in the ITRMGallery task:
• On Page 1 of the ITRM Gallery task, specify a path for the report definition thatincludes the subfolders User Defined and Day.
• On Page 2 of the ITRM Gallery task, specify the following values:
• Select Daily in the Job Schedule Frequency field.
• Specify a value of 1 for the Expire Reports After field.
Specifying these values help you find daily report definitions when creating report jobs.These values in the report definition also help you find the desired reports when viewingthem with Gallery Manager.
Designing Reports for Batch Jobs 165

Create Tile Charts with Web LinksThe Tile Chart task in SAS Enterprise Guide supports Web links. However, when youspecify the URL for a Web link, you must use a known location for the root URL.
For example, if your root URL is http://www.MySite/BaseLineReports/, thenthe following URLs are valid Web link URLs:
• http://www.MySite/BaseLineReports/{&1}
• http://www.MySite/BaseLineReports/{&2}
• http://www.MySite/BaseLineReports/{&1}/{&2}
Override Report Expiration Dates to PurgeReports from the SAS Content Server
By default, report jobs generate reports and purge expired versions of the same reports.You can use the Gallery transformation in report jobs to override report expiration datesand remove all previous versions of reports in the SAS Content Server.
To override report expiration dates for all reports in a report job, perform the followingsteps:
1. Open the report job for the reports that you want to purge.
2. Open the appropriate Gallery transformation.
3. On the Report Parameters tab, select Delete report content that is older thanspecified days: and specify the value as 1.
4. Save and close the report job.
5. Redeploy the report job.
The next time the report job runs, it generates a new version of the reports and removeall reports that are more than one day old.
Back Up Your Data and ReportsFor more information about backing up your data and reports, see Appendix 10, “BestPractices and Troubleshooting Tips” in the SAS IT Resource Management:Administrator's Guide.
166 Appendix 4 • Best Practices

Schedule Report Jobs Based on the AvailableData
Before you run report jobs, ensure that the available data in your IT data mart issufficient and complete for the type of report job that you want to run. Here are somerecommendations to ensure that you have an appropriate set of available data to runvarious report jobs:
• Ensure that the aggregation jobs that a report job depends on has executed andcompleted.
• Schedule weekly report jobs to run at the beginning of the week to generate reportsfor the previous week.
• Schedule monthly report jobs to run at the beginning of the month to generate reportsfor the previous month.
• Ensure that you have data in your data mart for the last week and the last monthbefore you schedule weekly and monthly jobs.
Schedule Report Jobs Based on the Available Data 167

168 Appendix 4 • Best Practices

Appendix 5
Report Conversion Guide
Converting Reports . . . . . . . . . . . . . . . . . . . . . . . . . . . . . . . . . . . . . . . . . . . . . . . . . . 170About Converting Reports . . . . . . . . . . . . . . . . . . . . . . . . . . . . . . . . . . . . . . . . . . . 170Global and Individual Report Tasks and Options . . . . . . . . . . . . . . . . . . . . . . . . . . 172Stack Columns Task (Reference 1) . . . . . . . . . . . . . . . . . . . . . . . . . . . . . . . . . . . . 174Custom User Code to Accumulate Stacked Data (Reference 2) . . . . . . . . . . . . . . 175
Creating Bar and Pie Charts Using SAS Enterprise Guide . . . . . . . . . . . . . . . . . . 177About Bar and Pie Charts . . . . . . . . . . . . . . . . . . . . . . . . . . . . . . . . . . . . . . . . . . . . 177Bar Chart and Pie Chart Notes . . . . . . . . . . . . . . . . . . . . . . . . . . . . . . . . . . . . . . . . 178Example 1 . . . . . . . . . . . . . . . . . . . . . . . . . . . . . . . . . . . . . . . . . . . . . . . . . . . . . . . . 180Example 2 . . . . . . . . . . . . . . . . . . . . . . . . . . . . . . . . . . . . . . . . . . . . . . . . . . . . . . . . 181Example 3 . . . . . . . . . . . . . . . . . . . . . . . . . . . . . . . . . . . . . . . . . . . . . . . . . . . . . . . . 182Example 4 . . . . . . . . . . . . . . . . . . . . . . . . . . . . . . . . . . . . . . . . . . . . . . . . . . . . . . . . 183Example 5 . . . . . . . . . . . . . . . . . . . . . . . . . . . . . . . . . . . . . . . . . . . . . . . . . . . . . . . . 184Example 6 . . . . . . . . . . . . . . . . . . . . . . . . . . . . . . . . . . . . . . . . . . . . . . . . . . . . . . . . 185Example 7 . . . . . . . . . . . . . . . . . . . . . . . . . . . . . . . . . . . . . . . . . . . . . . . . . . . . . . . . 186Example 8 . . . . . . . . . . . . . . . . . . . . . . . . . . . . . . . . . . . . . . . . . . . . . . . . . . . . . . . . 187Example 9 . . . . . . . . . . . . . . . . . . . . . . . . . . . . . . . . . . . . . . . . . . . . . . . . . . . . . . . . 188
Creating Line and Other Plots Using SAS Enterprise Guide . . . . . . . . . . . . . . . . . 189About Line and Other Plots . . . . . . . . . . . . . . . . . . . . . . . . . . . . . . . . . . . . . . . . . . 189Line and Other Plot Notes . . . . . . . . . . . . . . . . . . . . . . . . . . . . . . . . . . . . . . . . . . . 190Example 10 . . . . . . . . . . . . . . . . . . . . . . . . . . . . . . . . . . . . . . . . . . . . . . . . . . . . . . . 191Example 11 . . . . . . . . . . . . . . . . . . . . . . . . . . . . . . . . . . . . . . . . . . . . . . . . . . . . . . . 192Example 12 . . . . . . . . . . . . . . . . . . . . . . . . . . . . . . . . . . . . . . . . . . . . . . . . . . . . . . . 193Example 13 . . . . . . . . . . . . . . . . . . . . . . . . . . . . . . . . . . . . . . . . . . . . . . . . . . . . . . . 194Example 14 . . . . . . . . . . . . . . . . . . . . . . . . . . . . . . . . . . . . . . . . . . . . . . . . . . . . . . . 195Example 15 . . . . . . . . . . . . . . . . . . . . . . . . . . . . . . . . . . . . . . . . . . . . . . . . . . . . . . . 196Example 16 . . . . . . . . . . . . . . . . . . . . . . . . . . . . . . . . . . . . . . . . . . . . . . . . . . . . . . . 197Example 17 . . . . . . . . . . . . . . . . . . . . . . . . . . . . . . . . . . . . . . . . . . . . . . . . . . . . . . . 198Example 18 . . . . . . . . . . . . . . . . . . . . . . . . . . . . . . . . . . . . . . . . . . . . . . . . . . . . . . . 199Example 19 . . . . . . . . . . . . . . . . . . . . . . . . . . . . . . . . . . . . . . . . . . . . . . . . . . . . . . . 200Example 20 . . . . . . . . . . . . . . . . . . . . . . . . . . . . . . . . . . . . . . . . . . . . . . . . . . . . . . . 201
Creating Tabular Reports Using SAS Enterprise Guide . . . . . . . . . . . . . . . . . . . . 201About Tabular Reports . . . . . . . . . . . . . . . . . . . . . . . . . . . . . . . . . . . . . . . . . . . . . . 201Example 21 . . . . . . . . . . . . . . . . . . . . . . . . . . . . . . . . . . . . . . . . . . . . . . . . . . . . . . . 203Example 22 . . . . . . . . . . . . . . . . . . . . . . . . . . . . . . . . . . . . . . . . . . . . . . . . . . . . . . . 204Example 23 . . . . . . . . . . . . . . . . . . . . . . . . . . . . . . . . . . . . . . . . . . . . . . . . . . . . . . . 205Example 24 . . . . . . . . . . . . . . . . . . . . . . . . . . . . . . . . . . . . . . . . . . . . . . . . . . . . . . . 206Example 25 . . . . . . . . . . . . . . . . . . . . . . . . . . . . . . . . . . . . . . . . . . . . . . . . . . . . . . . 207Example 26 . . . . . . . . . . . . . . . . . . . . . . . . . . . . . . . . . . . . . . . . . . . . . . . . . . . . . . . 208Example 27 . . . . . . . . . . . . . . . . . . . . . . . . . . . . . . . . . . . . . . . . . . . . . . . . . . . . . . . 209
169

Example 28 . . . . . . . . . . . . . . . . . . . . . . . . . . . . . . . . . . . . . . . . . . . . . . . . . . . . . . . 210
Working with SAS IT Resource Management . . . . . . . . . . . . . . . . . . . . . . . . . . . . . 210Dynamically Summarized Reporting . . . . . . . . . . . . . . . . . . . . . . . . . . . . . . . . . . . 210Working with Migrated PDBs . . . . . . . . . . . . . . . . . . . . . . . . . . . . . . . . . . . . . . . . 210
Converting Reports
About Converting ReportsA primary enhancement of SAS IT Resource Management 3.2 is the incorporation ofworld-class data management, reporting, and report distribution capabilities that areavailable from SAS. In previous releases, SAS IT Resource Management relied upon acustom reporting interface to perform the following tasks:
• Summarize data by time periods that were specified at report generation time.
• Define and set report options.
• Generate a specific set of report types.
SAS Enterprise Guide has long been available to SAS IT Resource Managementcustomers as a reporting tool option, but the primary reporting capability was the ITResource Management report macros. Beginning with SAS IT Resource Management3.1.1, SAS Enterprise Guide became the primary reporting tool for the SAS IT ResourceManagement solution. Legacy report macros for SAS IT Resource Management are nolonger delivered.
This document provides a guideline for converting reports that are generated by the SASIT Resource Management 2.7 reporting tools (the report macros) to new and enhancedreports using SAS IT Resource Management 3.2 and the SAS Enterprise Guide reportingtool. Here are some similarities between reporting with SAS IT Resource Management2.7 and reporting with SAS IT Resource Management 3.2 using SAS Enterprise Guide:
• Both reporting tools provide an interface that enables you to generate reports quicklyand easily without requiring SAS programming skills.
• Both reporting tools enable you to write and submit SAS code to generate reports.
• Both reporting tools support a variety of SAS graph types and options.
• Both reporting tools generate the SAS code that is necessary to create the desiredreports.
• Both reporting tools support the creation of report definitions that can be run in batchmode.
However, there are differences between using the SAS IT Resource Management 2.7reporting tool and using SAS Enterprise Guide to generate reports in SAS IT ResourceManagement 3.2:
• The SAS IT Resource Management 2.7 reporting tools performed data manipulationtasks that were sometimes time consuming. Whenever possible, data manipulationtasks are now accomplished while data is staged and aggregated by SAS IT ResourceManagement. This results in information map data sources that are report ready andcan serve as input to SAS Enterprise Guide and SAS Web Report Studio.
• SAS Enterprise Guide delivers a user-friendly interface from which a significant setof report tasks and task options are selected. The user interface for SAS Enterprise
170 Appendix 5 • Report Conversion Guide

Guide is far superior to the SAS IT Resource Management 2.7 user interface forreport generation.
• SAS Enterprise Guide supports a much larger set of report types and options thanthose that are available in the SAS IT Resource Management 2.7 report macros. Italso offers many data management and analytical procedures that are not available inSAS IT Resource Management 2.7.
SAS Enterprise Guide supports reporting from report-ready data that is accessiblethrough information maps. Using information maps is the recommended method foraccessing data in SAS IT Resource Management 3.2.
The following table shows the SAS IT Resource Management 2.7 macros and the SASEnterprise Guide tasks that can be used to generate equivalent reports in SAS ITResource Management 3.2. Much of the existing functionality that is available throughSAS IT Resource Management 2.7 reporting macros is provided by SAS EnterpriseGuide. The data manipulation capabilities are now handled by staging and aggregationprocesses of SAS IT Resource Management.
Table A5.1 SAS Enterprise Guide Report Tasks for SAS IT Resource Management 2.7Report Macros
SAS IT Resource Management 2.7 ReportMacro
SAS Enterprise Guide Report Task orFeature That Is Used to Re-create theReport for SAS IT Resource Management3.2
%CPCHART Bar chart and pie chart tasks
%CPCCHRT Bar chart and pie chart tasks
%CPPLOT1 Line plot, scatter plot, area plot, and box plottasks
%CPPLOT2 Line plot task
%CPTABRPT Summary tables task
%CPPRINT List data task
%CPSRCRPT Program Node task
%CPG3D 3-D Scatter plot task
%CPGTPLT Document builder feature
%CPSETHAX SAS Enterprise Guide report option forselected reports
%CPIDTOPN Information map filter or Query task
%CPRUNRPT Stored process feature
%CPSPEC Tile chart task
%CPEXCEPT Information map filter or Query task
Converting Reports 171
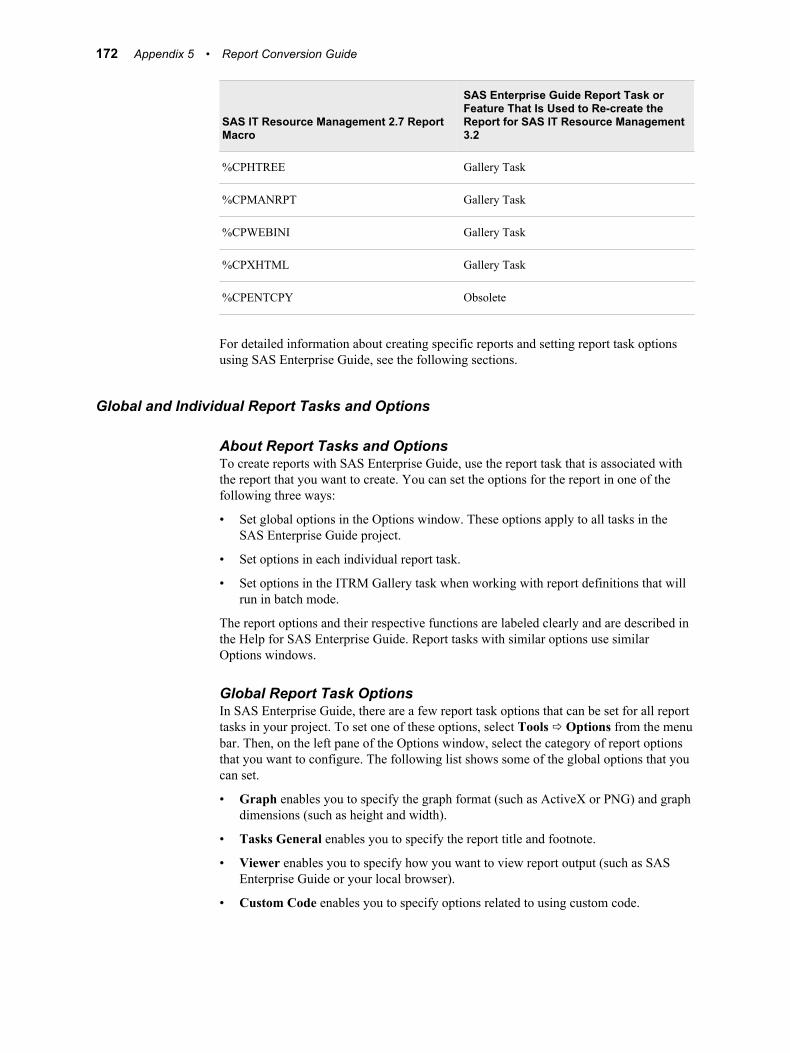
SAS IT Resource Management 2.7 ReportMacro
SAS Enterprise Guide Report Task orFeature That Is Used to Re-create theReport for SAS IT Resource Management3.2
%CPHTREE Gallery Task
%CPMANRPT Gallery Task
%CPWEBINI Gallery Task
%CPXHTML Gallery Task
%CPENTCPY Obsolete
For detailed information about creating specific reports and setting report task optionsusing SAS Enterprise Guide, see the following sections.
Global and Individual Report Tasks and Options
About Report Tasks and OptionsTo create reports with SAS Enterprise Guide, use the report task that is associated withthe report that you want to create. You can set the options for the report in one of thefollowing three ways:
• Set global options in the Options window. These options apply to all tasks in theSAS Enterprise Guide project.
• Set options in each individual report task.
• Set options in the ITRM Gallery task when working with report definitions that willrun in batch mode.
The report options and their respective functions are labeled clearly and are described inthe Help for SAS Enterprise Guide. Report tasks with similar options use similarOptions windows.
Global Report Task OptionsIn SAS Enterprise Guide, there are a few report task options that can be set for all reporttasks in your project. To set one of these options, select Tools ð Options from the menubar. Then, on the left pane of the Options window, select the category of report optionsthat you want to configure. The following list shows some of the global options that youcan set.
• Graph enables you to specify the graph format (such as ActiveX or PNG) and graphdimensions (such as height and width).
• Tasks General enables you to specify the report title and footnote.
• Viewer enables you to specify how you want to view report output (such as SASEnterprise Guide or your local browser).
• Custom Code enables you to specify options related to using custom code.
172 Appendix 5 • Report Conversion Guide
Global Color, Pattern, and Symbol Options Using SAS TemplatesIn SAS Enterprise Guide, pattern and symbol options can be set at the individual reporttask level. However, you can set these options once for the entire project using SAStemplates and style sheets. Global options can be set using this method and can still beoverridden in an individual report task for a specific task. To set these global graphoptions, perform the following steps:
1. Use SAS to create your custom SAS template.
2. Use SAS Enterprise Guide to create your custom style sheet with the same name asyour custom SAS template.
3. Set the custom style sheet as the default style.
4. Run your report tasks.
Reports that do not have these graph options set for the report task will use the colors,patterns, and symbols that are set in your SAS template. For details about how to createa custom SAS Template and style sheet, see “About Templates and Style Sheets” onpage 86.
Individual Report Task OptionsMost report task options are set individually by specifying values for each report task.To set values for the report task options in an individual report task, perform thefollowing steps:
1. Right-click a report task and select Modify <report task name>.
2. Select from the various menu options in the left pane, and specify values for thecorresponding parameters.
Click Help to view the Help on any specific option in the current window.
Top N and Bottom N ReportingIn SAS IT Resource Management 2.7, some report types support the Top N and BottomN reporting option. For other report types, using the macro %CPIDTOPN is required.
You can use SAS Enterprise Guide to report on the top or bottom contributors for aspecific column in SAS IT Resource Management 3.2. To do so, you can use a filter toselect the top or bottom contributors for a specific rank column that is created when datais aggregated by SAS IT Resource Management. Information map filters can be defined(using Information Map transformations in SAS IT Resource Management or using SASInformation Map Studio) and selected (using the Filter tab of the Information Mapwindow) in SAS Enterprise Guide. Filters can also be specified within SAS EnterpriseGuide Query tasks.
Report OutputIn SAS Enterprise Guide, you can generate graph output to the SAS Enterprise Guidewindow or to a local browser. You can specify your preference by selecting Tools ðOptions from the menu bar. You can also generate graph output by publishing to a Webserver or to a file system.
You can use the ITRM Gallery task to create report definitions that are submitted inreport jobs. The report jobs generate reports in the SAS content server and are displayedwith the Gallery Manager.
You can also use SAS Management Console to define channels and then select a channelwhen publishing from SAS Enterprise Guide. In addition, if you use the SAS Reportformat, a report can be published to a repository and SAS Web Report Studio. For more
Converting Reports 173
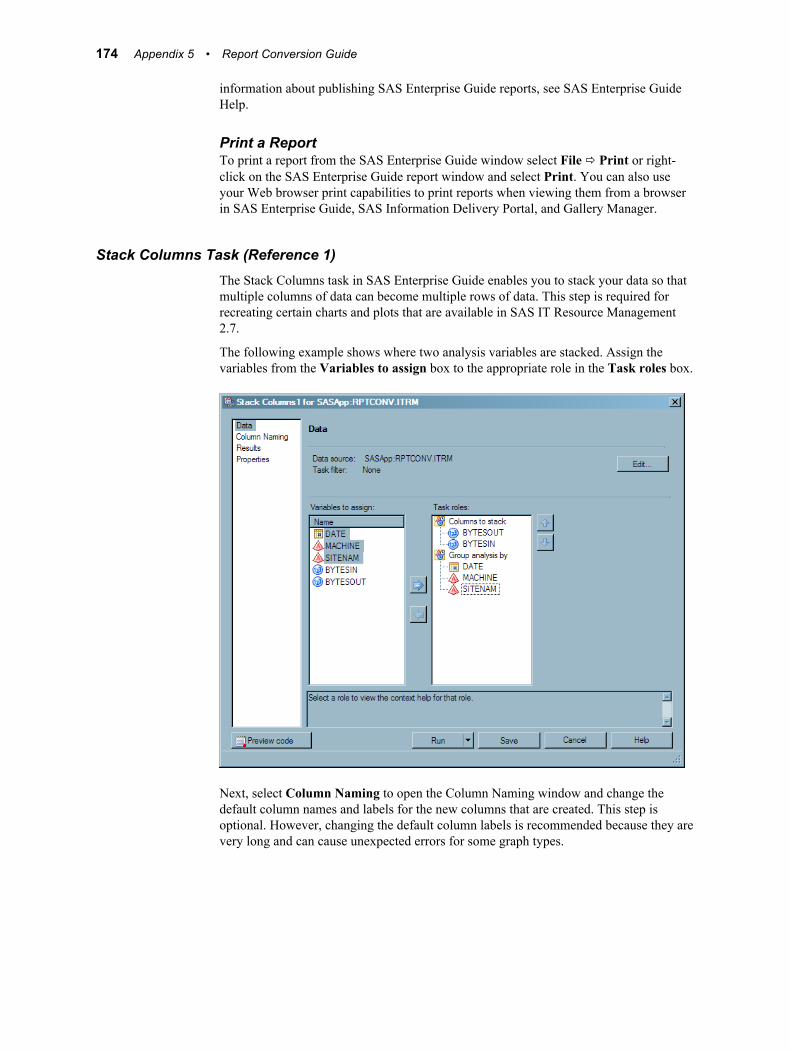
information about publishing SAS Enterprise Guide reports, see SAS Enterprise GuideHelp.
Print a ReportTo print a report from the SAS Enterprise Guide window select File ð Print or right-click on the SAS Enterprise Guide report window and select Print. You can also useyour Web browser print capabilities to print reports when viewing them from a browserin SAS Enterprise Guide, SAS Information Delivery Portal, and Gallery Manager.
Stack Columns Task (Reference 1)The Stack Columns task in SAS Enterprise Guide enables you to stack your data so thatmultiple columns of data can become multiple rows of data. This step is required forrecreating certain charts and plots that are available in SAS IT Resource Management2.7.
The following example shows where two analysis variables are stacked. Assign thevariables from the Variables to assign box to the appropriate role in the Task roles box.
Next, select Column Naming to open the Column Naming window and change thedefault column names and labels for the new columns that are created. This step isoptional. However, changing the default column labels is recommended because they arevery long and can cause unexpected errors for some graph types.
174 Appendix 5 • Report Conversion Guide

For more information about working with the Stack Columns task, see the SASEnterprise Guide Help.
Custom User Code to Accumulate Stacked Data (Reference 2)The Stack Columns task in SAS Enterprise Guide enables you to reshape your data sothat multiple columns of data can become multiple rows of data. This step is required forre-creating certain charts and plots that are available in SAS IT Resource Management2.7.
However, custom user code is required if you also want to accumulate the data. This stepis required for re-creating stacked plots that are available in SAS IT ResourceManagement 2.7.
You can add custom user code to the Stack Columns task by selecting Preview code ðInsert Code. Your custom code must follow the RUN statement that follows theTRANSPOSE procedure code that is generated by SAS Enterprise Guide.
The following image shows the User Code window. You can insert custom user codewherever an “insert code” icon appears. The “insert code” icon at the bottom of theimage shows where you should insert your custom user code to accumulate your data.
Converting Reports 175
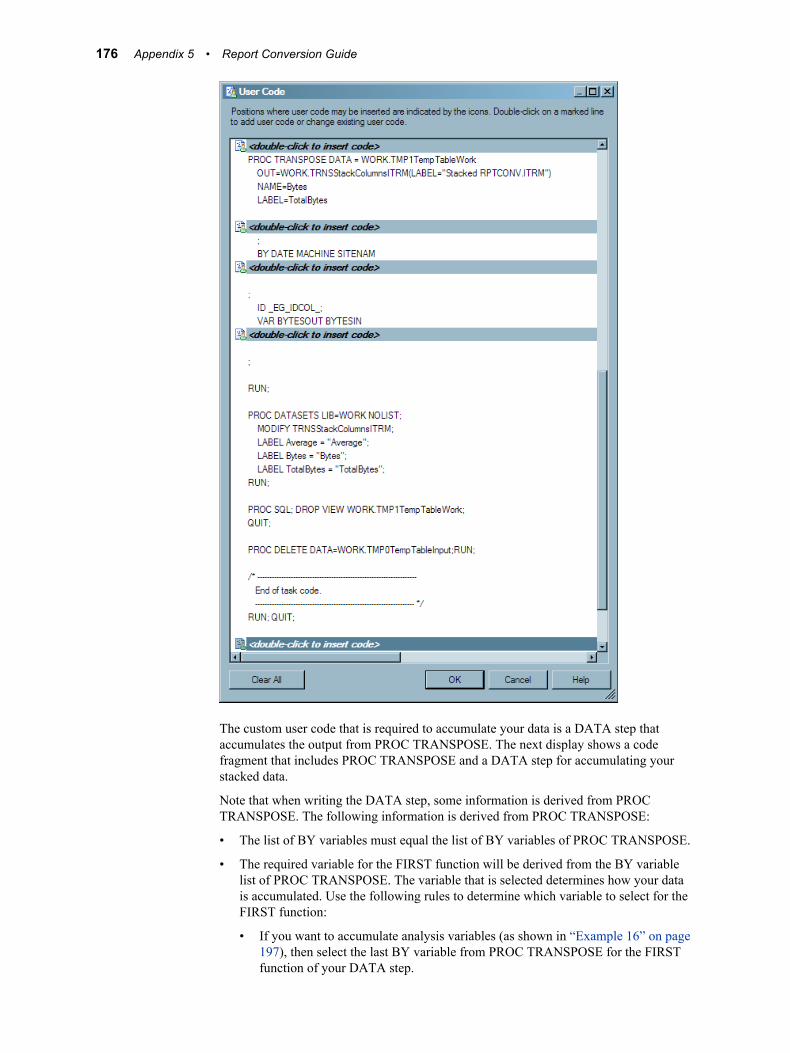
The custom user code that is required to accumulate your data is a DATA step thataccumulates the output from PROC TRANSPOSE. The next display shows a codefragment that includes PROC TRANSPOSE and a DATA step for accumulating yourstacked data.
Note that when writing the DATA step, some information is derived from PROCTRANSPOSE. The following information is derived from PROC TRANSPOSE:
• The list of BY variables must equal the list of BY variables of PROC TRANSPOSE.
• The required variable for the FIRST function will be derived from the BY variablelist of PROC TRANSPOSE. The variable that is selected determines how your datais accumulated. Use the following rules to determine which variable to select for theFIRST function:
• If you want to accumulate analysis variables (as shown in “Example 16” on page197), then select the last BY variable from PROC TRANSPOSE for the FIRSTfunction of your DATA step.
176 Appendix 5 • Report Conversion Guide

• If you want to accumulate a class variable (as shown in “Example 18” on page199), then use the next to last BY variable from PROC TRANSPOSE for theFIRST function of your DATA step.
The following example shows how to accumulate an analysis variable.
Creating Bar and Pie Charts Using SASEnterprise Guide
This section discusses the means by which bar and pie charts were created with SAS ITResource Management 2.7 and the recommended means by which they are created usingSAS IT Resource Management 3.2.
About Bar and Pie ChartsThe following table shows the eight chart types that are available in SAS IT ResourceManagement 2.7 and the corresponding SAS Enterprise Guide task that is available togenerate those chart types in SAS IT Resource Management 3.2.
Table A5.2 SAS IT Resource Management 2.7 Chart Types and Corresponding SASEnterprise Guide Tasks
Chart Type SAS Enterprise Guide Task
Vertical Bar Bar Chart task
Horizontal Bar Bar Chart task
Vertical Bar 3-D Bar Chart task
Horizontal Bar 3-D Bar Chart task
Pie Pie Chart task
Creating Bar and Pie Charts Using SAS Enterprise Guide 177

Chart Type SAS Enterprise Guide Task
Pie 3-D Pie Chart task
Star Bar Chart task - Appearance Options, Shape
Block Bar Chart task - 3-D vertical bar chart
In SAS Enterprise Guide, the bar orientations (vertical and horizontal) are task subtypeoptions that are available in the Bar Chart task. The bar dimensions (two-dimensionaland three-dimensional) are appearance options in the Bar Chart and Pie Chart tasks.
This section provides more details about the SAS IT Resource Management 2.7 macrosthat create various types of bar and pie charts and the equivalent SAS Enterprise Guidesteps that are required to re-create these types of reports.
The %CPCHART macro creates the following three bar chart types:
• one analysis column and one class column (“Example 1” on page 180)
• one analysis column, one class column, and one group column (“Example 2” on page181)
• one analysis column, one class column, and one subgroup column (“Example 3” onpage 182)
The %CPCCHRT macro creates the following four bar chart types:
• multiple analysis columns (“Example 4” on page 183)
• multiple analysis columns and one group column (“Example 5” on page 184)
• multiple analysis columns, one group column, and one subgroup column (“Example6” on page 185)
• multiple analysis columns, one group column, and one stack column (“Example 7”on page 186)
The %CPCHART macro creates a pie chart of one analysis column and one classcolumn (“Example 8” on page 187).
The %CPCCHRT macro creates a pie chart type of multiple analysis columns(“Example 9” on page 188).
The following sections show how to re-create these bar chart and pie chart types usingSAS Enterprise Guide.
Bar Chart and Pie Chart NotesHere are some notes that you might consider when working with bar charts and piecharts:
• Do not confuse the Group bars by role that is available in some chart tasks, with theGroup charts by role. The Group charts by role is a role that is available in mostreport tasks. It enables you to create a different report page for each value of theGroup charts by column.
• The Transpose task can be substituted for the Stack Columns task. For moreinformation about the differences between the Stack Columns task and the Transposetask, see SAS Enterprise Guide Help.
178 Appendix 5 • Report Conversion Guide

• The graph examples in the following sections typically show two analysis columnswherever multiple analysis columns are supported.
• Some graph titles might refer to SAS IT Resource Management 2.7 terminology tohelp you make the transition from 2.7 to 3.2. For example, a class column that isassigned to a subgroup role in 2.7 might be assigned to a stack role in 3.2 to achievethe same results.
Creating Bar and Pie Charts Using SAS Enterprise Guide 179
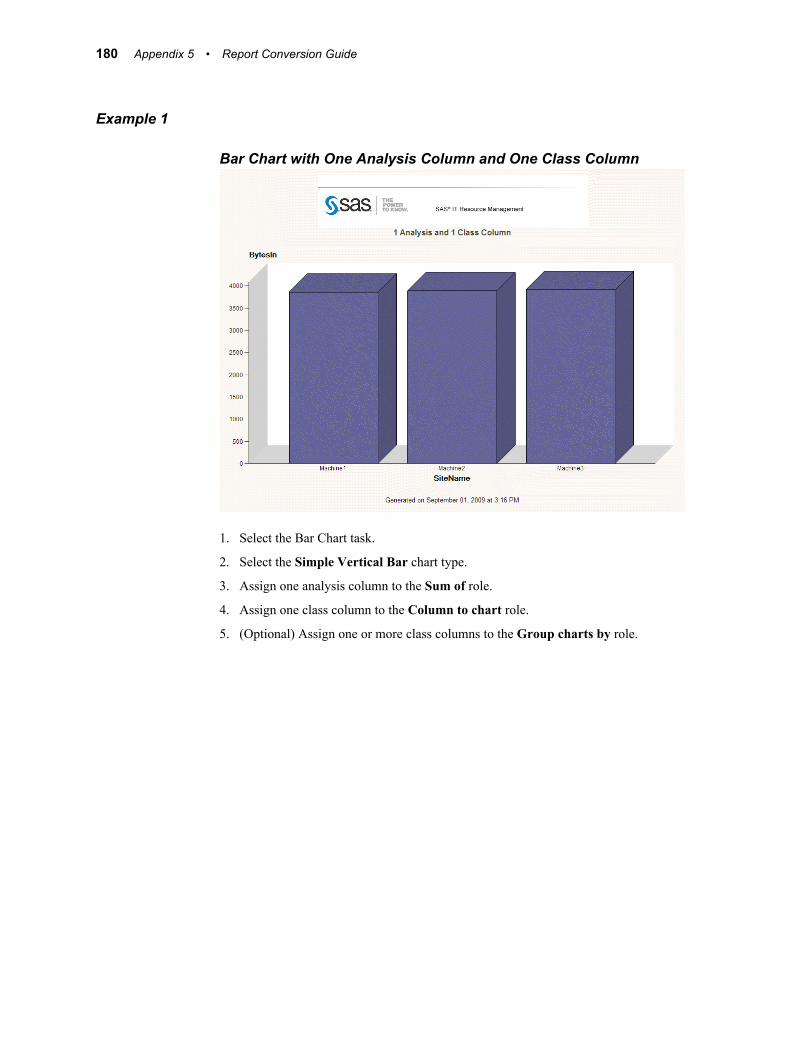
Example 1
Bar Chart with One Analysis Column and One Class Column
1. Select the Bar Chart task.
2. Select the Simple Vertical Bar chart type.
3. Assign one analysis column to the Sum of role.
4. Assign one class column to the Column to chart role.
5. (Optional) Assign one or more class columns to the Group charts by role.
180 Appendix 5 • Report Conversion Guide

Example 2
Bar Chart with One Analysis Column, One Class Column, and OneGroup Column
1. Select the Bar Chart task.
2. Select the Grouped Vertical Bar chart type.
3. Assign one analysis column to the Sum of role.
4. Assign one class column to the Column to chart role.
5. Assign one class column to the Group bars by role.
6. (Optional) Assign one or more class columns to the Group charts by role.
Creating Bar and Pie Charts Using SAS Enterprise Guide 181
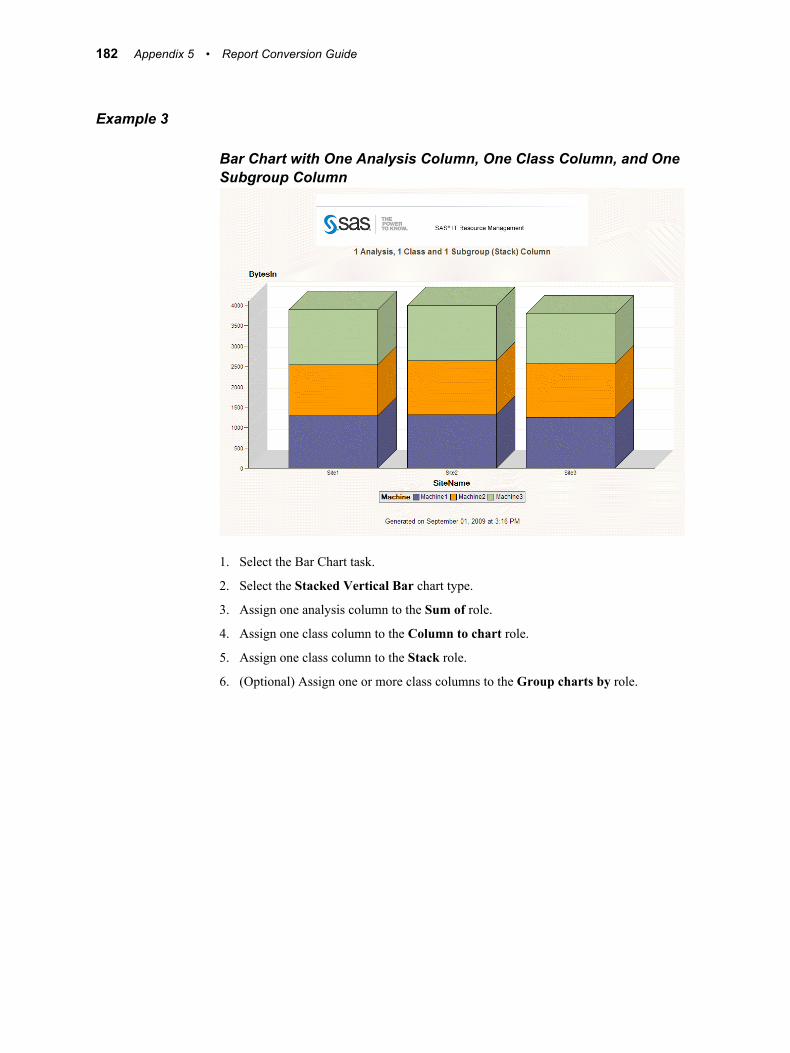
Example 3
Bar Chart with One Analysis Column, One Class Column, and OneSubgroup Column
1. Select the Bar Chart task.
2. Select the Stacked Vertical Bar chart type.
3. Assign one analysis column to the Sum of role.
4. Assign one class column to the Column to chart role.
5. Assign one class column to the Stack role.
6. (Optional) Assign one or more class columns to the Group charts by role.
182 Appendix 5 • Report Conversion Guide
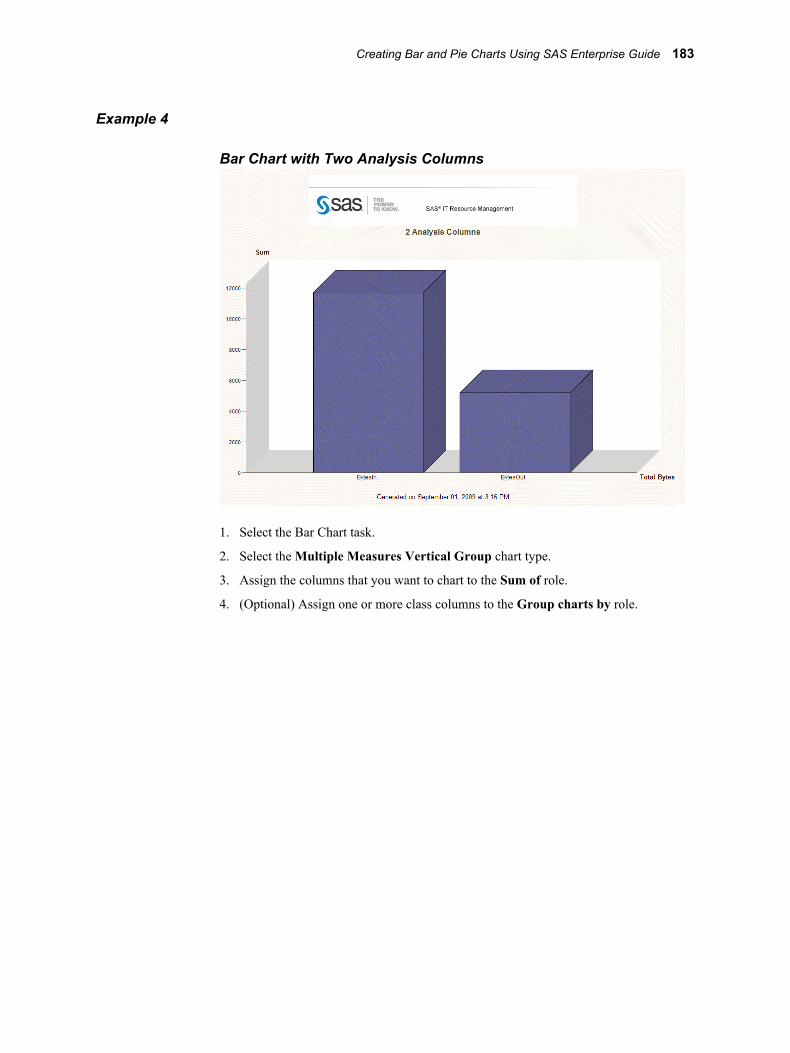
Example 4
Bar Chart with Two Analysis Columns
1. Select the Bar Chart task.
2. Select the Multiple Measures Vertical Group chart type.
3. Assign the columns that you want to chart to the Sum of role.
4. (Optional) Assign one or more class columns to the Group charts by role.
Creating Bar and Pie Charts Using SAS Enterprise Guide 183

Example 5
Bar Chart with Two Analysis Columns and One Group Column
1. Select the Bar Chart task.
2. Select the Multiple Measures Vertical Group chart type.
3. Assign the columns that you want to chart to the Sum of role.
4. Assign one class column to the Column to chart role.
5. (Optional) Assign one or more class columns to the Group charts by role.
184 Appendix 5 • Report Conversion Guide

Example 6
Bar Chart with Two Analysis Columns, One Group Column, and OneSubgroup Column
1. Select the Stack Columns task located in the Data category to transpose your data.
2. Assign the two analysis columns that you want to chart to the Columns to Stackrole.
3. Assign all of the class columns used in your report (including Group charts bycolumns) to the Group Analysis by role.
4. Rename your new column labels (see “Stack Columns Task (Reference 1)” on page174).
5. Run the Stack Columns task to transpose your data.
6. Select the Bar Chart task.
7. Select the Grouped/Stacked Vertical Bar chart type.
8. Assign the new transposed analysis column to the Sum of role.
9. Assign the new transposed class column to the Column to chart role.
10. Assign one class column to the Group bars by role.
11. Assign one class column to the Stack role.
12. (Optional) Assign one or more class columns to the Group charts by role.
Note: The difference between this bar chart example and “Example 7” on page 186 isin the column role assignments.
Creating Bar and Pie Charts Using SAS Enterprise Guide 185

Example 7
Bar Chart with Two Analysis Columns, One Group Column, and OneStack Column
1. Select the Stack Columns task located in the Data category to transpose your data.
2. Assign the two analysis columns that you want to chart to the Columns to Stackrole.
3. Assign all of the class columns used in your report (including Group charts bycolumns) to the Group Analysis by role.
4. Rename your new column labels (see “Stack Columns Task (Reference 1)” on page174).
5. Run the Stack Columns task to transpose your data.
6. Select the Bar Chart task.
7. Select the Grouped/Stacked Vertical Bar or the Grouped/Stacked HorizontalBar chart type.
8. Assign the new transposed analysis column to the Sum of role.
9. Assign one class column to the Column to chart role.
10. Assign one class column to the Group bars by role.
11. Assign the new transposed class column to the Stack role.
12. (Optional) Assign one or more class columns to the Group charts by role.
Note: The difference between this bar chart example and “Example 6” on page 185 is inthe column role assignments.
186 Appendix 5 • Report Conversion Guide

Example 8
Pie Chart with One Analysis Column and One Class Column
1. Select the Pie Chart task.
2. Select the Simple Pie chart type.
3. Assign one analysis column to the Sum of role.
4. Assign one class column to the Column to chart role.
5. (Optional) Assign one or more class columns to the Group charts by role.
Creating Bar and Pie Charts Using SAS Enterprise Guide 187

Example 9
Pie Chart with Two Analysis Columns
1. Select the Stack Columns task located in the Data category to transpose your data.
2. Assign the two analysis columns that you want to chart to the Columns to Stackrole.
3. Assign all of the class columns used in your report (including Group charts bycolumns) to the Group Analysis by role.
4. Rename your new column labels (see “Stack Columns Task (Reference 1)” on page174).
5. Run the Stack Columns task to transpose your data.
6. Select the Pie Chart task.
7. Select the Simple Pie chart type.
8. Assign the new transposed analysis column to the Sum of role.
9. Assign the new transposed class column to the Column to chart role.
10. (Optional) Assign one or more class columns to the Group charts by role.
188 Appendix 5 • Report Conversion Guide

Creating Line and Other Plots Using SASEnterprise Guide
This section discusses the means by which line and other plots were created with SAS ITResource Management 2.7 and the recommended means by which they are created usingSAS IT Resource Management 3.2.
About Line and Other PlotsThe following table shows the 15 plot types or options that are available in SAS ITResource Management 2.7 and the corresponding SAS Enterprise Guide tasks that areavailable to generate those chart types in SAS IT Resource Management 3.2.
Table A5.3 SAS IT Resource Management 2.7 Plot Types and Corresponding SASEnterprise Guide Tasks
Plot Type SAS Enterprise Guide Task
2XY Line Plot task
Line Line Plot task
Join Line Plot task
Needle Line Plot task
Smooth Line Plot task
Spline Line Plot task
Standard Deviation Line Plot task
Step Center Line Plot task
Percent Line Plot task
Scatter Scatter Plot task
Stack Area Plot task
Stack Percent Area Plot task
Box Plot Box Plot task
Hi-Low plot Box Plot task
Regression Various regression plots in the Analyzecategory of plots
Creating Line and Other Plots Using SAS Enterprise Guide 189
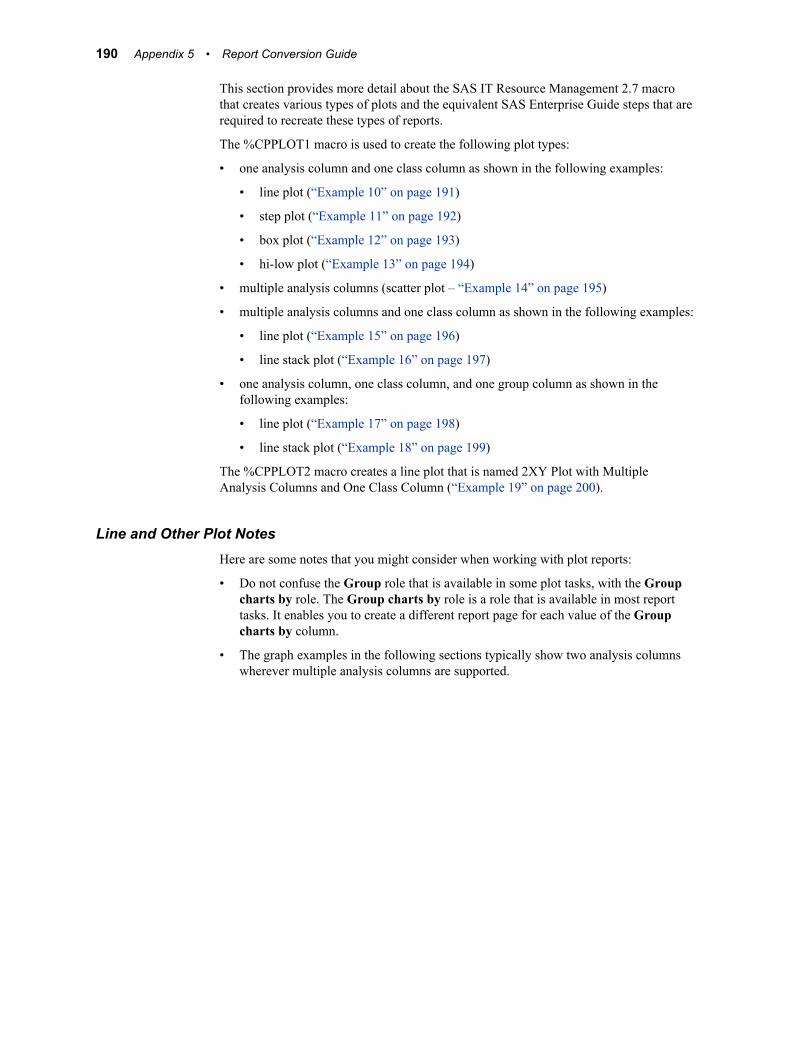
This section provides more detail about the SAS IT Resource Management 2.7 macrothat creates various types of plots and the equivalent SAS Enterprise Guide steps that arerequired to recreate these types of reports.
The %CPPLOT1 macro is used to create the following plot types:
• one analysis column and one class column as shown in the following examples:
• line plot (“Example 10” on page 191)
• step plot (“Example 11” on page 192)
• box plot (“Example 12” on page 193)
• hi-low plot (“Example 13” on page 194)
• multiple analysis columns (scatter plot – “Example 14” on page 195)
• multiple analysis columns and one class column as shown in the following examples:
• line plot (“Example 15” on page 196)
• line stack plot (“Example 16” on page 197)
• one analysis column, one class column, and one group column as shown in thefollowing examples:
• line plot (“Example 17” on page 198)
• line stack plot (“Example 18” on page 199)
The %CPPLOT2 macro creates a line plot that is named 2XY Plot with MultipleAnalysis Columns and One Class Column (“Example 19” on page 200).
Line and Other Plot NotesHere are some notes that you might consider when working with plot reports:
• Do not confuse the Group role that is available in some plot tasks, with the Groupcharts by role. The Group charts by role is a role that is available in most reporttasks. It enables you to create a different report page for each value of the Groupcharts by column.
• The graph examples in the following sections typically show two analysis columnswherever multiple analysis columns are supported.
190 Appendix 5 • Report Conversion Guide

Example 10
Line Plot with One Analysis Column and One Class Column
1. Select the Line Plot task.
2. Select the Line Plot subtask.
3. Assign one analysis column to the Vertical role.
4. Assign one date or time class column to the Horizontal role.
5. (Optional) Assign one or more class columns to the Group charts by role.
Creating Line and Other Plots Using SAS Enterprise Guide 191

Example 11
Step Plot with One Analysis Column and One Class Column
1. Select the Line Plot task.
2. Select the Step Plot subtask.
3. Assign one analysis column to the Vertical role.
4. Assign one date or time class column to the Horizontal role.
5. (Optional) Assign one or more class columns to the Group charts by role.
192 Appendix 5 • Report Conversion Guide

Example 12
Box Plot with One Analysis Column and One Class Column
1. Select the Box Plot task.
2. Select the Box Plot subtask.
3. Assign one analysis column to the Vertical role.
4. Assign one date or time class column to the Horizontal role.
5. (Optional) Assign one or more class columns to the Group charts by role.
Creating Line and Other Plots Using SAS Enterprise Guide 193

Example 13
Hi-Low Plot with One Analysis Column and One Class Column
1. Select the Box Plot task.
2. Select the Hi-Low subtask.
3. Assign one analysis column to the Vertical role.
4. Assign one date or time class column to the Horizontal role.
5. (Optional) Assign one or more class columns to the Group charts by role.
194 Appendix 5 • Report Conversion Guide
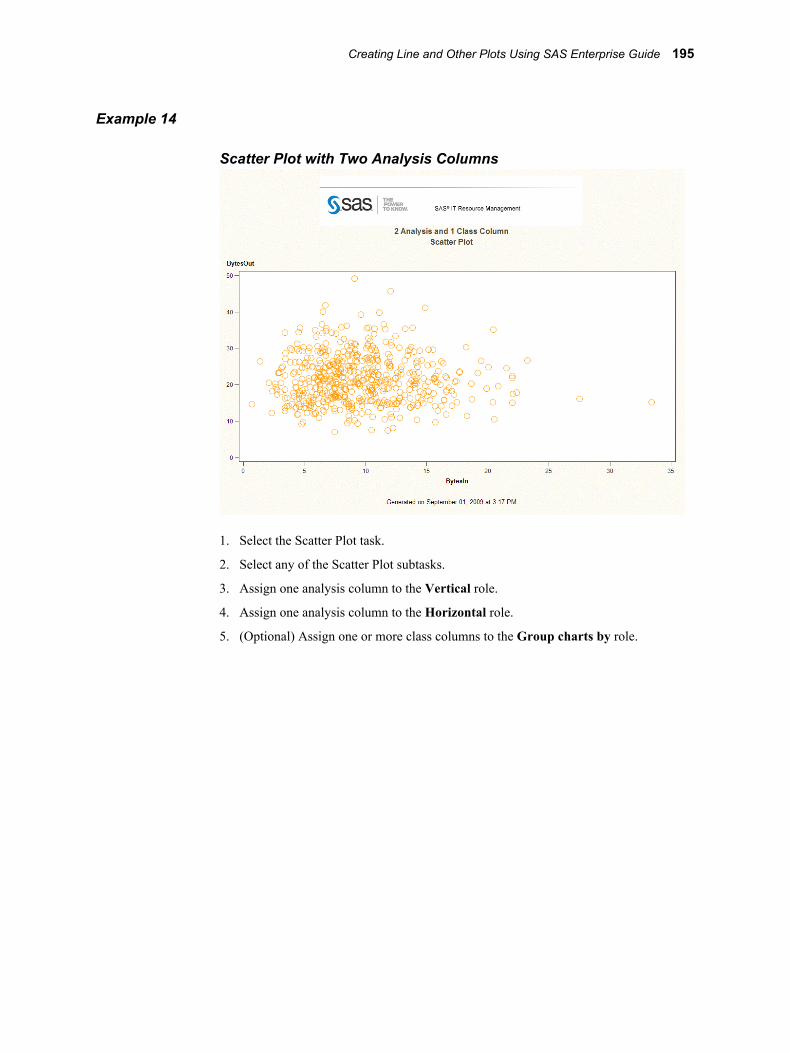
Example 14
Scatter Plot with Two Analysis Columns
1. Select the Scatter Plot task.
2. Select any of the Scatter Plot subtasks.
3. Assign one analysis column to the Vertical role.
4. Assign one analysis column to the Horizontal role.
5. (Optional) Assign one or more class columns to the Group charts by role.
Creating Line and Other Plots Using SAS Enterprise Guide 195

Example 15
Line Plot with Two Analysis Columns and One Class Column
1. Select the Line Plot task.
2. Select the Multiple vertical column line plots using overlay subtask.
3. Assign two analysis columns to the Vertical role.
4. Assign one date or time class column to the Horizontal role.
5. (Optional) Assign one or more class columns to the Group charts by role.
196 Appendix 5 • Report Conversion Guide

Example 16
Stack Plot with Two Analysis Columns and One Class Column
1. Select the Stack Columns task located in the Data category to transpose andaccumulate your data.
2. Assign the two analysis columns that you want to plot to the Columns to Stack role.
3. Assign all of the class columns used in your report (including Group charts bycolumns) to the Group Analysis by role.
4. Rename your new column labels (see “Stack Columns Task (Reference 1)” on page174).
5. Insert SAS custom code to accumulate your data. See “Custom User Code toAccumulate Stacked Data (Reference 2)” on page 175.
6. Run the Stack Columns task to transpose and accumulate your data.
7. Select the Area Plot task.
8. Select the Multiple area plots by group column subtask.
9. Assign the new transposed analysis columns to the Vertical role.
10. Assign the new transposed class column to the Group role.
11. Assign one date or time class column to the Horizontal role.
12. (Optional) Assign one or more class columns to the Group charts by role.
Creating Line and Other Plots Using SAS Enterprise Guide 197

Example 17
Line Plot with One Analysis Columns, One Class Column, and OneGroup Column
1. Select the Line Plot task.
2. Select the Multiple line plots by group column subtask.
3. Assign one analysis column to the Vertical role.
4. Assign one date or time class column to the Horizontal role.
5. Assign one class column to the Group role.
6. (Optional) Assign one or more class columns to the Group charts by role.
198 Appendix 5 • Report Conversion Guide

Example 18
Stack Plot with One Analysis Columns, One Class Column, and OneGroup Column
1. Select the Stack Columns task located in the Data category to transpose andaccumulate your data.
2. Assign one analysis column that you want to plot to the Columns to Stack role.
3. Assign all of the class columns used in your report (including Group charts bycolumns) to the Group Analysis by role. Ensure that the class column that you wantto accumulate in Step 5 is the last column in the list.
4. Rename your new column labels. See “Stack Columns Task (Reference 1)” on page174.
5. Insert SAS Custom Code to accumulate your data. See “Custom User Code toAccumulate Stacked Data (Reference 2)” on page 175.
6. Run the Stack Columns task to transpose and accumulate your data.
7. Select the Area Plot task.
8. Select the Multiple area plots by group column subtask.
9. Assign the new transposed analysis columns to the Vertical role.
10. Assign one date or time class column to the Horizontal role.
11. Assign one class column to the Group role.
12. (Optional) Assign one or more class columns to the Group charts by role.
Creating Line and Other Plots Using SAS Enterprise Guide 199

Example 19
2XY Plot with Two Analysis Columns and One Class Column
1. Select the Line Plot task.
2. Select the Line Plot subtask.
3. Assign one analysis column to the Vertical role.
4. Assign one analysis column to the Vertical (Right) role.
5. Assign one date or time class column to the Horizontal role.
6. (Optional) Assign one or more class columns to the Group charts by role.
200 Appendix 5 • Report Conversion Guide

Example 20
Three-Dimensional GraphThe three-dimensional graph that is available in SAS IT Resource Management 2.7differs from the three-dimensional graph that is generated with SAS Enterprise Guide. InSAS Enterprise Guide, the columns for the horizontal, vertical, and depth task role mustbe numeric. In SAS IT Resource Management 2.7, a class column is supported.
You can use the Line Plot task in SAS Enterprise Guide to generate a plot that shows allof the information that is available in the three-dimensional graph from SAS ITResource Management 2.7. To create this graph, see “Example 17” on page 198.
Creating Tabular Reports Using SAS EnterpriseGuide
This section discusses the means by which tabular reports were created with SAS ITResource Management 2.7 and the recommended means by which they are created usingSAS IT Resource Management 3.2.
About Tabular ReportsThe following table shows the six tabular report types that are available in SAS ITResource Management 2.7 and the corresponding SAS Enterprise Guide task that isavailable to generate those report types in SAS IT Resource Management 3.2.
Creating Tabular Reports Using SAS Enterprise Guide 201

Table A5.4 SAS IT Resource Management 2.7 Report Types and Corresponding SASEnterprise Guide Tasks
Tabular Report Type SAS Enterprise Guide Task
Analysis X Statistic Summary Tables task
Class (value) X Analysis (Statistic) Summary Tables task
Class (value) X Statistic (Analysis) Summary Tables task
Class (value) X Analysis (Sum) Summary Tables task
Class values X Class (Analysis (Statistic)) Summary Tables task
Class values X Analysis (Statistic) Summary Tables task
SAS IT Resource Management 2.7 uses the macro %CPTABRPT to create all of thevariations that are shown in the preceding table. In SAS Enterprise Guide, you can createany of these variations with the Summary Tables task.
The following examples show the report output and the Summary Tables task for each ofthe preceding variations. To create any of the reports in examples 21–27, perform thefollowing steps:
1. Select the Summary Tables task located in the Describe menu.
2. In the Task Roles window, assign the analysis columns that you want to include inyour report to the Analysis columns task role.
3. In the Task Roles window, assign the class columns that you want to include in yourreport to the Classification columns task role.
4. In the Summary Tables window, drag and drop the analysis columns and theclassification columns to the appropriate section of the Box Area. The seconddisplay of each example below provides a guide for where to drag and drop thevariables.
5. (Optional) In the Task Roles window, assign one or more class columns to the Pagesrole.
202 Appendix 5 • Report Conversion Guide

Example 21
Tabular Report Analysis X Statistic
Creating Tabular Reports Using SAS Enterprise Guide 203

Example 22
Tabular Report Class (Value) X Analysis (Statistic)
204 Appendix 5 • Report Conversion Guide

Example 23
Tabular Report Class (Value) X Statistic (Analysis)
Creating Tabular Reports Using SAS Enterprise Guide 205
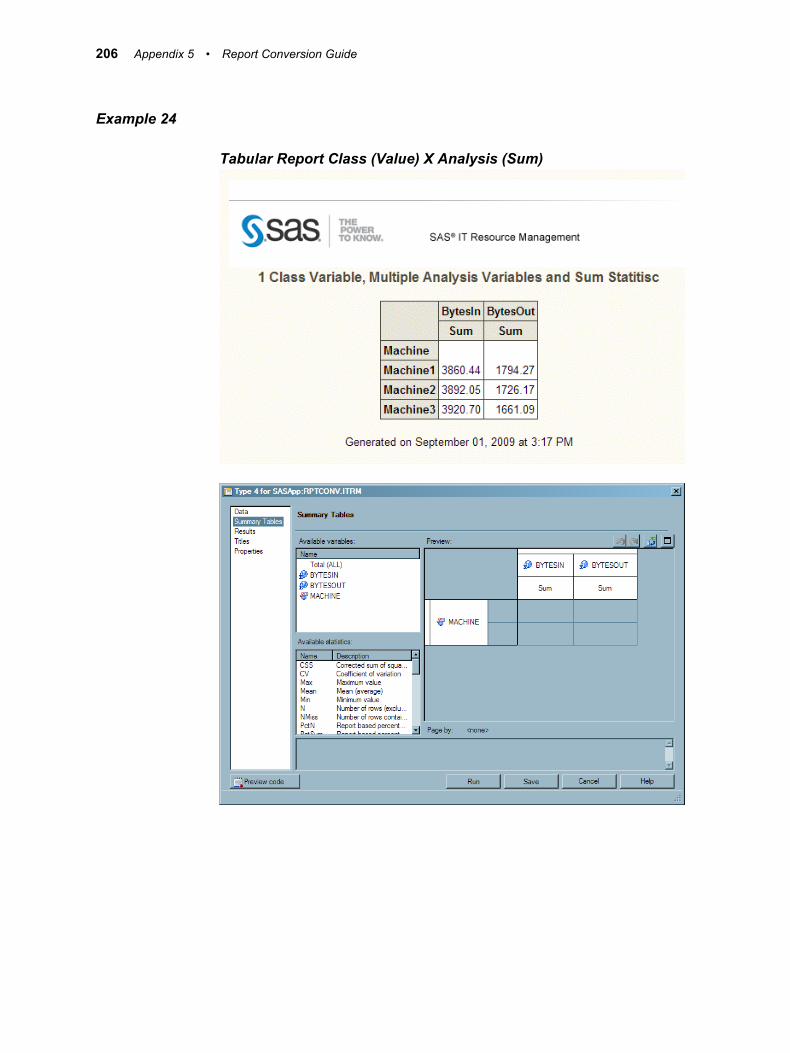
Example 24
Tabular Report Class (Value) X Analysis (Sum)
206 Appendix 5 • Report Conversion Guide

Example 25
Tabular Report Class Values X Class (Analysis (Statistic))
Creating Tabular Reports Using SAS Enterprise Guide 207

Example 26
Tabular Report Class Values X Analysis (Statistic)
208 Appendix 5 • Report Conversion Guide

Example 27
Print ReportSAS IT Resource Management 2.7 uses the macro %CPPRINT to create print reports. InSAS Enterprise Guide, you can create a print report, known as a listing report, using theList Data task that is available in the Describe category of report tasks.
To create a print report, perform the following steps:
1. Select the List Data task that is located in the Describe category of report tasks.
2. In the Task Roles box, assign the analysis columns and classification columns thatyou want to include in your report to the List columns task role.
3. (Optional) In the Task Roles box, assign one or more class columns to the Page byrole.
Creating Tabular Reports Using SAS Enterprise Guide 209

Example 28
Source CodeSAS IT Resource Management 2.7 uses the macro %CPSRCRPT to submit SAS codethat is stored in a catalog source file. In SAS Enterprise Guide, you submit SAS code bycreating and submitting a Program node task. The code that you write is saved in the taskwithin the SAS Enterprise Guide project.
To create a Code task to run source code, perform the following steps:
1. Select File ð New ð Code from the menu bar.
2. Enter your SAS code in the Code window.
3. Right-click and select Run to submit the code.
Working with SAS IT Resource Management
Dynamically Summarized ReportingSAS IT Resource Management 3.2 enables you to perform all of the datatransformations that are necessary to produce analysis and report-ready data beforegenerating reports. You can use the SAS technologies that are available in the SAS ITResource Management client that are specifically designed for data integration toprepare IT data for analysis and reporting. This will improve the performance of SAS ITResource Management reporting and the system as a whole.
In earlier versions of SAS IT Resource Management, the performance data warehouse(PDB) structure limited the solution to predefined time period summarizations. Inresponse, SAS IT Resource Management 2.7 reporting macros evolved to performspecial time-based summarizations that were calculated at the time of report generation.In SAS IT Resource Management 3.2, the IT data mart structure replaces the PDB andenables you to summarize data through the SAS IT Resource Management 3.2transformation. Therefore, dynamic summarization capabilities are no longer providedby the %CP report macros.
The SAS IT Resource Management Adapter Setup wizard provides several of thesummarized aggregations that were typically created at the time of report generation bySAS IT Resource Management 2.7 report macros.
SAS IT Resource Management 3.2 includes formulas that support various time periods.By choosing the aging columns for your summarized aggregations that use these newformulas, you can create summarized aggregations that provide the equivalent dynamicsummarization that is available in SAS IT Resource Management 2.7 reporting. Formore information about creating custom aggregations, see the “Creating AggregationTables with the Summarized Aggregation Table Wizard” topic in the SAS IT ResourceManagement: Administrator’s Guide.
Working with Migrated PDBsWith few exceptions, column names and labels are preserved when migrating a SAS ITResource Management 2.7 PDB to a SAS IT Resource Management 3.2 IT data mart.
210 Appendix 5 • Report Conversion Guide
Therefore, user-written SAS code that is not dependent on SAS IT ResourceManagement 2.7 report macros can be submitted to re-create existing reports withminimal changes.
Here are a few tips for re-creating existing reports:
• The DATETIME column that was required in SAS IT Resource Management 2.7 isno longer required in SAS IT Resource Management 3.2. In summarizedaggregations, the columns DAYDATE, WEEKDATE, MONTHDATE, andYEARDATE are used instead.
• Table names have changed. The level name is now appended to the original name.For example, a table with the original name SARDEV in the DETAIL library is nownamed SARDEV_DETAIL.
• SAS IT Resource Management tables are now physical SAS data sets rather thanSAS DATA step views. Code that requires views as input will not work.
• Additional columns are created in the staged table to convert COUNT, TIME, andTIMETICKS type variables into rates. The rate variables are what should bespecified in the summarized aggregation for computing statistics that are compatiblewith SAS IT Resource Management 2.7 reporting.
For more details about these changes and for more information about migrating PDBsand working with migrated PDBs, see the SAS IT Resource Management 3.2 MigrationDocumentation.
Working with SAS IT Resource Management 211

212 Appendix 5 • Report Conversion Guide

Appendix 6
Recommended Reading
Here is the recommended reading list for this title:
• Introduction to SAS IT Resource Management
• SAS IT Resource Management: Administrator's Guide
• SAS IT Resource Management — Gallery Manager: User’s Guide
• SAS IT Resource Management: Migration Documentation
• SAS IT Management Adapter for SAP User's Guide
SAS provides other documentation that might be of interest to users of SAS IT ResourceManagement. This documentation is available at http://support.sas.com/documentation/index.html. Use the A-Z index to locate documentation for theseproducts:
• SAS Add-In for Microsoft Office
• SAS BI Dashboard
• SAS BI Server (for the suite of products that are associated with the BI Server)
• SAS Data Integration Studio
• SAS Enterprise Guide
• SAS Information Delivery Portal
• SAS Web Report Studio
For a complete list of SAS publications, go to support.sas.com/bookstore. Ifyou have questions about which titles you need, please contact a SAS Publishing SalesRepresentative at:
SAS Publishing Sales
SAS Campus Drive
Cary, NC 27513
Telephone: 1-800-727-3228
Fax: 1-919-531-9439
E-mail: [email protected]
Web address: support.sas.com/bookstore
Customers outside the United States and Canada, please contact your local SAS officefor assistance.
213

214 Appendix 6 • Recommended Reading

Index
Numbers2XY plots
example 200standards 150
Aaccessibility 7Adapter Setup wizard 10
defined 19deploying and running jobs 29domain categories 30Gallery transformations created 76report jobs 26, 70report types created 31using 20
adapters 4axis standards for reports 148
Bbackups
data and reports 166reports on SAS Content Server 109
bar chart standards 151Bar Chart task 177
examples 180bar line standards 151batch reporting 10
creating new reports from scratch 43creating or modifying batch reports 35designing reports 165modifying data sources 36modifying report definitions 40modifying the appearance of batch
reports 37style sheets for 88templates 88using a supplied project as a template
41viewing reports 31
box plot standards 151Box Plot task examples 193BY variables in reports 149
Ccolor standards for reports 148converting reports 170
Ddata sources
modifying for batch reporting 36specifying location 85
documentationSAS Add-In for Microsoft Office 128SAS BI Dashboard 135SAS Enterprise Guide 117SAS Information Delivery Portal 132SAS IT Resource Management 6SAS Web Report Studio 123
domain categories 30dynamically summarized reporting 210
Ffonts and formats for reports 149footnotes for reports 147
GGallery Manager 5
Action buttons 104banner 98Browse pane 98cache 108copying and e-mailing reports 97Favorites pane 103Filters pane 99Flow view 102Gallery pane 100
215

logging on 97organizing reports 94overview 93status bar 103Table view 101Thumbnail view 102use of SAS Content Server 108viewing reports 95
Gallery transformations 13, 74adding to report jobs 76created by Adapter Setup wizard 76deleting 85editing 84editing properties 72naming conventions 77, 143properties 75
HHelp
SAS Add-In for Microsoft Office 128SAS BI Dashboard 135SAS Enterprise Guide 117SAS Information Delivery Portal 132SAS IT Resource Management 6SAS Web Report Studio 123
Hi-Low subtask 194
Iinformation maps
creating reports in SAS Web ReportStudio 122
for batch reporting 12modifying for batch reporting 36naming conventions 139
interactive reporting 113IT data marts
accessing with SAS Enterprise Guide116
ITRM folder 108ITRM Gallery task
accessing and navigating 60deleting user-defined report filter values
66for batch reporting 12managing user-defined report filters 65modifying report definitions 67sharing user-defined report filter values
67working with in SAS Enterprise Guide
59
Lline plot standards 150
Line Plot task 189examples 191, 196, 198, 200
list data standards for reports 151listing report example 209
MMicrosoft Office 5, 125migration wizard 51
prerequisites 51running 51
Nnaming conventions
Gallery transformations 77, 143information maps 139report jobs 143reporting 139, 143SAS Enterprise Guide projects 142
needle plot standards 150
Oonline Help
See Helpoptions for report tasks 172output for reports 173
PPDBs 210Pie Chart task 177
examples 187plots 189portal
See SAS Information Delivery Portalprint report example 209printing reports 174projects, SAS Enterprise Guide 45, 162publishing reports 128
Rreference line standards for reports 149report definitions 12
creating with ITRM Gallery task 59modifying for batch reports 40modifying with ITRM Gallery task 67
report jobs 13, 69adding Gallery transformations 76copying 72created by Adapter Setup wizard 26, 70creating 71deleting 72deploying and running 73
216 Index

modifying 71naming conventions 143scheduling 167
report tasks 171Bar Chart 177Hi-Low 194Line Plot 189options 172Pie Chart 177Stack Columns 174, 197Step Plot 192
reportingbatch 10dynamically summarized 210interactive 113naming conventions 139, 143standards 145Top N and Bottom N 173
reports2XY plot standards 150axis standards 148backing up 154backing up on SAS Content Server 109bar chart standards 151bar line standards 151box plot standards 151BY variables in 149color standards 148converting 170copying 97created by Adapter Setup wizard 31creating new batch reports from scratch
43creating with information maps in SAS
Web Report Studio 122deleting sample 109designing for batch jobs 165duplicate 154e-mailing 97, 123fonts and formats 149footnotes 147generating with SAS Enterprise Guide
projects 46interactive 113limiting retrieval by filters 161line plot standards 150list data standards 151managing user-defined settings for
filters 65missing 155modifying in SAS Enterprise Guide
projects 56needle plot standards 150organizing 94output 13, 173overriding expiration dates 166
printing 174publishing 128purging from SAS Content Server 166reference line standards 149running during low usage periods 161standards 145symbol standards 149titles 146viewing 95
SSAS Add-In for Microsoft Office 5, 125
accessing 125accessing SAS IT Resource
Management data 126documentation 128executing stored processes 127Help 128
SAS BI Dashboard 5, 133documentation 135Help 135logging on 134
SAS Business Intelligence Platform 5SAS Content Server 107
backing up reports 109duplicate reports 154purging reports 166storage of report output 13, 107
SAS Data Integration Studio 4SAS Enterprise Guide 5, 115
accessing IT data marts 116accessing SAS IT Resource
Management projects 116accessing SAS Metadata Repository 49documentation 117Help 117managing projects 162migrating projects 51modifying reports in supplied projects
56naming conventions for projects 142preparing to work 49projects for batch reporting 12, 38report tasks 171running source code 210setting up for ITRM data 49starting 115working with ITRM Gallery task 59working with supplied projects 45
SAS High Performance Forecasting 5SAS Information Delivery Portal 5, 129
accessing 129documentation 132Help 132logging off 130
Index 217
organization of content 130SAS Information Map Studio 5SAS IT Resource Management
accessing data with SAS Add-In forMicrosoft Office 126
accessing projects with SAS EnterpriseGuide 116
benefits 4defined 3documentation 6Help 6operation 4
SAS Metadata Repository 5accessing for SAS Enterprise Guide 49
SAS Statistics and Econometric TimeSeries 5
SAS Web Report Studio 5, 119creating reports with information maps
122documentation 123Help 123logging on 119
Scatter Plot task example 195scheduling report jobs 167Section 508 compliance 7source code
running in SAS Enterprise Guide 210Stack Columns task 174
example 197Stack Plot task examples 199standards for reporting 145Step Plot subtask 192stored processes 127style sheets 86
default 87
for batch reports 88symbol standards for reports 149
Ttabular reports 201
examples 203templates 86
default 86for batch reports 88for color, pattern, and symbol options
173three-dimensional graph example 201tile charts with Web links 166titles for reports 146Top N and Bottom N reporting 173troubleshooting
duplicate reports on SAS ContentServer 154
embedded user ID and password 153invalid password 153invalid user ID 153middle-tier connection 158reports missing from Gallery Manager
155reports missing when running report
jobs 155SAS Content Server 157user ID and password in generated code
153user permissions 155
WWeb links for tile charts 166
218 Index