sarc report for equitas academy charter school · equitas academy charter school by february 1 of...
TRANSCRIPT

Equitas Academy Charter School
By February 1 of each year, every school in California is required by state law to publish a School Accountability Report Card (SARC).The SARC contains information aboutthe condit ion and performance of each California public school. Under the Local Control Funding Formula (LCFF) all local educat ional agencies (LEAs) are required toprepare a Local Control Accountability Plan (LCAP), which describes how they intend to meet annual school-specific goals for all pupils, w ith specific act ivit ies to addressstate and local priorit ies. Addit ionally, data reported in an LCAP is to be consistent w ith data reported in the SARC.
For more information about SARC requirements, see the California Department of Educat ion (CDE) SARC Web page at http://www.cde.ca.gov/ta/ac/sa/.
For more information about the LCFF or LCAP, see the CDE LCFF Web page at http://www.cde.ca.gov/fg/aa/lc/.
For addit ional information about the school, parents/guardians, and community members should contact the school principal or the district office.
DataQuest
Internet Access
California Department of Education
School Accountability Report CardReported Using Data from the 2014-15 School Year
Published During 2015-16
DataQuest is an online data tool located on the CDE DataQuest Web page that contains addit ional information about this school and comparisons of the school tothe district , the county, and the state. Specifically, DataQuest is a dynamic system that provides reports for accountability (e.g., test data, enrollment, highschool graduates, dropouts, course enrollments, staffing, and data regarding English learners.
Internet access is available at public libraries and other locat ions that are publicly accessible (e.g., the California State Library). Access to the Internet at librariesand public locat ions is generally provided on a first-come, first-served basis. Other use restrict ions may include the hours of operat ion, the length of t ime that aworkstat ion may be used (depending on availability), the types of software programs available on a workstat ion, and the ability to print documents.
Kelli Kilty, DirectorPrincipal, Equitas Academy Charter School
Mission Statement
Equitas Academy provides a structured, achievement-based community that prepares students to graduate from four-yearcolleges and universit ies.
About Equitas Academy Charter School
Equitas Academy Charter School is a free public elementary school for parents who believe their child deserves a high-quality educat ion and challenging school experience. Our school model offers credent ialed, passionate, and dedicatedteachers and staff who are experts in their field.
Equitas Academy Charter School has a strong focus on the follow ing:
High Expectations. We believe in structured and disciplined classrooms, have school-w ide behavioral code of conduct,and school uniforms. Our school has an educat ional program that enables students, despite obstacles, to learn to read,write, and compute at or above grade level. We have a strong character educat ion component that w ill serve ourstudents through the many life challenges they may face in accessing higher educat ion.
College Readiness. Equitas Academy has an extended school day and year, enrichment act ivit ies, and providespreparat ion to enter top-performing middle, high schools and ult imately college. We believe students must have access toan achievement-oriented learning environment, beginning in kindergarten and extending to the doors of high school toensure all students make a smooth transit ion to the demands of college preparatory high schools w ith the ult imate goal ofcollege graduat ion. We created a school w ith a college preparatory focus in the elementary grades so students are ableto develop the foundat ional skills necessary for entrance into high-performing secondary schools.
A Family Partnership. We focus on ongoing communicat ion w ith parents about academic and behavioral progress, at-home visits by staff, and family workshops. Equitas Academy enriches the lives of students and their families by helping ourfamilies support their children on their journey to college.
A Safe & Supportive School Community. We help our children make posit ive choices through our focus on our schoolvalues of curiosity, opt imism, grat itude, grit , self-control, social intelligence, and zest.
About Our SchoolAbout Our School

Results. Our scholars have outperformed the State and District on the CSTs. Our API for 2012-2013 is 894.We arefocused on using data-driven instruct ion in order to meet the needs of each an every child who attends EquitasAcademy. Consistent and targeted intervent ion is provided to all students based on individual needs.
At Equitas Academy we are determined in accomplishing our mission of preparing 100% of our students to be successfulin college and beyond.
Equitas Academy Charter School1700 West Pico BlvdLos Angeles, CA 90015-2412
Phone: 213-201-0440E-mail: [email protected]
ContactContact
2014-15 SARC - Equitas Academy Charter School
Page 2 of 35

Last updated: 2/1/2016
Last updated: 1/12/2016
About This School
Contact Information - Most Recent YearContact Information - Most Recent Year
District Contact Information - Most Recent Year
District Name Los Angeles Unified School District
Phone Number (213) 241-1000
Superintendent Michelle King
E-mail Address [email protected]
Web Site www.lausd.net
School Contact Information - Most Recent Year
School Name Equitas Academy Charter School
Street 1700 West Pico Blvd
City, State, Zip Los Angeles, Ca, 90015-2412
Phone Number 213-201-0440
Principal Kelli Kilty, Director
E-mail Address [email protected]
Web Site www.equitasacademy.org
County-District-School (CDS) Code
19647330119982
School Description and Mission Statement - Most Recent YearSchool Description and Mission Statement - Most Recent Year
Equitas Academy provides a structured, achievement-based community that prepares students to graduate from college-preparatory high schools, four-yearcolleges and universit ies
Equitas Academy believes students must have access to an achievement-oriented learning environment, beginning in kindergarten to ensure all students make asmooth transit ion to cope w ith the demands of college preparatory middle and high schools w ith the ult imate goal of college graduat ion. We envision a schoolw ith a college preparatory focus in the primary grades, so students are able to develop the foundat ional skills necessary for entrance into high-performing middleand secondary schools. The vision is a school w ith a grade span, curriculum, and educat ional program that w ill allow students, despite any obstacles, to learn toread, write, and compute on or above grade level, to develop the academic and character skills that w ill serve them through the many life challenges they mayface in accessing higher educat ion.
2014-15 SARC - Equitas Academy Charter School
Page 3 of 35

Last updated: 1/12/2016
Last updated: 1/12/2016
Student Enrollment by Grade Level (School Year 2014-15)Student Enrollment by Grade Level (School Year 2014-15)
Grade Level Number of Students
Kindergarten 85
Grade 1 76
Grade 2 124
Grade 3 101
Grade 4 63
Total Enrollment 449
Kindergarten Grade 1 Grade 2 Grade 3 Grade 40
20
40
60
80
100
120
140
Student Enrollment by Student Group (School Year 2014-15)Student Enrollment by Student Group (School Year 2014-15)
Student Group Percent of Total Enrollment
Black or African American 1.3 %
American Indian or Alaska Nat ive 0.0 %
Asian 0.9 %
Filipino 0.7 %
Hispanic or Lat ino 94.9 %
Native Hawaiian or Pacific Islander 0.0 %
White 1.8 %
Two or More Races 0.2 %
Socioeconomically Disadvantaged 95.8 %
English Learners 46.8 %
Students w ith Disabilit ies 10.5 %
Foster Youth 0.2 %
Black or African American
American Indian or A laska Native
Asian
Filipino
Hispanic or Latino
Native Hawaiian or Pacific Islander
White
Two or More Races
Socioeconomically Disadvantaged
English Learners
Students with Disabilities
Foster Youth
1%
94%
1%95%
46%
10%
2014-15 SARC - Equitas Academy Charter School
Page 4 of 35

Last updated: 1/29/2016
Last updated: 1/12/2016
A. Conditions of Learning
State Priority: Basic
The SARC provides the follow ing information relevant to the State priority: Basic (Priority 1):
Degree to which teachers are appropriately assigned and fully credent ialed in the subject area and for the pupils they are teaching;Pupils have access to standards-aligned instruct ional materials; andSchool facilit ies are maintained in good repair
Note: “Misassignments” refers to the number of posit ions filled by teachers who lack legal authorizat ion to teach that grade level, subject area, student group, etc.
* Total Teacher Misassignments includes the number of Misassignments of Teachers of English learners.
Teacher CredentialsTeacher Credentials
Teachers School District
2013-14
2014-15
2015-16
2015-16
With Full Credent ial 17 17 17
Without Full Credent ial 0 0 0
Teachers Teaching Outside SubjectArea of Competence (w ith fullcredent ial)
0 0 0
2013-14 2014-15 2015-160.0
2.5
5.0
7.5
10.0
12.5
15.0
17.5Teachers with Full Credential
Teachers without Full Credential
Teachers Teaching Outside Subject Area of Competence
Teacher Misassignments and Vacant Teacher PositionsTeacher Misassignments and Vacant Teacher Positions
Indicator2013-
142014-
152015-
16
Misassignments of Teachers of EnglishLearners
Total Teacher Misassignments*
Vacant Teacher Posit ions
2013-14 2014-15 2015-16-1.0
-0.5
0.0
0.5
1.0Misassignments of Teachers of English Learners
Total Teacher Misassignments
Vacant Teacher Positions
2014-15 SARC - Equitas Academy Charter School
Page 5 of 35

Last updated: 1/29/2016
Note: High-poverty schools are defined as those schools w ith student eligibility of approximately 40 percent or more in the free and reduced price meals program. Low-poverty schools are those w ith student eligibility of approximately 39 percent or less in the free and reduced price meals program.
Year and month in which data were collected: September 2015
Core Academic Classes Taught by Highly Qualified Teachers (School Year 2014-15)Core Academic Classes Taught by Highly Qualified Teachers (School Year 2014-15)
Location of ClassesPercent of Classes In Core Academic Subjects Taught by
Highly Qualified TeachersPercent of Classes In Core Academic Subjects Not Taught by
Highly Qualified Teachers
This School 100.0% 0.0%
All Schools in District 88.0% 12.0%
High-Poverty Schoolsin District
93.0% 7.0%
Low-Poverty Schoolsin District
45.0% 55.0%
Quality, Currency, Availability of Textbooks and Instructional Materials - Most Recent YearQuality, Currency, Availability of Textbooks and Instructional Materials - Most Recent Year
Subject Textbooks and Instructional Materials/year of Adoption
From MostRecent
Adoption?
PercentStudentsLacking
OwnAssigned
Copy
Reading/LanguageArts Teachers design rigorous, Common Core aligned units and lessons for reading comprehension, language, vocabulary,
and foundat ional skills using Ready Common Core. All students receive different iated reading lessons via the onlinereading program Lexia. Students are assessed using teacher and district created assessments, as well as the NWEA
MAP assessments. Reading is also taught in small groups using the Fountas and Pinnell guided reading model. Allstudents have access to leveled books for their reading group studies. We use the Fountas and Pinnell BenchmarkAssessment system to track reading growth. Students in kindergarten through third grade w ill receive intensive
phonics and phonemic awareness instruct ion using SRA Reading Mastery to ensure they have a solid foundat ion infundamental reading skills.’ Teachers in Kindergarten and First Grade supplement the Reading Mastery Program w iththe Jolly Phonics to support the learning of the alphabet and the sound/symbol correlat ion. For writ ing, we adopted
Units of Study in Opinion, Information, and Narrat ive Writ ing by Lucy Calkins, publish by Heinemann as our corecurriculum in 2014. Teachers in grades 2-4 supplement the Lucy Calkin’s units w ith academic writ ing units from ReadyCommon Core. For grammar, our teachers create lessons using resources from SchoolW ide Grammar as well as ReadyCommon Core. Students are assessed using program assessments, teacher and district created assessments, as well
as the NWEA MAP assessments.
Yes 0.0 %
MathematicsTeachers develop rigorous, Common Core aligned units and lessons using Eureka Math as the core math curriculum.All students receive different iated math lessons via the online math program DreamBox. Students are assessed using
program assessments, teacher and district created assessments, as well as the NWEA MAP assessments.
Yes 0.0 %
ScienceTeachers use FOSS kits to write rigorous science units and lessons. Teachers supplement their lessons w ith videos
from BrainPOP and PBS Learning Media. To align our science program to the Common Core standards, they alsointegrate the reading of science art icles from various sources into their lessons.
Yes 0.0 %
History-SocialScience Teachers write rigorous social studies units and lessons based on the California State Standards. Teachers supplement
their lessons w ith videos from BrainPOP and PBS Learning Media as well as primary sources from various sites such asCalisphere and the Nat ional History Archive. To align our social studies program to the Common Core standards, they
also integrate the reading of art icles from various sources into their lessons.
Yes 0.0 %
Foreign Language 0.0 %
Health 0.0 %
Visual andPerforming Arts
0.0 %
Science LabEqpmt (Grades 9-12)
0.0 %
2014-15 SARC - Equitas Academy Charter School
Page 6 of 35

Last updated: 1/19/2016
Last updated: 1/27/2016
School Facility Good Repair Status - Most Recent YearYear and month in which data were collected: January 2015
Overall Facility Rate - Most Recent YearYear and month in which data were collected: January 2015
School Facility Conditions and Planned Improvements - Most Recent YearSchool Facility Conditions and Planned Improvements - Most Recent Year
Equitas Academy resides in a brand new facility located in the Pico Union area of Los Angeles less then a mile away from Downtown Los Angeles. The schoolbuilding has 18 classrooms, a main office, a teacher’s workroom space, a large mult i purpose room, a lunch distribut ion room and a playground. The building is fullyenclosed w ith a rear gated parking lot. The facility is equipped w ith a security alarm and cameras. In 2013-2014 Equitas Academy received a grant from KaBOOMthat allowed for the installat ion of a permanent shade system over the playground.
System Inspected RatingRepair Needed and Action
Taken or Planned
Systems: Gas Leaks,Mechanical/HVAC, Sewer
Good
Interior: Interior Surfaces Good
Cleanliness: Overall Cleanliness,Pest/Vermin Infestat ion
Good
Electrical: Electrical Good
Restrooms/Fountains: Restrooms,Sinks/Fountains
Good
Safety: Fire Safety, HazardousMaterials
Good
Structural: Structural Damage, Roofs FairEquitas is working w ith
Everlast to repair, clean andseal roof.
External: Playground/School Grounds,W indows/Doors/Gates/Fences
Good
Overall Rat ing Good
2014-15 SARC - Equitas Academy Charter School
Page 7 of 35
Last updated: 1/12/2016
B. Pupil Outcomes
State Priority: Pupil Achievement
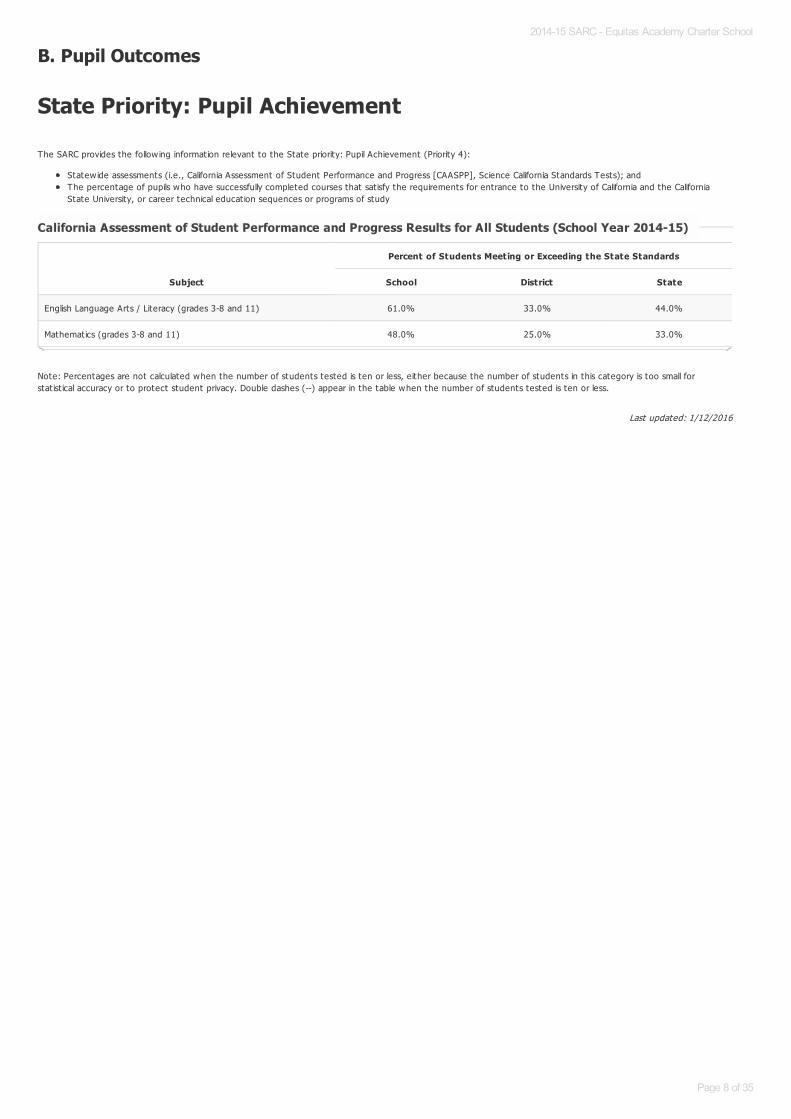
The SARC provides the follow ing information relevant to the State priority: Pupil Achievement (Priority 4):
Statew ide assessments (i.e., California Assessment of Student Performance and Progress [CAASPP], Science California Standards Tests); andThe percentage of pupils who have successfully completed courses that sat isfy the requirements for entrance to the University of California and the CaliforniaState University, or career technical educat ion sequences or programs of study
Note: Percentages are not calculated when the number of students tested is ten or less, either because the number of students in this category is too small forstat ist ical accuracy or to protect student privacy. Double dashes (--) appear in the table when the number of students tested is ten or less.
California Assessment of Student Performance and Progress Results for All Students (School Year 2014-15)California Assessment of Student Performance and Progress Results for All Students (School Year 2014-15)
Subject
Percent of Students Meeting or Exceeding the State Standards
School District State
English Language Arts / Literacy (grades 3-8 and 11) 61.0% 33.0% 44.0%
Mathematics (grades 3-8 and 11) 48.0% 25.0% 33.0%
2014-15 SARC - Equitas Academy Charter School
Page 8 of 35
Last updated: 1/12/2016
Double dashes (--) appear in the table when the number of students is ten or less, either because the number of students in this category is too small for stat ist icalaccuracy or to protect student privacy.
Note: The number of students tested includes students that did not receive a score; however the number of students tested is not the number that was used tocalculate the achievement level percentages. The achievement level percentages are calculated using students w ith scores.
* Level 1 = Standard not met Level 2 = Standard nearly met Level 3 = Standard met Level 4 = Standard exceeded
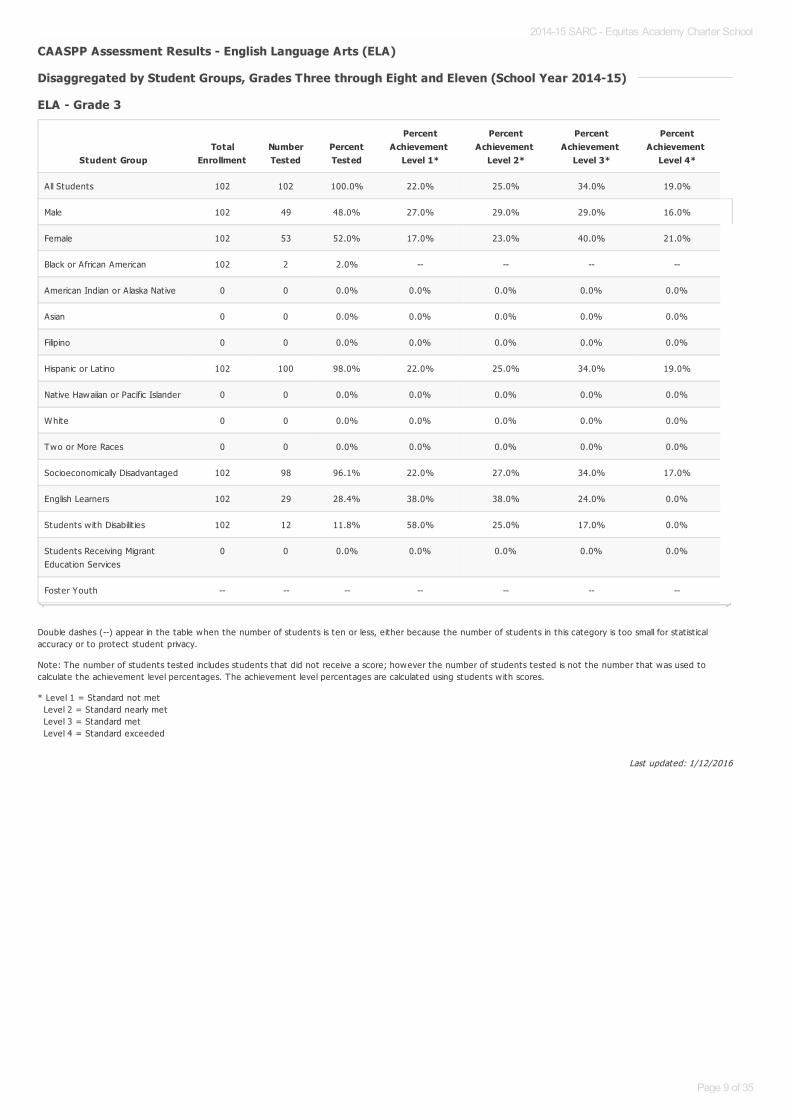
CAASPP Assessment Results - English Language Arts (ELA) CAASPP Assessment Results - English Language Arts (ELA)
Disaggregated by Student Groups, Grades Three through Eight and Eleven (School Year 2014-15)Disaggregated by Student Groups, Grades Three through Eight and Eleven (School Year 2014-15)
ELA - Grade 3ELA - Grade 3
Student GroupTotal
EnrollmentNumberTested
PercentTested
PercentAchievement
Level 1*
PercentAchievement
Level 2*
PercentAchievement
Level 3*
PercentAchievement
Level 4*
All Students 102 102 100.0% 22.0% 25.0% 34.0% 19.0%
Male 102 49 48.0% 27.0% 29.0% 29.0% 16.0%
Female 102 53 52.0% 17.0% 23.0% 40.0% 21.0%
Black or African American 102 2 2.0% -- -- -- --
American Indian or Alaska Nat ive 0 0 0.0% 0.0% 0.0% 0.0% 0.0%
Asian 0 0 0.0% 0.0% 0.0% 0.0% 0.0%
Filipino 0 0 0.0% 0.0% 0.0% 0.0% 0.0%
Hispanic or Lat ino 102 100 98.0% 22.0% 25.0% 34.0% 19.0%
Native Hawaiian or Pacific Islander 0 0 0.0% 0.0% 0.0% 0.0% 0.0%
White 0 0 0.0% 0.0% 0.0% 0.0% 0.0%
Two or More Races 0 0 0.0% 0.0% 0.0% 0.0% 0.0%
Socioeconomically Disadvantaged 102 98 96.1% 22.0% 27.0% 34.0% 17.0%
English Learners 102 29 28.4% 38.0% 38.0% 24.0% 0.0%
Students w ith Disabilit ies 102 12 11.8% 58.0% 25.0% 17.0% 0.0%
Students Receiving MigrantEducat ion Services
0 0 0.0% 0.0% 0.0% 0.0% 0.0%
Foster Youth -- -- -- -- -- -- --
2014-15 SARC - Equitas Academy Charter School
Page 9 of 35

Last updated: 1/12/2016
Double dashes (--) appear in the table when the number of students is ten or less, either because the number of students in this category is too small for stat ist icalaccuracy or to protect student privacy.
Note: The number of students tested includes students that did not receive a score; however the number of students tested is not the number that was used tocalculate the achievement level percentages. The achievement level percentages are calculated using students w ith scores.
* Level 1 = Standard not met Level 2 = Standard nearly met Level 3 = Standard met Level 4 = Standard exceeded
ELA - Grade 4ELA - Grade 4
Student GroupTotal
EnrollmentNumberTested
PercentTested
PercentAchievement
Level 1*
PercentAchievement
Level 2*
PercentAchievement
Level 3*
PercentAchievement
Level 4*
All Students 63 63 100.0% 10.0% 16.0% 17.0% 57.0%
Male 63 36 57.1% 17.0% 19.0% 19.0% 44.0%
Female 63 27 42.9% 0.0% 11.0% 15.0% 74.0%
Black or African American 63 1 1.6% -- -- -- --
American Indian or Alaska Nat ive 0 0 0.0% 0.0% 0.0% 0.0% 0.0%
Asian 0 0 0.0% 0.0% 0.0% 0.0% 0.0%
Filipino 63 1 1.6% -- -- -- --
Hispanic or Lat ino 63 60 95.2% 10.0% 17.0% 18.0% 55.0%
Native Hawaiian or Pacific Islander 0 0 0.0% 0.0% 0.0% 0.0% 0.0%
White 63 1 1.6% -- -- -- --
Two or More Races 0 0 0.0% 0.0% 0.0% 0.0% 0.0%
Socioeconomically Disadvantaged 63 61 96.8% 10.0% 16.0% 18.0% 56.0%
English Learners 63 14 22.2% 21.0% 50.0% 29.0% 0.0%
Students w ith Disabilit ies 63 7 11.1% -- -- -- --
Students Receiving MigrantEducat ion Services
0 0 0.0% 0.0% 0.0% 0.0% 0.0%
Foster Youth -- -- -- -- -- -- --
2014-15 SARC - Equitas Academy Charter School
Page 10 of 35

Last updated: 1/19/2016
Double dashes (--) appear in the table when the number of students is ten or less, either because the number of students in this category is too small for stat ist icalaccuracy or to protect student privacy.
Note: The number of students tested includes students that did not receive a score; however the number of students tested is not the number that was used tocalculate the achievement level percentages. The achievement level percentages are calculated using students w ith scores.
* Level 1 = Standard not met Level 2 = Standard nearly met Level 3 = Standard met Level 4 = Standard exceeded
ELA - Grade 5ELA - Grade 5
Student GroupTotal
EnrollmentNumberTested
PercentTested
PercentAchievement
Level 1*
PercentAchievement
Level 2*
PercentAchievement
Level 3*
PercentAchievement
Level 4*
All Students -- -- -- -- -- -- --
Male -- -- -- -- -- -- --
Female -- -- -- -- -- -- --
Black or African American -- -- -- -- -- -- --
American Indian or Alaska Nat ive -- -- -- -- -- -- --
Asian -- -- -- -- -- -- --
Filipino -- -- -- -- -- -- --
Hispanic or Lat ino -- -- -- -- -- -- --
Nat ive Hawaiian or Pacific Islander -- -- -- -- -- -- --
White -- -- -- -- -- -- --
Two or More Races -- -- -- -- -- -- --
Socioeconomically Disadvantaged -- -- -- -- -- -- --
English Learners -- -- -- -- -- -- --
Students w ith Disabilit ies -- -- -- -- -- -- --
Students Receiving MigrantEducat ion Services
-- -- -- -- -- -- --
Foster Youth -- -- -- -- -- -- --
2014-15 SARC - Equitas Academy Charter School
Page 11 of 35

Last updated: 1/19/2016
Double dashes (--) appear in the table when the number of students is ten or less, either because the number of students in this category is too small for stat ist icalaccuracy or to protect student privacy.
Note: The number of students tested includes students that did not receive a score; however the number of students tested is not the number that was used tocalculate the achievement level percentages. The achievement level percentages are calculated using students w ith scores.
* Level 1 = Standard not met Level 2 = Standard nearly met Level 3 = Standard met Level 4 = Standard exceeded
ELA- ELA- Grade 6Grade 6
Student GroupTotal
EnrollmentNumberTested
PercentTested
PercentAchievement
Level 1*
PercentAchievement
Level 2*
PercentAchievement
Level 3*
PercentAchievement
Level 4*
All Students -- -- -- -- -- -- --
Male -- -- -- -- -- -- --
Female -- -- -- -- -- -- --
Black or African American -- -- -- -- -- -- --
American Indian or Alaska Nat ive -- -- -- -- -- -- --
Asian -- -- -- -- -- -- --
Filipino -- -- -- -- -- -- --
Hispanic or Lat ino -- -- -- -- -- -- --
Nat ive Hawaiian or Pacific Islander -- -- -- -- -- -- --
White -- -- -- -- -- -- --
Two or More Races -- -- -- -- -- -- --
Socioeconomically Disadvantaged -- -- -- -- -- -- --
English Learners -- -- -- -- -- -- --
Students w ith Disabilit ies -- -- -- -- -- -- --
Students Receiving MigrantEducat ion Services
-- -- -- -- -- -- --
Foster Youth -- -- -- -- -- -- --
2014-15 SARC - Equitas Academy Charter School
Page 12 of 35

Last updated: 1/19/2016
Double dashes (--) appear in the table when the number of students is ten or less, either because the number of students in this category is too small for stat ist icalaccuracy or to protect student privacy.
Note: The number of students tested includes students that did not receive a score; however the number of students tested is not the number that was used tocalculate the achievement level percentages. The achievement level percentages are calculated using students w ith scores.
* Level 1 = Standard not met Level 2 = Standard nearly met Level 3 = Standard met Level 4 = Standard exceeded
ELA - Grade 7ELA - Grade 7
Student GroupTotal
EnrollmentNumberTested
PercentTested
PercentAchievement
Level 1*
PercentAchievement
Level 2*
PercentAchievement
Level 3*
PercentAchievement
Level 4*
All Students -- -- -- -- -- -- --
Male -- -- -- -- -- -- --
Female -- -- -- -- -- -- --
Black or African American -- -- -- -- -- -- --
American Indian or Alaska Nat ive -- -- -- -- -- -- --
Asian -- -- -- -- -- -- --
Filipino -- -- -- -- -- -- --
Hispanic or Lat ino -- -- -- -- -- -- --
Nat ive Hawaiian or Pacific Islander -- -- -- -- -- -- --
White -- -- -- -- -- -- --
Two or More Races -- -- -- -- -- -- --
Socioeconomically Disadvantaged -- -- -- -- -- -- --
English Learners -- -- -- -- -- -- --
Students w ith Disabilit ies -- -- -- -- -- -- --
Students Receiving MigrantEducat ion Services
-- -- -- -- -- -- --
Foster Youth -- -- -- -- -- -- --
2014-15 SARC - Equitas Academy Charter School
Page 13 of 35

Last updated: 1/19/2016
Double dashes (--) appear in the table when the number of students is ten or less, either because the number of students in this category is too small for stat ist icalaccuracy or to protect student privacy.
Note: The number of students tested includes students that did not receive a score; however the number of students tested is not the number that was used tocalculate the achievement level percentages. The achievement level percentages are calculated using students w ith scores.
* Level 1 = Standard not met Level 2 = Standard nearly met Level 3 = Standard met Level 4 = Standard exceeded
ELA - Grade 8ELA - Grade 8
Student GroupTotal
EnrollmentNumberTested
PercentTested
PercentAchievement
Level 1*
PercentAchievement
Level 2*
PercentAchievement
Level 3*
PercentAchievement
Level 4*
All Students -- -- -- -- -- -- --
Male -- -- -- -- -- -- --
Female -- -- -- -- -- -- --
Black or African American -- -- -- -- -- -- --
American Indian or Alaska Nat ive -- -- -- -- -- -- --
Asian -- -- -- -- -- -- --
Filipino -- -- -- -- -- -- --
Hispanic or Lat ino -- -- -- -- -- -- --
Nat ive Hawaiian or Pacific Islander -- -- -- -- -- -- --
White -- -- -- -- -- -- --
Two or More Races -- -- -- -- -- -- --
Socioeconomically Disadvantaged -- -- -- -- -- -- --
English Learners -- -- -- -- -- -- --
Students w ith Disabilit ies -- -- -- -- -- -- --
Students Receiving MigrantEducat ion Services
-- -- -- -- -- -- --
Foster Youth -- -- -- -- -- -- --
2014-15 SARC - Equitas Academy Charter School
Page 14 of 35
Last updated: 1/19/2016
Double dashes (--) appear in the table when the number of students is ten or less, either because the number of students in this category is too small for stat ist icalaccuracy or to protect student privacy.
Note: The number of students tested includes students that did not receive a score; however the number of students tested is not the number that was used tocalculate the achievement level percentages. The achievement level percentages are calculated using students w ith scores.
* Level 1 = Standard not met Level 2 = Standard nearly met Level 3 = Standard met Level 4 = Standard exceeded
ELA - Grade 11ELA - Grade 11
Student GroupTotal
EnrollmentNumberTested
PercentTested
PercentAchievement
Level 1*
PercentAchievement
Level 2*
PercentAchievement
Level 3*
PercentAchievement
Level 4*
All Students -- -- -- -- -- -- --
Male -- -- -- -- -- -- --
Female -- -- -- -- -- -- --
Black or African American -- -- -- -- -- -- --
American Indian or Alaska Nat ive -- -- -- -- -- -- --
Asian -- -- -- -- -- -- --
Filipino -- -- -- -- -- -- --
Hispanic or Lat ino -- -- -- -- -- -- --
Nat ive Hawaiian or Pacific Islander -- -- -- -- -- -- --
White -- -- -- -- -- -- --
Two or More Races -- -- -- -- -- -- --
Socioeconomically Disadvantaged -- -- -- -- -- -- --
English Learners -- -- -- -- -- -- --
Students w ith Disabilit ies -- -- -- -- -- -- --
Students Receiving MigrantEducat ion Services
-- -- -- -- -- -- --
Foster Youth -- -- -- -- -- -- --
2014-15 SARC - Equitas Academy Charter School
Page 15 of 35

Last updated: 1/29/2016
Double dashes (--) appear in the table when the number of students is ten or less, either because the number of students in this category is too small for stat ist icalaccuracy or to protect student privacy.
Note: The number of students tested includes students that did not receive a score; however the number of students tested is not the number that was used tocalculate the achievement level percentages. The achievement level percentages are calculated using students w ith scores.
* Level 1 = Standard not met Level 2 = Standard nearly met Level 3 = Standard met Level 4 = Standard exceeded
CAASPP Assessment Results - Mathematics CAASPP Assessment Results - Mathematics
Disaggregated by Student Groups, Grades Three through Eight and Eleven (School Year 2014-15)Disaggregated by Student Groups, Grades Three through Eight and Eleven (School Year 2014-15)
Mathematics - Grade 3Mathematics - Grade 3
Student GroupTotal
EnrollmentNumberTested
PercentTested
PercentAchievement
Level 1*
PercentAchievement
Level 2*
PercentAchievement
Level 3*
PercentAchievement
Level 4*
All Students 102 102 100.0% 25.0% 38.0% 25.0% 12.0%
Male 102 49 48.0% 24.0% 35.0% 29.0% 12.0%
Female 102 53 52.0% 26.0% 42.0% 21.0% 11.0%
Black or African American 102 2 2.0% -- -- -- --
American Indian or Alaska Nat ive 0 0 0.0% 0.0% 0.0% 0.0% 0.0%
Asian 0 0 0.0% 0.0% 0.0% 0.0% 0.0%
Filipino 0 0 0.0% 0.0% 0.0% 0.0% 0.0%
Hispanic or Lat ino 102 100 98.0% 25.0% 39.0% 24.0% 12.0%
Native Hawaiian or Pacific Islander 0 0 0.0% 0.0% 0.0% 0.0% 0.0%
White 0 0 0.0% 0.0% 0.0% 0.0% 0.0%
Two or More Races 0 0 0.0% 0.0% 0.0% 0.0% 0.0%
Socioeconomically Disadvantaged 102 98 96.1% 27.0% 40.0% 24.0% 9.0%
English Learners 102 29 28.4% 28.0% 62.0% 10.0% 0.0%
Students w ith Disabilit ies 102 12 11.8% 42.0% 42.0% 17.0% 0.0%
Students Receiving MigrantEducat ion Services
0 0 0.0% 0.0% 0.0% 0.0% 0.0%
Foster Youth -- -- -- -- -- -- --
2014-15 SARC - Equitas Academy Charter School
Page 16 of 35

Last updated: 1/29/2016
Double dashes (--) appear in the table when the number of students is ten or less, either because the number of students in this category is too small for stat ist icalaccuracy or to protect student privacy.
Note: The number of students tested includes students that did not receive a score; however the number of students tested is not the number that was used tocalculate the achievement level percentages. The achievement level percentages are calculated using students w ith scores.
* Level 1 = Standard not met Level 2 = Standard nearly met Level 3 = Standard met Level 4 = Standard exceeded
Mathematics - Grade 4Mathematics - Grade 4
Student GroupTotal
EnrollmentNumberTested
PercentTested
PercentAchievement
Level 1*
PercentAchievement
Level 2*
PercentAchievement
Level 3*
PercentAchievement
Level 4*
All Students 63 63 100.0% 3.0% 30.0% 44.0% 22.0%
Male 63 36 57.1% 6.0% 33.0% 42.0% 19.0%
Female 63 27 42.9% 0.0% 26.0% 48.0% 26.0%
Black or African American 63 1 1.6% -- -- -- --
American Indian or Alaska Nat ive 0 0 0.0% 0.0% 0.0% 0.0% 0.0%
Asian 0 0 0.0% 0.0% 0.0% 0.0% 0.0%
Filipino 63 1 1.6% -- -- -- --
Hispanic or Lat ino 63 60 95.2% 3.0% 30.0% 45.0% 22.0%
Native Hawaiian or Pacific Islander 0 0 0.0% 0.0% 0.0% 0.0% 0.0%
White 63 1 1.6% -- -- -- --
Two or More Races 0 0 0.0% 0.0% 0.0% 0.0% 0.0%
Socioeconomically Disadvantaged 63 61 96.8% 3.0% 30.0% 46.0% 21.0%
English Learners 63 14 22.2% 7.0% 64.0% 21.0% 7.0%
Students w ith Disabilit ies 63 7 11.1% -- -- -- --
Students Receiving MigrantEducat ion Services
0 0 0.0% 0.0% 0.0% 0.0% 0.0%
Foster Youth -- -- -- -- -- -- --
2014-15 SARC - Equitas Academy Charter School
Page 17 of 35

Last updated: 1/19/2016
Double dashes (--) appear in the table when the number of students is ten or less, either because the number of students in this category is too small for stat ist icalaccuracy or to protect student privacy.
Note: The number of students tested includes students that did not receive a score; however the number of students tested is not the number that was used tocalculate the achievement level percentages. The achievement level percentages are calculated using students w ith scores.
* Level 1 = Standard not met Level 2 = Standard nearly met Level 3 = Standard met Level 4 = Standard exceeded
Mathematics - Grade 5Mathematics - Grade 5
Student GroupTotal
EnrollmentNumberTested
PercentTested
PercentAchievement
Level 1*
PercentAchievement
Level 2*
PercentAchievement
Level 3*
PercentAchievement
Level 4*
All Students -- -- -- -- -- -- --
Male -- -- -- -- -- -- --
Female -- -- -- -- -- -- --
Black or African American -- -- -- -- -- -- --
American Indian or Alaska Nat ive -- -- -- -- -- -- --
Asian -- -- -- -- -- -- --
Filipino -- -- -- -- -- -- --
Hispanic or Lat ino -- -- -- -- -- -- --
Nat ive Hawaiian or Pacific Islander -- -- -- -- -- -- --
White -- -- -- -- -- -- --
Two or More Races -- -- -- -- -- -- --
Socioeconomically Disadvantaged -- -- -- -- -- -- --
English Learners -- -- -- -- -- -- --
Students w ith Disabilit ies -- -- -- -- -- -- --
Students Receiving MigrantEducat ion Services
-- -- -- -- -- -- --
Foster Youth -- -- -- -- -- -- --
2014-15 SARC - Equitas Academy Charter School
Page 18 of 35

Last updated: 1/19/2016
Double dashes (--) appear in the table when the number of students is ten or less, either because the number of students in this category is too small for stat ist icalaccuracy or to protect student privacy.
Note: The number of students tested includes students that did not receive a score; however the number of students tested is not the number that was used tocalculate the achievement level percentages. The achievement level percentages are calculated using students w ith scores.
* Level 1 = Standard not met Level 2 = Standard nearly met Level 3 = Standard met Level 4 = Standard exceeded
Mathematics - Grade 6Mathematics - Grade 6
Student GroupTotal
EnrollmentNumberTested
PercentTested
PercentAchievement
Level 1*
PercentAchievement
Level 2*
PercentAchievement
Level 3*
PercentAchievement
Level 4*
All Students -- -- -- -- -- -- --
Male -- -- -- -- -- -- --
Female -- -- -- -- -- -- --
Black or African American -- -- -- -- -- -- --
American Indian or Alaska Nat ive -- -- -- -- -- -- --
Asian -- -- -- -- -- -- --
Filipino -- -- -- -- -- -- --
Hispanic or Lat ino -- -- -- -- -- -- --
Nat ive Hawaiian or Pacific Islander -- -- -- -- -- -- --
White -- -- -- -- -- -- --
Two or More Races -- -- -- -- -- -- --
Socioeconomically Disadvantaged -- -- -- -- -- -- --
English Learners -- -- -- -- -- -- --
Students w ith Disabilit ies -- -- -- -- -- -- --
Students Receiving MigrantEducat ion Services
-- -- -- -- -- -- --
Foster Youth -- -- -- -- -- -- --
2014-15 SARC - Equitas Academy Charter School
Page 19 of 35
Last updated: 1/19/2016
Double dashes (--) appear in the table when the number of students is ten or less, either because the number of students in this category is too small for stat ist icalaccuracy or to protect student privacy.
Note: The number of students tested includes students that did not receive a score; however the number of students tested is not the number that was used tocalculate the achievement level percentages. The achievement level percentages are calculated using students w ith scores.
* Level 1 = Standard not met Level 2 = Standard nearly met Level 3 = Standard met Level 4 = Standard exceeded
Mathematics - Grade 7Mathematics - Grade 7
Student GroupTotal
EnrollmentNumberTested
PercentTested
PercentAchievement
Level 1*
PercentAchievement
Level 2*
PercentAchievement
Level 3*
PercentAchievement
Level 4*
All Students -- -- -- -- -- -- --
Male -- -- -- -- -- -- --
Female -- -- -- -- -- -- --
Black or African American -- -- -- -- -- -- --
American Indian or Alaska Nat ive -- -- -- -- -- -- --
Asian -- -- -- -- -- -- --
Filipino -- -- -- -- -- -- --
Hispanic or Lat ino -- -- -- -- -- -- --
Nat ive Hawaiian or Pacific Islander -- -- -- -- -- -- --
White -- -- -- -- -- -- --
Two or More Races -- -- -- -- -- -- --
Socioeconomically Disadvantaged -- -- -- -- -- -- --
English Learners -- -- -- -- -- -- --
Students w ith Disabilit ies -- -- -- -- -- -- --
Students Receiving MigrantEducat ion Services
-- -- -- -- -- -- --
Foster Youth -- -- -- -- -- -- --
2014-15 SARC - Equitas Academy Charter School
Page 20 of 35

Last updated: 1/19/2016
Double dashes (--) appear in the table when the number of students is ten or less, either because the number of students in this category is too small for stat ist icalaccuracy or to protect student privacy.
Note: The number of students tested includes students that did not receive a score; however the number of students tested is not the number that was used tocalculate the achievement level percentages. The achievement level percentages are calculated using students w ith scores.
* Level 1 = Standard not met Level 2 = Standard nearly met Level 3 = Standard met Level 4 = Standard exceeded
Mathematics - Grade 8Mathematics - Grade 8
Student GroupTotal
EnrollmentNumberTested
PercentTested
PercentAchievement
Level 1*
PercentAchievement
Level 2*
PercentAchievement
Level 3*
PercentAchievement
Level 4*
All Students -- -- -- -- -- -- --
Male -- -- -- -- -- -- --
Female -- -- -- -- -- -- --
Black or African American -- -- -- -- -- -- --
American Indian or Alaska Nat ive -- -- -- -- -- -- --
Asian -- -- -- -- -- -- --
Filipino -- -- -- -- -- -- --
Hispanic or Lat ino -- -- -- -- -- -- --
Nat ive Hawaiian or Pacific Islander -- -- -- -- -- -- --
White -- -- -- -- -- -- --
Two or More Races -- -- -- -- -- -- --
Socioeconomically Disadvantaged -- -- -- -- -- -- --
English Learners -- -- -- -- -- -- --
Students w ith Disabilit ies -- -- -- -- -- -- --
Students Receiving MigrantEducat ion Services
-- -- -- -- -- -- --
Foster Youth -- -- -- -- -- -- --
2014-15 SARC - Equitas Academy Charter School
Page 21 of 35

Last updated: 1/19/2016
Double dashes (--) appear in the table when the number of students is ten or less, either because the number of students in this category is too small for stat ist icalaccuracy or to protect student privacy.
Note: The number of students tested includes students that did not receive a score; however the number of students tested is not the number that was used tocalculate the achievement level percentages. The achievement level percentages are calculated using students w ith scores.
* Level 1 = Standard not met Level 2 = Standard nearly met Level 3 = Standard met Level 4 = Standard exceeded
Mathematics - Grade 11Mathematics - Grade 11
Student GroupTotal
EnrollmentNumberTested
PercentTested
PercentAchievement
Level 1*
PercentAchievement
Level 2*
PercentAchievement
Level 3*
PercentAchievement
Level 4*
All Students -- -- -- -- -- -- --
Male -- -- -- -- -- -- --
Female -- -- -- -- -- -- --
Black or African American -- -- -- -- -- -- --
American Indian or Alaska Nat ive -- -- -- -- -- -- --
Asian -- -- -- -- -- -- --
Filipino -- -- -- -- -- -- --
Hispanic or Lat ino -- -- -- -- -- -- --
Nat ive Hawaiian or Pacific Islander -- -- -- -- -- -- --
White -- -- -- -- -- -- --
Two or More Races -- -- -- -- -- -- --
Socioeconomically Disadvantaged -- -- -- -- -- -- --
English Learners -- -- -- -- -- -- --
Students w ith Disabilit ies -- -- -- -- -- -- --
Students Receiving MigrantEducat ion Services
-- -- -- -- -- -- --
Foster Youth -- -- -- -- -- -- --
2014-15 SARC - Equitas Academy Charter School
Page 22 of 35
Last updated: 1/19/2016
Last updated: 1/19/2016
Last updated: 1/19/2016
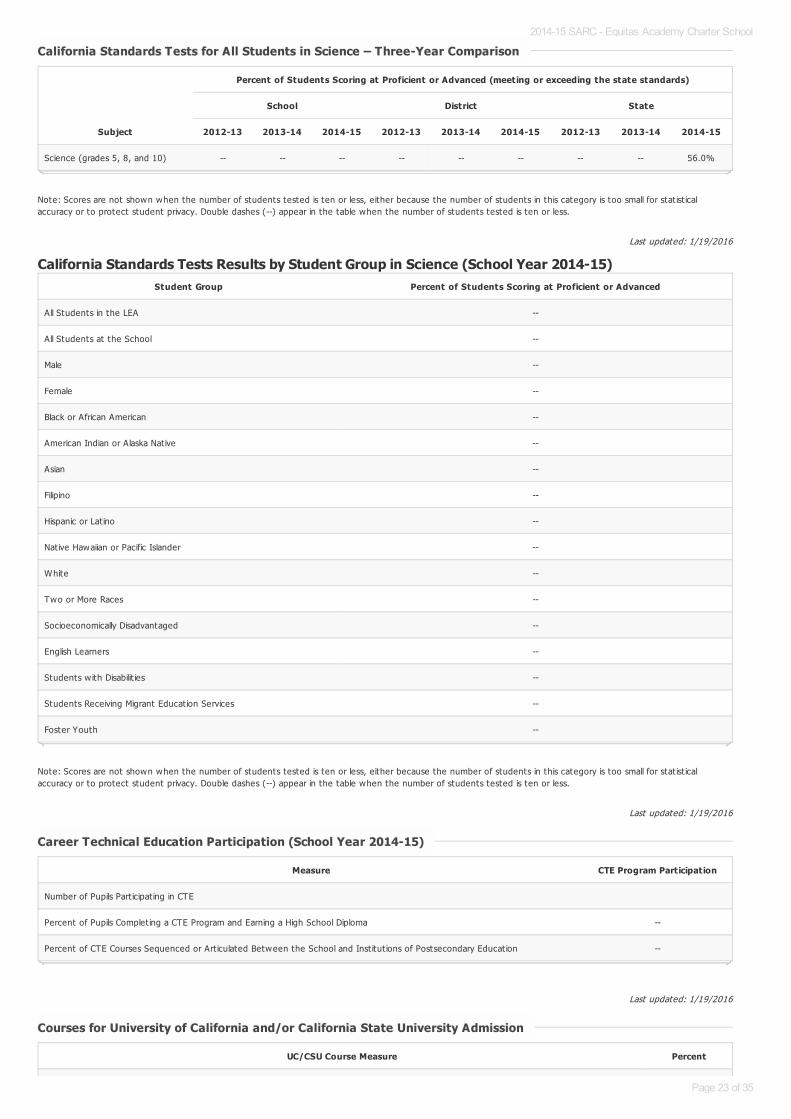
Note: Scores are not shown when the number of students tested is ten or less, either because the number of students in this category is too small for stat ist icalaccuracy or to protect student privacy. Double dashes (--) appear in the table when the number of students tested is ten or less.
California Standards Tests Results by Student Group in Science (School Year 2014-15)
Note: Scores are not shown when the number of students tested is ten or less, either because the number of students in this category is too small for stat ist icalaccuracy or to protect student privacy. Double dashes (--) appear in the table when the number of students tested is ten or less.
California Standards Tests for All Students in Science – Three-Year ComparisonCalifornia Standards Tests for All Students in Science – Three-Year Comparison
Subject
Percent of Students Scoring at Proficient or Advanced (meeting or exceeding the state standards)
School District State
2012-13 2013-14 2014-15 2012-13 2013-14 2014-15 2012-13 2013-14 2014-15
Science (grades 5, 8, and 10) -- -- -- -- -- -- -- -- 56.0%
Student Group Percent of Students Scoring at Proficient or Advanced
All Students in the LEA --
All Students at the School --
Male --
Female --
Black or African American --
American Indian or Alaska Nat ive --
Asian --
Filipino --
Hispanic or Lat ino --
Nat ive Hawaiian or Pacific Islander --
White --
Two or More Races --
Socioeconomically Disadvantaged --
English Learners --
Students w ith Disabilit ies --
Students Receiving Migrant Educat ion Services --
Foster Youth --
Career Technical Education Participation (School Year 2014-15)Career Technical Education Participation (School Year 2014-15)
Measure CTE Program Participation
Number of Pupils Part icipat ing in CTE
Percent of Pupils Complet ing a CTE Program and Earning a High School Diploma --
Percent of CTE Courses Sequenced or Art iculated Between the School and Inst itut ions of Postsecondary Educat ion --
Courses for University of California and/or California State University AdmissionCourses for University of California and/or California State University Admission
UC/CSU Course Measure Percent
2014-15 SARC - Equitas Academy Charter School
Page 23 of 35

2014-15 Pupils Enrolled in Courses Required for UC/CSU Admission 0.0%
2013-14 Graduates Who Completed All Courses Required for UC/CSU Admission 0.0%
2014-15 SARC - Equitas Academy Charter School
Page 24 of 35
Last updated: 1/12/2016
Last updated: 1/12/2016
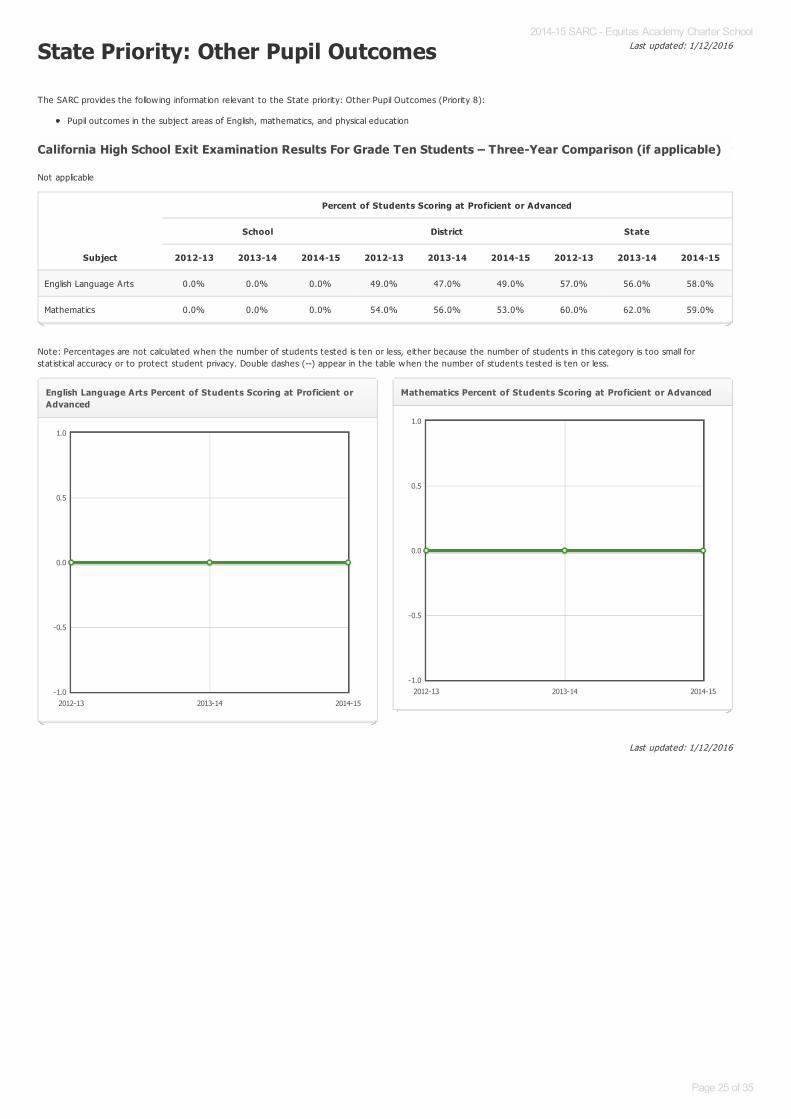
State Priority: Other Pupil Outcomes
The SARC provides the follow ing information relevant to the State priority: Other Pupil Outcomes (Priority 8):
Pupil outcomes in the subject areas of English, mathematics, and physical educat ion
Not applicable
Note: Percentages are not calculated when the number of students tested is ten or less, either because the number of students in this category is too small forstat ist ical accuracy or to protect student privacy. Double dashes (--) appear in the table when the number of students tested is ten or less.
California High School Exit Examination Results For Grade Ten Students – Three-Year Comparison (if applicable)California High School Exit Examination Results For Grade Ten Students – Three-Year Comparison (if applicable)
Subject
Percent of Students Scoring at Proficient or Advanced
School District State
2012-13 2013-14 2014-15 2012-13 2013-14 2014-15 2012-13 2013-14 2014-15
English Language Arts 0.0% 0.0% 0.0% 49.0% 47.0% 49.0% 57.0% 56.0% 58.0%
Mathematics 0.0% 0.0% 0.0% 54.0% 56.0% 53.0% 60.0% 62.0% 59.0%
English Language Arts Percent of Students Scoring at Proficient orAdvanced
2012-13 2013-14 2014-15-1.0
-0.5
0.0
0.5
1.0
Mathematics Percent of Students Scoring at Proficient or Advanced
2012-13 2013-14 2014-15-1.0
-0.5
0.0
0.5
1.0
2014-15 SARC - Equitas Academy Charter School
Page 25 of 35

Last updated: 1/12/2016
Last updated: 1/12/2016
Not applicable
Note: Percentages are not calculated when the number of students tested is ten or less, either because the number of students in this category is too small forstat ist ical accuracy or to protect student privacy. Double dashes (--) appear in the table when the number of students tested is ten or less.
Note: Percentages are not calculated when the number of students tested is ten or less, either because the number of students in this category is too small forstat ist ical accuracy or to protect student privacy.
California High School Exit Examination Grade Ten Results by Student Group (School Year 2014-15) (ifCalifornia High School Exit Examination Grade Ten Results by Student Group (School Year 2014-15) (if
applicable)applicable)
Student Group
English Language Arts Mathematics
Percent NotProficient
PercentProficient
PercentAdvanced
Percent NotProficient
PercentProficient
PercentAdvanced
All Students in the LEA -- -- -- -- -- --
All Students at the School -- -- -- -- -- --
Male -- -- -- -- -- --
Female -- -- -- -- -- --
Black or African American -- -- -- -- -- --
American Indian or Alaska Nat ive -- -- -- -- -- --
Asian -- -- -- -- -- --
Filipino -- -- -- -- -- --
Hispanic or Lat ino -- -- -- -- -- --
Nat ive Hawaiian or Pacific Islander -- -- -- -- -- --
White -- -- -- -- -- --
Two or More Races -- -- -- -- -- --
Socioeconomically Disadvantaged -- -- -- -- -- --
English Learners -- -- -- -- -- --
Students w ith Disabilit ies -- -- -- -- -- --
Students Receiving Migrant Educat ionServices
-- -- -- -- -- --
Foster Youth -- -- -- -- -- --
California Physical Fitness Test Results (School Year 2014-15)California Physical Fitness Test Results (School Year 2014-15)
Grade Level
Percent of Students Meeting Fitness Standards
Four of Six Standards Five of Six Standards Six of Six Standards
2014-15 SARC - Equitas Academy Charter School
Page 26 of 35
Last updated: 1/12/2016
Last updated: 1/12/2016
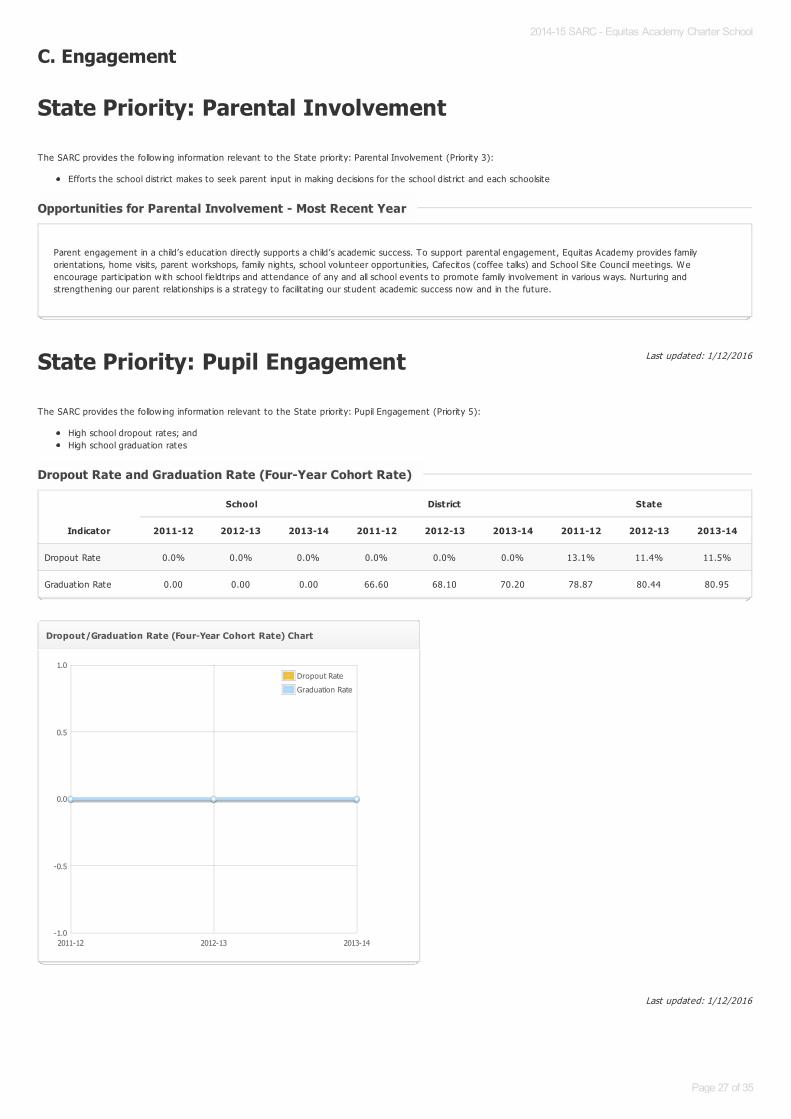
C. Engagement
State Priority: Parental Involvement
The SARC provides the follow ing information relevant to the State priority: Parental Involvement (Priority 3):
Efforts the school district makes to seek parent input in making decisions for the school district and each schoolsite
State Priority: Pupil Engagement
The SARC provides the follow ing information relevant to the State priority: Pupil Engagement (Priority 5):
High school dropout rates; andHigh school graduat ion rates
Opportunities for Parental Involvement - Most Recent YearOpportunities for Parental Involvement - Most Recent Year
Parent engagement in a child’s educat ion direct ly supports a child’s academic success. To support parental engagement, Equitas Academy provides familyorientat ions, home visits, parent workshops, family nights, school volunteer opportunit ies, Cafecitos (coffee talks) and School Site Council meet ings. Weencourage part icipat ion w ith school fieldtrips and attendance of any and all school events to promote family involvement in various ways. Nurturing andstrengthening our parent relat ionships is a strategy to facilitat ing our student academic success now and in the future.
Dropout Rate and Graduation Rate (Four-Year Cohort Rate)Dropout Rate and Graduation Rate (Four-Year Cohort Rate)
Indicator
School District State
2011-12 2012-13 2013-14 2011-12 2012-13 2013-14 2011-12 2012-13 2013-14
Dropout Rate 0.0% 0.0% 0.0% 0.0% 0.0% 0.0% 13.1% 11.4% 11.5%
Graduat ion Rate 0.00 0.00 0.00 66.60 68.10 70.20 78.87 80.44 80.95
Dropout/Graduation Rate (Four-Year Cohort Rate) Chart
2011-12 2012-13 2013-14-1.0
-0.5
0.0
0.5
1.0Dropout Rate
Graduation Rate
2014-15 SARC - Equitas Academy Charter School
Page 27 of 35
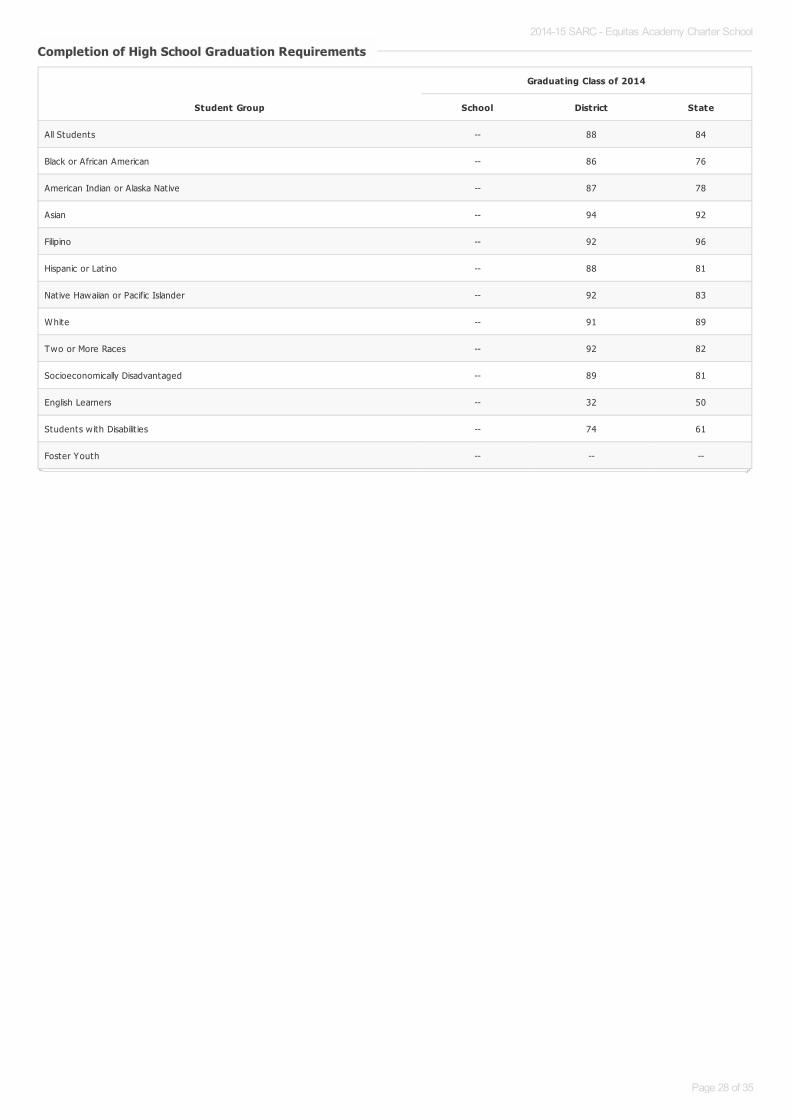
Completion of High School Graduation RequirementsCompletion of High School Graduation Requirements
Student Group
Graduating Class of 2014
School District State
All Students -- 88 84
Black or African American -- 86 76
American Indian or Alaska Nat ive -- 87 78
Asian -- 94 92
Filipino -- 92 96
Hispanic or Lat ino -- 88 81
Native Hawaiian or Pacific Islander -- 92 83
White -- 91 89
Two or More Races -- 92 82
Socioeconomically Disadvantaged -- 89 81
English Learners -- 32 50
Students w ith Disabilit ies -- 74 61
Foster Youth -- -- --
2014-15 SARC - Equitas Academy Charter School
Page 28 of 35
Last updated: 1/12/2016
Last updated: 1/12/2016
Last updated: 1/12/2016
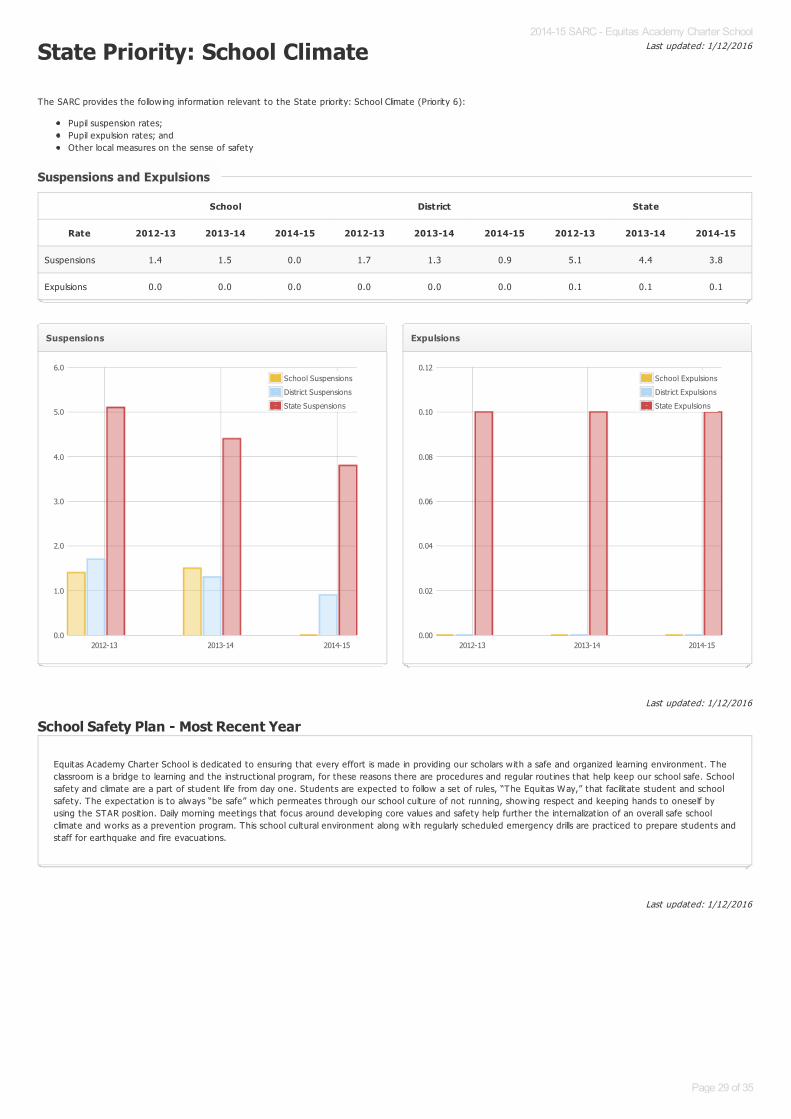
State Priority: School Climate
The SARC provides the follow ing information relevant to the State priority: School Climate (Priority 6):
Pupil suspension rates;Pupil expulsion rates; andOther local measures on the sense of safety
School Safety Plan - Most Recent Year
Suspensions and ExpulsionsSuspensions and Expulsions
School District State
Rate 2012-13 2013-14 2014-15 2012-13 2013-14 2014-15 2012-13 2013-14 2014-15
Suspensions 1.4 1.5 0.0 1.7 1.3 0.9 5.1 4.4 3.8
Expulsions 0.0 0.0 0.0 0.0 0.0 0.0 0.1 0.1 0.1
Suspensions
2012-13 2013-14 2014-150.0
1.0
2.0
3.0
4.0
5.0
6.0School Suspensions
District Suspensions
State Suspensions
Expulsions
2012-13 2013-14 2014-150.00
0.02
0.04
0.06
0.08
0.10
0.12School Expulsions
District Expulsions
State Expulsions
Equitas Academy Charter School is dedicated to ensuring that every effort is made in providing our scholars w ith a safe and organized learning environment. Theclassroom is a bridge to learning and the instruct ional program, for these reasons there are procedures and regular rout ines that help keep our school safe. Schoolsafety and climate are a part of student life from day one. Students are expected to follow a set of rules, “The Equitas Way,” that facilitate student and schoolsafety. The expectat ion is to always “be safe” which permeates through our school culture of not running, showing respect and keeping hands to oneself byusing the STAR posit ion. Daily morning meetings that focus around developing core values and safety help further the internalizat ion of an overall safe schoolclimate and works as a prevent ion program. This school cultural environment along w ith regularly scheduled emergency drills are pract iced to prepare students andstaff for earthquake and fire evacuat ions.
2014-15 SARC - Equitas Academy Charter School
Page 29 of 35
Last updated: 1/12/2016
Last updated: 1/12/2016
Last updated: 2/1/2016
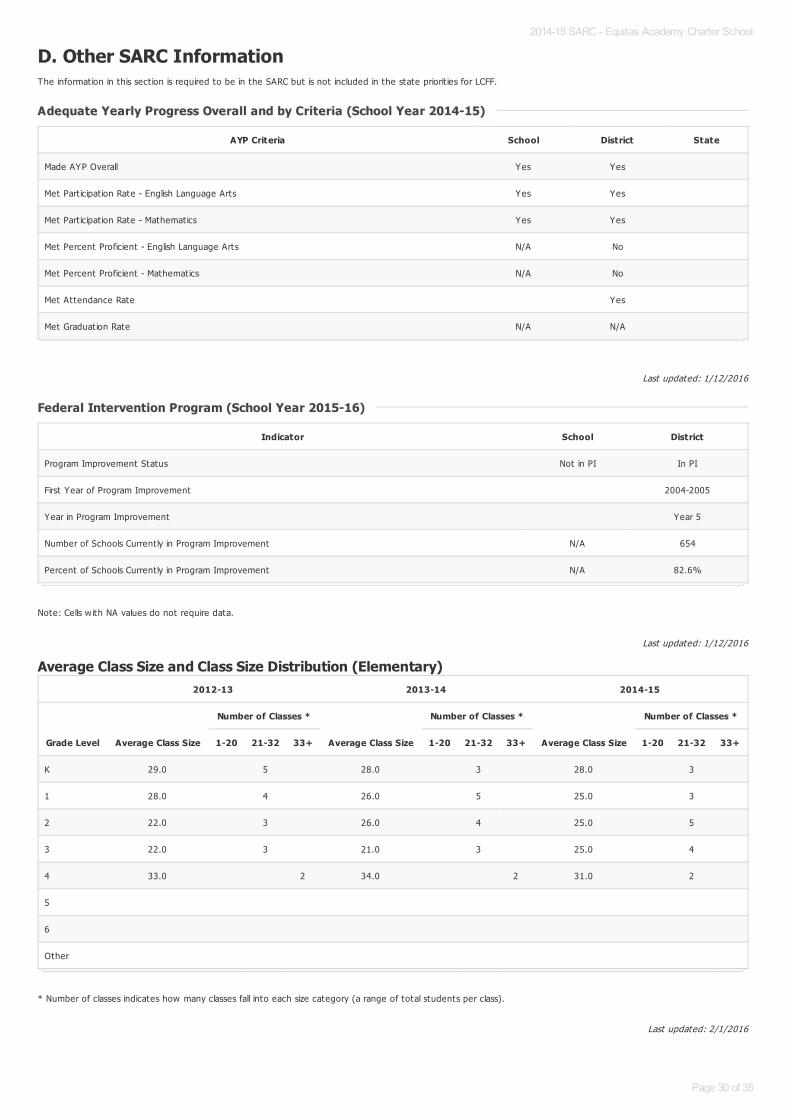
D. Other SARC InformationThe information in this sect ion is required to be in the SARC but is not included in the state priorit ies for LCFF.
Note: Cells w ith NA values do not require data.
Average Class Size and Class Size Distribution (Elementary)
* Number of classes indicates how many classes fall into each size category (a range of total students per class).
Adequate Yearly Progress Overall and by Criteria (School Year 2014-15)Adequate Yearly Progress Overall and by Criteria (School Year 2014-15)
AYP Criteria School District State
Made AYP Overall Yes Yes
Met Part icipat ion Rate - English Language Arts Yes Yes
Met Part icipat ion Rate - Mathematics Yes Yes
Met Percent Proficient - English Language Arts N/A No
Met Percent Proficient - Mathematics N/A No
Met Attendance Rate Yes
Met Graduat ion Rate N/A N/A
Federal Intervention Program (School Year 2015-16)Federal Intervention Program (School Year 2015-16)
Indicator School District
Program Improvement Status Not in PI In PI
First Year of Program Improvement 2004-2005
Year in Program Improvement Year 5
Number of Schools Current ly in Program Improvement N/A 654
Percent of Schools Current ly in Program Improvement N/A 82.6%
2012-13 2013-14 2014-15
Grade Level Average Class Size
Number of Classes *
Average Class Size
Number of Classes *
Average Class Size
Number of Classes *
1-20 21-32 33+ 1-20 21-32 33+ 1-20 21-32 33+
K 29.0 5 28.0 3 28.0 3
1 28.0 4 26.0 5 25.0 3
2 22.0 3 26.0 4 25.0 5
3 22.0 3 21.0 3 25.0 4
4 33.0 2 34.0 2 31.0 2
5
6
Other
2014-15 SARC - Equitas Academy Charter School
Page 30 of 35
Last updated: 1/19/2016
Last updated: 2/1/2016
Last updated: 1/29/2016
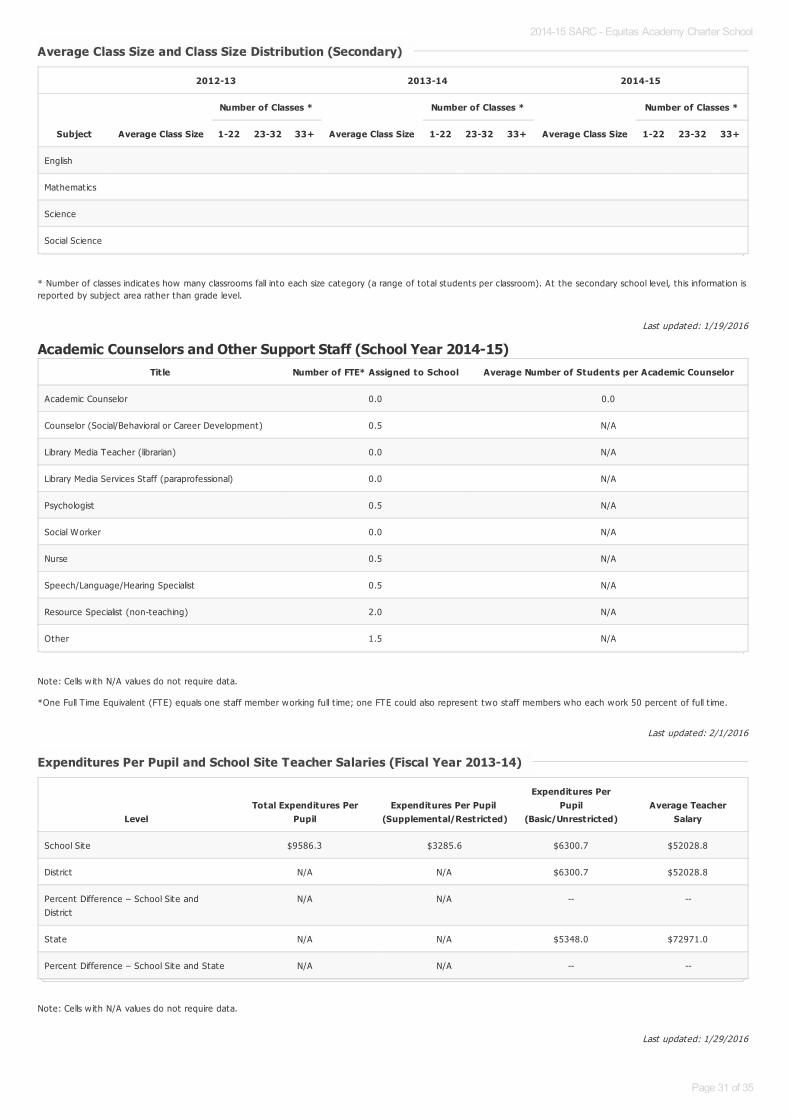
* Number of classes indicates how many classrooms fall into each size category (a range of total students per classroom). At the secondary school level, this information isreported by subject area rather than grade level.
Academic Counselors and Other Support Staff (School Year 2014-15)
Note: Cells w ith N/A values do not require data.
*One Full T ime Equivalent (FTE) equals one staff member working full t ime; one FTE could also represent two staff members who each work 50 percent of full t ime.
Note: Cells w ith N/A values do not require data.
Average Class Size and Class Size Distribution (Secondary)Average Class Size and Class Size Distribution (Secondary)
2012-13 2013-14 2014-15
Subject Average Class Size
Number of Classes *
Average Class Size
Number of Classes *
Average Class Size
Number of Classes *
1-22 23-32 33+ 1-22 23-32 33+ 1-22 23-32 33+
English
Mathematics
Science
Social Science
Title Number of FTE* Assigned to School Average Number of Students per Academic Counselor
Academic Counselor 0.0 0.0
Counselor (Social/Behavioral or Career Development) 0.5 N/A
Library Media Teacher (librarian) 0.0 N/A
Library Media Services Staff (paraprofessional) 0.0 N/A
Psychologist 0.5 N/A
Social Worker 0.0 N/A
Nurse 0.5 N/A
Speech/Language/Hearing Specialist 0.5 N/A
Resource Specialist (non-teaching) 2.0 N/A
Other 1.5 N/A
Expenditures Per Pupil and School Site Teacher Salaries (Fiscal Year 2013-14)Expenditures Per Pupil and School Site Teacher Salaries (Fiscal Year 2013-14)
LevelTotal Expenditures Per
PupilExpenditures Per Pupil
(Supplemental/Restricted)
Expenditures PerPupil
(Basic/Unrestricted)Average Teacher
Salary
School Site $9586.3 $3285.6 $6300.7 $52028.8
District N/A N/A $6300.7 $52028.8
Percent Difference – School Site andDistrict
N/A N/A -- --
State N/A N/A $5348.0 $72971.0
Percent Difference – School Site and State N/A N/A -- --
2014-15 SARC - Equitas Academy Charter School
Page 31 of 35

Last updated: 1/19/2016
For detailed information on salaries, see the CDE Cert ificated Salaries & Benefits Web page at http://www.cde.ca.gov/ds/fd/cs/ .
Types of Services Funded (Fiscal Year 2014-15)Types of Services Funded (Fiscal Year 2014-15)
The type s of s e rvi ce s a nd progra ms tha t a re provi de d a t Equi ta s Aca de my through ca te gori ca l a nd othe r s ource fundi ng he l p provi de s upports tha t a l l ow s tude nta chi e ve me nt a nd s ucce s s . Thos e s upports a nd progra ms i ncl ude da i l y s tude nt i nte rve nti on (RTI ), Stude nt Succe s s Te a m (SST), Spe ci a l Educa ti on (SPED)de ve l opme nt, a fte rs chool progra mmi ng (ASES) a nd a n e nri chme nt progra m.
RTI
Addi ti ona l da i l y, ta rge te d s tude nt s upport i s provi de d by te a che rs for pe rformi ng fa r be l ow or a bove gra de l e ve l , s tude nts wi th l ow s oci oe conomi c s ta tus , Engl i s hLa ngua ge Le a rne rs , a nd Spe ci a l Educa ti on s tude nts .
SST
Stude nts i de nti fi e d for a ddi ti ona l s upports a re re fe rre d to the Stude nt Succe s s Te a m (SST) ba s e d on the i r e duca ti ona l ne e ds . The SST proce s s i ncl ude s a ddi ti ona li ns tructi ona l s upports , a ti me l i ne for i mpl e me nta ti on, a nd goa l s for the s tude nt.
SPED
Stude nts who qua l i fy for SPED s e rvi ce s re ce i ve a ddi ti ona l e duca ti ona l s e rvi ce s a ccordi ng to qua l i fi ca ti ons .
Enrichment Program
Equi ta s be l i e ve s tha t provi de d opportuni ti e s to e xpe ri e nce a cti vi ti e s outs i de the a ca de mi cs he l ps s tude nts pre pa re for the i r future e nde a vors to a nd i n col l e gea nd i n the i r l i ve s . Equi ta s i s a bl e to provi de e nri chme nt cl a s s e s to a l l s tude nts 4 da ys a we e k.
ASES
Equi ta s Aca de my s tude nts ha ve a cce s s e s to a da i l y a fte rs chool progra m tha t offe rs a ca de mi c s upport i n ma th, ELA a nd home work whi l e offe ri ng e nri chi ng a cti vi ti e stha t a ddre s s the whol e s tude nt s uch a s te chnol ogy a nd photogra phy cl ubs .
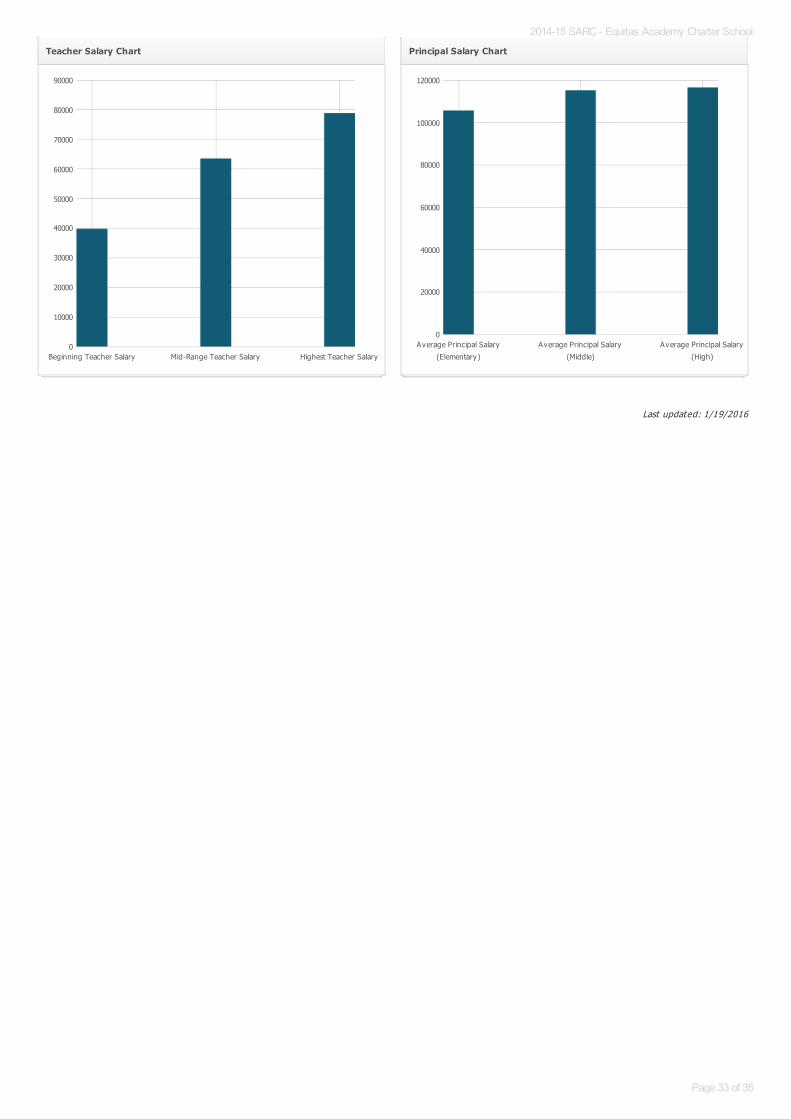
Teacher and Administrative Salaries (Fiscal Year 2013-14)Teacher and Administrative Salaries (Fiscal Year 2013-14)
Category District Amount State Average For Districts In Same Category
Beginning Teacher Salary $39,788 $43,165
Mid-Range Teacher Salary $63,553 $68,574
Highest Teacher Salary $78,906 $89,146
Average Principal Salary (Elementary) $105,723 $111,129
Average Principal Salary (Middle) $115,222 $116,569
Average Principal Salary (High) $116,595 $127,448
Superintendent Salary $350,000 $234,382
Percent of Budget for Teacher Salaries 35.0% 38.0%
Percent of Budget for Administrat ive Salaries 5.0% 5.0%
2014-15 SARC - Equitas Academy Charter School
Page 32 of 35
Last updated: 1/19/2016
Teacher Salary Chart
Beginning Teacher Salary Mid-Range Teacher Salary Highest Teacher Salary0
10000
20000
30000
40000
50000
60000
70000
80000
90000
Principal Salary Chart
Average Principal Salary
(Elementary)
Average Principal Salary
(Middle)
Average Principal Salary
(High)
0
20000
40000
60000
80000
100000
120000
2014-15 SARC - Equitas Academy Charter School
Page 33 of 35
Last updated: 1/12/2016
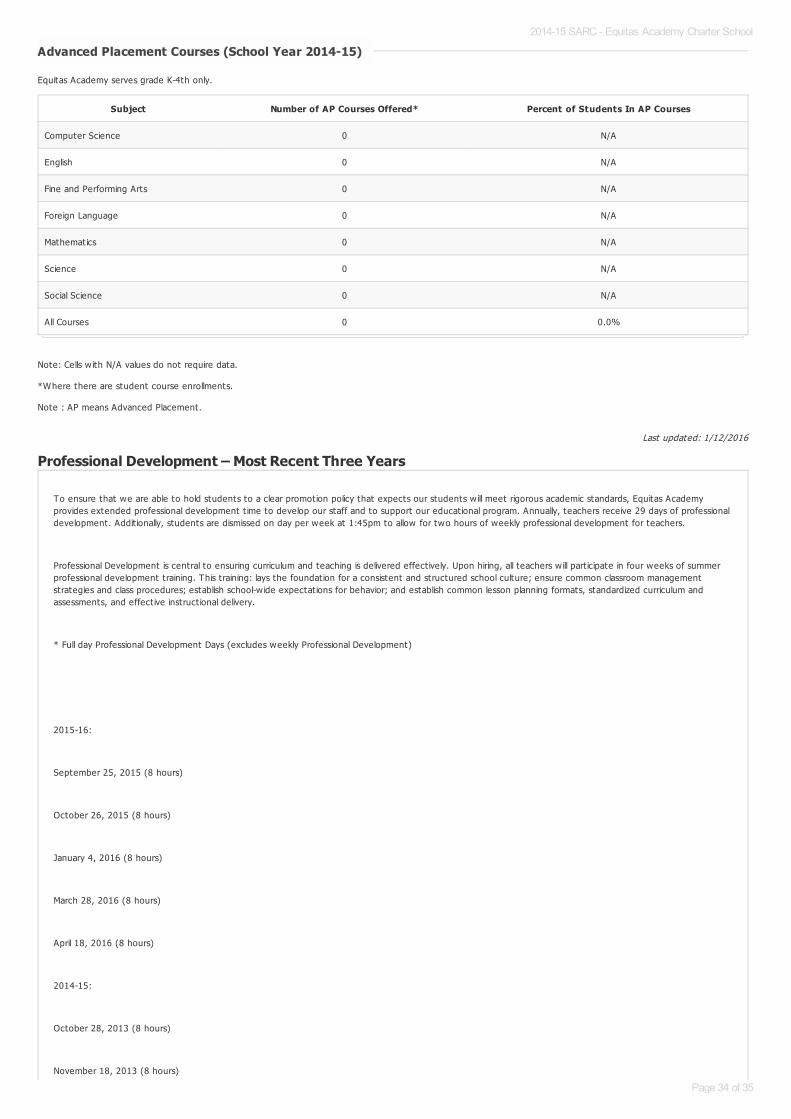
Equitas Academy serves grade K-4th only.
Note: Cells w ith N/A values do not require data.
*Where there are student course enrollments.
Note : AP means Advanced Placement.
Professional Development – Most Recent Three Years
Advanced Placement Courses (School Year 2014-15)Advanced Placement Courses (School Year 2014-15)
Subject Number of AP Courses Offered* Percent of Students In AP Courses
Computer Science 0 N/A
English 0 N/A
Fine and Performing Arts 0 N/A
Foreign Language 0 N/A
Mathematics 0 N/A
Science 0 N/A
Social Science 0 N/A
All Courses 0 0.0%
To ensure that we are able to hold students to a clear promotion policy that expects our students w ill meet rigorous academic standards, Equitas Academyprovides extended professional development t ime to develop our staff and to support our educat ional program. Annually, teachers receive 29 days of professionaldevelopment. Addit ionally, students are dismissed on day per week at 1:45pm to allow for two hours of weekly professional development for teachers.
Professional Development is central to ensuring curriculum and teaching is delivered effect ively. Upon hiring, all teachers w ill part icipate in four weeks of summerprofessional development training. This training: lays the foundat ion for a consistent and structured school culture; ensure common classroom managementstrategies and class procedures; establish school-w ide expectat ions for behavior; and establish common lesson planning formats, standardized curriculum andassessments, and effect ive instruct ional delivery.
* Full day Professional Development Days (excludes weekly Professional Development)
2015-16:
September 25, 2015 (8 hours)
October 26, 2015 (8 hours)
January 4, 2016 (8 hours)
March 28, 2016 (8 hours)
April 18, 2016 (8 hours)
2014-15:
October 28, 2013 (8 hours)
November 18, 2013 (8 hours)
2014-15 SARC - Equitas Academy Charter School
Page 34 of 35

Last updated: 1/12/2016
December 6, 2013 (8 hours)
January 6, 2014 (8 hours)
February 7, 2014 (8 hours)
March 14, 2014 (8 hours)
April 21, 2014 (8 hours)
June 9, 2014 (8 hours)
2013-14:
October 28, 2013 (8 hours)
November 18, 2013 (8 hours)
December 6, 2013 (8 hours)
January 6, 2014 (8 hours)
February 7, 2014 (8 hours)
March 14, 2014 (8 hours)
April 21, 2014 (8 hours)
June 9, 2014 (8 hours)
2012-13:
October 29, 2012 (8 hours)
November 26, 2012 (8 hours)
January 7, 2013 (8 hours)
February 8, 2013 (8 hours)
April 1, 2013 (8 hours)
April 22, 2013 (8 hours)
2014-15 SARC - Equitas Academy Charter School
Page 35 of 35