sarc report for bret harte middle · last updated: 1/5/2018 note: ela test results include the...
TRANSCRIPT

Bret Harte Middle
By February 1 of each year, every school in California is required by state law to publish a School Accountability Report Card (SARC).The SARC contains information aboutthe condit ion and performance of each California public school. Under the Local Control Funding Formula (LCFF) all local educat ional agencies (LEAs) are required toprepare a Local Control and Accountability Plan (LCAP), which describes how they intend to meet annual school-specific goals for all pupils, w ith specific act ivit ies toaddress state and local priorit ies. Addit ionally, data reported in an LCAP is to be consistent w ith data reported in the SARC.
For more information about SARC requirements, see the California Department of Educat ion (CDE) SARC Web page at http://www.cde.ca.gov/ta/ac/sa/.
For more information about the LCFF or LCAP, see the CDE LCFF Web page at http://www.cde.ca.gov/fg/aa/lc/.
For addit ional information about the school, parents/guardians and community members should contact the school principal or the district office.
DataQuest
Internet Access
California Department of Education
School Accountability Report CardReported Using Data from the 2016-17 School Year
DataQuest is an online data tool located on the CDE DataQuest Web page that contains addit ional information about this school and comparisons of the school tothe district and the county. Specifically, DataQuest is a dynamic system that provides reports for accountability (e.g., test data, enrollment, high school graduates,dropouts, course enrollments, staffing, and data regarding English learners).
Internet access is available at public libraries and other locat ions that are publicly accessible (e.g., the California State Library). Access to the Internet at librariesand public locat ions is generally provided on a first-come, first-served basis. Other use restrict ions may include the hours of operat ion, the length of t ime that aworkstat ion may be used (depending on availability), the types of software programs available on a workstat ion, and the ability to print documents.
Ms. Tina VanLaarhoven, PrincipalPrincipal, Bret Harte Middle
A National Blue Ribbon School, Bret Harte is a learning community that motivates and supports all students to achieve atthe highest levels. W ith a strong foundat ion of skills, students learn to formulate and express ideas through writ ing,speaking, and various media. Our goal is to produce creat ive and crit ical thinkers who make a posit ive contribut ion to ourcommunity. All teachers part icipate in staff development training to analyze assessment data and develop effect iveinstruct ional strategies. Bret Harte is a place where kids are loved and where kids love to learn. In partnership w ith ourparent community, a staff of caring and competent professionals provides a structured and sequential program rich in basicand advanced math, literature, science, history, geography, technology, and the arts. Bret Harte Community Club helps tofund our Video Product ion studio, Project Lead the Way robot ics and our engineering lab. Booster Club also providesfunding and leadership for our clubs and sports programs which provide a real life venue to develop life skills. Maintaining abalance between academic success and social emotional well-being is important to our staff and community. Learning theimportance of honesty, respect and responsibility is part of learning how to have a “Bronco Att itude”. We work togetherto provide life long learning for all members of our community.
T ina Vanlaarhoven, Principal 2014-15
Bret Harte Middle7050 Bret Harte Dr.San Jose, CA 95120-3205
Phone: 408-535-6270E-mail: [email protected]
About Our SchoolAbout Our School
Principal's CommentPrincipal's Comment
ContactContact

Last updated: 1/3/2018
Last updated: 12/15/2017
About This School
Contact Information (School Year 2017-18)Contact Information (School Year 2017-18)
District Contact Information (School Year 2017-18)
District Name San Jose Unified
Phone Number (408) 535-6090
Superintendent Nancy Albarrán
E-mail Address [email protected]
Web Site http://www.sjusd.org
School Contact Information (School Year 2017-18)
School Name Bret Harte Middle
Street 7050 Bret Harte Dr.
City, State, Zip San Jose, Ca, 95120-3205
Phone Number 408-535-6270
Principal Ms. T ina VanLaarhoven, Principal
E-mail Address [email protected]
Web Site http://www.sjusd.org/bretharte/
County-District-School(CDS) Code
43696666060099
School Description and Mission Statement (School Year 2017-18)School Description and Mission Statement (School Year 2017-18)
Our Vision to prepare students to be the thinkers, creators, and leaders of tomorrow.
Our Mission is to unite as one community, we elevate opportunit ies for all.
Bret Harte establishes a support ive learning community that motivates all students to achieve. Bret Harte Middle School is committed to developing creat ive,crit ical thinkers w ithin a caring school climate. Bret Harte is where students are loved and where students love to learn. In partnership w ith parents, a staff ofcaring professionals provides a structured and sequential program rich in basic and advanced Math, Language Arts, Science, History , Social Studies, Spanish,Technology and the Arts. A safe, orderly environment is maintained in classrooms and throughout the campus. Our partnership w ith parents and communitygroups provides many opportunit ies and resources for our school. These include our sports teams, after school and lunch clubs, , Project Lead the Way,Television broadcast ing, and Project Cornerstone act ivit ies for staff and students.
At Bret Harte all students in our diverse populat ion successfully develop academically, physically, emotionally, and socially to reach the maximum potent ial duringthis special period of growth. We create a safe and secure learning environment where students are creat ive and are motivated to greater academic success andpreparat ion. We plan instruct ion addressing mult iple modalit ies of learning, and student engagement, establish posit ive and support ive environment and provideextended act ivit ies in all disciplines including the arts, technology, and communicat ion.
2016-17 SARC - Bret Harte Middle
Page 2 of 20

Last updated: 1/5/2018
Last updated: 1/5/2018
Student Enrollment by Grade Level (School Year 2016-17)Student Enrollment by Grade Level (School Year 2016-17)
Grade Level Number of Students
Grade 6 394
Grade 7 418
Grade 8 401
Total Enrollment 1213
Grade 6 Grade 7 Grade 80
50
100
150
200
250
300
350
400
450
Student Enrollment by Student Group (School Year 2016-17)Student Enrollment by Student Group (School Year 2016-17)
Student Group Percent of Total Enrollment
Black or African American 0.6 %
American Indian or Alaska Nat ive 0.2 %
Asian 44.8 %
Filipino 1.3 %
Hispanic or Lat ino 15.5 %
Native Hawaiian or Pacific Islander 0.2 %
White 31.2 %
Two or More Races 5.4 %
Other 0.8 %
Student Group (Other) Percent of Total Enrollment
Socioeconomically Disadvantaged 13.3 %
English Learners 5.9 %
Students w ith Disabilit ies 6.7 %
Foster Youth 0.2 %
2016-17 SARC - Bret Harte Middle
Page 3 of 20
Last updated: 1/24/2018
Last updated: 1/24/2018
A. Conditions of Learning
State Priority: Basic
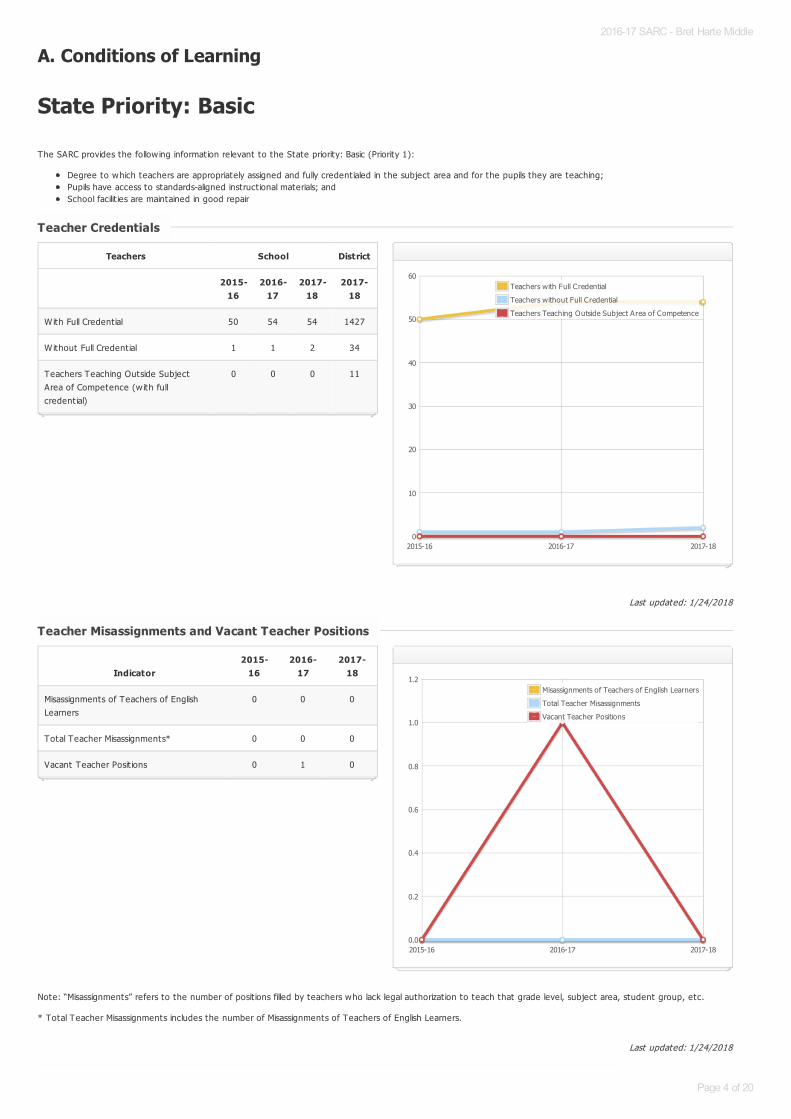
The SARC provides the follow ing information relevant to the State priority: Basic (Priority 1):
Degree to which teachers are appropriately assigned and fully credent ialed in the subject area and for the pupils they are teaching;Pupils have access to standards-aligned instruct ional materials; andSchool facilit ies are maintained in good repair
Note: “Misassignments” refers to the number of posit ions filled by teachers who lack legal authorizat ion to teach that grade level, subject area, student group, etc.
* Total Teacher Misassignments includes the number of Misassignments of Teachers of English Learners.
Teacher CredentialsTeacher Credentials
Teachers School District
2015-16
2016-17
2017-18
2017-18
With Full Credent ial 50 54 54 1427
Without Full Credent ial 1 1 2 34
Teachers Teaching Outside SubjectArea of Competence (w ith fullcredent ial)
0 0 0 11
2015-16 2016-17 2017-180
10
20
30
40
50
60Teachers with Full Credential
Teachers without Full Credential
Teachers Teaching Outside Subject Area of Competence
Teacher Misassignments and Vacant Teacher PositionsTeacher Misassignments and Vacant Teacher Positions
Indicator2015-
162016-
172017-
18
Misassignments of Teachers of EnglishLearners
0 0 0
Total Teacher Misassignments* 0 0 0
Vacant Teacher Posit ions 0 1 0
2015-16 2016-17 2017-180.0
0.2
0.4
0.6
0.8
1.0
1.2Misassignments of Teachers of English Learners
Total Teacher Misassignments
Vacant Teacher Positions
2016-17 SARC - Bret Harte Middle
Page 4 of 20

Last updated: 1/31/2018
Year and month in which the data were collected: January 2018
Quality, Currency, Availability of Textbooks and Instructional Materials (School Year 2017-18)Quality, Currency, Availability of Textbooks and Instructional Materials (School Year 2017-18)
Note: Cells w ith N/A values do not require data.
SubjectTextbooks and Instructional Materials/year of
AdoptionFrom Most Recent
Adoption?Percent Students Lacking Own
Assigned Copy
Reading/Language ArtsMaterials List:
https://sjusd.box.com/s/o0g6hno3vsgegmyorlsjhucf3c52mvy3
Yes 0.0 %
Mathematics Yes 0.0 %
Science Yes 0.0 %
History-Social Science Yes 0.0 %
Foreign Language Yes 0.0 %
Health Yes 0.0 %
Visual and Performing Arts Yes 0.0 %
Science Lab Eqpmt(Grades 9-12)
N/A N/A 0.0 %
2016-17 SARC - Bret Harte Middle
Page 5 of 20
Last updated: 1/8/2018
Last updated: 1/5/2018
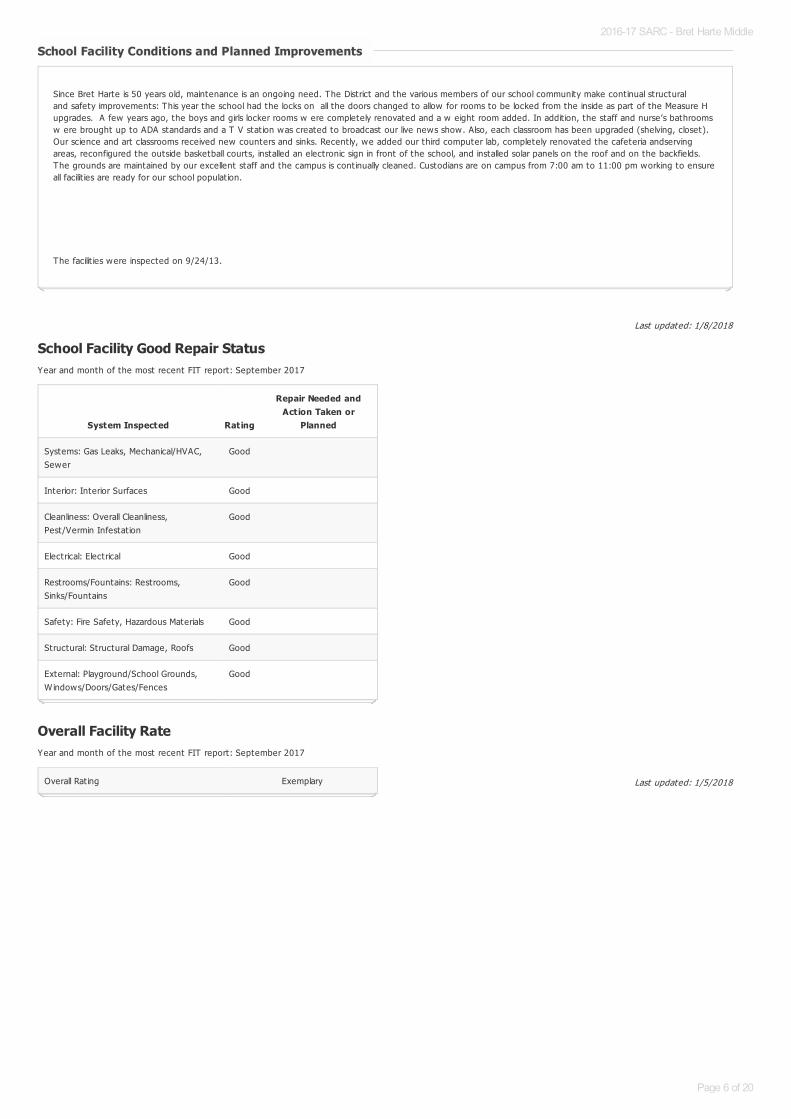
School Facility Good Repair StatusYear and month of the most recent FIT report: September 2017
Overall Facility RateYear and month of the most recent FIT report: September 2017
School Facility Conditions and Planned ImprovementsSchool Facility Conditions and Planned Improvements
Since Bret Harte is 50 years old, maintenance is an ongoing need. The District and the various members of our school community make cont inual structuraland safety improvements: This year the school had the locks on all the doors changed to allow for rooms to be locked from the inside as part of the Measure Hupgrades. A few years ago, the boys and girls locker rooms w ere completely renovated and a w eight room added. In addit ion, the staff and nurse’s bathroomsw ere brought up to ADA standards and a T V stat ion was created to broadcast our live news show. Also, each classroom has been upgraded (shelving, closet).Our science and art classrooms received new counters and sinks. Recent ly, we added our third computer lab, completely renovated the cafeteria andservingareas, reconfigured the outside basketball courts, installed an electronic sign in front of the school, and installed solar panels on the roof and on the backfields.The grounds are maintained by our excellent staff and the campus is cont inually cleaned. Custodians are on campus from 7:00 am to 11:00 pm working to ensureall facilit ies are ready for our school populat ion.
The facilit ies were inspected on 9/24/13.
System Inspected Rating
Repair Needed andAction Taken or
Planned
Systems: Gas Leaks, Mechanical/HVAC,Sewer
Good
Interior: Interior Surfaces Good
Cleanliness: Overall Cleanliness,Pest/Vermin Infestat ion
Good
Electrical: Electrical Good
Restrooms/Fountains: Restrooms,Sinks/Fountains
Good
Safety: Fire Safety, Hazardous Materials Good
Structural: Structural Damage, Roofs Good
External: Playground/School Grounds,W indows/Doors/Gates/Fences
Good
Overall Rat ing Exemplary
2016-17 SARC - Bret Harte Middle
Page 6 of 20

Last updated: 1/5/2018
B. Pupil Outcomes
State Priority: Pupil Achievement
The SARC provides the follow ing information relevant to the State priority: Pupil Achievement (Priority 4):
Statewide assessments (i.e., California Assessment of Student Performance and Progress [CAASPP] System, which includes the Smarter Balanced SummativeAssessments for students in the general educat ion populat ion and the California Alternate Assessments [CAAs] for English language arts/literacy [ELA] andmathematics given in grades three through eight and grade eleven. Only eligible students may part icipate in the administrat ion of the CAAs. CAAs items arealigned w ith alternate achievement standards, which are linked w ith the Common Core State Standards [CCSS] for students w ith the most significant cognit ivedisabilit ies); and
The percentage of students who have successfully completed courses that sat isfy the requirements for entrance to the University of California and the CaliforniaState University, or career technical educat ion sequences or programs of study.
Note: Percentages are not calculated when the number of students tested is ten or less, either because the number of students in this category is too small forstat ist ical accuracy or to protect student privacy.
CAASPP Test Results in ELA and Mathematics for All StudentsCAASPP Test Results in ELA and Mathematics for All Students
Grades Three through Eight and Grade Eleven Grades Three through Eight and Grade Eleven (School Year 2016-17)(School Year 2016-17)
Subject
Percentage of Students Meeting or Exceeding the State Standards
School District State
2015-16 2016-17 2015-16 2016-17 2015-16 2016-17
English Language Arts / Literacy (grades 3-8 and 11) 79% 78% 54% 53% 48% 48%
Mathematics (grades 3-8 and 11) 78% 78% 42% 42% 36% 37%
2016-17 SARC - Bret Harte Middle
Page 7 of 20

Last updated: 1/5/2018
Note: ELA test results include the Smarter Balanced Summative Assessment and the CAA. The “Percent Met or Exceeded” is calculated by taking the total number ofstudents who met or exceeded the standard on the Smarter Balanced Summative Assessment plus the total number of students who met the standard (i.e., achievedLevel 3–Alternate) on the CAAs divided by the total number of students who part icipated in both assessments.
Note: Double dashes (--) appear in the table when the number of students is ten or less, either because the number of students in this category is too small forstat ist ical accuracy or to protect student privacy.
Note: The number of students tested includes all students who part icipated in the test whether they received a score or not; however, the number of students testedis not the number that was used to calculate the achievement level percentages. The achievement level percentages are calculated using only students who receivedscores.
CAASPP Test Results in ELA by Student Group CAASPP Test Results in ELA by Student Group
Grades Three through Eight and Grade Eleven (School Year 2016-17)Grades Three through Eight and Grade Eleven (School Year 2016-17)
Student Group Total Enrollment Number Tested Percent Tested Percent Met or Exceeded
All Students 1216 1194 98.19% 78.31%
Male 643 628 97.67% 75.64%
Female 573 566 98.78% 81.27%
Black or African American -- -- --
American Indian or Alaska Nat ive -- -- --
Asian 543 536 98.71% 92.72%
Filipino 12 12 100.00% 66.67%
Hispanic or Lat ino 187 184 98.40% 42.39%
Native Hawaiian or Pacific Islander -- -- --
White 384 374 97.40% 75.94%
Two or More Races 69 67 97.10% 82.09%
Socioeconomically Disadvantaged 166 162 97.59% 40.74%
English Learners 206 198 96.12% 53.54%
Students w ith Disabilit ies 84 82 97.62% 25.61%
Students Receiving Migrant Educat ion Services
Foster Youth -- -- -- --
2016-17 SARC - Bret Harte Middle
Page 8 of 20

Last updated: 1/5/2018
Note: Mathematics test results include the Smarter Balanced Summative Assessment and the CAA. The “Percent Met or Exceeded” is calculated by taking the totalnumber of students who met or exceeded the standard on the Smarter Balanced Summative Assessment plus the total number of students who met the standard (i.e.,achieved Level 3–Alternate) on the CAAs divided by the total number of students who part icipated in both assessments.
Note: Double dashes (--) appear in the table when the number of students is ten or less, either because the number of students in this category is too small forstat ist ical accuracy or to protect student privacy.
Note: The number of students tested includes all students who part icipated in the test whether they received a score or not; however, the number of students testedis not the number that was used to calculate the achievement level percentages. The achievement level percentages are calculated using only students who receivedscores.
CAASPP Test Results in Mathematics by Student GroupCAASPP Test Results in Mathematics by Student Group
Grades Three through Eight and Grade Eleven (School Year 2016-17)Grades Three through Eight and Grade Eleven (School Year 2016-17)
Student Group Total Enrollment Number Tested Percent Tested Percent Met or Exceeded
All Students 1216 1201 98.77% 77.69%
Male 643 633 98.44% 78.67%
Female 573 568 99.13% 76.58%
Black or African American -- -- --
American Indian or Alaska Nat ive -- -- --
Asian 543 539 99.26% 94.06%
Filipino 12 12 100.00% 66.67%
Hispanic or Lat ino 187 184 98.40% 36.41%
Native Hawaiian or Pacific Islander -- -- --
White 384 379 98.70% 74.67%
Two or More Races 69 67 97.10% 83.58%
Socioeconomically Disadvantaged 166 163 98.19% 36.20%
English Learners 206 204 99.03% 56.37%
Students w ith Disabilit ies 84 82 97.62% 24.39%
Students Receiving Migrant Educat ion Services
Foster Youth -- -- -- --
2016-17 SARC - Bret Harte Middle
Page 9 of 20

Last updated: 1/5/2018
Last updated: 12/18/2017
Last updated: 12/18/2017
Note: Science test results include California Standards Tests (CSTs), California Modified Assessment (CMA), and California Alternate Performance Assessment (CAPA) ingrades five, eight, and ten.
Note: Scores are not shown when the number of students tested is ten or less, either because the number of students in this category is too small for stat ist icalaccuracy or to protect student privacy.
Note:The 2016-17 data are not available. The California Department of Educat ion is developing a new science assessment based on the Next Generat ion ScienceStandards for California Public Schools (CA NGSS). The new California Science Test (CAST) was piloted in spring 2017. The CST and CMA for Science w ill no longer beadministered.
Career Technical Education Programs (School Year 2016-17)
CAASPP Test Results in Science for All StudentsCAASPP Test Results in Science for All Students
Grades Five, Eight and TenGrades Five, Eight and Ten
Subject
Percentage of Students Scoring at Proficient or Advanced
School District State
2014-15 2015-16 2014-15 2015-16 2014-15 2015-16
Science (grades 5, 8, and 10) 86.0% 87.0% 57.0% 55.0% 56% 54%
N/A
Career Technical Education Participation (School Year 2016-17)Career Technical Education Participation (School Year 2016-17)
Measure CTE Program Participation
Number of Pupils Part icipat ing in CTE 0
Percent of Pupils Complet ing a CTE Program and Earning a High School Diploma --
Percent of CTE Courses Sequenced or Art iculated Between the School and Inst itut ions of Postsecondary Educat ion --
Courses for University of California (UC) and/or California State University (CSU) AdmissionCourses for University of California (UC) and/or California State University (CSU) Admission
UC/CSU Course Measure Percent
2016-17 Pupils Enrolled in Courses Required for UC/CSU Admission 10.3%
2015-16 Graduates Who Completed All Courses Required for UC/CSU Admission 0.0%
2016-17 SARC - Bret Harte Middle
Page 10 of 20

Last updated: 1/8/2018
Last updated: 1/5/2018
State Priority: Other Pupil Outcomes
The SARC provides the follow ing information relevant to the State priority: Other Pupil Outcomes (Priority 8):
Pupil outcomes in the subject area of physical educat ion
Note: Percentages are not calculated when the number of students tested is ten or less, either because the number of students in this category is too small forstat ist ical accuracy or to protect student privacy.
California Physical Fitness Test Results (School Year 2016-17)California Physical Fitness Test Results (School Year 2016-17)
Grade Level
Percentage of Students Meeting Fitness Standards
Four of Six Fitness Standards Five of Six Fitness Standards Six of Six Fitness Standards
7 11.4% 21.0% 61.6%
2016-17 SARC - Bret Harte Middle
Page 11 of 20

C. Engagement
State Priority: Parental Involvement
The SARC provides the follow ing information relevant to the State priority: Parental Involvement (Priority 3):
Efforts the school district makes to seek parent input in making decisions for the school district and each schoolsite
Opportunities for Parental Involvement (School Year 2017-18)Opportunities for Parental Involvement (School Year 2017-18)
Bret Harte takes great pride in parental involvement and the role parents play in developing the thinkers, creators, and leaders of tomorrow. Our Community Club(our equivalent to PTA) holds monthly meetings and has a number of committees to provide parent/school interact ion. Our ever-support ive parents volunteer inhigh numbers. Parents w ith staff on our School Site Council, assists in the Media Center, help plan Passport for Success, assist in 6th grade Orientat ion Day andother student act ivit ies. Parents also run a SNAC bar that meets all the nutrit ional guidelines. Parent donat ions have resulted in the purchase of new computers,projectors, sound systems, printers, and classroom materials to enhance our student 's learning. Parent donat ions and community partnerships led to funding ofProject Lead the Way a hands on lab where students learn the principles of engineering and design. Parent funding also allowed for a refresh of technology inour school Television Product ion Studio.
Our Booster club supports our athlet ic and club programs. BHMS's athlet ic program is one of the largest sports programs offered at a middle school and iscont inuously grow ing as we offer, cross country, tennis, volleyball, track, soccer, baseball, softball, flag football, basketball, and spirit team. Booster Club alsosponsors over 25 clubs, providing an extended opportunity for student involvement and part icipat ion.
For further information on our parent volunteer programs, please contact Bret Harte Middle School at (408) 535-6270 or visit our website.
2016-17 SARC - Bret Harte Middle
Page 12 of 20

Last updated: 1/5/2018
Last updated: 1/5/2018
State Priority: Pupil Engagement
The SARC provides the follow ing information relevant to the State priority: Pupil Engagement (Priority 5):
High school dropout rates; andHigh school graduat ion rates
Dropout Rate and Graduation Rate (Four-Year Cohort Rate)Dropout Rate and Graduation Rate (Four-Year Cohort Rate)
Indicator
School District State
2013-14 2014-15 2015-16 2013-14 2014-15 2015-16 2013-14 2014-15 2015-16
Dropout Rate 0.0% 0.0% 0.0% 0.0% 0.0% 0.0% 11.5% 10.7% 9.7%
Graduat ion Rate 0.0% 0.0% 0.0% 85.9% 85.4% 87.7% 81.0% 82.3% 83.8%
Dropout/Graduation Rate (Four-Year Cohort Rate) Chart
2013-14 2014-15 2015-16-1.0
-0.5
0.0
0.5
1.0Dropout Rate
Graduation Rate
2016-17 SARC - Bret Harte Middle
Page 13 of 20

Completion of High School Graduation Requirements - Graduating Class of 2016 Completion of High School Graduation Requirements - Graduating Class of 2016
(One-Year Rate)(One-Year Rate)
Student Group School District State
All Students -- 88.4% 87.1%
Black or African American -- 85.0% 79.2%
American Indian or Alaska Nat ive -- 100.0% 80.2%
Asian -- 97.9% 94.4%
Filipino -- 90.6% 93.8%
Hispanic or Lat ino -- 83.4% 84.6%
Native Hawaiian or Pacific Islander -- 92.3% 86.6%
White -- 93.8% 91.0%
Two or More Races -- 91.3% 90.6%
Socioeconomically Disadvantaged -- 90.5% 85.5%
English Learners -- 52.6% 55.4%
Students w ith Disabilit ies -- 57.1% 63.9%
Foster Youth -- -- --
2016-17 SARC - Bret Harte Middle
Page 14 of 20

Last updated: 1/5/2018
Last updated: 1/5/2018
Last updated: 12/15/2017
State Priority: School Climate
The SARC provides the follow ing information relevant to the State priority: School Climate (Priority 6):
Pupil suspension rates;Pupil expulsion rates; andOther local measures on the sense of safety
School Safety Plan (School Year 2017-18)
Suspensions and ExpulsionsSuspensions and Expulsions
School District State
Rate 2014-15 2015-16 2016-17 2014-15 2015-16 2016-17 2014-15 2015-16 2016-17
Suspensions 2.9% 1.9% 1.9% 3.5% 3.7% 3.6% 3.8% 3.7% 3.7%
Expulsions 0.0% 0.0% 0.2% 0.1% 0.0% 0.1% 0.1% 0.1% 0.1%
Suspensions
2014-15 2015-16 2016-170.0
0.5
1.0
1.5
2.0
2.5
3.0
3.5
4.0School Suspensions
District Suspensions
State Suspensions
Expulsions
2014-15 2015-16 2016-170.00
0.05
0.10
0.15
0.20
0.25School Expulsions
District Expulsions
State Expulsions
Safety is very important at Bret Harte Middle School. OUr safety plan is updated during the summer prior to the school year and reviewed w ith the staff inAugust. Each classroom has an emergency supply bucket located in the classroom along w ith rescue backpacks for each search and rescue team member.Theses backpacks include supplies necessary to copmlete a search of the school, as well as radios to aid in clear communicat ion between the team members andthe command center. These supplies are inventoried and updated by parent volunteers. Bret Hart is monitored befor and after school, luncht ime, and duringpassing periods by administrators, campus supervisors, police and teachers.
2016-17 SARC - Bret Harte Middle
Page 15 of 20
Last updated: 1/24/2018
Last updated: 1/24/2018
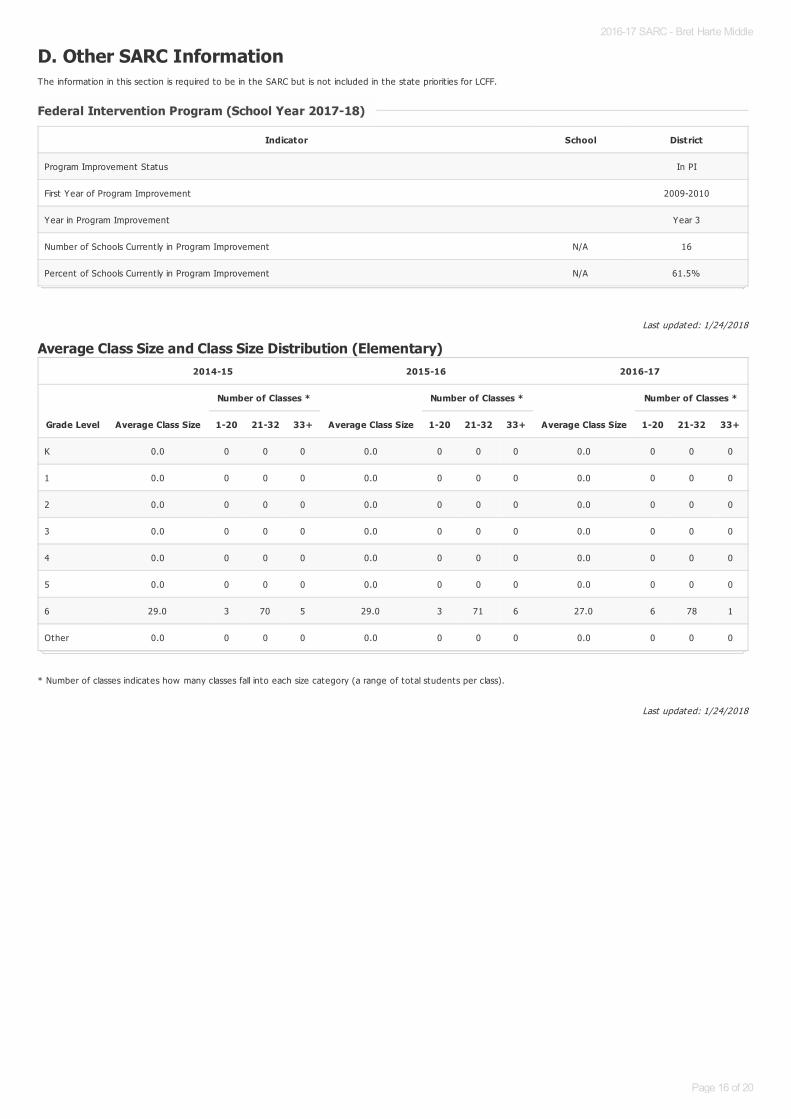
D. Other SARC InformationThe information in this sect ion is required to be in the SARC but is not included in the state priorit ies for LCFF.
Average Class Size and Class Size Distribution (Elementary)
* Number of classes indicates how many classes fall into each size category (a range of total students per class).
Federal Intervention Program (School Year 2017-18)Federal Intervention Program (School Year 2017-18)
Indicator School District
Program Improvement Status In PI
First Year of Program Improvement 2009-2010
Year in Program Improvement Year 3
Number of Schools Current ly in Program Improvement N/A 16
Percent of Schools Current ly in Program Improvement N/A 61.5%
2014-15 2015-16 2016-17
Grade Level Average Class Size
Number of Classes *
Average Class Size
Number of Classes *
Average Class Size
Number of Classes *
1-20 21-32 33+ 1-20 21-32 33+ 1-20 21-32 33+
K 0.0 0 0 0 0.0 0 0 0 0.0 0 0 0
1 0.0 0 0 0 0.0 0 0 0 0.0 0 0 0
2 0.0 0 0 0 0.0 0 0 0 0.0 0 0 0
3 0.0 0 0 0 0.0 0 0 0 0.0 0 0 0
4 0.0 0 0 0 0.0 0 0 0 0.0 0 0 0
5 0.0 0 0 0 0.0 0 0 0 0.0 0 0 0
6 29.0 3 70 5 29.0 3 71 6 27.0 6 78 1
Other 0.0 0 0 0 0.0 0 0 0 0.0 0 0 0
2016-17 SARC - Bret Harte Middle
Page 16 of 20
Last updated: 1/24/2018
Last updated: 1/26/2018
Last updated: 1/10/2018
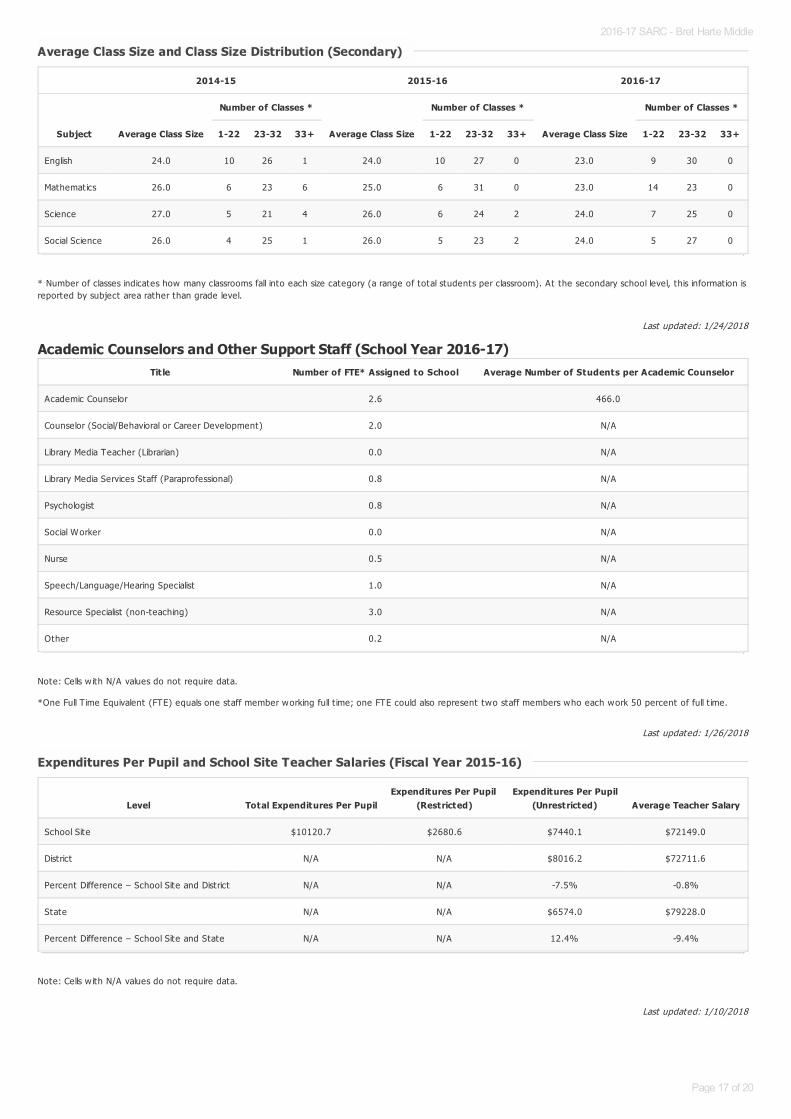
* Number of classes indicates how many classrooms fall into each size category (a range of total students per classroom). At the secondary school level, this information isreported by subject area rather than grade level.
Academic Counselors and Other Support Staff (School Year 2016-17)
Note: Cells w ith N/A values do not require data.
*One Full T ime Equivalent (FTE) equals one staff member working full t ime; one FTE could also represent two staff members who each work 50 percent of full t ime.
Note: Cells w ith N/A values do not require data.
Average Class Size and Class Size Distribution (Secondary)Average Class Size and Class Size Distribution (Secondary)
2014-15 2015-16 2016-17
Subject Average Class Size
Number of Classes *
Average Class Size
Number of Classes *
Average Class Size
Number of Classes *
1-22 23-32 33+ 1-22 23-32 33+ 1-22 23-32 33+
English 24.0 10 26 1 24.0 10 27 0 23.0 9 30 0
Mathematics 26.0 6 23 6 25.0 6 31 0 23.0 14 23 0
Science 27.0 5 21 4 26.0 6 24 2 24.0 7 25 0
Social Science 26.0 4 25 1 26.0 5 23 2 24.0 5 27 0
Title Number of FTE* Assigned to School Average Number of Students per Academic Counselor
Academic Counselor 2.6 466.0
Counselor (Social/Behavioral or Career Development) 2.0 N/A
Library Media Teacher (Librarian) 0.0 N/A
Library Media Services Staff (Paraprofessional) 0.8 N/A
Psychologist 0.8 N/A
Social Worker 0.0 N/A
Nurse 0.5 N/A
Speech/Language/Hearing Specialist 1.0 N/A
Resource Specialist (non-teaching) 3.0 N/A
Other 0.2 N/A
Expenditures Per Pupil and School Site Teacher Salaries (Fiscal Year 2015-16)Expenditures Per Pupil and School Site Teacher Salaries (Fiscal Year 2015-16)
Level Total Expenditures Per PupilExpenditures Per Pupil
(Restricted)Expenditures Per Pupil
(Unrestricted) Average Teacher Salary
School Site $10120.7 $2680.6 $7440.1 $72149.0
District N/A N/A $8016.2 $72711.6
Percent Difference – School Site and District N/A N/A -7.5% -0.8%
State N/A N/A $6574.0 $79228.0
Percent Difference – School Site and State N/A N/A 12.4% -9.4%
2016-17 SARC - Bret Harte Middle
Page 17 of 20

Last updated: 12/19/2017
Types of Services Funded (Fiscal Year 2016-17)Types of Services Funded (Fiscal Year 2016-17)
Bret Harte offers Reading and Math intervent ion classes for students who are in need of skill building in these areas. Students who are two or more years belowgrade level as determined by the mulitple data points of district assessments, SBAC, and teacher input can be placed in either Reading or Math intervent ion duringthe school day in addit ion to their regular Math and Language Arts classes.
Bret Harte offers both academic and social emotional counseling. In 16-17 we increased to 3 academic counselors, one in charge of each grade level. Councelorsmonitor student progress, work w ith teachers to support students, connect parents to community resources and aid in communicat ion between the parents andstaff. Almaden Valley Counselors are also available to our students daily . These counselors assist w ith our students' social emotional needs. Students can accessthese counselors through referral by a teacher or administrator, parent or by theri own request.
Bret Harte staff part icipate in staff development centered around current standards and state frameworks. A Language Arts Instruct ional Coach and MathematicsInstruct ional coach are available to our teachers to aid in improvement of pract ice. The school cont inues to work on different aspecit s of Growth Mindset andstudent engagement. The Science department is in the midst of convert ing their curriculum to meet the Next Generat ion Science STandards as a departmentas well as ut ilizing district resources and personnel.
Gate students' needs are met in the regular classroom using different iated curriculum School clubs and sports teams are designed for our gifted and talentedstudents to explore and be intellectually curious.
At Bret Harte we have several types of special educat ion classes. We have a severely handicapped class, an emotional disturbance classroom, a special dayclassroom, and two resource classes. We provide for the least restrict ive environement for each special educaiton student, whenever possible. Current ly, weincorporate an inclusion model for all of our RSP students. The are mainstreamed classes w ith a guided studies class to support their learning. Student progress ismonitored by the indiviual case manager. Counseling services are provided on a needed basis for these students.
At Rish students are ident ified and supported through the follow ing services, six wee progress reports, academic counseling to monitor students struggling,Coordinat ion of Services Team, Counseling services, intervent ion classs and the City of San Jose's Safe School Program.
English ALanguage Learners are supported by having a double period of English Language Development in Language Arts. We also have a reading intervent ion forstudents who are long t ierm English Language learners.
At Bret Harte we have over 650 students part icipate in some kind of afer school program. Clubs are held both at luncht ime and after school. Our extensivesports program extends the school day for many students. The library is open during lunch and after school for those w isighing to work on their stuies or whomay need extra help w ith learning. Two teachers are present Tuesday through Thursday in the library after school to assist students.
Teacher and Administrative Salaries (Fiscal Year 2015-16)Teacher and Administrative Salaries (Fiscal Year 2015-16)
Category District Amount State Average For Districts In Same Category
Beginning Teacher Salary $53,358 $47,808
Mid-Range Teacher Salary $77,532 $73,555
Highest Teacher Salary $93,642 $95,850
Average Principal Salary (Elementary) $103,741 $120,448
Average Principal Salary (Middle) $108,855 $125,592
Average Principal Salary (High) $117,012 $138,175
Superintendent Salary $263,799 $264,457
Percent of Budget for Teacher Salaries 33.0% 35.0%
2016-17 SARC - Bret Harte Middle
Page 18 of 20

Last updated: 1/8/2018
For detailed information on salaries, see the CDE Cert ificated Salaries & Benefits Web page at http://www.cde.ca.gov/ds/fd/cs/ .
Percent of Budget for Administrat ive Salaries 5.0% 5.0%
Teacher Salary Chart
Beginning Teacher Salary Mid-Range Teacher Salary Highest Teacher Salary0
20000
40000
60000
80000
100000
Principal Salary Chart
Average Principal Salary
(Elementary)
Average Principal Salary
(Middle)
Average Principal Salary
(High)
0
20000
40000
60000
80000
100000
120000
2016-17 SARC - Bret Harte Middle
Page 19 of 20

Last updated: 1/8/2018
Last updated: 12/19/2017
Note: Cells w ith N/A values do not require data.
*Where there are student course enrollments of at least one student.
Professional Development
Advanced Placement (AP) Courses (School Year 2016-17)Advanced Placement (AP) Courses (School Year 2016-17)
Subject Number of AP Courses Offered* Percent of Students In AP Courses
Computer Science 0 N/A
English 0 N/A
Fine and Performing Arts 0 N/A
Foreign Language 0 N/A
Mathematics 0 N/A
Science 0 N/A
Social Science 0 N/A
All Courses 0 0.0%
Bret Harte staff part icipate in staff development centered around current standards and state frameworks. A Language Arts Instruct ional Coach and MathematicsInstruct ional coach are available to our teachers to aid in improvement of pract ice. The school cont inues to work on different aspecit s of Growth Mindset andstudent engagement. The Science department is in the midst of convert ing their curriculum to meet the Next Generat ion Science STandards as a department aswell as ut ilizing district resources and personnel.
From 2015 to present we have focused on the Growth Mindset and Student Engagement as well as the district instruct ional framework. Teachers began sharingbest pract ices from their department to the staff as a whole in 2016. In 2017 teachers began part icipat ing in peer to peer observat ions to observe bestpract ices w ith students and part icipated in a debriefing session on how they would be able to implement ideas into their pract ice. A spring peer to peerobservat ion is planned.
Over 1/3 of the faculty has completed a 6 day training w ith coaching sessions from Equity and Access, which is a program to build on student strengths and toincrease the different entry levels of concepts in their curriculum to make it more accessible for all students to part icipate and make meaningful contribut ions. Mult iple sessions of Equity and Access pract ices for the ent ire faculty have been dispersed throughout the school year
2016-17 SARC - Bret Harte Middle
Page 20 of 20