saraa market profile - harrisburg international airport · saraa market profile 1 for more...
TRANSCRIPT

SARAA Market Profile
1
For more information contact Michael Yingling at [email protected] or (717) 948-3900 Ext. 4633
INTRODUCTION
The Susquehanna Area Regional Airport Authority (SARAA) is a multi-municipal authority whose mission is to serve the region by providing high-quality, efficient airports and promoting regional economic development. SARAA operates four airports, including Harrisburg International Airport (HIA), located in Lower Swatara Township, Dauphin County.
HIA is the only multimodal, intermodal international airport servicing south-central Pennsylvania with more than 1,400 employees and six airlines. As the third -busiest passenger and cargo airport in Pennsylvania, HIA offers daily nonstop service to 14 destinations and hundreds of connection points worldwide.
HIA: MEASURES OF ECONOMIC IMPACT IN 2012
• 1.3 million passengers flew into/out of HIA; 80,000 of them were international travelers. • About 1,500 employees work for a business or organization on HIA property. • $25.3 million was spent on airport rental cars, food, news, and gifts, generating $1.6 million in state
sales tax. • Nearly $8 million was spent on parking, which generated at least $725,000 in taxes for the Middletown
Area School District, Lower Swatara Township, and the Borough of Middletown. • More than 11,000 overnight hotel room nights were spent by all airline crews, generating at least
$500,000 in hotel revenues and $27,500 in hotel room taxes. • More than $200,000 in property taxes was paid by private businesses located on HIA property.
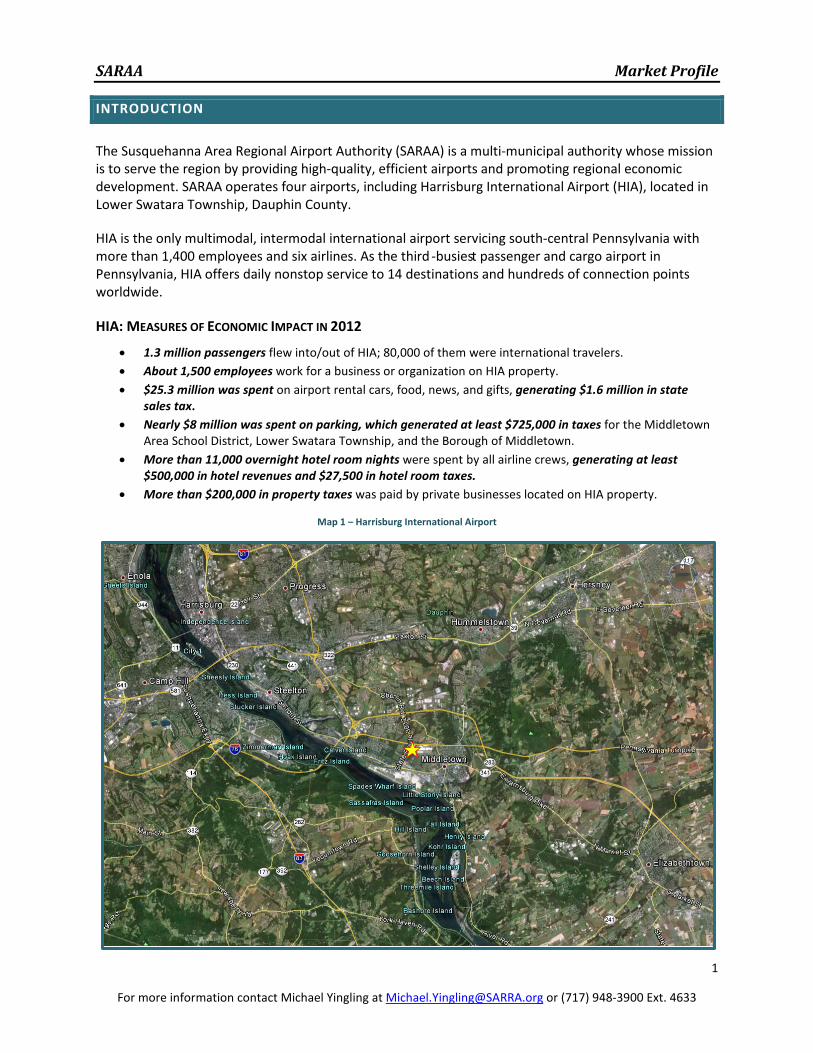
Map 1 – Harrisburg International Airport

SARAA Market Profile
2
For more information contact Michael Yingling at [email protected] or (717) 948-3900 Ext. 4633
Map 2 – Harrisburg International Airport
KEYSTONE OPPORTUNITY ZONE (KOZ)
Available properties:
• Old Terminal Location (21.6 acres) • Old Bethlehem Steel Site (38.7 acres) • Crawford Station Site (64.0 acres)
Taxes eligible to be waived
State:
• Corporate Net Income Tax • Capital Stock and Foreign Franchise Tax • Personal Income Tax • Sales and Use Tax (purchases used and consumed by business in the KOZ) • Mutual Thrift Institution Tax • Bank and Trust Company Shares Tax • Insurance Premiums Tax
HIA Terminal
HIA South Access
Middletown Borough Approx. 1.5 miles
Steelton Borough Approx. 6 miles
Rt. 283 Approx. 2 miles
City of Harrisburg Approx. 10 miles
Penn State University Campus

SARAA Market Profile
3
For more information contact Michael Yingling at [email protected] or (717) 948-3900 Ext. 4633
Local:
• Earned Income/Net Profits Tax • Business Gross Receipts, Business Occupancy, Business Privilege and Mercantile Tax • Sales and Uses Tax (county/city; purchases used and consumed by business in the KOZ) • Property Tax
Eligible Businesses:
• New businesses • Businesses moving to the site not currently located in Pennsylvania • Any business that moves from a PA location into the KOZ is not eligible to receive the exemptions,
deductions, abatements, or credits unless the business meets at least one of the following: 1. Increases employment by at least 2-% in the first full year of operation within the KOZ 2. Makes a capital investment in the property located within the KOZ equivalent to 10% of the gross
revenues of the business in the immediately preceding calendar or fiscal year attributable to the business location or locations that are being relocated to a subzone
3. Enters into a lease agreement for property located within the subzone, improvement subzone, or expansion zone for a term at least equivalent to the duration of the subzone and with the aggregate payment under the lease agreement at least equivalent to 5% of the gross revenues of the business in the immediately preceding calendar or fiscal year.

SARAA Market Profile
4
For more information contact Michael Yingling at [email protected] or (717) 948-3900 Ext. 4633
Map 3 – HIA Keystone Opportunity Zone (KOZ) Sites
Map 4 – HIA Crawford Station KOZ Site

SARAA Market Profile
5
For more information contact Michael Yingling at [email protected] or (717) 948-3900 Ext. 4633

SARAA Market Profile
6
For more information contact Michael Yingling at [email protected] or (717) 948-3900 Ext. 4633
Map 5 – HIA Old Terminal KOZ Site
Map 6 – HIA Old Bethlehem Steel KOZ Site

SARAA Market Profile
7
For more information contact Michael Yingling at [email protected] or (717) 948-3900 Ext. 4633

SARAA Market Profile
8
For more information contact Michael Yingling at [email protected] or (717) 948-3900 Ext. 4633
MARKET PROFILE
The following areas were identified for study:
1. Primary Market Area – 2-mile radius of the North 29 Lot 2. Secondary Market Area – 3-mile radius of the North 29 Lot 3. Tertiary Market Area – 5-mile radius of the North 29 Lot
For comparative purposes, data was included for the Commonwealth of Pennsylvania and the United States, where available, in addition to the primary, secondary, and tertiary market areas. Map 3 illustrates the various defined market areas and their relation to HIA and the surrounding properties.
Map 7- Market Area
Source: ESRI Business Information Systems

SARAA Market Profile
9
For more information contact Michael Yingling at [email protected] or (717) 948-3900 Ext. 4633
Regional, Community, and Economic Impact
Within three miles of HIA, there is an Amtrak commuter rail station. The Middletown stop is part of Amtrak’s Keystone Service rail line, with direct access to Harrisburg, Philadelphia, and New York City.
The HIA campus is within one mile of the Harrisburg area branch campus of Penn State University, which has a current enrollment of approximately 4,200 students that is predominantly composed of commuters, although on-campus living is expanding annually as enrollment increases. Penn State Harrisburg has grown to be the third-largest Penn State branch campus and has recently experienced an increase in out-of-state student enrollment. In October 2009, 23 percent of undergraduate, first-time freshmen were nonresidents, and 12 percent of graduate students were relocating to the Harrisburg area.
The airport and its tenants employ more than 1,500 people from the surrounding region including over 500 Dauphin County residents. Visitors to Dauphin County arriving at HIA spend more than $6.6 million per year and generate more than $103,000 in hotel taxes annually.
HIA serves approximately 1.3 million aviation travelers on an annual basis. As the only multi-airline commercial service airport within a 75-mile radius of the Dauphin County region, SARAA is continually pursuing new carriers and service offerings at HIA. These efforts have proven beneficial in recent months, as SARAA was able to recruit two new airlines offering direct destination flights to and from HIA.
DEMOGRAPHIC CHARACTERISTICS
Population
A key factor in measuring the depth of a retail or commercial market is assessing the trends in population – a population that represents the consumers of goods and services that could be offered at the Airport and the surrounding properties, as well as a local workforce that could potentially be tapped. The primary market area is projected to experience a 5.86 percent increase in population between 2010 and 2015 while the secondary market area is projected to increase by 6.52 percent and the tertiary market area by 6.29 percent. The total population in Pennsylvania is projected to increase by only 1.68 percent during the same time period (see Table 1 – Population Trends).
Table 1 – Population Trends
2000 2010 2016 % Change 2010-2016
2 Miles 17,423 16,901 17,892 5.86% 3 Miles 22,389 21,813 23,235 6.52% 5 Miles 49,535 51,436 54,671 6.29%
PA 12,281,054 12,702,379 12,916,198 1.68% US 281,421,906 308,745,538 321,315,318 4.07%
Source: ESRI Business Information Systems

SARAA Market Profile
10
For more information contact Michael Yingling at [email protected] or (717) 948-3900 Ext. 4633
Income
Changes in median household income over time can provide insight into the potential spending power of consumers in the region. Initial analysis shows a significant estimated income growth across all areas between 2011 and 2016. An increase in income of 19.56 percent ($8,735.00) is expected between 2011 and 2016 within the primary market area. This increase is greater than the increase in the Pennsylvania median household income during the same time period. The projected increase in median household income for the tertiary market between 2010 and 2015 is also greater than that of Pennsylvania, 20.59 percent and 17.70 percent, respectively (see Table 2 – Trends in Median Household Income).
Table 2 – Trends in Median Household Income
2011 2016 % Change 2011-2016 Annual Rate
2 Miles $44,647 $53,382 19.56% 3.91% 3 Miles $49,901 $56,295 12.81% 2.56% 5 Miles $51,356 $61,931 20.59% 4.12%
PA $49,405 $58,149 17.70% 3.54% US $50,227 $57,536 14.55% 2.91%
Source: ESRI Business Information System
Housing
The number of housing units in all three identified market areas is projected to increase between 2011 and 2016. The largest rate of growth is expected to occur within the secondary market area, where the number of housing units is projected to increase by 6.75 percent between 2011 and 2016. This projected growth in the secondary market area is significantly greater than the projected growth in Pennsylvania during the same time period (see Table 3 – Number of Owner-Occupied Housing Units).
Table 3 – Number of Owner-Occupied Housing Units
2010
(Estimated) 2011
(Estimated) 2016
(Projected)
% Change 2010-2011
% Change 2011-2016
Annual Rate of Change 2011-2016
Numerical Change
2011-2016
2 Miles 4,472 4,434 4,723 -0.85% 6.52% 1.30% 289 3 Miles 6,139 6,116 6,529 -0.37% 6.75% 1.35% 413 5 Miles 15,077 15,036 15,962 -0.27% 6.16% 1.23% 926
PA 3,491,722 3,444,368 3,541,831 -1.36% 2.83% 0.57% 97,463 US 75,986,074 75,460,316 78,940,105 -0.69% 4.61% 0.92% 3,479,789
Source: ESRI Business Information Systems

SARAA Market Profile
11
For more information contact Michael Yingling at [email protected] or (717) 948-3900 Ext. 4633
The number of households in all three identified market areas is projected to increase more between 2011 and 2016 than the number of households statewide. The secondary market area is projected to see the greatest increase, 5.92 percent, between 2011 and 2016 (see Table 4 – Number of Households).
Table 4 – Number of Households
2010
(Estimated) 2011
(Estimated) 2016
(Projected)
% Change 2010-2011
% Change 2011-2016
Annual Rate of Change 2011-2016
2 Miles 7,223 7,315 7,721 1.27% 5.55% 1.11% 3 Miles 9,251 9,388 9,944 1.48% 5.92% 1.18% 5 Miles 21,482 21,800 22,948 1.48% 5.27% 1.05%
PA 5,018,904 5,032,107 5,121,169 0.26% 1.77% 0.35% US 116,716,292 117,457,661 121,712,803 0.64% 3.62% 0.72%
Source: ESRI Business Information Systems
The average household size is the largest in the tertiary market area when compared to the primary and secondary market areas. All market areas relevant to the airport and its surrounding properties are expected to decrease in household size between 2011 and 2016. All of the relative market area averages for household size are smaller than compared to Pennsylvania or national household averages.
Table 5 – Average Household Size
2010
(Estimated) 2011
(Estimated) 2016
(Projected)
2 Miles 2.26 2.25 2.24 3 Miles 2.29 2.29 2.27 5 Miles 2.36 2.36 2.35
PA 2.45 2.45 2.44 US 2.58 2.58 2.57
Source: ESRI Business Information Systems