sapa heat transfer investment report
TRANSCRIPT

Thick Slab Investment Proposal
2009-11-30
Niklas Ruud
Engineering Manager
Sapa Heat Transfer Shanghai (SHTS)

2
Table of Contents
Introduction......................................................................................................................... 3
Business Rational ........................................................................................................ 3
Favorable Project Financials ....................................................................................... 3
Market description .............................................................................................................. 4
Current strategy and market position ....................................................................... 4
Products ...................................................................................................................... 4
Big OD Beneficial ........................................................................................................ 6
SHTS Current and Forecasted Sales Volume ............................................................. 6
SHTS Competitor OD in the Market ........................................................................... 7
Japanese and Korean Customers ............................................................................... 7
North-America ............................................................................................................ 8
Strategic Business Plan with Larger OD ..................................................................... 8
Strategic Business Plan without Larger OD ............................................................... 8
Production efficiency .......................................................................................................... 9
Internal Benefits - Capacity ........................................................................................ 9
OEE for SHTS Main Rolling Mills ............................................................................... 10
Internal Benefits - Yield ............................................................................................ 10
Investment......................................................................................................................... 11
Equipment and Capex .............................................................................................. 11
Financials ........................................................................................................................... 12
Key financial metrics ................................................................................................. 12
Cash Flow .................................................................................................................. 12
Conclusion ................................................................................................................. 12
Project Plan ....................................................................................................................... 13
Time-plan .................................................................................................................. 13
Risk Assessment ................................................................................................................ 14
Transfer Side effects / Pros and Cons....................................................................... 14
EHS Impact on the CM-bay Warehouse .................................................................. 14
Logistic Risks with silicon and slabs ......................................................................... 14
Appendix ................................................................................................................... 15
Layout – Cold Mill Logistic internal warehouse .......................................... 15
3
Introduction
This document has been prepared to serve as decision material in relation to the
decision on whether to go for bigger OD for Heat Transfer products in Shanghai. It
gives a perspective on the market development for Heat Transfer and outlines the
intended strategy for Sapa Heat Transfer in China and the intended positioning for the
bigger OD product. Some more detail into the operational setup and benefits which
shows the investment plan needed to support operations. It concluded by showing
the financials of the intended investment, as well as risk analysis.
Sapa have three main strategic goals:
i. Protect and further develop our competitiveness in the market
ii. Provide the customer with the best possible service and quality products
iii. Increase the internal yield
Sapa Heat Transfer Shanghai supports all these three goals with the big OD, increasing
the competitiveness in the market by trying best to serve the customer and
understand their internal constraints and improving SHTS internal yield by 3 percent
points.
Business Rational
There are three main reasons for this investment:
i. Invest in larger sized slab, giving SHTS bigger OD product, which will improve
market advantage and internal yield, resulting in higher revenue over time.
ii. Upgrading the whole plant for a higher capacity output throughout the whole
production line, contributed from reduced change-over times.
iii. The favorable financials of the plant investment.
Favorable Project Financials
The SHTS thick slab project delivers favorable project financials
Net Present Value of MCNY 152
IRR of 49%
A payback time of 37 months.

4
Market description
Current strategy and market position
Sapa Heat Transfer Shanghai is a supplier of aluminum based brazing strip for heat
exchanger applications to the Asian markets, with China as the core market. This is
material used in heat exchangers which are brazed, as opposed to mechanically joined,
which is the competing solution that dominated the automotive market until the early
1990’ties. Since then mechanically joined solutions have gradually been replaced by
brazed solutions and today the market share is only a few percent. As illustrated by
figure 1, the Asian market has been characterized by rapid growth since 2003 (on
average 9 percentage per annum 2008-2011). The single quickest growing market has
been the Chinese with an average growth of 19 percent per annum 2008-2011.
Figure 1
During the coming years, we expect a growth of around 7% per annum in Asia. In China,
we expect a growth of 8%, and Asia excluding China 5%. So although the volume
growth is projected to slow down significantly, it will remain strong compared to the
growth in the West.
Products
There are four main heat transfer products based on aluminum brazing strip: unclad fin,
clad fin, tube and plate. The four products are used for making specific parts of a heat
exchanger. For most applications, two or three of these products are used, at ratios
depending on the specific application. All four products are however important, as
market volumes are large for all four, and it is important to sell a complete products
range to customers seeking a solution supplier.
Market volumes for brazed heat transfer strip in Asia
Metric tonnes
109 126
170 184204
224244
264282
302321
343366
+7%
+9%
2020
619
254
2019
585
242
2018
553
232
2017
523
221
2016
494
212
2015
469
205
2014
439
195
2013
408
185
2012
382
178
2011
341
157
2010
328
158
2009
256
130
2008
260
151
Asia
excludingChina
China
CAGR
2008-11
CAGR
2011-20
19% 8%
1% 5%
Source: Sapa

5
Figure 2
The four products, although all using aluminum alloys and produced in largely the same
equipment, have significant differences in market price, production capacity need,
contribution relative to capacity need, and customer’s purchasing criteria, as illustrated
by figure 2.
Unclad fin is the most basic product, consisting of only one alloy, and primarily used in
automotive radiators and heaters. It is rolled to thin gauges and therefore uses
significant mill capacity, especially cold mill capacity. The product is a commodity sold
primarily on price (quality and delivery are qualifiers), why contribution per mill hour is
low.
Clad fin is more advanced, consisting of 2-5 layers (3 layer design makes up ~90% of
market) of different alloys, and is primarily used in parallel flow condensers, which is
the dominating design. For unclad fin, quality next to price is the most important
purchasing criteria. It is also uses significant cold mill capacity, but as it is sold at
significantly higher price than unclad fin, the contribution per mill hour is significantly
higher.
Tube is the material for which quality is most critical. The aluminum strip is folded or
welded into a tube by the customer, which is a sensitive process. Tube material is
primarily used in radiators, heaters and condensers. As the material is significantly
thicker than fin, less mill capacity is needed so the contribution per machine hour is
high.
Plate material is the thickest of the materials, therefore requiring the least mill capacity.
The material is stamped by the customer and used most kinds of heat exchanger
applications. Stamping is a less sensitive process than tube welding and
folding/brazing, why the customers are more sensitive to the price of this product than
to tube material.
The differences in growth rates between products is primarily linked to different growth
rates for the various end products, but also by technical trends, e.g., down gauging,
applies to different extents to different products.
Source: Sapa
Unclad fin
Clad fin
Clad tube
Clad plate
Product
13,7
8,5
18,9
24,4
0,070
0,090
0,280
1,30
Approximate
average gaugemm
Asia market
volume 2011Tonnes
Growth rate
2008-2011Percent/year
7,7
10,4
10,8
9,4
12-16
14-17
13-20
8-21
Market price
CNY/kg
0-1
3-5
2-3
2-3
Down
gaugingPercent/year
Primary
purchasing criteria
Cost
Quality and cost
Quality
Quality and cost
Overview of brazing sheet products

6
Big OD Beneficial
Most large customer needs the biggest OD possible (like North America). The other
issue we have is for the customers that require smaller OD coils and where we have to
split mother coils in half and sometime in three. When we split one mother coil we
often end up with coils that do not reach the maximum customer OD which leads
customer to complain about inefficiencies, also internally splitting a mother coil lower
our internal OEE since more frequent setup times are required. Problems can start
when the customer starts to tighten the range of the OD max/min requirement, more
pressure will be put on SHTS OD performance. Ideal scenario would be to deliver Full
OD to all customers; however that’s not possible at current state.
SHTS Current and Forecasted Sales Volume
Below chart (figure 2) display forecasted sales order volume from 2013 to 2018,
increasing big OD orders for the different product mixes. TC and FC are in fact showing
tremendous increase in demand over-time while FU mix will be reduced in 3-4 years
time. For big OD tube material which are Sapas key business are leading and FC not far
behind, while. While 70% of the Sales volume can utilize a big OD, however 16% will
be for full OD (1770mm) and 50% will need to cut the mother coil in the middle.
30% of the sales volume is not yet willing to go for the bigger OD, these customers are
mostly the Japanese and the Koreans (HALLA). For these customers we will keep our
current slab size and deliver full OD 1650mm, since the 1770mm OD is too big due to
internal equipment constraints.
Figure 3
470 slab 2013 % 2014 % 2015 % 2016 % 2017 2018
FU Sales plan 13,200 15,743 15,798 15,859 14,500 13,900
1300mm-1650mm No 3,200 4,150 5,300 4,600 4,800 4,900
1450-1800mm Yes - 650 950 1,200 1,400 1,600
Below 1300mm Yes 10,000 11,593 10,498 11,259 9,700 9,000
FC Sales plan 19,490 21,613 24,963 26,691 28,026 28,586
1300mm-1650mm No 6,300 7,350 8,400 9,200 9,700 10,500
1400-1800mm Yes 1,200 1,450 1,800 2,200 3,200 4,200
Below 1300mm Yes 11,990 12,813 - 14,763 - 15,291 - 15,126 - 13,886
TC Sales plan 34,595 38,605 43,325 46,575 49,835 51,330
1300-1650mm No 16,604 17300 19400 21900 23,700 24,500
1400-1800mm Yes 7,500 8200 10400 12600 13,800 15,600
Below 1300mm Yes 12,395 13,105 13,525 12,075 12,335 11,230
PC Sales plan 22,990 26,768 30,721 33,634 35,316 36,375
1300mm-1650mm No 1,600 2,400 2,700 3,100 3,500 4,200
1400-1800mm Yes - - - - - -
Below 1300mm Yes 21,390 24,368 28,021 30,534 31,816 32,175
Total Sales plan 90,275 102,729 114,807 122,759 127,677 130,192
1300mm-1650mm No 27,704 30.69% 31,200 30.4% 35,800 31.18% 38,800 31.61% 41,700 32.7% 44,100 33.9%
1400-1800mm Yes 8,700 9.64% 10,300 10.0% 13,150 11.5% 16,000 13.0% 18,400 14.4% 21,400 16.4%
Below 1350mm Yes 55,775 61.78% 61,879 60.2% 66,807 58.2% 69,159 56.3% 68,977 54.0% 66,292 50.9%
470mm slab coverage 64,475 71.4% 72,179 70.3% 79,957 69.6% 85,159 69.4% 87,377 68.4% 87,692 67.4%

7
SHTS Competitor OD in the Market
Basic OD information about our domestic competitors, mainly the Top4 shows great
competition to SHTS, especially Huafon and Alcoa KS who specializes in tube material
which is the main business for Sapa.
Figure 4
The North American competitors Alcoa and Novelis
Novelis can presently slit Fin material up to OD 1828mm & heavy gauge to 2134mm
Alcoa can presently slit heavy gauge and common alloy up to 2134mm
Japanese and Korean Customers
Japanese and Korean customers represented for Fin and Tube material in (figure 5), and
Thick (plate material) in figure 6.
Figure 5 (the 150 to 400 is the size of the mandrel for different customers application)
(OD requirement min/max +/- 200mm)
According to (figure 6) the Fin and tube material for the Japanese and Korean
customers shows their max OD requirement < 1650mm, in that case the OD 1770mm
will be slightly big for these customers, and will strategically provide them a smaller
sized slab.
Competitor Max OD (mm) Normal Delivery (mm) Main Appplication Comments
Huafon 1800 1750 Tube Material Biggest OD among Domestic Rolling Mill
WFSY 1700 1650 Plate Strip Similar to SHTS
WXYB 1700 1650 ACCFC Similar to SHTS
Alcoa KS 1700 1650 Tube Material Similar to SHTS
NTHX 1500 1200 Fin Material Smaller than SHTS
150 200 250 300 400
Max OD/customers 1650 1650 1650 1650 1650
LGS 1620/cut in two 1079 1091 1103 1117 1151
LGS 1770/cut in two 1191 1202 1213 1226 1257

8
Figure 6 (the 300 to 500 is the size of the mandrel for different customers application)
(OD requirement min/max +/- 200mm)
Thick material OD requirement is just about 1300mm due to its heavy to handle
internally at customer site, the thick slab that provides bigger OD would be more
beneficial to the customer of plate due to its closer to their requirement of max OD,
telling us two things;
Reduced risk for claims and relieving some pressure to SHTS when the customer
wants to tighten the min/max OD range n their specifications.
Better for us internally from still keeping the min OD level even when some
quality issues arise, SHTS not needing to scrap the material for not reaching
required min OD levels.
North-America
Large customers are generally set-up to use OD coils 1828mm for tube-stock and OD
1524mm for Fin-stock. Customer base with this capability such as; Valeo, Delphi, GMCH,
Visteon. North American customers want bigger OD’s, around 1800mm OD.
Strategic Business Plan with Larger OD
According to (figure 3) larger OD’s coverage is around 70%
Will deliver applications such as;
1350mm > OD, plate material in the heavy gauge slitters
1400mm < OD < 1800mm, increasing the competitiveness in tube and Fin.
Strategic Business Plan without Larger OD
According to (figure 3) current OD’s coverage will remain around 30%
Applications
1300mm > OD, plate material in the heavy gauge slitters
1300mm < OD < 1650mm
300 400 500
Max OD/customers 1300 1300 1300
HGS 1620/cut in two 1110 1143 1184
HGS 1770/cut in two 1219 1249 1286
9
Production efficiency
The thick slab is designed to follow the strategic production equipment and with limit
capital investment in order to better protein and remain competitive in the market.
Larger slabs means larger coil size (bigger OD), which improves the yield (same head
and tail loss). The dimensions of the slabs you can find in the table below.
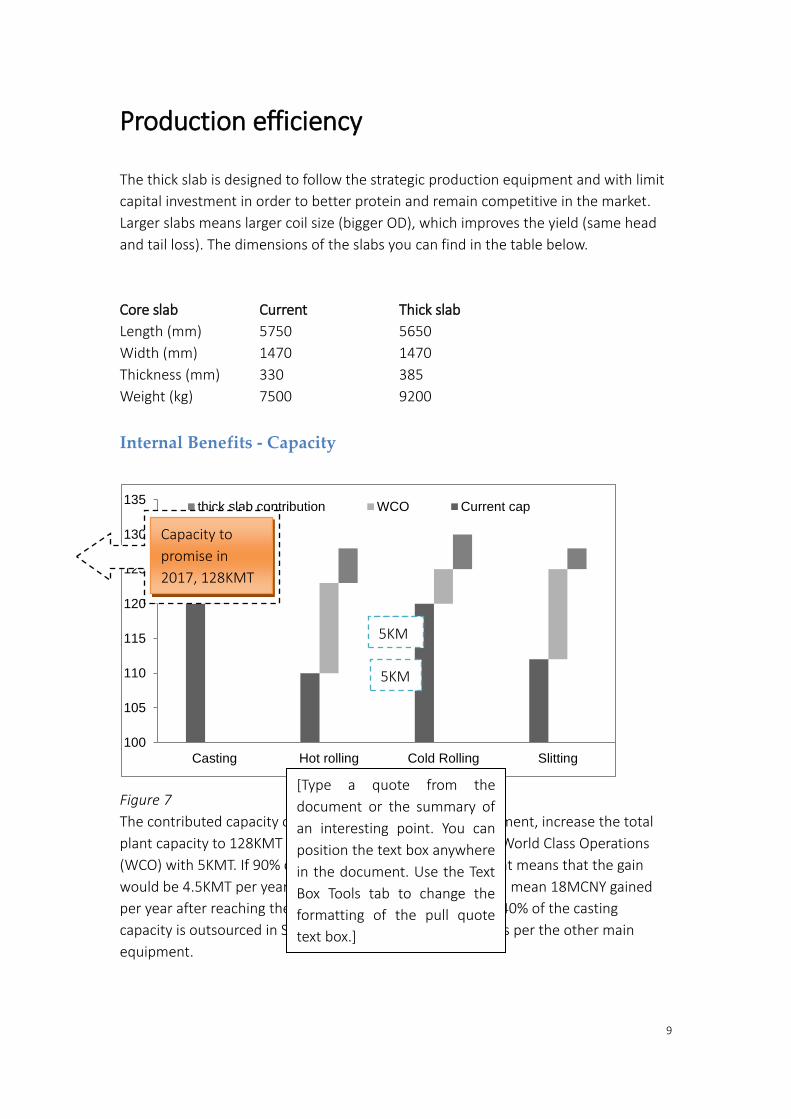
Core slab Current Thick slab
Length (mm) 5750 5650
Width (mm) 1470 1470
Thickness (mm) 330 385
Weight (kg) 7500 9200
Internal Benefits - Capacity
Figure 7
The contributed capacity of 5KMT from the thick slab investment, increase the total
plant capacity to 128KMT per year, it’s an increase over the World Class Operations
(WCO) with 5KMT. If 90% of this capacity can be realized, that means that the gain
would be 4.5KMT per year. In extra profit to SHTS that would mean 18MCNY gained
per year after reaching the capacity roof in 2016. Note that 40% of the casting
capacity is outsourced in SHTS so don’t act as a bottleneck as per the other main
equipment.
100
105
110
115
120
125
130
135
Casting Hot rolling Cold Rolling Slitting
thick slab contribution WCO Current cap
Capacity to
promise in
2017, 128KMT
5KM
T
5KM
T
5KM
T
[Type a quote from the
document or the summary of
an interesting point. You can
position the text box anywhere
in the document. Use the Text
Box Tools tab to change the
formatting of the pull quote
text box.]
10
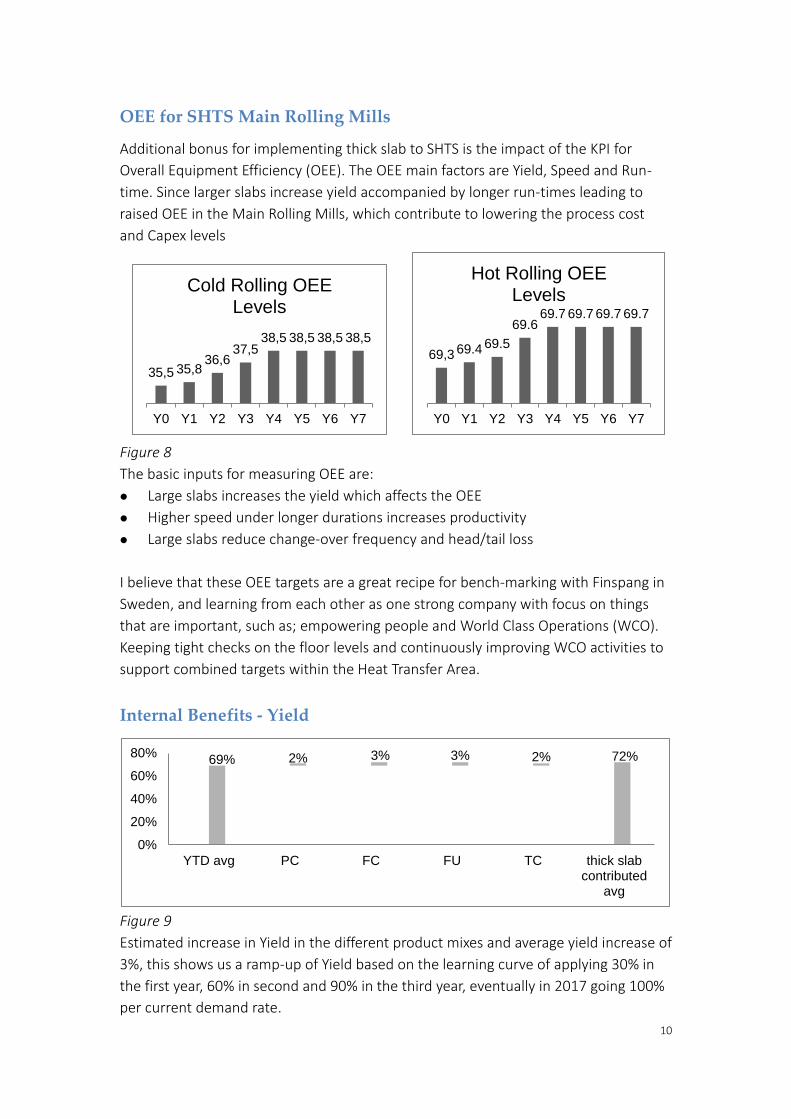
OEE for SHTS Main Rolling Mills
Additional bonus for implementing thick slab to SHTS is the impact of the KPI for
Overall Equipment Efficiency (OEE). The OEE main factors are Yield, Speed and Run-
time. Since larger slabs increase yield accompanied by longer run-times leading to
raised OEE in the Main Rolling Mills, which contribute to lowering the process cost
and Capex levels
Figure 8
The basic inputs for measuring OEE are:
Large slabs increases the yield which affects the OEE
Higher speed under longer durations increases productivity
Large slabs reduce change-over frequency and head/tail loss
I believe that these OEE targets are a great recipe for bench-marking with Finspang in
Sweden, and learning from each other as one strong company with focus on things
that are important, such as; empowering people and World Class Operations (WCO).
Keeping tight checks on the floor levels and continuously improving WCO activities to
support combined targets within the Heat Transfer Area.
Internal Benefits - Yield
Figure 9
Estimated increase in Yield in the different product mixes and average yield increase of
3%, this shows us a ramp-up of Yield based on the learning curve of applying 30% in
the first year, 60% in second and 90% in the third year, eventually in 2017 going 100%
per current demand rate.
35,5 35,836,6
37,538,5 38,5 38,5 38,5
Y0 Y1 Y2 Y3 Y4 Y5 Y6 Y7
Cold Rolling OEE Levels
69,3 69.4 69.5
69.669.7 69.7 69.7 69.7
Y0 Y1 Y2 Y3 Y4 Y5 Y6 Y7
Hot Rolling OEE Levels
69% 2% 3% 3% 2% 72%
0%
20%
40%
60%
80%
YTD avg PC FC FU TC thick slabcontributed
avg

11
Investment
In order to keep capex levels low, necessary machine upgrades for this bigger OD
capability setup are made by experienced buyers and project professionals in SHTS,
who have purchased and upgraded equipment since the beginning of 2001. Countless
of projects have been made earlier in 10 years time; this experience saves the
investment a lot of costs which other ways a less experienced team wouldn’t manage
to achieve. Strategically SHTS technical teams have been using mechanical structures
from China with control and drive systems from Western manufacturers.
Attractive investment proposal promising a highly performance plant supporting the
growing market in shortest possible time
Equipment and Capex
Figure 10
12
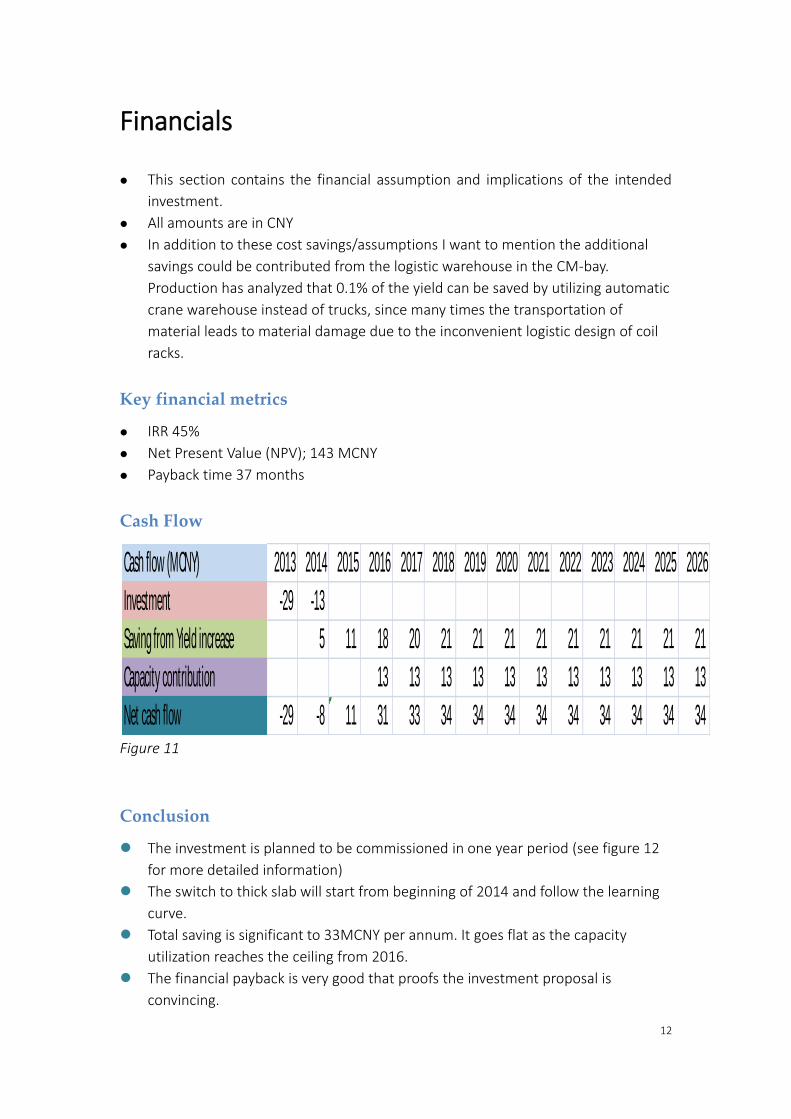
Financials
This section contains the financial assumption and implications of the intended
investment.
All amounts are in CNY
In addition to these cost savings/assumptions I want to mention the additional
savings could be contributed from the logistic warehouse in the CM-bay.
Production has analyzed that 0.1% of the yield can be saved by utilizing automatic
crane warehouse instead of trucks, since many times the transportation of
material leads to material damage due to the inconvenient logistic design of coil
racks.
Key financial metrics
IRR 45%
Net Present Value (NPV); 143 MCNY
Payback time 37 months
Cash Flow
Figure 11
Conclusion
The investment is planned to be commissioned in one year period (see figure 12
for more detailed information)
The switch to thick slab will start from beginning of 2014 and follow the learning
curve.
Total saving is significant to 33MCNY per annum. It goes flat as the capacity
utilization reaches the ceiling from 2016.
The financial payback is very good that proofs the investment proposal is
convincing.
Cash flow (MCNY) 2013 2014 2015 2016 2017 2018 2019 2020 2021 2022 2023 2024 2025 2026
Investment -29 -13
Saving from Yield increase 5 11 18 20 21 21 21 21 21 21 21 21 21
Capacity contribution 13 13 13 13 13 13 13 13 13 13 13
Net cash flow -29 -8 11 31 33 34 34 34 34 34 34 34 34 34

13
Project Plan
Time-plan
The automatic warehouse will be located at the same area there Sapa have the
current coil storage today. To avoid any impact to the production, it’s was needed to
find some suitable area to store coils. It was decided to build temporary coil storage
for cold rolling in front of the finishing work shop. After finalizing the project, this area
will act as finishing coil storage.
Figure 12

14
Risk Assessment
Transfer Side effects / Pros and Cons
-Full OD size could be a challenge for narrow width fin material (10-16mm)
-Hot Rolling could face some difficulties with edge cracking and clad-ratio distribution.
-Difference of cooling in the inner and outer of finished coil
+Preheating showing good sign with less loaded package
+Invest in logistics equipment will help the customers to use more full OD coils
Finspang have experienced problems with the yield after going from 400mm to
600mm slabs. However that was a 30% increase, SHTS are only going up 15% so the
impact on clad ratio distribution isn’t that obvious. In addition SHTS have tested to run
435mm slabs without any problems for the material properties (clad ratio). However
470mm slabs are still untested, I believe a simulation test should be done to further
consider any possible risks.
EHS Impact on the CM-bay Warehouse
This year SHTS have had some logistic problems involving truck traffic, one incident
with two trucks crashing in to each other during shift, no one was injured during the
accident. The logistic in SHTS Cold mill Coil storage is not good, it’s too tight for the
traffic actually circulating around in that workshop. The green walk path are passing
with trucks all the time, and material are hard to handle on the 3rd level storage
sometime leading to material damage during unloading to annealing.
The EHS manager believes the CM coil storage will reduce the amount of truck
accident within SHTS and provide a safer work environment for people.
Logistic Risks with silicon and slabs
Based on 70% thick slab coverage the logistic risk will show a limited impact to our
production efficiency. Due to the 30% of sales volume are from the Japanese and
Korean (HALLA) orders the risk are limited due to the fact they carry their own alloy
specification. One risk is than the 15% of the alloy from the customer of current OD
need to be manufactured in SHTS, this will generate new specifications and cause
increase in WIP (work in process), and logistic difficulties in silicon sheet storage due
to high-bay storage warehouse storage limitations.

15
Appendix
Layout – Cold Mill Logistic internal warehouse
Figure 13