sap flow system - mcgill university
TRANSCRIPT

Modeling Crop Growth under varying
Water Table Scenarios
Ajay K Singh

Thesis Objectives
• To investigate the crop water and
nutrient uptake under different soil water
conditions due to free drainage and
constant water table conditions.
• To do a comparative study of different
crop growth models.
• To couple DRAINMOD model to a crop
growth model.

Sap flow

Sap Flow System
• Direct transpiration measurement
• Non-invasive and flexible
• Constant heat-energy balance
• Real-time monitoring and recording
• Measures absolute mass-flow
•Stem gages: 9 to 32 mm

• The energy balance is:
• Pin = Qr + Qv + Qf (W) (1)
• Pin = V2 /R (W) from Ohm’s law
Energy Balance Equations
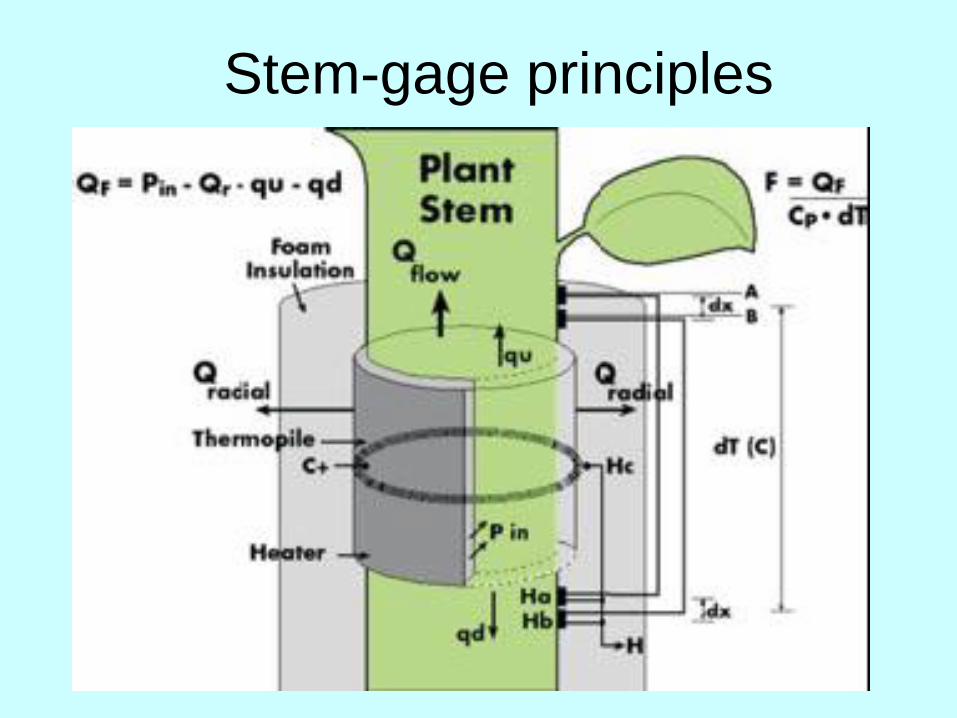
Stem-gage principles


Stem-gage
control box
Solar panel
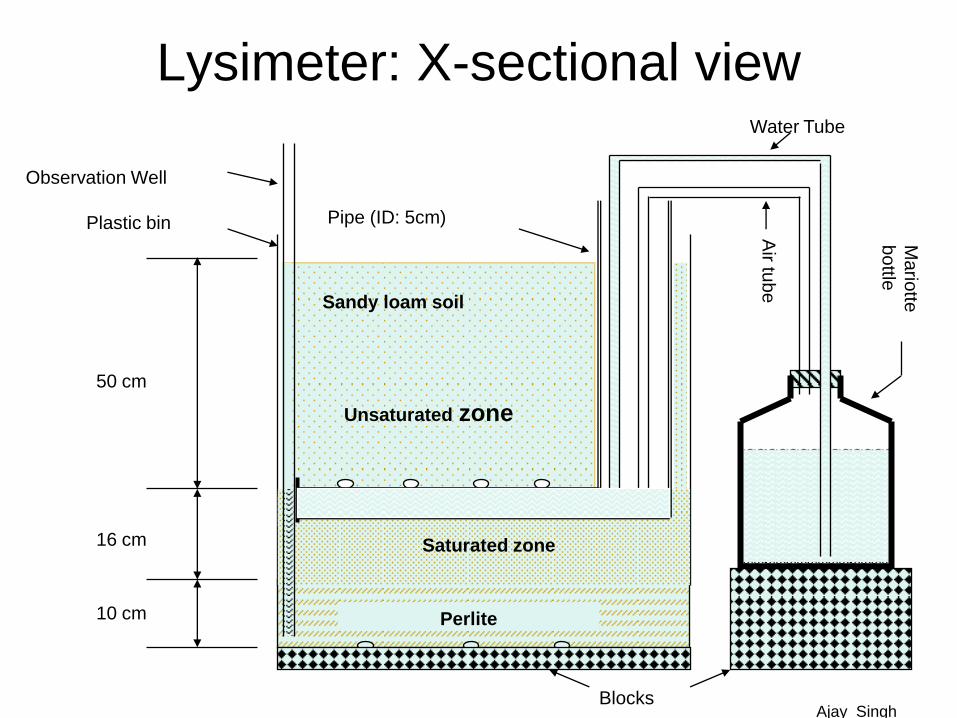
Lysimeter: X-sectional view
Perlite
Sandy loam soil
10 cm
50 cm
16 cm
Unsaturated zone
Saturated zone
Mario
tte
bo
ttle
Water Tube
Air tu
be
Ajay Singh
Plastic bin Pipe (ID: 5cm)
Observation Well
Blocks

Lysimeters

Photosynthesis meter
Licor 6400

Leaf area meter – Licor 3000A

SPAD-meter
Source: Minolta

Nitrogen Treatments
A. Greenhouse (Macdonald Campus) 2007-2008
There are four nitrogen treatments:
1. A – 100 Kg/ha
2. B – 140 Kg/ha
3. C – 180 Kg/ha
4. D – 270 Kg/ha
Water Table is maintained at 50 cm from the soil surface.

Nitrogen Treatments
B. Gagnon (Bedford) 2007
There are three nitrogen treatments:1. A – 90 Kg/ha
2. C – 180 Kg/ha
3. D – 270 Kg/ha
There is a free tile drainage. The tiles are placed one meter deep and 10 m wide.

Nitrogen Treatments
C. St. Emmanuel ( Corteau-du-lac) 2008-2009
There are three nitrogen treatments:1. A – 90 Kg/ha
2. C – 180 Kg/ha
3. D – 270 Kg/ha
Water table Management
1. Free tile drainage
2. Water table at 0.6 m with sub-irrigation

Plant Parameters
• The Parameters that are currently monitored /measured:
• WT
• ET
• Corn Water use
• Leaf area
• Photosynthesis
• Stem diameter
• No. of leaves
• Plant height
• Nitrogen content in the leaf
• Dry biomass

Greenhouse- Diameters of Corn by Treatment
0
5
10
15
20
25
13-mai 18-mai 23-mai 28-mai 2-juin 7-juin 12-juin 17-juin
Av
era
ge
dia
me
ter
of
co
rn s
tem
(m
m)
Treatment A'
Treatment B'
Treatment C'
Treatment D'
Stem Diameters vs N2 treatments

0
500
1000
1500
2000
2500
3000
3500
4000
4500
5000
26-May 28-May 30-May 1-Jun 3-Jun 5-Jun 7-Jun 9-Jun 11-Jun 13-Jun
To
tal L
eaf
Are
a (
cm
^2)
A'
B'
C'
D'
Leaf Area vs N2 treatments

Greenhouse- Plant height by treatment
0,00
50,00
100,00
150,00
200,00
250,00
13-mai 18-mai 23-mai 28-mai 2-juin 7-juin 12-juin 17-juin 22-juin
Heig
ht
of
pla
nt
fom
base t
o t
ip o
f lo
ng
est
leaf
(cm
)
Treatment A'
Treatment B'
Treatment C'
Treatment D'
Plant Height vs N2 treatments

References
• ftp://ftp.dynamax.com