santa rosa road traffic signal system...
TRANSCRIPT

Santa Rosa RoadTraffic Signal System Optimization
Final Report
Prepared For:
County of Ventura Public Works Agency
July 2016
Prepared by:

Santa Rosa RoadTraffic Signal System Optimization Final Report
TableofContents
1. EXECUTIVE SUMMARY ................................................................................................... 1
1.1 Study Area and Time of Day................................................................................................. 11.2 Timing Approach .................................................................................................................. 11.3 Implementation ..................................................................................................................... 21.4 Data Collection ..................................................................................................................... 21.5 Results .................................................................................................................................. 2
2. INTRODUCTION AND METHODOLOGY .......................................................................... 32.1 Study Area ............................................................................................................................ 32.2 Data Collection ..................................................................................................................... 32.3 Modeling Software ................................................................................................................ 52.4 Study Objectives .................................................................................................................. 52.5 Field Review .......................................................................................................................... 6
3. COORDINATED TIMING PLAN PREPARATION .............................................................. 7
3.1 Time of Day ........................................................................................................................... 73.2 Cycle Length Evaluation ...................................................................................................... 73.3 Split Preparation ................................................................................................................... 93.4 Offset Optimization ............................................................................................................... 93.5 Signal Timing Sheets............................................................................................................ 9
4. IMPLEMENTATION AND RESULTS ............................................................................... 10
4.1 Implementation ................................................................................................................... 104.2 Evaluation Methodology..................................................................................................... 104.3 Comparison of Before and After Results .......................................................................... 104.4 Summary of Findings ......................................................................................................... 16
Appendix A – Time-Space DiagramsAppendix B – Coordinated Timing SheetsAppendix C – Travel Time Run Results

Santa Rosa RoadTraffic Signal System Optimization Final Report
ListofFigures
Figure 2-1 – Santa Rosa Road Area Signals ............................................................................................ 4Figure 4-1 – Santa Rosa Road Eastbound Average Progression............................................................ 12Figure 4-2 – Santa Rosa Road Westbound Average Progression........................................................... 13Figure 4-3 – Santa Rosa Road Eastbound Average Stop Time by Intersection ....................................... 14Figure 4-4 – Santa Rosa Road Westbound Average Stop Time by Intersection ...................................... 15
ListofTables
Table 1-1 – Santa Rosa Road Travel Time Benefits ................................................................................. 2Table 3-1 – Modeled Queue Lengths at Moorpark Road with Signal Timing Adjustment ........................... 8Table 4-1 –Santa Rosa Road Travel Time Summary ............................................................................. 11Table 4-2 –Santa Rosa Road Delays and Stops Summary..................................................................... 11

Page | 1
Santa Rosa RoadTraffic Signal System Optimization Final Report
1. EXECUTIVE SUMMARY
This signal timing project updated traffic signal coordination on the 3.5 mile corridor along Santa Rosa Roadbetween Yucca Drive and Moorpark Road in unincorporated Ventura County. The signal coordination effortimplemented recommendations contained in an initial assessment of signal timing parameters andopportunities along the corridor (Kimley-Horn, 2015). The initial effort identified signal timing parametersthat needed to be updated to reflect current standards and areas in which to enhance the efficiency ofsignal operations along the corridor. This project achieved travel time benefits and reduced greenhousegas emissions through optimization of the signal network. This report summarizes the methodology andresults of the signal timing study.
1.1 STUDY AREA AND TIME OF DAY
Signal timing plans were developed for all eight signalized intersections along the County-operated portionof Santa Rosa Road. One of the intersections, Moorpark Road, was left uncoordinated in both peak periodsdue to the very high turning movement volumes at this intersection. However, certain timing parameterswere modified to reduce vehicle delays at this location.
Coordinated timing plans were prepared for AM and PM weekday peak periods. Prior to the completion ofthis study, coordination timings were in use for a 1.5 hour period starting at 6:45 AM and a three hour periodstarting at 3:00 PM. Based on the recommendation provided in the initial assessment, the period ofcoordination was extended to three hours in the morning starting at 6:30 AM and four hours starting at 2:30PM in the afternoon. This extended period of coordination, which increased the benefits of the signalcoordination, was implemented in conjunction with the updated coordinated signal timing parameters.
1.2 TIMING APPROACH
The initial assessment study provided recommendations to achieve compliance with recently updatedCalifornia Manual on Uniform Traffic Control Devices (CA MUTCD, 2014) standards for the following signaltiming parameters:
· Yellow times;· All-red times;· Pedestrian walk times; and· Pedestrian flashing don’t walk times.
Minimum green times were also adjusted where needed for consistency along the corridor.
As part of the coordination effort, the following signal timing parameters were modified:
· Cycle length;

Page | 2
Santa Rosa RoadTraffic Signal System Optimization Final Report
· Force-offs;· Maximum green times; and· Offsets.
1.3 IMPLEMENTATION
The timing plans were implemented in early June 2016, prior to the end of the school year. Followingimplementation, the corridors were observed to identify if there was any need for refinement or adjustments.
1.4 DATA COLLECTION
Travel time data was collected in April 2016 prior to implementation and in June 2016 after implementation.Travel time data was collected using the floating-car technique. Seven travel time runs were completed ineach direction along the full length of the study corridor in each peak period. Data was collected regardingtravel time, stopped time, and average travel speed at each roadway segment and along the corridor as awhole. The travel time data collection allowed for evaluation of the effect of the signal timing changes.
1.5 RESULTS
Table 1-1 displays the change in corridor travel time on Santa Rosa Road associated with the coordinatedsignal timing. As shown in the table, average travel time was reduced in both directions in both peakperiods. Total stopped time decreased significantly (greater than 35 percent in both directions in both peakperiods), as did the total number of stops per trip. The reduction in stopped time and the number of stopsis particularly beneficial as it directly leads to a reduction in fuel consumption and greenhouse gasemissions associated with vehicle idling.
Table 1-1 – Santa Rosa Road Travel Time BenefitsChange in:
DirectionTravelTime
StoppedTime
AverageSpeed
Numberof Stops
MorningEastbound -5% -63% 2% -1.1
Westbound -11% -57% 4% -0.2
EveningEastbound -3% -72% 2% -0.3
Westbound -1% -38% 1% -0.8

Page | 3
Santa Rosa RoadTraffic Signal System Optimization Final Report
2. INTRODUCTION AND METHODOLOGY
This signal timing project updated traffic signal coordination parameters on Santa Rosa Road. The signalcoordination effort was the follow-on work to an initial assessment of signal timing parameters andopportunities along the corridor (Kimley-Horn, 2015). The initial effort identified signal timing parametersthat needed to be updated to reflect current standards and areas in which to enhance the efficiency ofsignal operations along the corridor. This project achieved travel time benefits and reduce greenhouse gasemissions through optimization of the signal network.
2.1 STUDY AREA
Timing plans were developed for all signalized intersections along Santa Rosa Road within the County ofVentura. The intersections included in the study area are:
n Santa Rosa Road/Moorpark Road;n Santa Rosa Road/Vista Grande;n Santa Rosa Road/Vista Arroya Drive;n Santa Rosa Road/Las Posas Road;n Santa Rosa Road/Applewood Lane;n Santa Rosa Road/Brittany Park Road;n Santa Rosa Road/Blanchard Road; andn Santa Rosa Road/Yucca Drive.
Figure 2-1 illustrates the signals included in the study area.
2.2 DATA COLLECTION
County of Ventura staff provided the data needed to support the signal timing study. Data utilized includedthe following:
§ Existing timing sheets for the intersections§ Weekday peak period turning movement vehicle counts and bicycle counts§ Weekday roadway segment counts for Santa Rosa Road
Supplemental 24-hour roadway segment count data was collected in March 2015 as part of the initialassessment of the corridor. The roadway segment count data was collected in order to determine the timeperiods for signal coordination.

Figure 2-1Santa Rosa Road Area Signals
NOT TO SCALE
Santa Rosa Road Traffic Signal System Optimization
Legend
Signalized intersection
Project Area
Yucc
a Dr
Blan
char
d Rd
Britt
any
Park
Rd
Vist
a Gr
ande
Vist
a Arro
ya D
r
Las
Posa
s Rd
Anda
lusi
a Dr
Appl
ewoo
d Ln
Pene
lope
Pl
Moorp
ark
Rd
Santa Rosa Rd

Page | 5
Santa Rosa RoadTraffic Signal System Optimization Final Report
2.3 MODELING SOFTWARE
The Synchro 9 software application was utilized to prepare the signal coordination plans and develop apreliminary assessment of the effectiveness of those plans. Synchro 9 models were built for both the AMand PM peak periods as part of the initial assessment. These models were utilized in developing newcoordinated signal timing parameters.
2.4 STUDY OBJECTIVES
Kimley-Horn was initially retained by the County of Ventura to provide an evaluation of the currentoperational performance of eight traffic signals along Santa Rosa Road in County of Ventura jurisdiction.This effort included:
· Existing Timing Assessment and Field Observation – Kimley-Horn visited the project site, drovethe corridor several times, and generally observed the operations of the signal system before,during, and after both AM and PM peak hours. As a part of this effort, Kimley-Horn also measuredcrosswalk lengths to identify required pedestrian crossing times;
· Signal Timing Analysis – Kimley-Horn prepared an existing conditions Synchro model based oninformation provided by County staff and field observations. Following completion of the model,Kimley-Horn developed a list of potential improvement measures that would serve to enhancecorridor operations; and
· Existing Traffic Signal Timing Conditions Report - Kimley-Horn prepared this memorandumdetailing the findings and recommendations as developed in the previous tasks.
Based on the Existing Traffic Signal Timing Conditions Report, County staff implemented a number ofrevisions to the signal timing parameters for the traffic signals within the study area. These revisions wereimplemented in order to achieve compliance with recently updated California Manual on Uniform TrafficControl Devices standards or to achieve consistency in timing parameters along the corridor. Timingparameters modified include:
· Yellow times;· All-red times;· Pedestrian walk times;· Pedestrian flashing don’t walk times; and· Minimum green times.
This study was focused on providing the County with updated signal timing parameters. Parameters thatwere modified as part of this project included:
· Cycle length;· Force-offs;

Page | 6
Santa Rosa RoadTraffic Signal System Optimization Final Report
· Maximum green times; and· Offsets.
2.5 FIELD REVIEW
Field review of existing conditions and corridor operations was conducted prior to developing signal timingparameters and coordinated signal timing for each of the study intersections. Field information wascollected to assist with the signal timing study, including:
· Operations of the signal system before, during, and after both AM and PM peak hours;· Observed queuing and delays at signalized intersections;· Crosswalk lengths; and· Travel speeds and speed limits.

Page | 7
Santa Rosa RoadTraffic Signal System Optimization Final Report
3. COORDINATED TIMING PLAN PREPARATION
This section summarizes the procedures for the signal timing evaluation.
3.1 TIME OF DAY
Timing plans were prepared for AM and PM weekday peak periods. Coordination timings prior to thecompletion of this study were in use for 1.5 hours starting at 6:45 AM and for three hours starting at 3:00PM. The initial assessment found that the actual peak period extended beyond the limited period wherecoordination was in effect. By extending the coordination period, the benefits of coordination, such asreductions in travel time, stopped time, greenhouse gas emissions, and fuel consumption, can be increasedas the coordination is applied to a greater number of vehicles.
Based on the recommendation provided in the initial assessment, the period of coordination was extendedto three hours in the morning starting at 6:30 AM and four hours in the afternoon starting at 2:30 PM. Theadditional period of coordination expands the number of vehicles that benefit from the coordination by over3,600 vehicles per day (a 44 percent increase from before conditions). This extended period of coordinationwas implemented in conjunction with the updated coordinated signal timing parameters.
3.2 CYCLE LENGTH EVALUATION
Based on an evaluation of traffic volumes, pedestrian timings, traffic patterns, and signal spacing,coordinated cycle lengths were proposed for each signal within the study area proposed for coordination.Longer cycle lengths increase the amount of green time available for Santa Rosa Road and allow for longervehicle platoons; however, they may also increase delays for turning vehicles. Thus a balance wasachieved to maintain an efficient operation at each individual intersection (low delay) while also providing agreen bandwidth along the corridor itself (shorter travel time). As this corridor has only eight signals andthey are spaced fairly closely together, all of the signals were grouped together under one cycle length.
The Moorpark Road traffic signal was recommended to operate uncoordinated in both peak periods due tothe unique characteristics of that intersection relative to the others along the corridor. The Moorpark Roadintersection has much higher turning movement volumes and is a much larger intersection than the otherseven signals. In addition, the prohibition of right-turn movements from southbound Moorpark Road beingserved simultaneous with left-turn movements from eastbound Santa Rosa Road during the peak periodsresults in an inefficient signal operation. Therefore, it would necessitate a much longer cycle length atMoorpark Road than the other signals along the corridor.
Instead of raising the cycle length by one minute or longer at all of the other traffic signals in the study area,it was recommended to operate Moorpark Road uncoordinated. As this intersection lies at the end of thecoordination corridor, operating that signal uncoordinated does not diminish the ability to create vehicleplatoons through the rest of the study corridor. In order to reduce the very extensive queuing and delay at

Page | 8
Santa Rosa RoadTraffic Signal System Optimization Final Report
the Moorpark Road intersection, it was recommended to reduce the maximum green times for each of thephases. By reducing the maximum green times, the signal would proceed through the cycle faster, reducingthe wait time for each individual phase. This lowered the effective average cycle length at this intersectionfrom 229 seconds to 157 seconds in the AM peak hour and from 229 seconds to 160 seconds in the PMpeak hour.
The reduction in effective average cycle length at the Moorpark Road intersection corresponds to areduction in queue length for all movements at the intersection as vehicles have to wait a shorter durationfor a green light. While queue lengths are still very long for some movements, the analysis model indicatesthat they are measurably reduced compared to before conditions. See Table 3-1 for a comparison of queuelengths for the four major movements at the Moorpark Road intersection, as indicated by Synchro, beforeand after the timing modification.
Table 3-1 – Modeled Queue Lengths at Moorpark Road with Signal Timing AdjustmentAM PM
Movement Before After Before AfterEastbound Left-turn 724 ft 463 1,137 769Eastbound Through 600 397 429 292Southbound Right-Turn 2,572 1,964 1,982 1,559Westbound Through 416 303 785 596
Results derived from the Synchro model indicated an optimal cycle time of 150 seconds in the AM peakperiod and 130 seconds in the PM peak period to achieve an optimal travel time along the corridor.However, Kimley-Horn recommended 120-second cycles in both the AM and PM peak periods to alsoachieve efficient operations at each of the individual intersections.
The increase in cycle length compared to before conditions was calculated to result in an increase in theaverage delay for side-street movements by up to 13 seconds, depending on the intersection. However,overall intersection delay (which includes side-street movements) is reduced at each intersection by up to25 seconds. This indicates that vehicles turning onto the corridor from the side-streets may have to waitslightly longer to access the corridor (up to 13 seconds on average) but will gain that time back and morethrough equivalent or greater delay reductions at each downstream intersection once on the corridor.
The intersection of Vista Grande serves access/egress movements to/from Santa Rosa TechnologyMagnet School. At school start times during the school year, there is an intense spike in traffic volumesusing the north leg of the intersection. During the remainder of the day, traffic volumes are much lowerentering/exiting the school. In order to clear vehicle queues extending into the school parking lot, duringschool pick-up/drop-off period, it is necessary to have significantly longer green times for that north leg ofthe intersection. Such longer green times are not possible with the limitation of the 120-second cycle length.As a result, the Vista Grande intersection was recommended to run uncoordinated for a 20-minute periodsurrounding school start times. A similar sharp spike in activity was not observed during school end timesand thus a similar treatment is not required for the afternoon period.

Page | 9
Santa Rosa RoadTraffic Signal System Optimization Final Report
3.3 SPLIT PREPARATION
Optimum signal splits were proposed for the identified cycle length, maintaining minimum pedestrian splits,minimum vehicle splits needed to minimize queuing, and minimum splits required for bicycle passage andclearance.
3.4 OFFSET OPTIMIZATION
Signal offsets were recommended based on the determined cycle lengths and coordinated phase splits.Offsets were recommended to facilitate the desired vehicle progression. Because traffic volumes on SantaRosa Road are generally balanced in both peak periods (roughly as many cars are going westbound asgoing eastbound), offsets were developed to provide some level of progression for both directions of travel.As a result, stops may be observed by vehicles traveling in both directions; however the total number ofstops was minimized for both directions of travel.
In addition, offsets were established to minimize locations where vehicle platoons would be truncated.Splitting a platoon may result in vehicles in the dilemma zone, where they are unsure of whether they shouldstop or proceed at a yellow light. By having platoons arrive near the start of the green phase or just prior,the full platoon can be served during one green phase. The Synchro models indicated the revised signalcoordination timings resulted in a 30 percent or greater decrease in the number of vehicles that may be inthe dilemma zone in both peak periods.
One tool utilized in optimizing offsets is the time-space diagram. The time-space diagram shows theanticipated path of vehicles along the corridor. Time is reflected on the x-axis and distance is reflected onthe y-axis. Time-space diagrams for the implemented signal coordination parameters are included asAppendix A.
3.5 SIGNAL TIMING SHEETS
Based on the signal timing parameter updates and the proposed cycle lengths, offsets, force-offs, maximumgreen times and time-of-day implementation periods, signal timing sheets were updated for each signalizedintersection in the study area. These timing sheets are included as Appendix B.

Page | 10
Santa Rosa RoadTraffic Signal System Optimization Final Report
4. IMPLEMENTATION AND RESULTS
4.1 IMPLEMENTATION
The revised signal coordination parameters were implemented in early June 2016. School was still insession when the revised timings were implemented.
4.2 EVALUATION METHODOLOGY
A comparison of travel time before and after implementation of the updated signal coordination allows foran evaluation of the effectiveness of the change. Travel time data was collected prior to implementation inApril 2016 and after implementation in June 2016. Travel time data was collected using the floating-cartechnique, whereby a data collection vehicle travels within the vehicle platoon for the full length of thecorridor. GPS data is collected every second during each run. Seven travel time runs were completed ineach direction on the corridor in each peak period. The GPS data allows for analysis of travel time, stoppedtime, number of stops, and average travel speed at each roadway segment and along the corridor as awhole. The travel time data collection allowed for evaluation of the effect of the signal timing changes.
Appendix C contains the individual run times for each of the travel time runs.
4.3 COMPARISON OF BEFORE AND AFTER RESULTS
The before and after travel time data was analyzed to determine the effect of signal coordination on corridortravel and delays.
Table 4-1 displays the change in corridor average travel time and average speed on Santa Rosa Roadassociated with the coordinated signal timing. As shown in the table, average travel time was reduced inboth directions in both peak periods with the implementation of new signal coordination. The greatestbenefit to travel times was observed in the morning period. Average travel time in the eastbound directionwas reduced by 5 percent and in the westbound direction by 11 percent. In the evening period, averagetravel time was reduced by 3 percent in the eastbound direction and 1 percent in the westbound direction.

Page | 11
Santa Rosa RoadTraffic Signal System Optimization Final Report
Table 4-1 –Santa Rosa Road Travel Time Summary
Before After Change
DirectionTravelTime
AverageSpeed
TravelTime
AverageSpeed
TravelTime
AverageSpeed
MorningEastbound 05:13 40.2 04:58 41.0 -5% 2%
Westbound 06:00 37.1 05:22 38.6 -11% 4%
EveningEastbound 04:47 42.9 04:38 43.7 -3% 2%
Westbound 05:31 37.2 05:29 37.5 -1% 1%
Table 4-2 displays the change in the amount of average stopped time and average number of stopsexperienced when driving from one end of the corridor to the other. As shown in the table, the amount oftime spent stopped was reduced by 20 seconds or more in both directions in the morning period and by 10seconds or more in the evening period. Also shown in Table 4-2, the average number of times a vehicle isforced to stop at a red light was also reduced with the implementation of the signal coordination. Thereduction in the number of stops and stopped time corresponds with environmental benefits such asreductions in fuel consumption and greenhouse gas emissions.
Table 4-2 –Santa Rosa Road Delays and Stops Summary
Before After Change
DirectionStopped
Time
AverageNumber of
StopsStopped
Time
AverageNumber of
StopsStopped
Time
AverageNumber of
StopsMorning
Eastbound 00:31 2.1 00:11 1.0 -63% -52%
Westbound 01:02 0.9 00:27 0.7 -57% -22%
EveningEastbound 00:14 1.7 00:04 1.4 -72% -18%
Westbound 00:40 0.9 00:25 0.1 -38% -89%
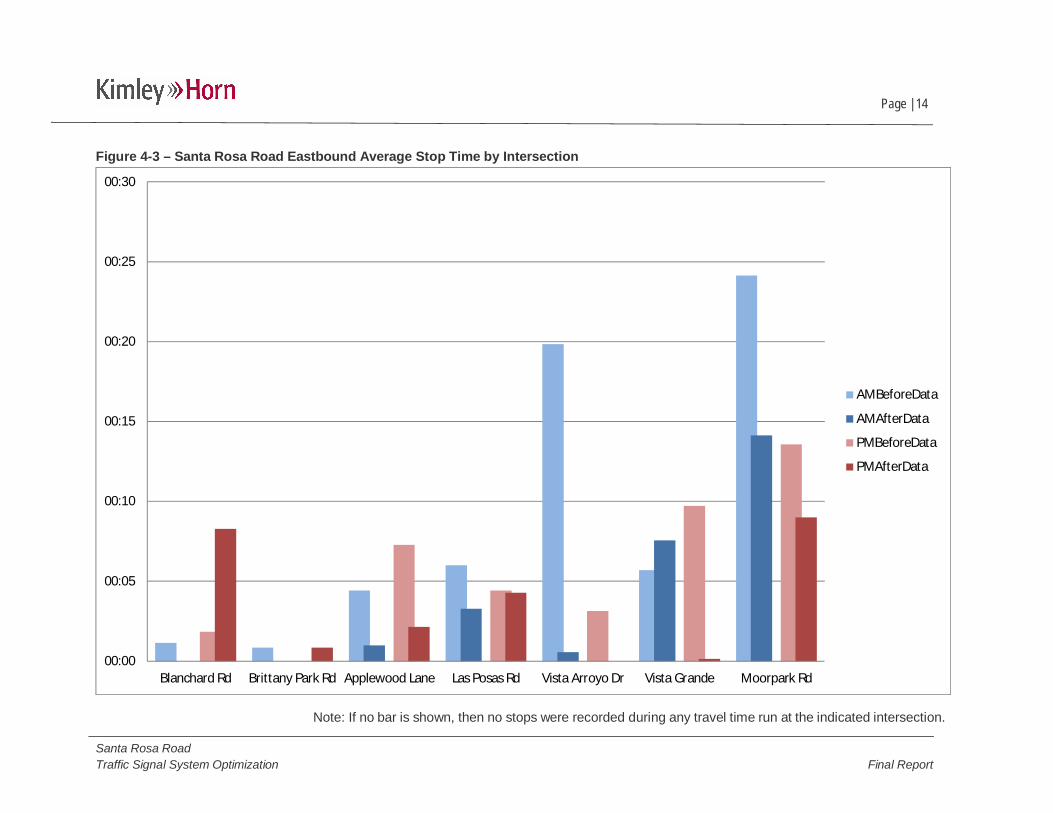
Figures 4-1 and 4-2 show the average progression of the floating car vehicle along Santa Rosa Roadbefore and after the coordinated timing implementation. Figures 4-3 and 4-4 show the average stop timeat each of the signalized intersections along Santa Rosa Road before and after the coordinated timingimplementation.

Page | 12
Santa Rosa RoadTraffic Signal System Optimization Final Report
Figure 4-1 – Santa Rosa Road Eastbound Average Progression
YuccaDr
BlanchardRd
BrittanyPark
Rd
Applewood
Lane
LasPosasRd
VistaArroyo
Dr
VistaG
rande
Moorpark
Rd
00:00
01:00
02:00
03:00
04:00
05:00
06:00
07:00
Trav
elTi
me
(min
:sec
)
AMBeforeData PMBeforeData AMAfterData PMAfterData

Page | 13
Santa Rosa RoadTraffic Signal System Optimization Final Report
Figure 4-2 – Santa Rosa Road Westbound Average Progression
Moorpark
Rd
VistaG
rande
VistaArroyo
Dr
LasPosasRd
Applewood
Lane
BrittanyPark
Rd
BlanchardRd
YuccaDr
00:00
01:00
02:00
03:00
04:00
05:00
06:00
Trav
elTi
me
(min
:sec
)
AMBeforeData PMBeforeData AMAfterData PMAfterData
Page | 14
Santa Rosa RoadTraffic Signal System Optimization Final Report
Figure 4-3 – Santa Rosa Road Eastbound Average Stop Time by Intersection
00:00
00:05
00:10
00:15
00:20
00:25
00:30
Blanchard Rd Brittany Park Rd Applewood Lane Las Posas Rd Vista Arroyo Dr Vista Grande Moorpark Rd
AMBeforeData
AMAfterData
PMBeforeData
PMAfterData
Note: If no bar is shown, then no stops were recorded during any travel time run at the indicated intersection.

Page | 15
Santa Rosa RoadTraffic Signal System Optimization Final Report
Figure 4-4 – Santa Rosa Road Westbound Average Stop Time by Intersection
00:00
00:05
00:10
00:15
00:20
00:25
00:30
Vista Grande Vista Arroyo Dr Las Posas Rd Applewood Lane Brittany Park Rd Blanchard Rd Yucca Dr
AMBeforeData
AMAfterData
PMBeforeData
PMAfterData
Note: If no bar is shown, then no stops were recorded during any travel time run at the indicated intersection.

Page | 16
Santa Rosa RoadTraffic Signal System Optimization Final Report
4.4 SUMMARY OF FINDINGS
The signal coordination and signal timing parameters implemented as part of this project have significantlyreduced stopped time and total number of vehicle stops along the corridor. This translates to a reduction inoverall travel time and vehicle delays along the corridor. Additionally, changes to timing parameters at theMoorpark Road intersection reduce queue lengths and delays at that congested intersection.
The reduction in vehicle idling and congestion translates directly to fuel consumption savings and reductionsin greenhouse gas emissions, providing both monetary and environmental benefits to corridor users andnearby residents. The new signal coordination also results in fewer dilemma zone interactions for vehicles,which may reduce red-light running along the corridor.

APPENDIX A – TIME-SPACE DIAGRAMS

Time-Space Diagram - Santa Rosa RdCoordinated - 120 sec 6/28/2016
Timing Plan: AM PEAK HOUR
Cross StreetMain Street
ApproachOffset 20 40 60 80 100 120 140 160 180 200 220 240 260 280 300 320 340 360
8: Santa Rosa Rd@ Yucca Dr84
7: Santa Rosa Rd@ Blanchard Rd67
6: Santa Rosa Rd@34
5: Santa Rosa Rd@ Penelope Pl92
4: Santa Rosa Rd
LEGENDNB or WB Thru Veh PathsNB or WB Left Veh PathsSB or EB Thru Veh PathsSB or EB Left Veh PathsThru GreenNB or WB Left-Thru GreenSB or EB Left-Thru GreenDual Left GreenStarvation ThruStarvation LeftSpillback Uncoord ThruSpillback Uncoord LeftSpillback Coord ThruSpillback Coord LeftStorage Blocking ThruStorage Blocking Left

Time-Space Diagram - Santa Rosa RdCoordinated - 120 sec 6/28/2016
Timing Plan: AM PEAK HOUR
Cross StreetMain Street
ApproachOffset 20 40 60 80 100 120 140 160 180 200 220 240 260 280 300 320 340 36092
4: Santa Rosa Rd@ Las Posas Rd85
3: Santa Rosa Rd@ Vista Arroyo Dr26
2: Santa Rosa Rd@ Vista Grande83
23: Santa Rosa Rd
1: Santa Rosa Rd@ Moorpark Road
Actuated
LEGENDNB or WB Thru Veh PathsNB or WB Left Veh PathsSB or EB Thru Veh PathsSB or EB Left Veh PathsThru GreenNB or WB Left-Thru GreenSB or EB Left-Thru GreenDual Left GreenStarvation ThruStarvation LeftSpillback Uncoord ThruSpillback Uncoord LeftSpillback Coord ThruSpillback Coord LeftStorage Blocking ThruStorage Blocking Left

Time-Space Diagram - Santa Rosa RdCoordinated - 120 sec 6/28/2016
Timing Plan: AM PEAK HOUR
Cross StreetMain Street
ApproachOffset 20 40 60 80 100 120 140 160 180 200 220 240 260 280 300 320 340 360
1: Santa Rosa Rd@ Moorpark Road85
Actuated
LEGENDNB or WB Thru Veh PathsNB or WB Left Veh PathsSB or EB Thru Veh PathsSB or EB Left Veh PathsThru GreenNB or WB Left-Thru GreenSB or EB Left-Thru GreenDual Left GreenStarvation ThruStarvation LeftSpillback Uncoord ThruSpillback Uncoord LeftSpillback Coord ThruSpillback Coord LeftStorage Blocking ThruStorage Blocking Left

Time-Space Diagram - Santa Rosa RdCoordination - 120 Seconds 6/28/2016
Timing Plan: PM Peak
Cross StreetMain Street
ApproachOffset 20 40 60 80 100 120 140 160 180 200 220 240 260 280 300 320 340 360
8: Santa Rosa Rd@ Yucca Dr84
7: Santa Rosa Rd@ Blanchard Rd60
6: Santa Rosa Rd@44
5: Santa Rosa Rd@ Penelope Pl104
4: Santa Rosa Rd
LEGENDNB or WB Thru Veh PathsNB or WB Left Veh PathsSB or EB Thru Veh PathsSB or EB Left Veh PathsThru GreenNB or WB Left-Thru GreenSB or EB Left-Thru GreenDual Left GreenStarvation ThruStarvation LeftSpillback Uncoord ThruSpillback Uncoord LeftSpillback Coord ThruSpillback Coord LeftStorage Blocking ThruStorage Blocking Left

Time-Space Diagram - Santa Rosa RdCoordination - 120 Seconds 6/28/2016
Timing Plan: PM Peak
Cross StreetMain Street
ApproachOffset 20 40 60 80 100 120 140 160 180 200 220 240 260 280 300 320 340 360104
4: Santa Rosa Rd@ Las Posas Rd86
3: Santa Rosa Rd@ Vista Arroyo Dr25
2: Santa Rosa Rd@ Vista Grande98
23: Santa Rosa Rd
1: Santa Rosa Rd@ Moorpark Road
Actuated
LEGENDNB or WB Thru Veh PathsNB or WB Left Veh PathsSB or EB Thru Veh PathsSB or EB Left Veh PathsThru GreenNB or WB Left-Thru GreenSB or EB Left-Thru GreenDual Left GreenStarvation ThruStarvation LeftSpillback Uncoord ThruSpillback Uncoord LeftSpillback Coord ThruSpillback Coord LeftStorage Blocking ThruStorage Blocking Left

Time-Space Diagram - Santa Rosa RdCoordination - 120 Seconds 6/28/2016
Timing Plan: PM Peak
Cross StreetMain Street
ApproachOffset 20 40 60 80 100 120 140 160 180 200 220 240 260 280 300 320 340 360
1: Santa Rosa Rd@ Moorpark Road85.6
Actuated
LEGENDNB or WB Thru Veh PathsNB or WB Left Veh PathsSB or EB Thru Veh PathsSB or EB Left Veh PathsThru GreenNB or WB Left-Thru GreenSB or EB Left-Thru GreenDual Left GreenStarvation ThruStarvation LeftSpillback Uncoord ThruSpillback Uncoord LeftSpillback Coord ThruSpillback Coord LeftStorage Blocking ThruStorage Blocking Left

APPENDIX B – COORDINATED TIMING SHEETS

INTERSECTION: 027 Santa Rosa Rd@Yucca Dr Page 1 (of 5)Group Assignment: NONE N/S Street Name: Yucca Drive Last Database Change:
Field Master Assignment: FM2 Santa Rosa Road E/W Street Name: Santa Rosa RoadSystem Reference Number: 28
Notes:Change By Date By Date
Drop Number 1 <C+0+0>Zone Number <C+0+1>Area Number 4 <C+0+2> Max Initial 20 <F+0+E>Area Address 1 <C+0+3> <C+A+1> Red Revert 5.0 <F+0+F>QuicNet Channel (QuicNet) <C+B+1> All Red Start 6.0 <F+C+0>Communication Addresses Manual Selection Start / Revert Times
Column Numbers ----> 1 2 3 4 5 6 7 8 ERow Phase Names ----> Row
0 Ped Walk 0 0 0 7 0 7 0 0 RR-1 Delay 0 Permit 01 Ped FDW 0 0 0 22 0 15 0 0 RR-1 Clear 10 Red Lock 12 Min Green 0 10 0 9 6 10 0 0 EV-A Delay 0 Yellow Lock 23 Type 3 Limit 0 0 0 0 0 0 0 0 EV-A Clear 1 Min Recall 34 Added Initial 0.0 0.0 0.0 0.0 0.0 0.0 0.0 0.0 EV-B Delay 0 Ped Recall 45 Veh Extension 0.0 2.0 0.0 2.0 2.0 2.0 0.0 0.0 EV-B Clear 1 View Set Peds 56 Max Gap 0.0 4.0 0.0 2.0 2.0 4.0 0.0 0.0 EV-C Delay 0 Rest In Walk 67 Min Gap 0.0 0.0 0.0 2.0 2.0 0.0 0.0 0.0 EV-C Clear 1 Red Rest 78 Max Limit 0 30 0 15 15 30 0 0 EV-D Delay 0 Dual Entry 89 Max Limit 2 0 65 0 0 0 65 0 0 EV-D Clear 1 Max Recall 9A - - - - - - 0 0 0 0 0 0 0 0 RR-2 Delay 0 Soft Recall AB Call To Phase 0 0 0 0 0 0 0 0 RR-2 Clear 10 Max 2 BC Reduce By 0.0 0.1 0.0 0.0 0.0 0.1 0.0 0.0 View EV Delay - - - Cond. Service CD Reduce Every 0.0 1.0 0.0 0.0 0.0 1.0 0.0 0.0 View EV Clear - - - Man Cntrl Calls DE Yellow Change 0.0 5.0 0.0 3.6 3.6 5.0 0.0 0.0 View RR Delay - - - Yellow Start EF Red Clear 0.0 2.0 0.0 1.0 1.0 2.0 0.0 0.0 View RR Clear - - - First Phases F
Phase Timing - Bank 1 <F Page> Preempt Timing Phase Functions <F Page>
12/7/2015 13:24
4/8/16: New coordination timing
________________
_2_456__
Manual Offset 0 = Automatic 1 = Offset A 2 = Offset B 3 = Offset C
________
________ - - - - -
Manual Plan 0 = Automatic1-9 = Plan 1-9 14 = Free 15 = Flash
________________
Change Record
FPhase
Manual PlanManual Offset0
Change
_________________2___6__
_2___6___________2___6__________________
Printed on 6/3/2016 5:42 PM Timing Sheet Version: 200 SA & CA Revision: 10430

INTERSECTION: 027 Santa Rosa Rd@Yucca Dr Page 2 (of 5)
Column Numbers ----> 1 2 3 4 5 6 7 8 9Row Plan Name ----> Row E Row
0 Cycle Length 120 120 0 0 0 0 0 0 0 0 01 Phase 1 - ForceOff 0 0 0 0 0 0 0 0 0 1 Plan 1 - Sync _2___6__ 12 Phase 2 - ForceOff 0 0 0 0 0 0 0 0 0 2 Plan 2 - Sync _2___6__ 23 Phase 3 - ForceOff 0 0 0 0 0 0 0 0 0 3 Plan 3 - Sync _2___6__ 34 Phase 4 - ForceOff 36 36 0 0 0 0 0 0 0 4 Plan 4 - Sync _2___6__ 45 Phase 5 - ForceOff 54 56 0 0 0 0 0 0 0 5 Plan 5 - Sync _2___6__ 56 Phase 6 - ForceOff 0 0 0 0 0 0 0 0 0 6 Plan 6 - Sync _2___6__ 67 Phase 7 - ForceOff 0 0 0 0 0 0 0 0 0 7 Plan 7 - Sync _2___6__ 78 Phase 8 - ForceOff 0 0 0 0 0 0 0 0 0 8 Plan 8 - Sync _2___6__ 89 Ring Offset 0 0 0 0 0 0 0 0 0 9 Plan 9 - Sync _2___6__ 9A Offset 1 72 84 0 0 0 0 0 0 0 A Coord Ped * ________ AB Offset 2 0 0 0 0 0 0 0 0 0 B NEMA Hold ________ BC Offset 3 0 0 0 0 0 0 0 0 0 C CD Permissive 3 3 3 3 3 3 3 3 3 D DE Hold Release 255 255 255 255 255 255 255 255 255 E EF Zone Offset 0 0 0 0 0 0 0 0 0 F F
Coordination <C Page> Sync Phases <C Page>
Row Column Numbers ----> E F F Row
0 Exclusive Phases ________ Coord Force-Off Adjust Free Lag _2_4_6__ 01 RR-1 Clear Phases ________ RR Overlap A - Phases ________ for Ped Service <C+D+F> Plan 1 - Lag _2_4_6__ 12 RR-2 Clear Phases ________ RR Overlap B - Phases ________ Plan 2 - Lag _2_4_6__ 23 RR-2 Limited Service ________ RR Overlap C - Phases ________ Plan 3 - Lag _2_4_6__ 34 Prot / Perm Phases ________ RR Overlap D - Phases ________ TBC Transition <C+D+D> Plan 4 - Lag _2_4_6__ 45 Overlap A - Green Omit ________ Ped 2P ________ Plan 5 - Lag _2_4_6__ 56 Overlap B - Green Omit ________ Ped 6P _____6__ Plan 6 - Lag _2_4_6__ 67 Overlap C - Green Omit ________ Ped 4P ___4____ Plan 7 - Lag _2_4_6__ 78 Overlap D - Green Omit ________ Ped 8P ________ Plan 8 - Lag _2_4_6__ 89 Overlap Yellow Flash ________ Yellow Flash Phases ________ Plan 9 - Lag _2_4_6__ 9A EV-A Phases ________ Overlap A - Phases ________ Coord Max * ________ AB EV-B Phases ________ Overlap B - Phases ________ Coord Lag * ________ BC EV-C Phases ________ Overlap C - Phases ________ CD EV-D Phases ________ Overlap D - Phases ________ DE Extra 1 Config. Bits 1_3_____ Restricted Phases ________ EF IC Select (Interconnect) _2______ Assign 5 Outputs ______7_ F
Configuration <E Page> Configuration <E Page> Lag Phases <C Page>
(* = Coordination Recall)Plan
Extra 1 Flags 1 = TBC Type 1 2 = NEMA Ext. Coord 3 = Auto Daylight Savings 4 = EV Advance 5 = 6 = Special Event 7 = Pretimed Operation 8 = Split Ring Operation
Assign 5 Outputs (Ped Loadswitch Yellows) 1 = Right Turn Overlap 2 = TOD Outputs 3 = EV Beacon - Steady 4 = EV Beacon - Flashing 5 = Special Event Outputs 6 = Phase 3 & 7 Ped 7 = Advanced Warning Sign 8 =
IC Select Flags1 =2 = Modem3 = 7-Wire Slave4 = Flash / Free5 =6 = Simplex Master7 = 7-Wire Master8 = Offset Interrupter
Transition Type
Force-Off Adjust
0
5
Transition Type 0 = Shortway Non-zero = Lengthen
Printed on 6/3/2016 5:42 PM Timing Sheet Version: 200 SA & CA Revision: 10430

INTERSECTION: 027 Santa Rosa Rd@Yucca Dr Page 3 (of 5)
Column FRow Time Day of Week Time Day of Week Phases/Bits Time Day of Week Time Day of Week Time Day of Week Row
0 06 :30 1 A _23456_ 00 :00 0 _______ ________ 00 :00 0 0 _______ 00 :00 0 0 _______ 00 :00 0 0 _______ 01 09 :30 E A _23456_ 00 :00 0 _______ ________ 00 :00 0 0 _______ 00 :00 0 0 _______ 00 :00 0 0 _______ 12 14 :30 2 A _23456_ 00 :00 0 _______ ________ 00 :00 0 0 _______ 00 :00 0 0 _______ 00 :00 0 0 _______ 23 18 :30 E A _23456_ 00 :00 0 _______ ________ 00 :00 0 0 _______ 00 :00 0 0 _______ 00 :00 0 0 _______ 34 00 :00 0 0 _______ 00 :00 0 _______ ________ 00 :00 0 0 _______ 00 :00 0 0 _______ 00 :00 0 0 _______ 45 00 :00 0 0 _______ 00 :00 0 _______ ________ 00 :00 0 0 _______ 00 :00 0 0 _______ 00 :00 0 0 _______ 56 00 :00 0 0 _______ 00 :00 0 _______ ________ 00 :00 0 0 _______ 00 :00 0 0 _______ 00 :00 0 0 _______ 67 00 :00 0 0 _______ 00 :00 0 _______ ________ 00 :00 0 0 _______ 00 :00 0 0 _______ 00 :00 0 0 _______ 78 00 :00 0 0 _______ 00 :00 0 _______ ________ 00 :00 0 0 _______ 00 :00 0 0 _______ 00 :00 0 0 _______ 89 00 :00 0 0 _______ 00 :00 0 _______ ________ 00 :00 0 0 _______ 00 :00 0 0 _______ 00 :00 0 0 _______ 9A 00 :00 0 0 _______ 00 :00 0 _______ ________ 00 :00 0 0 _______ 00 :00 0 0 _______ 00 :00 0 0 _______ AB 00 :00 0 0 _______ 00 :00 0 _______ ________ 00 :00 0 0 _______ 00 :00 0 0 _______ 00 :00 0 0 _______ BC 00 :00 0 0 _______ 00 :00 0 _______ ________ 00 :00 0 0 _______ 00 :00 0 0 _______ 00 :00 0 0 _______ CD 00 :00 0 0 _______ 00 :00 0 _______ ________ 00 :00 0 0 _______ 00 :00 0 0 _______ 00 :00 0 0 _______ DE 00 :00 0 0 _______ 00 :00 0 _______ ________ 00 :00 0 0 _______ 00 :00 0 0 _______ 00 :00 0 0 _______ EF 00 :00 0 0 _______ 00 :00 0 _______ ________ 00 :00 0 0 _______ 00 :00 0 0 _______ 00 :00 0 0 _______ F
<D Page>
RowDay of Week
A 0 0 _______B 0 0 _______C 0 0 _______
Holiday Dates<8 Key>
Mon
th
Yea
r
Day
000Holiday # 3 Date
Holiday # 2 DateHoliday # 1 Date
TOD Coordination
Month Select1 = January2 = February3 = March4 = April5 = May6 = June7 = July8 = August9 = SeptemberA = OctoberB = NovemberC = December
Pla
n
Holiday # 1TOD Coordination
<9 Key with C+D+9=1> <9 Key with C+D+9=2> <9 Key with C+D+9=3>TOD Coordination
Holiday # 3Holiday # 2
Offs
et
Pla
n
Offs
et
Pla
n
Offs
et
<9 Key with C+D+9=0> <7 Key>
Plan Select1 thru 9 = Coordination Plan 1 thru 914 or E = Free15 or F = Flash
Offset SelectA = Offset AB = Offset BC = Offset C
Pla
n
Offs
et
Func
t.
T.O.D. Functions0 = Permitted Phases1 = Red Lock2 = Yellow Lock3 = Veh Min Recall4 = Ped Recall5 =6 = Rest In Walk7 = Red Rest8 = Double Entry9 = Veh Max RecallA = Veh Soft RecallB = Maximum 2C = Conditional ServiceD = Free Lag PhasesE = Bit 1 - Local Override Bit 2 - Phase Bank 2 Bit 3 - Phase Bank 3 Bit 4 - Disable Detector OFF Monitor Bit 7 - Detector Count Monitor Bit 8 - Real Time Split MonitorF = Output Bits 1 thru 4
TOD Coordination TOD Function
Printed on 6/3/2016 5:42 PM Timing Sheet Version: 200 SA & CA Revision: 10430

INTERSECTION: 027 Santa Rosa Rd@Yucca Dr Page 4 (of 5)
1 3 9 C D 0Carry- Detector 332 Input Detector Green Yellow Red Load-
Row Delay over Name File Number Row Clear Change Clear Switch #0 0.0 0.0 I-1 14 A Overlap A 0.0 0.0 0.0 01 0.0 2.0 I-2U 1 B Overlap B 0.0 0.0 0.0 02 0.0 3.0 I-2L 5 C Overlap C 0.0 0.0 0.0 03 0.0 0.0 I-3U 21 D Overlap D 0.0 0.0 0.0 04 0.0 0.0 I-3L 25 Overlap Timing <F Page> <D Page>5 0.0 0.0 I-4 96 0.0 0.0 I-5 167 10.0 0.0 I-6U 3 Row Detector Numbers E8 10.0 0.0 I-6L 7 A 1 2 3 4 5 6 7 8 123456789 0.0 0.0 I-7U 23 B 9 10 11 12 -- -- -- -- 1234____A 0.0 0.0 I-7L 27 C 13 14 15 16 17 18 19 20 12345678B 0.0 0.0 I-8 11 D -- -- -- -- 21 22 23 24 ____5678C 0.0 0.0 I-9U 18 E -- -- -- -- -- -- -- -- 1234____D 0.0 0.0 I-9L 20 F -- 25 26 27 28 -- -- -- _2345___E - - - - - - - - - - - - - - -F - - - - - - - - - - - - - - -
0 <F+C+1>2 4 0 0.0 <F+C+3>
Carry- Detector 332 Input Detector Detector Advance Warning Beacon - Sign 1Row Delay over Name File Number Row Number0 3.0 0.0 J-1 13 0 0 <F+D+1>1 0.0 2.0 J-2U 2 1 System Det. # 1 0 0.0 <F+D+3>2 0.0 3.0 J-2L 6 2 System Det. # 2 0 Advance Warning Beacon - Sign 23 0.0 0.0 J-3U 22 3 System Det. # 3 04 0.0 0.0 J-3L 26 4 System Det. # 4 0 0.0 <F+0+6>5 0.0 0.0 J-4 10 5 System Det. # 5 0 0.0 <F+0+7>6 0.0 0.0 J-5 15 6 System Det. # 6 0 Power Cycle Correction (Default = 0.5)7 0.0 0.0 J-6U 4 7 System Det. # 7 08 0.0 0.0 J-6L 8 8 System Det. # 8 0 0 <D+B+0>9 0.0 0.0 J-7U 24 System Detectors <D Page> Dial-Up Telephone CommunicationsA 0.0 0.0 J-7L 28 (If set to a non-zero value, parity will be disabled)
B 0.0 0.0 J-8 12C 0.0 0.0 J-9U 17 Max ON (minutes) 5 <D+A+E>D 0.0 0.0 J-9L 19 Max OFF (minutes) 60 <D+A+F>E - - - - - - - - - - - - - - - Detector Failure MonitorF - - - - - - - - - - - - - - -
Detector Delay & Carryover <D Page>
Disable Parity
Active Detectors <D Page>
Long FailureShort Failure
Phase NumberTime Before Yellow
Phase NumberTime Before Yellow
Note: Initialized data is for alldetectors to be active (ie, allflag bits set). A Detectorwhich is "not flagged", will notbe active as a PhaseDetector, and WILL NOT callor extend its associatedphase. It will still function as aSystem Detector.
Printed on 6/3/2016 5:42 PM Timing Sheet Version: 200 SA & CA Revision: 10430

INTERSECTION: 027 Santa Rosa Rd@Yucca Dr Page 5 (of 5)
Column Numbers ----> 1 2 3 4 5 6 7 8 Column Numbers ----> 1 2 3 4 5 6 7 8Row Phase Names ----> Phase Names ----> Row
0 0 7 0 7 0 7 0 7 Ped Walk 0 7 0 7 0 7 0 7 01 0 10 0 10 0 10 0 10 Ped FDW 0 10 0 10 0 10 0 10 12 3 7 3 7 3 7 3 7 Min Green 3 7 3 7 3 7 3 7 23 0 0 0 0 0 0 0 0 Type 3 Limit 0 0 0 0 0 0 0 0 34 0.0 1.2 0.0 1.2 0.0 1.2 0.0 1.2 Added Initial 0.0 1.2 0.0 1.2 0.0 1.2 0.0 1.2 45 0.5 3.5 0.5 3.5 0.5 3.5 0.5 3.5 Veh Extension 0.5 3.5 0.5 3.5 0.5 3.5 0.5 3.5 56 0.5 5.0 0.5 5.0 0.5 5.0 0.5 5.0 Max Gap 0.5 5.0 0.5 5.0 0.5 5.0 0.5 5.0 67 0.5 2.0 0.5 2.0 0.5 2.0 0.5 2.0 Min Gap 0.5 2.0 0.5 2.0 0.5 2.0 0.5 2.0 78 17 40 17 40 17 40 17 40 Max Limit 17 40 17 40 17 40 17 40 89 30 70 30 70 30 70 30 70 Max Limit 2 30 70 30 70 30 70 30 70 9A 0 0 0 0 0 0 0 0 - - - - - - 0 0 0 0 0 0 0 0 AB 0 0 0 0 0 0 0 0 Call To Phase 0 0 0 0 0 0 0 0 BC 0.1 0.1 0.1 0.1 0.1 0.1 0.1 0.1 Reduce By 0.1 0.1 0.1 0.1 0.1 0.1 0.1 0.1 CD 1.0 1.0 1.0 1.0 1.0 1.0 1.0 1.0 Reduce Every 1.0 1.0 1.0 1.0 1.0 1.0 1.0 1.0 DE 3.0 4.0 3.0 4.0 3.0 4.0 3.0 4.0 Yellow Change 3.0 4.0 3.0 4.0 3.0 4.0 3.0 4.0 EF 0.0 0.5 0.0 1.0 0.0 0.5 0.0 1.0 Red Clear 0.0 0.5 0.0 1.0 0.0 0.5 0.0 1.0 F
Phase Timing - Bank 2 <F Page> Phase Timing - Bank 3 <F Page>
7 8 CRow Time Dwell Vehicle Call Row
0 0 - - - - - - 01 0 0 ________ 12 0 0 ________ 23 0 0 ________ 34 0 0 ________ 45 0 0 ________ 56 0 0 ________ 67 0 0 ________ 78 0 0 ________ 89 0 0 ________ 9A - - - 0 ________ AB 0 0 ________ BC 0 0 ________ CD 0 0 ________ DE 0 0 ________ EF 0 0 ________ F
Special Event Schedule <C Page with F+9+F=22>
Phase Phase
9Hold
AAdvance
DPermit Phases
EPed Omit
- - -________________________
________________
________________________
________
________________________________
________________________
________
________ ________________
________________
________________________________________________
________________
________________________
________________________________
________________
- - -________________________________________________________
________________________
________________________________
________________________
________
________
________________
________________________________
________________
FOutput
________________________________________
________
________
________________________________
________________
Ped WalkPed FDWMin GreenType 3 LimitAdded InitialVeh ExtensionMax GapMin GapMax LimitMax Limit 2 - - - - - -Call To PhaseReduce ByReduce EveryYellow ChangeRed Clear
Delay Only --->
Limited Service Int. --->
BForce Off
________
________
________________________________
<--- Limited Service Interval
(Set Dwell = 255)
- - - - - - - - - - - -
________________________
________________
Printed on 6/3/2016 5:42 PM Timing Sheet Version: 200 SA & CA Revision: 10430

INTERSECTION: 036 Santa Rosa Rd@Blanchard Page 1 (of 5)Group Assignment: NONE N/S Street Name: Blanchard Road Last Database Change:
Field Master Assignment: FM2 Santa Rosa Road E/W Street Name: Santa Rosa RoadSystem Reference Number: 36
Notes:Change By Date By Date
Drop Number 2 <C+0+0>Zone Number <C+0+1>Area Number 4 <C+0+2> Max Initial 20 <F+0+E>Area Address 2 <C+0+3> <C+A+1> Red Revert 5.0 <F+0+F>QuicNet Channel (QuicNet) <C+B+1> All Red Start 6.0 <F+C+0>Communication Addresses Manual Selection Start / Revert Times
Column Numbers ----> 1 2 3 4 5 6 7 8 ERow Phase Names ----> Row
0 Ped Walk 0 0 0 7 0 7 0 0 RR-1 Delay 0 Permit 01 Ped FDW 0 0 0 20 0 18 0 0 RR-1 Clear 10 Red Lock 12 Min Green 7 10 0 9 7 10 0 9 EV-A Delay 0 Yellow Lock 23 Type 3 Limit 0 0 0 0 0 0 0 0 EV-A Clear 1 Min Recall 34 Added Initial 0.0 2.0 0.0 0.0 0.0 2.0 0.0 0.0 EV-B Delay 0 Ped Recall 45 Veh Extension 3.0 5.0 0.0 3.0 3.0 5.0 0.0 3.0 EV-B Clear 1 View Set Peds 56 Max Gap 3.0 6.0 0.0 3.0 3.0 6.0 0.0 3.0 EV-C Delay 0 Rest In Walk 67 Min Gap 3.0 3.0 0.0 3.0 3.0 3.0 0.0 3.0 EV-C Clear 1 Red Rest 78 Max Limit 5 30 0 15 15 30 0 15 EV-D Delay 0 Dual Entry 89 Max Limit 2 30 70 30 70 30 70 30 70 EV-D Clear 1 Max Recall 9A - - - - - - 0 0 0 0 0 0 0 0 RR-2 Delay 0 Soft Recall AB Call To Phase 0 0 0 0 0 0 0 0 RR-2 Clear 10 Max 2 BC Reduce By 0.0 0.0 0.0 0.0 0.0 0.0 0.0 0.0 View EV Delay - - - Cond. Service CD Reduce Every 0.0 0.0 0.0 0.0 0.0 0.0 0.0 0.0 View EV Clear - - - Man Cntrl Calls DE Yellow Change 3.6 5.0 0.0 3.6 3.6 5.0 0.0 3.6 View RR Delay - - - Yellow Start EF Red Clear 1.0 2.0 0.0 1.0 1.0 2.0 0.0 1.0 View RR Clear - - - First Phases F
Phase Timing - Bank 1 <F Page> Preempt Timing Phase Functions <F Page>
12/7/2015 13:31
4/8/16: New coordination timing
________________
12_456_8
Manual Offset 0 = Automatic 1 = Offset A 2 = Offset B 3 = Offset C
____5___
________ - - - - -
Manual Plan 0 = Automatic1-9 = Plan 1-9 14 = Free 15 = Flash
________________
Change Record
FPhase
Manual PlanManual Offset0
Change
_________________2___6__
_2_4_6_8_________2___6__________________
Printed on 6/3/2016 5:34 PM Timing Sheet Version: 200 SA & CA Revision: 10430

INTERSECTION: 036 Santa Rosa Rd@Blanchard Page 2 (of 5)
Column Numbers ----> 1 2 3 4 5 6 7 8 9Row Plan Name ----> Row E Row
0 Cycle Length 120 120 0 0 0 0 0 0 0 0 01 Phase 1 - ForceOff 49 49 0 0 0 0 0 0 0 1 Plan 1 - Sync _2___6__ 12 Phase 2 - ForceOff 0 0 0 0 0 0 0 0 0 2 Plan 2 - Sync _2___6__ 23 Phase 3 - ForceOff 0 0 0 0 0 0 0 0 0 3 Plan 3 - Sync _2___6__ 34 Phase 4 - ForceOff 34 34 0 0 0 0 0 0 0 4 Plan 4 - Sync _2___6__ 45 Phase 5 - ForceOff 51 52 0 0 0 0 0 0 0 5 Plan 5 - Sync _2___6__ 56 Phase 6 - ForceOff 0 0 0 0 0 0 0 0 0 6 Plan 6 - Sync _2___6__ 67 Phase 7 - ForceOff 0 0 0 0 0 0 0 0 0 7 Plan 7 - Sync _2___6__ 78 Phase 8 - ForceOff 34 34 0 0 0 0 0 0 0 8 Plan 8 - Sync _2___6__ 89 Ring Offset 0 0 0 0 0 0 0 0 0 9 Plan 9 - Sync _2___6__ 9A Offset 1 55 60 0 0 0 0 0 0 0 A Coord Ped * ________ AB Offset 2 0 0 0 0 0 0 0 0 0 B NEMA Hold ________ BC Offset 3 0 0 0 0 0 0 0 0 0 C CD Permissive 3 3 0 0 0 0 0 0 0 D DE Hold Release 255 255 0 0 0 0 0 0 0 E EF Zone Offset 0 0 0 0 0 0 0 0 0 F F
Coordination <C Page> Sync Phases <C Page>
Row Column Numbers ----> E F F Row
0 Exclusive Phases ________ Coord Force-Off Adjust Free Lag _2_4_6_8 01 RR-1 Clear Phases ________ RR Overlap A - Phases ________ for Ped Service <C+D+F> Plan 1 - Lag _2_4_6_8 12 RR-2 Clear Phases ________ RR Overlap B - Phases ________ Plan 2 - Lag _2_4_6_8 23 RR-2 Limited Service ________ RR Overlap C - Phases ________ Plan 3 - Lag _2_4_6_8 34 Prot / Perm Phases ________ RR Overlap D - Phases ________ TBC Transition <C+D+D> Plan 4 - Lag _2_4_6_8 45 Overlap A - Green Omit ________ Ped 2P ________ Plan 5 - Lag _2_4_6_8 56 Overlap B - Green Omit ________ Ped 6P _____6__ Plan 6 - Lag _2_4_6_8 67 Overlap C - Green Omit ________ Ped 4P ___4____ Plan 7 - Lag _2_4_6_8 78 Overlap D - Green Omit ________ Ped 8P ________ Plan 8 - Lag _2_4_6_8 89 Overlap Yellow Flash ________ Yellow Flash Phases ________ Plan 9 - Lag _2_4_6_8 9A EV-A Phases ________ Overlap A - Phases ________ Coord Max * ________ AB EV-B Phases ________ Overlap B - Phases ________ Coord Lag * ________ BC EV-C Phases ________ Overlap C - Phases ________ CD EV-D Phases ________ Overlap D - Phases ________ DE Extra 1 Config. Bits 1_______ Restricted Phases ________ EF IC Select (Interconnect) _2______ Assign 5 Outputs ________ F
Configuration <E Page> Configuration <E Page> Lag Phases <C Page>
(* = Coordination Recall)Plan
Extra 1 Flags 1 = TBC Type 1 2 = NEMA Ext. Coord 3 = Auto Daylight Savings 4 = EV Advance 5 = 6 = Special Event 7 = Pretimed Operation 8 = Split Ring Operation
Assign 5 Outputs (Ped Loadswitch Yellows) 1 = Right Turn Overlap 2 = TOD Outputs 3 = EV Beacon - Steady 4 = EV Beacon - Flashing 5 = Special Event Outputs 6 = Phase 3 & 7 Ped 7 = Advanced Warning Sign 8 =
IC Select Flags1 =2 = Modem3 = 7-Wire Slave4 = Flash / Free5 =6 = Simplex Master7 = 7-Wire Master8 = Offset Interrupter
Transition Type
Force-Off Adjust
0
5
Transition Type 0 = Shortway Non-zero = Lengthen
Printed on 6/3/2016 5:34 PM Timing Sheet Version: 200 SA & CA Revision: 10430

INTERSECTION: 036 Santa Rosa Rd@Blanchard Page 3 (of 5)
Column FRow Time Day of Week Time Day of Week Phases/Bits Time Day of Week Time Day of Week Time Day of Week Row
0 06 :30 1 A _23456_ 00 :00 0 _______ ________ 00 :00 0 0 _______ 00 :00 0 0 _______ 00 :00 0 0 _______ 01 09 :30 E A _23456_ 00 :00 0 _______ ________ 00 :00 0 0 _______ 00 :00 0 0 _______ 00 :00 0 0 _______ 12 14 :30 2 A _23456_ 00 :00 0 _______ ________ 00 :00 0 0 _______ 00 :00 0 0 _______ 00 :00 0 0 _______ 23 18 :30 E A _23456_ 00 :00 0 _______ ________ 00 :00 0 0 _______ 00 :00 0 0 _______ 00 :00 0 0 _______ 34 00 :00 0 0 _______ 00 :00 0 _______ ________ 00 :00 0 0 _______ 00 :00 0 0 _______ 00 :00 0 0 _______ 45 00 :00 0 0 _______ 00 :00 0 _______ ________ 00 :00 0 0 _______ 00 :00 0 0 _______ 00 :00 0 0 _______ 56 00 :00 0 0 _______ 00 :00 0 _______ ________ 00 :00 0 0 _______ 00 :00 0 0 _______ 00 :00 0 0 _______ 67 00 :00 0 0 _______ 00 :00 0 _______ ________ 00 :00 0 0 _______ 00 :00 0 0 _______ 00 :00 0 0 _______ 78 00 :00 0 0 _______ 00 :00 0 _______ ________ 00 :00 0 0 _______ 00 :00 0 0 _______ 00 :00 0 0 _______ 89 00 :00 0 0 _______ 00 :00 0 _______ ________ 00 :00 0 0 _______ 00 :00 0 0 _______ 00 :00 0 0 _______ 9A 00 :00 0 0 _______ 00 :00 0 _______ ________ 00 :00 0 0 _______ 00 :00 0 0 _______ 00 :00 0 0 _______ AB 00 :00 0 0 _______ 00 :00 0 _______ ________ 00 :00 0 0 _______ 00 :00 0 0 _______ 00 :00 0 0 _______ BC 00 :00 0 0 _______ 00 :00 0 _______ ________ 00 :00 0 0 _______ 00 :00 0 0 _______ 00 :00 0 0 _______ CD 00 :00 0 0 _______ 00 :00 0 _______ ________ 00 :00 0 0 _______ 00 :00 0 0 _______ 00 :00 0 0 _______ DE 00 :00 0 0 _______ 00 :00 0 _______ ________ 00 :00 0 0 _______ 00 :00 0 0 _______ 00 :00 0 0 _______ EF 00 :00 0 0 _______ 00 :00 0 _______ ________ 00 :00 0 0 _______ 00 :00 0 0 _______ 00 :00 0 0 _______ F
<D Page>
RowDay of Week
A 0 0 _______B 0 0 _______C 0 0 _______
Holiday Dates<8 Key>
Mon
th
Yea
r
Day
000Holiday # 3 Date
Holiday # 2 DateHoliday # 1 Date
TOD Coordination
Month Select1 = January2 = February3 = March4 = April5 = May6 = June7 = July8 = August9 = SeptemberA = OctoberB = NovemberC = December
Pla
n
Holiday # 1TOD Coordination
<9 Key with C+D+9=1> <9 Key with C+D+9=2> <9 Key with C+D+9=3>TOD Coordination
Holiday # 3Holiday # 2
Offs
et
Pla
n
Offs
et
Pla
n
Offs
et
<9 Key with C+D+9=0> <7 Key>
Plan Select1 thru 9 = Coordination Plan 1 thru 914 or E = Free15 or F = Flash
Offset SelectA = Offset AB = Offset BC = Offset C
Pla
n
Offs
et
Func
t.
T.O.D. Functions0 = Permitted Phases1 = Red Lock2 = Yellow Lock3 = Veh Min Recall4 = Ped Recall5 =6 = Rest In Walk7 = Red Rest8 = Double Entry9 = Veh Max RecallA = Veh Soft RecallB = Maximum 2C = Conditional ServiceD = Free Lag PhasesE = Bit 1 - Local Override Bit 2 - Phase Bank 2 Bit 3 - Phase Bank 3 Bit 4 - Disable Detector OFF Monitor Bit 7 - Detector Count Monitor Bit 8 - Real Time Split MonitorF = Output Bits 1 thru 4
TOD Coordination TOD Function
Printed on 6/3/2016 5:34 PM Timing Sheet Version: 200 SA & CA Revision: 10430

INTERSECTION: 036 Santa Rosa Rd@Blanchard Page 4 (of 5)
1 3 9 C D 0Carry- Detector 332 Input Detector Green Yellow Red Load-
Row Delay over Name File Number Row Clear Change Clear Switch #0 0.0 0.0 I-1 14 A Overlap A 0.0 0.0 0.0 01 0.0 0.0 I-2U 1 B Overlap B 0.0 0.0 0.0 02 0.0 0.0 I-2L 5 C Overlap C 0.0 0.0 0.0 03 0.0 0.0 I-3U 21 D Overlap D 0.0 0.0 0.0 04 0.0 0.0 I-3L 25 Overlap Timing <F Page> <D Page>5 0.0 0.0 I-4 96 0.0 0.0 I-5 167 0.0 0.0 I-6U 3 Row Detector Numbers E8 0.0 0.0 I-6L 7 A 1 2 3 4 5 6 7 8 123456789 0.0 0.0 I-7U 23 B 9 10 11 12 -- -- -- -- 1234____A 0.0 0.0 I-7L 27 C 13 14 15 16 17 18 19 20 12345678B 0.0 0.0 I-8 11 D -- -- -- -- 21 22 23 24 ____5678C 0.0 0.0 I-9U 18 E -- -- -- -- -- -- -- -- 1234____D 0.0 0.0 I-9L 20 F -- 25 26 27 28 -- -- -- _2345___E - - - - - - - - - - - - - - -F - - - - - - - - - - - - - - -
0 <F+C+1>2 4 0 0.0 <F+C+3>
Carry- Detector 332 Input Detector Detector Advance Warning Beacon - Sign 1Row Delay over Name File Number Row Number0 0.0 0.0 J-1 13 0 0 <F+D+1>1 0.0 0.0 J-2U 2 1 System Det. # 1 0 0.0 <F+D+3>2 0.0 0.0 J-2L 6 2 System Det. # 2 0 Advance Warning Beacon - Sign 23 0.0 0.0 J-3U 22 3 System Det. # 3 04 0.0 0.0 J-3L 26 4 System Det. # 4 0 0.0 <F+0+6>5 0.0 0.0 J-4 10 5 System Det. # 5 0 0.0 <F+0+7>6 0.0 0.0 J-5 15 6 System Det. # 6 0 Power Cycle Correction (Default = 0.5)7 0.0 0.0 J-6U 4 7 System Det. # 7 08 0.0 0.0 J-6L 8 8 System Det. # 8 0 0 <D+B+0>9 0.0 0.0 J-7U 24 System Detectors <D Page> Dial-Up Telephone CommunicationsA 0.0 0.0 J-7L 28 (If set to a non-zero value, parity will be disabled)
B 0.0 0.0 J-8 12C 0.0 0.0 J-9U 17 Max ON (minutes) 5 <D+A+E>D 0.0 0.0 J-9L 19 Max OFF (minutes) 60 <D+A+F>E - - - - - - - - - - - - - - - Detector Failure MonitorF - - - - - - - - - - - - - - -
Detector Delay & Carryover <D Page>
Disable Parity
Active Detectors <D Page>
Long FailureShort Failure
Phase NumberTime Before Yellow
Phase NumberTime Before Yellow
Note: Initialized data is for alldetectors to be active (ie, allflag bits set). A Detectorwhich is "not flagged", will notbe active as a PhaseDetector, and WILL NOT callor extend its associatedphase. It will still function as aSystem Detector.
Printed on 6/3/2016 5:34 PM Timing Sheet Version: 200 SA & CA Revision: 10430

INTERSECTION: 036 Santa Rosa Rd@Blanchard Page 5 (of 5)
Column Numbers ----> 1 2 3 4 5 6 7 8 Column Numbers ----> 1 2 3 4 5 6 7 8Row Phase Names ----> Phase Names ----> Row
0 0 7 0 7 0 7 0 7 Ped Walk 0 7 0 7 0 7 0 7 01 0 10 0 10 0 10 0 10 Ped FDW 0 10 0 10 0 10 0 10 12 3 7 3 7 3 7 3 7 Min Green 3 7 3 7 3 7 3 7 23 0 0 0 0 0 0 0 0 Type 3 Limit 0 0 0 0 0 0 0 0 34 0.0 1.2 0.0 1.2 0.0 1.2 0.0 1.2 Added Initial 0.0 1.2 0.0 1.2 0.0 1.2 0.0 1.2 45 0.5 3.5 0.5 3.5 0.5 3.5 0.5 3.5 Veh Extension 0.5 3.5 0.5 3.5 0.5 3.5 0.5 3.5 56 0.5 5.0 0.5 5.0 0.5 5.0 0.5 5.0 Max Gap 0.5 5.0 0.5 5.0 0.5 5.0 0.5 5.0 67 0.5 2.0 0.5 2.0 0.5 2.0 0.5 2.0 Min Gap 0.5 2.0 0.5 2.0 0.5 2.0 0.5 2.0 78 17 40 17 40 17 40 17 40 Max Limit 17 40 17 40 17 40 17 40 89 30 70 30 70 30 70 30 70 Max Limit 2 30 70 30 70 30 70 30 70 9A 0 0 0 0 0 0 0 0 - - - - - - 0 0 0 0 0 0 0 0 AB 0 0 0 0 0 0 0 0 Call To Phase 0 0 0 0 0 0 0 0 BC 0.1 0.1 0.1 0.1 0.1 0.1 0.1 0.1 Reduce By 0.1 0.1 0.1 0.1 0.1 0.1 0.1 0.1 CD 1.0 1.0 1.0 1.0 1.0 1.0 1.0 1.0 Reduce Every 1.0 1.0 1.0 1.0 1.0 1.0 1.0 1.0 DE 3.0 4.0 3.0 4.0 3.0 4.0 3.0 4.0 Yellow Change 3.0 4.0 3.0 4.0 3.0 4.0 3.0 4.0 EF 0.0 0.5 0.0 1.0 0.0 0.5 0.0 1.0 Red Clear 0.0 0.5 0.0 1.0 0.0 0.5 0.0 1.0 F
Phase Timing - Bank 2 <F Page> Phase Timing - Bank 3 <F Page>
7 8 CRow Time Dwell Vehicle Call Row
0 0 - - - - - - 01 0 0 ________ 12 0 0 ________ 23 0 0 ________ 34 0 0 ________ 45 0 0 ________ 56 0 0 ________ 67 0 0 ________ 78 0 0 ________ 89 0 0 ________ 9A - - - 0 ________ AB 0 0 ________ BC 0 0 ________ CD 0 0 ________ DE 0 0 ________ EF 0 0 ________ F
Special Event Schedule <C Page with F+9+F=22>
Phase Phase
9Hold
AAdvance
DPermit Phases
EPed Omit
- - -________________________
________________
________________________
________
________________________________
________________________
________
________ ________________
________________
________________________________________________
________________
________________________
________________________________
________________
- - -________________________________________________________
________________________
________________________________
________________________
________
________
________________
________________________________
________________
FOutput
________________________________________
________
________
________________________________
________________
Ped WalkPed FDWMin GreenType 3 LimitAdded InitialVeh ExtensionMax GapMin GapMax LimitMax Limit 2 - - - - - -Call To PhaseReduce ByReduce EveryYellow ChangeRed Clear
Delay Only --->
Limited Service Int. --->
BForce Off
________
________
________________________________
<--- Limited Service Interval
(Set Dwell = 255)
- - - - - - - - - - - -
________________________
________________
Printed on 6/3/2016 5:34 PM Timing Sheet Version: 200 SA & CA Revision: 10430

INTERSECTION: 037 Santa Rosa Rd@Brittany Park Page 1 (of 5)Group Assignment: NONE N/S Street Name: Brittany Park Rd Last Database Change:
Field Master Assignment: FM2 Santa Rosa Road E/W Street Name: Santa Rosa RoadSystem Reference Number: 37
Notes:Change By Date By Date
Drop Number 3 <C+0+0>Zone Number <C+0+1>Area Number 4 <C+0+2> Max Initial 20 <F+0+E>Area Address 3 <C+0+3> <C+A+1> Red Revert 5.0 <F+0+F>QuicNet Channel (QuicNet) <C+B+1> All Red Start 6.0 <F+C+0>Communication Addresses Manual Selection Start / Revert Times
Column Numbers ----> 1 2 3 4 5 6 7 8 ERow Phase Names ----> Row
0 Ped Walk 0 7 0 7 0 0 0 0 RR-1 Delay 0 Permit 01 Ped FDW 0 19 0 23 0 0 0 0 RR-1 Clear 10 Red Lock 12 Min Green 7 10 3 8 7 10 3 8 EV-A Delay 0 Yellow Lock 23 Type 3 Limit 0 0 0 0 0 0 0 0 EV-A Clear 1 Min Recall 34 Added Initial 0.0 2.0 0.0 0.0 0.0 2.0 0.0 0.0 EV-B Delay 0 Ped Recall 45 Veh Extension 3.0 5.0 0.5 3.0 3.0 5.0 0.5 3.0 EV-B Clear 1 View Set Peds 56 Max Gap 3.0 6.0 0.5 3.0 3.0 6.0 0.5 3.0 EV-C Delay 0 Rest In Walk 67 Min Gap 3.0 3.0 0.5 3.0 3.0 3.0 0.5 3.0 EV-C Clear 1 Red Rest 78 Max Limit 15 30 0 15 15 30 0 15 EV-D Delay 0 Dual Entry 89 Max Limit 2 30 70 30 70 30 70 30 70 EV-D Clear 1 Max Recall 9A - - - - - - 0 0 0 0 0 0 0 0 RR-2 Delay 0 Soft Recall AB Call To Phase 0 0 0 0 0 0 0 0 RR-2 Clear 10 Max 2 BC Reduce By 0.1 0.1 0.1 0.1 0.1 0.1 0.1 0.1 View EV Delay - - - Cond. Service CD Reduce Every 1.0 1.0 1.0 1.0 1.0 1.0 1.0 1.0 View EV Clear - - - Man Cntrl Calls DE Yellow Change 3.6 5.0 3.0 3.6 3.6 5.0 3.0 3.6 View RR Delay - - - Yellow Start EF Red Clear 1.0 2.0 0.0 1.0 1.0 2.0 0.0 1.0 View RR Clear - - - First Phases F
Phase Timing - Bank 1 <F Page> Preempt Timing Phase Functions <F Page>
12/7/2015 13:33
4/8/16: New coordination timing
________________
12_456_8
Manual Offset 0 = Automatic 1 = Offset A 2 = Offset B 3 = Offset C
________
________ - - - - -
Manual Plan 0 = Automatic1-9 = Plan 1-9 14 = Free 15 = Flash
________________
Change Record
FPhase
Manual PlanManual Offset0
Change
_________________2___6__
_2_4_6_8_________2___6__________________
Printed on 6/3/2016 5:35 PM Timing Sheet Version: 200 SA & CA Revision: 10430

INTERSECTION: 037 Santa Rosa Rd@Brittany Park Page 2 (of 5)
Column Numbers ----> 1 2 3 4 5 6 7 8 9Row Plan Name ----> Row E Row
0 Cycle Length 120 120 0 0 0 0 0 0 0 0 01 Phase 1 - ForceOff 55 54 0 0 0 0 0 0 0 1 Plan 1 - Sync _2___6__ 12 Phase 2 - ForceOff 0 0 0 0 0 0 0 0 0 2 Plan 2 - Sync _2___6__ 23 Phase 3 - ForceOff 0 0 0 0 0 0 0 0 0 3 Plan 3 - Sync _2___6__ 34 Phase 4 - ForceOff 37 37 0 0 0 0 0 0 0 4 Plan 4 - Sync _2___6__ 45 Phase 5 - ForceOff 53 54 0 0 0 0 0 0 0 5 Plan 5 - Sync _2___6__ 56 Phase 6 - ForceOff 0 0 0 0 0 0 0 0 0 6 Plan 6 - Sync _2___6__ 67 Phase 7 - ForceOff 0 0 0 0 0 0 0 0 0 7 Plan 7 - Sync _2___6__ 78 Phase 8 - ForceOff 37 37 0 0 0 0 0 0 0 8 Plan 8 - Sync _2___6__ 89 Ring Offset 0 0 0 0 0 0 0 0 0 9 Plan 9 - Sync _2___6__ 9A Offset 1 8 44 0 0 0 0 0 0 0 A Coord Ped * ________ AB Offset 2 0 0 0 0 0 0 0 0 0 B NEMA Hold ________ BC Offset 3 0 0 0 0 0 0 0 0 0 C CD Permissive 3 3 0 0 0 0 0 0 0 D DE Hold Release 255 255 0 0 0 0 0 0 0 E EF Zone Offset 0 0 0 0 0 0 0 0 0 F F
Coordination <C Page> Sync Phases <C Page>
Row Column Numbers ----> E F F Row
0 Exclusive Phases ________ Coord Force-Off Adjust Free Lag _2_4_6_8 01 RR-1 Clear Phases ________ RR Overlap A - Phases ________ for Ped Service <C+D+F> Plan 1 - Lag _2_4_6_8 12 RR-2 Clear Phases ________ RR Overlap B - Phases ________ Plan 2 - Lag _2_4_6_8 23 RR-2 Limited Service ________ RR Overlap C - Phases ________ Plan 3 - Lag _2_4_6_8 34 Prot / Perm Phases ________ RR Overlap D - Phases ________ TBC Transition <C+D+D> Plan 4 - Lag _2_4_6_8 45 Overlap A - Green Omit ________ Ped 2P _2______ Plan 5 - Lag _2_4_6_8 56 Overlap B - Green Omit ________ Ped 6P ________ Plan 6 - Lag _2_4_6_8 67 Overlap C - Green Omit ________ Ped 4P ___4____ Plan 7 - Lag _2_4_6_8 78 Overlap D - Green Omit ________ Ped 8P ________ Plan 8 - Lag _2_4_6_8 89 Overlap Yellow Flash ________ Yellow Flash Phases ________ Plan 9 - Lag _2_4_6_8 9A EV-A Phases ________ Overlap A - Phases ________ Coord Max * ________ AB EV-B Phases ________ Overlap B - Phases ________ Coord Lag * ________ BC EV-C Phases ________ Overlap C - Phases ________ CD EV-D Phases ________ Overlap D - Phases ________ DE Extra 1 Config. Bits 1_______ Restricted Phases ________ EF IC Select (Interconnect) _2______ Assign 5 Outputs ________ F
Configuration <E Page> Configuration <E Page> Lag Phases <C Page>
(* = Coordination Recall)Plan
Extra 1 Flags 1 = TBC Type 1 2 = NEMA Ext. Coord 3 = Auto Daylight Savings 4 = EV Advance 5 = 6 = Special Event 7 = Pretimed Operation 8 = Split Ring Operation
Assign 5 Outputs (Ped Loadswitch Yellows) 1 = Right Turn Overlap 2 = TOD Outputs 3 = EV Beacon - Steady 4 = EV Beacon - Flashing 5 = Special Event Outputs 6 = Phase 3 & 7 Ped 7 = Advanced Warning Sign 8 =
IC Select Flags1 =2 = Modem3 = 7-Wire Slave4 = Flash / Free5 =6 = Simplex Master7 = 7-Wire Master8 = Offset Interrupter
Transition Type
Force-Off Adjust
0
5
Transition Type 0 = Shortway Non-zero = Lengthen
Printed on 6/3/2016 5:35 PM Timing Sheet Version: 200 SA & CA Revision: 10430

INTERSECTION: 037 Santa Rosa Rd@Brittany Park Page 3 (of 5)
Column FRow Time Day of Week Time Day of Week Phases/Bits Time Day of Week Time Day of Week Time Day of Week Row
0 06 :30 1 A _23456_ 00 :00 0 _______ ________ 00 :00 0 0 _______ 00 :00 0 0 _______ 00 :00 0 0 _______ 01 09 :30 E A _23456_ 00 :00 0 _______ ________ 00 :00 0 0 _______ 00 :00 0 0 _______ 00 :00 0 0 _______ 12 14 :30 2 A _23456_ 00 :00 0 _______ ________ 00 :00 0 0 _______ 00 :00 0 0 _______ 00 :00 0 0 _______ 23 18 :30 E A _23456_ 00 :00 0 _______ ________ 00 :00 0 0 _______ 00 :00 0 0 _______ 00 :00 0 0 _______ 34 00 :00 0 0 _______ 00 :00 0 _______ ________ 00 :00 0 0 _______ 00 :00 0 0 _______ 00 :00 0 0 _______ 45 00 :00 0 0 _______ 00 :00 0 _______ ________ 00 :00 0 0 _______ 00 :00 0 0 _______ 00 :00 0 0 _______ 56 00 :00 0 0 _______ 00 :00 0 _______ ________ 00 :00 0 0 _______ 00 :00 0 0 _______ 00 :00 0 0 _______ 67 00 :00 0 0 _______ 00 :00 0 _______ ________ 00 :00 0 0 _______ 00 :00 0 0 _______ 00 :00 0 0 _______ 78 00 :00 0 0 _______ 00 :00 0 _______ ________ 00 :00 0 0 _______ 00 :00 0 0 _______ 00 :00 0 0 _______ 89 00 :00 0 0 _______ 00 :00 0 _______ ________ 00 :00 0 0 _______ 00 :00 0 0 _______ 00 :00 0 0 _______ 9A 00 :00 0 0 _______ 00 :00 0 _______ ________ 00 :00 0 0 _______ 00 :00 0 0 _______ 00 :00 0 0 _______ AB 00 :00 0 0 _______ 00 :00 0 _______ ________ 00 :00 0 0 _______ 00 :00 0 0 _______ 00 :00 0 0 _______ BC 00 :00 0 0 _______ 00 :00 0 _______ ________ 00 :00 0 0 _______ 00 :00 0 0 _______ 00 :00 0 0 _______ CD 00 :00 0 0 _______ 00 :00 0 _______ ________ 00 :00 0 0 _______ 00 :00 0 0 _______ 00 :00 0 0 _______ DE 00 :00 0 0 _______ 00 :00 0 _______ ________ 00 :00 0 0 _______ 00 :00 0 0 _______ 00 :00 0 0 _______ EF 00 :00 0 0 _______ 00 :00 0 _______ ________ 00 :00 0 0 _______ 00 :00 0 0 _______ 00 :00 0 0 _______ F
<D Page>
RowDay of Week
A 0 0 _______B 0 0 _______C 0 0 _______
Holiday Dates<8 Key>
Mon
th
Yea
r
Day
000Holiday # 3 Date
Holiday # 2 DateHoliday # 1 Date
TOD Coordination
Month Select1 = January2 = February3 = March4 = April5 = May6 = June7 = July8 = August9 = SeptemberA = OctoberB = NovemberC = December
Pla
n
Holiday # 1TOD Coordination
<9 Key with C+D+9=1> <9 Key with C+D+9=2> <9 Key with C+D+9=3>TOD Coordination
Holiday # 3Holiday # 2
Offs
et
Pla
n
Offs
et
Pla
n
Offs
et
<9 Key with C+D+9=0> <7 Key>
Plan Select1 thru 9 = Coordination Plan 1 thru 914 or E = Free15 or F = Flash
Offset SelectA = Offset AB = Offset BC = Offset C
Pla
n
Offs
et
Func
t.
T.O.D. Functions0 = Permitted Phases1 = Red Lock2 = Yellow Lock3 = Veh Min Recall4 = Ped Recall5 =6 = Rest In Walk7 = Red Rest8 = Double Entry9 = Veh Max RecallA = Veh Soft RecallB = Maximum 2C = Conditional ServiceD = Free Lag PhasesE = Bit 1 - Local Override Bit 2 - Phase Bank 2 Bit 3 - Phase Bank 3 Bit 4 - Disable Detector OFF Monitor Bit 7 - Detector Count Monitor Bit 8 - Real Time Split MonitorF = Output Bits 1 thru 4
TOD Coordination TOD Function
Printed on 6/3/2016 5:35 PM Timing Sheet Version: 200 SA & CA Revision: 10430

INTERSECTION: 037 Santa Rosa Rd@Brittany Park Page 4 (of 5)
1 3 9 C D 0Carry- Detector 332 Input Detector Green Yellow Red Load-
Row Delay over Name File Number Row Clear Change Clear Switch #0 0.0 0.0 I-1 14 A Overlap A 0.0 0.0 0.0 01 0.0 0.0 I-2U 1 B Overlap B 0.0 0.0 0.0 02 0.0 0.0 I-2L 5 C Overlap C 0.0 0.0 0.0 03 0.0 0.0 I-3U 21 D Overlap D 0.0 0.0 0.0 04 0.0 0.0 I-3L 25 Overlap Timing <F Page> <D Page>5 0.0 0.0 I-4 96 0.0 0.0 I-5 167 0.0 0.0 I-6U 3 Row Detector Numbers E8 0.0 0.0 I-6L 7 A 1 2 3 4 5 6 7 8 123456789 0.0 0.0 I-7U 23 B 9 10 11 12 -- -- -- -- 1234____A 0.0 0.0 I-7L 27 C 13 14 15 16 17 18 19 20 12345678B 0.0 0.0 I-8 11 D -- -- -- -- 21 22 23 24 ____5678C 0.0 0.0 I-9U 18 E -- -- -- -- -- -- -- -- 1234____D 0.0 0.0 I-9L 20 F -- 25 26 27 28 -- -- -- _2345___E - - - - - - - - - - - - - - -F - - - - - - - - - - - - - - -
0 <F+C+1>2 4 0 0.0 <F+C+3>
Carry- Detector 332 Input Detector Detector Advance Warning Beacon - Sign 1Row Delay over Name File Number Row Number0 0.0 0.0 J-1 13 0 0 <F+D+1>1 0.0 0.0 J-2U 2 1 System Det. # 1 0 0.0 <F+D+3>2 0.0 0.0 J-2L 6 2 System Det. # 2 0 Advance Warning Beacon - Sign 23 0.0 0.0 J-3U 22 3 System Det. # 3 04 0.0 0.0 J-3L 26 4 System Det. # 4 0 0.0 <F+0+6>5 0.0 0.0 J-4 10 5 System Det. # 5 0 0.0 <F+0+7>6 0.0 0.0 J-5 15 6 System Det. # 6 0 Power Cycle Correction (Default = 0.5)7 0.0 0.0 J-6U 4 7 System Det. # 7 08 8.0 0.0 J-6L 8 8 System Det. # 8 0 0 <D+B+0>9 0.0 0.0 J-7U 24 System Detectors <D Page> Dial-Up Telephone CommunicationsA 0.0 0.0 J-7L 28 (If set to a non-zero value, parity will be disabled)
B 0.0 0.0 J-8 12C 0.0 0.0 J-9U 17 Max ON (minutes) 5 <D+A+E>D 0.0 0.0 J-9L 19 Max OFF (minutes) 60 <D+A+F>E - - - - - - - - - - - - - - - Detector Failure MonitorF - - - - - - - - - - - - - - -
Detector Delay & Carryover <D Page>
Disable Parity
Active Detectors <D Page>
Long FailureShort Failure
Phase NumberTime Before Yellow
Phase NumberTime Before Yellow
Note: Initialized data is for alldetectors to be active (ie, allflag bits set). A Detectorwhich is "not flagged", will notbe active as a PhaseDetector, and WILL NOT callor extend its associatedphase. It will still function as aSystem Detector.
Printed on 6/3/2016 5:35 PM Timing Sheet Version: 200 SA & CA Revision: 10430

INTERSECTION: 037 Santa Rosa Rd@Brittany Park Page 5 (of 5)
Column Numbers ----> 1 2 3 4 5 6 7 8 Column Numbers ----> 1 2 3 4 5 6 7 8Row Phase Names ----> Phase Names ----> Row
0 0 7 0 7 0 7 0 7 Ped Walk 0 7 0 7 0 7 0 7 01 0 10 0 10 0 10 0 10 Ped FDW 0 10 0 10 0 10 0 10 12 3 7 3 7 3 7 3 7 Min Green 3 7 3 7 3 7 3 7 23 0 0 0 0 0 0 0 0 Type 3 Limit 0 0 0 0 0 0 0 0 34 0.0 1.2 0.0 1.2 0.0 1.2 0.0 1.2 Added Initial 0.0 1.2 0.0 1.2 0.0 1.2 0.0 1.2 45 0.5 3.5 0.5 3.5 0.5 3.5 0.5 3.5 Veh Extension 0.5 3.5 0.5 3.5 0.5 3.5 0.5 3.5 56 0.5 5.0 0.5 5.0 0.5 5.0 0.5 5.0 Max Gap 0.5 5.0 0.5 5.0 0.5 5.0 0.5 5.0 67 0.5 2.0 0.5 2.0 0.5 2.0 0.5 2.0 Min Gap 0.5 2.0 0.5 2.0 0.5 2.0 0.5 2.0 78 17 40 17 40 17 40 17 40 Max Limit 17 40 17 40 17 40 17 40 89 30 70 30 70 30 70 30 70 Max Limit 2 30 70 30 70 30 70 30 70 9A 0 0 0 0 0 0 0 0 - - - - - - 0 0 0 0 0 0 0 0 AB 0 0 0 0 0 0 0 0 Call To Phase 0 0 0 0 0 0 0 0 BC 0.1 0.1 0.1 0.1 0.1 0.1 0.1 0.1 Reduce By 0.1 0.1 0.1 0.1 0.1 0.1 0.1 0.1 CD 1.0 1.0 1.0 1.0 1.0 1.0 1.0 1.0 Reduce Every 1.0 1.0 1.0 1.0 1.0 1.0 1.0 1.0 DE 3.0 4.0 3.0 4.0 3.0 4.0 3.0 4.0 Yellow Change 3.0 4.0 3.0 4.0 3.0 4.0 3.0 4.0 EF 0.0 0.5 0.0 1.0 0.0 0.5 0.0 1.0 Red Clear 0.0 0.5 0.0 1.0 0.0 0.5 0.0 1.0 F
Phase Timing - Bank 2 <F Page> Phase Timing - Bank 3 <F Page>
7 8 CRow Time Dwell Vehicle Call Row
0 0 - - - - - - 01 0 0 ________ 12 0 0 ________ 23 0 0 ________ 34 0 0 ________ 45 0 0 ________ 56 0 0 ________ 67 0 0 ________ 78 0 0 ________ 89 0 0 ________ 9A - - - 0 ________ AB 0 0 ________ BC 0 0 ________ CD 0 0 ________ DE 0 0 ________ EF 0 0 ________ F
Special Event Schedule <C Page with F+9+F=22>
Phase Phase
9Hold
AAdvance
DPermit Phases
EPed Omit
- - -________________________
________________
________________________
________
________________________________
________________________
________
________ ________________
________________
________________________________________________
________________
________________________
________________________________
________________
- - -________________________________________________________
________________________
________________________________
________________________
________
________
________________
________________________________
________________
FOutput
________________________________________
________
________
________________________________
________________
Ped WalkPed FDWMin GreenType 3 LimitAdded InitialVeh ExtensionMax GapMin GapMax LimitMax Limit 2 - - - - - -Call To PhaseReduce ByReduce EveryYellow ChangeRed Clear
Delay Only --->
Limited Service Int. --->
BForce Off
________
________
________________________________
<--- Limited Service Interval
(Set Dwell = 255)
- - - - - - - - - - - -
________________________
________________
Printed on 6/3/2016 5:35 PM Timing Sheet Version: 200 SA & CA Revision: 10430

INTERSECTION: 035 Santa Rosa Rd@Applewood Page 1 (of 5)Group Assignment: NONE N/S Street Name: Applewood Lane Last Database Change:
Field Master Assignment: FM2 Santa Rosa Road E/W Street Name: Santa Rosa RoadSystem Reference Number: 35
Notes:Change By Date By Date
Drop Number 4 <C+0+0>Zone Number <C+0+1>Area Number 4 <C+0+2> Max Initial 20 <F+0+E>Area Address 4 <C+0+3> <C+A+1> Red Revert 5.0 <F+0+F>QuicNet Channel (QuicNet) <C+B+1> All Red Start 6.0 <F+C+0>Communication Addresses Manual Selection Start / Revert Times
Column Numbers ----> 1 2 3 4 5 6 7 8 ERow Phase Names ----> Row
0 Ped Walk 0 7 0 7 0 7 0 0 RR-1 Delay 0 Permit 01 Ped FDW 0 19 0 25 0 19 0 0 RR-1 Clear 10 Red Lock 12 Min Green 8 10 3 8 8 10 3 8 EV-A Delay 0 Yellow Lock 23 Type 3 Limit 0 0 0 0 0 0 0 0 EV-A Clear 1 Min Recall 34 Added Initial 0.0 2.0 0.0 0.0 0.0 2.0 0.0 0.0 EV-B Delay 0 Ped Recall 45 Veh Extension 3.0 5.0 0.5 3.0 3.0 5.0 0.5 3.0 EV-B Clear 1 View Set Peds 56 Max Gap 3.0 6.0 0.5 3.0 3.0 6.0 0.5 3.0 EV-C Delay 0 Rest In Walk 67 Min Gap 3.0 3.0 0.5 3.0 3.0 3.0 0.5 3.0 EV-C Clear 1 Red Rest 78 Max Limit 15 30 0 15 15 30 0 15 EV-D Delay 0 Dual Entry 89 Max Limit 2 30 70 30 70 30 70 30 70 EV-D Clear 1 Max Recall 9A - - - - - - 0 0 0 0 0 0 0 0 RR-2 Delay 0 Soft Recall AB Call To Phase 0 0 0 0 0 0 0 0 RR-2 Clear 10 Max 2 BC Reduce By 0.1 0.1 0.1 0.1 0.1 0.1 0.1 0.1 View EV Delay - - - Cond. Service CD Reduce Every 1.0 1.0 1.0 1.0 1.0 1.0 1.0 1.0 View EV Clear - - - Man Cntrl Calls DE Yellow Change 3.6 5.0 3.0 3.6 3.6 5.0 3.0 3.6 View RR Delay - - - Yellow Start EF Red Clear 1.0 2.0 0.0 1.0 1.0 2.0 0.0 1.0 View RR Clear - - - First Phases F
Phase Timing - Bank 1 <F Page> Preempt Timing Phase Functions <F Page>
12/7/2015 13:27
4/8/16: New coordination timing
________________
12_456_8
Manual Offset 0 = Automatic 1 = Offset A 2 = Offset B 3 = Offset C
________
________ - - - - -
Manual Plan 0 = Automatic1-9 = Plan 1-9 14 = Free 15 = Flash
________________
Change Record
FPhase
Manual PlanManual Offset0
Change
_________________2___6__
_2_4_6_8_________2___6__________________
Printed on 6/3/2016 4:52 PM Timing Sheet Version: 200 SA & CA Revision: 10430

INTERSECTION: 035 Santa Rosa Rd@Applewood Page 2 (of 5)
Column Numbers ----> 1 2 3 4 5 6 7 8 9Row Plan Name ----> Row E Row
0 Cycle Length 120 120 0 0 0 0 0 0 0 0 01 Phase 1 - ForceOff 58 57 0 0 0 0 0 0 0 1 Plan 1 - Sync _2___6__ 12 Phase 2 - ForceOff 0 0 0 0 0 0 0 0 0 2 Plan 2 - Sync _2___6__ 23 Phase 3 - ForceOff 0 0 0 0 0 0 0 0 0 3 Plan 3 - Sync _2___6__ 34 Phase 4 - ForceOff 39 39 0 0 0 0 0 0 0 4 Plan 4 - Sync _2___6__ 45 Phase 5 - ForceOff 58 57 0 0 0 0 0 0 0 5 Plan 5 - Sync _2___6__ 56 Phase 6 - ForceOff 0 0 0 0 0 0 0 0 0 6 Plan 6 - Sync _2___6__ 67 Phase 7 - ForceOff 0 0 0 0 0 0 0 0 0 7 Plan 7 - Sync _2___6__ 78 Phase 8 - ForceOff 39 39 0 0 0 0 0 0 0 8 Plan 8 - Sync _2___6__ 89 Ring Offset 0 0 0 0 0 0 0 0 0 9 Plan 9 - Sync _2___6__ 9A Offset 1 80 104 0 0 0 0 0 0 0 A Coord Ped * ________ AB Offset 2 0 0 0 0 0 0 0 0 0 B NEMA Hold ________ BC Offset 3 0 0 0 0 0 0 0 0 0 C CD Permissive 3 3 0 0 0 0 0 0 0 D DE Hold Release 255 255 0 0 0 0 0 0 0 E EF Zone Offset 0 0 0 0 0 0 0 0 0 F F
Coordination <C Page> Sync Phases <C Page>
Row Column Numbers ----> E F F Row
0 Exclusive Phases ________ Coord Force-Off Adjust Free Lag _2_4_6_8 01 RR-1 Clear Phases ________ RR Overlap A - Phases ________ for Ped Service <C+D+F> Plan 1 - Lag _2_4_6_8 12 RR-2 Clear Phases ________ RR Overlap B - Phases ________ Plan 2 - Lag _2_4_6_8 23 RR-2 Limited Service ________ RR Overlap C - Phases ________ Plan 3 - Lag _2_4_6_8 34 Prot / Perm Phases ________ RR Overlap D - Phases ________ TBC Transition <C+D+D> Plan 4 - Lag _2_4_6_8 45 Overlap A - Green Omit ________ Ped 2P _2______ Plan 5 - Lag _2_4_6_8 56 Overlap B - Green Omit ________ Ped 6P _____6__ Plan 6 - Lag _2_4_6_8 67 Overlap C - Green Omit ________ Ped 4P ___4____ Plan 7 - Lag _2_4_6_8 78 Overlap D - Green Omit ________ Ped 8P ________ Plan 8 - Lag _2_4_6_8 89 Overlap Yellow Flash ________ Yellow Flash Phases ________ Plan 9 - Lag _2_4_6_8 9A EV-A Phases ________ Overlap A - Phases ________ Coord Max * ________ AB EV-B Phases ________ Overlap B - Phases ________ Coord Lag * ________ BC EV-C Phases ________ Overlap C - Phases ________ CD EV-D Phases ________ Overlap D - Phases ________ DE Extra 1 Config. Bits 1_______ Restricted Phases ________ EF IC Select (Interconnect) _2______ Assign 5 Outputs ________ F
Configuration <E Page> Configuration <E Page> Lag Phases <C Page>
(* = Coordination Recall)Plan
Extra 1 Flags 1 = TBC Type 1 2 = NEMA Ext. Coord 3 = Auto Daylight Savings 4 = EV Advance 5 = 6 = Special Event 7 = Pretimed Operation 8 = Split Ring Operation
Assign 5 Outputs (Ped Loadswitch Yellows) 1 = Right Turn Overlap 2 = TOD Outputs 3 = EV Beacon - Steady 4 = EV Beacon - Flashing 5 = Special Event Outputs 6 = Phase 3 & 7 Ped 7 = Advanced Warning Sign 8 =
IC Select Flags1 =2 = Modem3 = 7-Wire Slave4 = Flash / Free5 =6 = Simplex Master7 = 7-Wire Master8 = Offset Interrupter
Transition Type
Force-Off Adjust
0
5
Transition Type 0 = Shortway Non-zero = Lengthen
Printed on 6/3/2016 4:52 PM Timing Sheet Version: 200 SA & CA Revision: 10430

INTERSECTION: 035 Santa Rosa Rd@Applewood Page 3 (of 5)
Column FRow Time Day of Week Time Day of Week Phases/Bits Time Day of Week Time Day of Week Time Day of Week Row
0 06 :30 1 A _23456_ 00 :00 0 _______ ________ 00 :00 0 0 _______ 00 :00 0 0 _______ 00 :00 0 0 _______ 01 09 :30 E A _23456_ 00 :00 0 _______ ________ 00 :00 0 0 _______ 00 :00 0 0 _______ 00 :00 0 0 _______ 12 14 :30 2 A _23456_ 00 :00 0 _______ ________ 00 :00 0 0 _______ 00 :00 0 0 _______ 00 :00 0 0 _______ 23 18 :30 E A _23456_ 00 :00 0 _______ ________ 00 :00 0 0 _______ 00 :00 0 0 _______ 00 :00 0 0 _______ 34 00 :00 0 0 _______ 00 :00 0 _______ ________ 00 :00 0 0 _______ 00 :00 0 0 _______ 00 :00 0 0 _______ 45 00 :00 0 0 _______ 00 :00 0 _______ ________ 00 :00 0 0 _______ 00 :00 0 0 _______ 00 :00 0 0 _______ 56 00 :00 0 0 _______ 00 :00 0 _______ ________ 00 :00 0 0 _______ 00 :00 0 0 _______ 00 :00 0 0 _______ 67 00 :00 0 0 _______ 00 :00 0 _______ ________ 00 :00 0 0 _______ 00 :00 0 0 _______ 00 :00 0 0 _______ 78 00 :00 0 0 _______ 00 :00 0 _______ ________ 00 :00 0 0 _______ 00 :00 0 0 _______ 00 :00 0 0 _______ 89 00 :00 0 0 _______ 00 :00 0 _______ ________ 00 :00 0 0 _______ 00 :00 0 0 _______ 00 :00 0 0 _______ 9A 00 :00 0 0 _______ 00 :00 0 _______ ________ 00 :00 0 0 _______ 00 :00 0 0 _______ 00 :00 0 0 _______ AB 00 :00 0 0 _______ 00 :00 0 _______ ________ 00 :00 0 0 _______ 00 :00 0 0 _______ 00 :00 0 0 _______ BC 00 :00 0 0 _______ 00 :00 0 _______ ________ 00 :00 0 0 _______ 00 :00 0 0 _______ 00 :00 0 0 _______ CD 00 :00 0 0 _______ 00 :00 0 _______ ________ 00 :00 0 0 _______ 00 :00 0 0 _______ 00 :00 0 0 _______ DE 00 :00 0 0 _______ 00 :00 0 _______ ________ 00 :00 0 0 _______ 00 :00 0 0 _______ 00 :00 0 0 _______ EF 00 :00 0 0 _______ 00 :00 0 _______ ________ 00 :00 0 0 _______ 00 :00 0 0 _______ 00 :00 0 0 _______ F
<D Page>
RowDay of Week
A 0 0 _______B 0 0 _______C 0 0 _______
Holiday Dates<8 Key>
Mon
th
Yea
r
Day
000Holiday # 3 Date
Holiday # 2 DateHoliday # 1 Date
TOD Coordination
Month Select1 = January2 = February3 = March4 = April5 = May6 = June7 = July8 = August9 = SeptemberA = OctoberB = NovemberC = December
Pla
n
Holiday # 1TOD Coordination
<9 Key with C+D+9=1> <9 Key with C+D+9=2> <9 Key with C+D+9=3>TOD Coordination
Holiday # 3Holiday # 2
Offs
et
Pla
n
Offs
et
Pla
n
Offs
et
<9 Key with C+D+9=0> <7 Key>
Plan Select1 thru 9 = Coordination Plan 1 thru 914 or E = Free15 or F = Flash
Offset SelectA = Offset AB = Offset BC = Offset C
Pla
n
Offs
et
Func
t.
T.O.D. Functions0 = Permitted Phases1 = Red Lock2 = Yellow Lock3 = Veh Min Recall4 = Ped Recall5 =6 = Rest In Walk7 = Red Rest8 = Double Entry9 = Veh Max RecallA = Veh Soft RecallB = Maximum 2C = Conditional ServiceD = Free Lag PhasesE = Bit 1 - Local Override Bit 2 - Phase Bank 2 Bit 3 - Phase Bank 3 Bit 4 - Disable Detector OFF Monitor Bit 7 - Detector Count Monitor Bit 8 - Real Time Split MonitorF = Output Bits 1 thru 4
TOD Coordination TOD Function
Printed on 6/3/2016 4:52 PM Timing Sheet Version: 200 SA & CA Revision: 10430

INTERSECTION: 035 Santa Rosa Rd@Applewood Page 4 (of 5)
1 3 9 C D 0Carry- Detector 332 Input Detector Green Yellow Red Load-
Row Delay over Name File Number Row Clear Change Clear Switch #0 0.0 0.0 I-1 14 A Overlap A 0.0 0.0 0.0 01 0.0 0.0 I-2U 1 B Overlap B 0.0 0.0 0.0 02 8.0 0.0 I-2L 5 C Overlap C 0.0 0.0 0.0 03 0.0 0.0 I-3U 21 D Overlap D 0.0 0.0 0.0 04 0.0 0.0 I-3L 25 Overlap Timing <F Page> <D Page>5 0.0 0.0 I-4 96 0.0 0.0 I-5 167 0.0 0.0 I-6U 3 Row Detector Numbers E8 8.0 0.0 I-6L 7 A 1 2 3 4 5 6 7 8 123456789 0.0 0.0 I-7U 23 B 9 10 11 12 -- -- -- -- 1234____A 0.0 0.0 I-7L 27 C 13 14 15 16 17 18 19 20 12345678B 0.0 0.0 I-8 11 D -- -- -- -- 21 22 23 24 ____5678C 0.0 0.0 I-9U 18 E -- -- -- -- -- -- -- -- 1234____D 0.0 0.0 I-9L 20 F -- 25 26 27 28 -- -- -- _2345___E - - - - - - - - - - - - - - -F - - - - - - - - - - - - - - -
0 <F+C+1>2 4 0 0.0 <F+C+3>
Carry- Detector 332 Input Detector Detector Advance Warning Beacon - Sign 1Row Delay over Name File Number Row Number0 0.0 0.0 J-1 13 0 0 <F+D+1>1 0.0 0.0 J-2U 2 1 System Det. # 1 0 0.0 <F+D+3>2 0.0 0.0 J-2L 6 2 System Det. # 2 0 Advance Warning Beacon - Sign 23 0.0 0.0 J-3U 22 3 System Det. # 3 04 0.0 0.0 J-3L 26 4 System Det. # 4 0 0.0 <F+0+6>5 8.0 0.0 J-4 10 5 System Det. # 5 0 0.0 <F+0+7>6 0.0 0.0 J-5 15 6 System Det. # 6 0 Power Cycle Correction (Default = 0.5)7 0.0 0.0 J-6U 4 7 System Det. # 7 08 8.0 0.0 J-6L 8 8 System Det. # 8 0 0 <D+B+0>9 0.0 0.0 J-7U 24 System Detectors <D Page> Dial-Up Telephone CommunicationsA 0.0 0.0 J-7L 28 (If set to a non-zero value, parity will be disabled)
B 0.0 0.0 J-8 12C 0.0 0.0 J-9U 17 Max ON (minutes) 5 <D+A+E>D 0.0 0.0 J-9L 19 Max OFF (minutes) 60 <D+A+F>E - - - - - - - - - - - - - - - Detector Failure MonitorF - - - - - - - - - - - - - - -
Detector Delay & Carryover <D Page>
Disable Parity
Active Detectors <D Page>
Long FailureShort Failure
Phase NumberTime Before Yellow
Phase NumberTime Before Yellow
Note: Initialized data is for alldetectors to be active (ie, allflag bits set). A Detectorwhich is "not flagged", will notbe active as a PhaseDetector, and WILL NOT callor extend its associatedphase. It will still function as aSystem Detector.
Printed on 6/3/2016 4:52 PM Timing Sheet Version: 200 SA & CA Revision: 10430

INTERSECTION: 035 Santa Rosa Rd@Applewood Page 5 (of 5)
Column Numbers ----> 1 2 3 4 5 6 7 8 Column Numbers ----> 1 2 3 4 5 6 7 8Row Phase Names ----> Phase Names ----> Row
0 0 7 0 7 0 7 0 7 Ped Walk 0 7 0 7 0 7 0 7 01 0 10 0 10 0 10 0 10 Ped FDW 0 10 0 10 0 10 0 10 12 3 7 3 7 3 7 3 7 Min Green 3 7 3 7 3 7 3 7 23 0 0 0 0 0 0 0 0 Type 3 Limit 0 0 0 0 0 0 0 0 34 0.0 1.2 0.0 1.2 0.0 1.2 0.0 1.2 Added Initial 0.0 1.2 0.0 1.2 0.0 1.2 0.0 1.2 45 0.5 3.5 0.5 3.5 0.5 3.5 0.5 3.5 Veh Extension 0.5 3.5 0.5 3.5 0.5 3.5 0.5 3.5 56 0.5 5.0 0.5 5.0 0.5 5.0 0.5 5.0 Max Gap 0.5 5.0 0.5 5.0 0.5 5.0 0.5 5.0 67 0.5 2.0 0.5 2.0 0.5 2.0 0.5 2.0 Min Gap 0.5 2.0 0.5 2.0 0.5 2.0 0.5 2.0 78 17 40 17 40 17 40 17 40 Max Limit 17 40 17 40 17 40 17 40 89 30 70 30 70 30 70 30 70 Max Limit 2 30 70 30 70 30 70 30 70 9A 0 0 0 0 0 0 0 0 - - - - - - 0 0 0 0 0 0 0 0 AB 0 0 0 0 0 0 0 0 Call To Phase 0 0 0 0 0 0 0 0 BC 0.1 0.1 0.1 0.1 0.1 0.1 0.1 0.1 Reduce By 0.1 0.1 0.1 0.1 0.1 0.1 0.1 0.1 CD 1.0 1.0 1.0 1.0 1.0 1.0 1.0 1.0 Reduce Every 1.0 1.0 1.0 1.0 1.0 1.0 1.0 1.0 DE 3.0 4.0 3.0 4.0 3.0 4.0 3.0 4.0 Yellow Change 3.0 4.0 3.0 4.0 3.0 4.0 3.0 4.0 EF 0.0 0.5 0.0 1.0 0.0 0.5 0.0 1.0 Red Clear 0.0 0.5 0.0 1.0 0.0 0.5 0.0 1.0 F
Phase Timing - Bank 2 <F Page> Phase Timing - Bank 3 <F Page>
7 8 CRow Time Dwell Vehicle Call Row
0 0 - - - - - - 01 0 0 ________ 12 0 0 ________ 23 0 0 ________ 34 0 0 ________ 45 0 0 ________ 56 0 0 ________ 67 0 0 ________ 78 0 0 ________ 89 0 0 ________ 9A - - - 0 ________ AB 0 0 ________ BC 0 0 ________ CD 0 0 ________ DE 0 0 ________ EF 0 0 ________ F
Special Event Schedule <C Page with F+9+F=22>
Phase Phase
9Hold
AAdvance
DPermit Phases
EPed Omit
- - -________________________
________________
________________________
________
________________________________
________________________
________
________ ________________
________________
________________________________________________
________________
________________________
________________________________
________________
- - -________________________________________________________
________________________
________________________________
________________________
________
________
________________
________________________________
________________
FOutput
________________________________________
________
________
________________________________
________________
Ped WalkPed FDWMin GreenType 3 LimitAdded InitialVeh ExtensionMax GapMin GapMax LimitMax Limit 2 - - - - - -Call To PhaseReduce ByReduce EveryYellow ChangeRed Clear
Delay Only --->
Limited Service Int. --->
BForce Off
________
________
________________________________
<--- Limited Service Interval
(Set Dwell = 255)
- - - - - - - - - - - -
________________________
________________
Printed on 6/3/2016 4:52 PM Timing Sheet Version: 200 SA & CA Revision: 10430

INTERSECTION: 020 Santa Rosa @ E Las Posas Page 1 (of 5)Group Assignment: NONE N/S Street Name: E Las Posas Road Last Database Change:
Field Master Assignment: FM2 Santa Rosa Road E/W Street Name: Santa Rosa RoadSystem Reference Number: 21
Notes:Change By Date By Date
Drop Number 5 <C+0+0>Zone Number <C+0+1>Area Number 4 <C+0+2> Max Initial 20 <F+0+E>Area Address 5 <C+0+3> <C+A+1> Red Revert 5.0 <F+0+F>QuicNet Channel (QuicNet) <C+B+1> All Red Start 6.0 <F+C+0>Communication Addresses Manual Selection Start / Revert Times
Column Numbers ----> 1 2 3 4 5 6 7 8 ERow Phase Names ----> Row
0 Ped Walk 0 0 0 7 0 7 0 0 RR-1 Delay 0 Permit 01 Ped FDW 0 0 0 22 0 18 0 0 RR-1 Clear 10 Red Lock 12 Min Green 0 10 0 8 10 10 0 0 EV-A Delay 0 Yellow Lock 23 Type 3 Limit 0 0 0 0 0 0 0 0 EV-A Clear 1 Min Recall 34 Added Initial 0.0 2.0 0.0 0.0 0.0 2.0 0.0 0.0 EV-B Delay 0 Ped Recall 45 Veh Extension 0.0 5.0 0.0 3.0 3.0 5.0 0.0 0.0 EV-B Clear 1 View Set Peds 56 Max Gap 0.0 6.0 0.0 3.0 3.0 6.0 0.0 0.0 EV-C Delay 0 Rest In Walk 67 Min Gap 0.0 3.0 0.0 3.0 3.0 3.0 0.0 0.0 EV-C Clear 1 Red Rest 78 Max Limit 0 30 0 15 15 30 0 0 EV-D Delay 0 Dual Entry 89 Max Limit 2 0 65 0 0 0 65 0 0 EV-D Clear 1 Max Recall 9A - - - - - - 0 0 0 0 0 0 0 0 RR-2 Delay 0 Soft Recall AB Call To Phase 0 0 0 0 0 0 0 0 RR-2 Clear 10 Max 2 BC Reduce By 0.0 0.1 0.0 0.0 0.0 0.1 0.0 0.0 View EV Delay - - - Cond. Service CD Reduce Every 0.0 1.0 0.0 0.0 0.0 1.0 0.0 0.0 View EV Clear - - - Man Cntrl Calls DE Yellow Change 0.0 5.0 0.0 4.0 3.6 5.0 0.0 0.0 View RR Delay - - - Yellow Start EF Red Clear 0.0 2.0 0.0 1.0 1.0 2.0 0.0 0.0 View RR Clear - - - First Phases F
Phase Timing - Bank 1 <F Page> Preempt Timing Phase Functions <F Page>
_________________2___6__
_2___6___________2___6__________________
Change Record
FPhase
Manual PlanManual Offset0
Change
________
________ - - - - -
Manual Plan 0 = Automatic1-9 = Plan 1-9 14 = Free 15 = Flash
________________
12/7/2015 13:22
4/8/16: New coordination timing
________________
_2_456__
Manual Offset 0 = Automatic 1 = Offset A 2 = Offset B 3 = Offset C
Printed on 6/3/2016 5:36 PM Timing Sheet Version: 200 SA & CA Revision: 10430

INTERSECTION: 020 Santa Rosa @ E Las Posas Page 2 (of 5)
Column Numbers ----> 1 2 3 4 5 6 7 8 9Row Plan Name ----> Row E Row
0 Cycle Length 120 120 0 0 0 0 0 0 0 0 01 Phase 1 - ForceOff 0 0 0 0 0 0 0 0 0 1 Plan 1 - Sync _2___6__ 12 Phase 2 - ForceOff 0 0 0 0 0 0 0 0 0 2 Plan 2 - Sync _2___6__ 23 Phase 3 - ForceOff 0 0 0 0 0 0 0 0 0 3 Plan 3 - Sync _2___6__ 34 Phase 4 - ForceOff 36 36 0 0 0 0 0 0 0 4 Plan 4 - Sync _2___6__ 45 Phase 5 - ForceOff 54 56 0 0 0 0 0 0 0 5 Plan 5 - Sync _2___6__ 56 Phase 6 - ForceOff 0 0 0 0 0 0 0 0 0 6 Plan 6 - Sync _2___6__ 67 Phase 7 - ForceOff 0 0 0 0 0 0 0 0 0 7 Plan 7 - Sync _2___6__ 78 Phase 8 - ForceOff 0 0 0 0 0 0 0 0 0 8 Plan 8 - Sync _2___6__ 89 Ring Offset 0 0 0 0 0 0 0 0 0 9 Plan 9 - Sync _2___6__ 9A Offset 1 73 86 0 0 0 0 0 0 0 A Coord Ped * ________ AB Offset 2 0 0 0 0 0 0 0 0 0 B NEMA Hold ________ BC Offset 3 0 0 0 0 0 0 0 0 0 C CD Permissive 3 3 0 0 0 0 0 0 0 D DE Hold Release 255 255 0 0 0 0 0 0 0 E EF Zone Offset 0 0 0 0 0 0 0 0 0 F F
Coordination <C Page> Sync Phases <C Page>
Row Column Numbers ----> E F F Row
0 Exclusive Phases ________ Coord Force-Off Adjust Free Lag _2_4_6__ 01 RR-1 Clear Phases ________ RR Overlap A - Phases ________ for Ped Service <C+D+F> Plan 1 - Lag _2_4_6__ 12 RR-2 Clear Phases ________ RR Overlap B - Phases ________ Plan 2 - Lag _2_4_6__ 23 RR-2 Limited Service ________ RR Overlap C - Phases ________ Plan 3 - Lag _2_4_6__ 34 Prot / Perm Phases ____5___ RR Overlap D - Phases ________ TBC Transition <C+D+D> Plan 4 - Lag _2_4_6__ 45 Overlap A - Green Omit ________ Ped 2P ________ Plan 5 - Lag _2_4_6__ 56 Overlap B - Green Omit ________ Ped 6P _____6__ Plan 6 - Lag _2_4_6__ 67 Overlap C - Green Omit ________ Ped 4P ___4____ Plan 7 - Lag _2_4_6__ 78 Overlap D - Green Omit ________ Ped 8P ________ Plan 8 - Lag _2_4_6__ 89 Overlap Yellow Flash ________ Yellow Flash Phases ________ Plan 9 - Lag _2_4_6__ 9A EV-A Phases ________ Overlap A - Phases ________ Coord Max * ________ AB EV-B Phases ________ Overlap B - Phases ________ Coord Lag * ________ BC EV-C Phases ________ Overlap C - Phases ________ CD EV-D Phases ________ Overlap D - Phases ________ DE Extra 1 Config. Bits 1_______ Restricted Phases ________ EF IC Select (Interconnect) _2______ Assign 5 Outputs ________ F
Configuration <E Page> Configuration <E Page> Lag Phases <C Page>
(* = Coordination Recall)Plan
Extra 1 Flags 1 = TBC Type 1 2 = NEMA Ext. Coord 3 = Auto Daylight Savings 4 = EV Advance 5 = 6 = Special Event 7 = Pretimed Operation 8 = Split Ring Operation
Assign 5 Outputs (Ped Loadswitch Yellows) 1 = Right Turn Overlap 2 = TOD Outputs 3 = EV Beacon - Steady 4 = EV Beacon - Flashing 5 = Special Event Outputs 6 = Phase 3 & 7 Ped 7 = Advanced Warning Sign 8 =
IC Select Flags1 =2 = Modem3 = 7-Wire Slave4 = Flash / Free5 =6 = Simplex Master7 = 7-Wire Master8 = Offset Interrupter
Transition Type
Force-Off Adjust
0
5
Transition Type 0 = Shortway Non-zero = Lengthen
Printed on 6/3/2016 5:36 PM Timing Sheet Version: 200 SA & CA Revision: 10430

INTERSECTION: 020 Santa Rosa @ E Las Posas Page 3 (of 5)
Column FRow Time Day of Week Time Day of Week Phases/Bits Time Day of Week Time Day of Week Time Day of Week Row
0 06 :30 1 A _23456_ 00 :00 0 _______ ________ 00 :00 0 0 _______ 00 :00 0 0 _______ 00 :00 0 0 _______ 01 09 :30 E A _23456_ 00 :00 0 _______ ________ 00 :00 0 0 _______ 00 :00 0 0 _______ 00 :00 0 0 _______ 12 14 :30 2 A _23456_ 00 :00 0 _______ ________ 00 :00 0 0 _______ 00 :00 0 0 _______ 00 :00 0 0 _______ 23 18 :30 E A _23456_ 00 :00 0 _______ ________ 00 :00 0 0 _______ 00 :00 0 0 _______ 00 :00 0 0 _______ 34 00 :00 0 0 _______ 00 :00 0 _______ ________ 00 :00 0 0 _______ 00 :00 0 0 _______ 00 :00 0 0 _______ 45 00 :00 0 0 _______ 00 :00 0 _______ ________ 00 :00 0 0 _______ 00 :00 0 0 _______ 00 :00 0 0 _______ 56 00 :00 0 0 _______ 00 :00 0 _______ ________ 00 :00 0 0 _______ 00 :00 0 0 _______ 00 :00 0 0 _______ 67 00 :00 0 0 _______ 00 :00 0 _______ ________ 00 :00 0 0 _______ 00 :00 0 0 _______ 00 :00 0 0 _______ 78 00 :00 0 0 _______ 00 :00 0 _______ ________ 00 :00 0 0 _______ 00 :00 0 0 _______ 00 :00 0 0 _______ 89 00 :00 0 0 _______ 00 :00 0 _______ ________ 00 :00 0 0 _______ 00 :00 0 0 _______ 00 :00 0 0 _______ 9A 00 :00 0 0 _______ 00 :00 0 _______ ________ 00 :00 0 0 _______ 00 :00 0 0 _______ 00 :00 0 0 _______ AB 00 :00 0 0 _______ 00 :00 0 _______ ________ 00 :00 0 0 _______ 00 :00 0 0 _______ 00 :00 0 0 _______ BC 00 :00 0 0 _______ 00 :00 0 _______ ________ 00 :00 0 0 _______ 00 :00 0 0 _______ 00 :00 0 0 _______ CD 00 :00 0 0 _______ 00 :00 0 _______ ________ 00 :00 0 0 _______ 00 :00 0 0 _______ 00 :00 0 0 _______ DE 00 :00 0 0 _______ 00 :00 0 _______ ________ 00 :00 0 0 _______ 00 :00 0 0 _______ 00 :00 0 0 _______ EF 00 :00 0 0 _______ 00 :00 0 _______ ________ 00 :00 0 0 _______ 00 :00 0 0 _______ 00 :00 0 0 _______ F
<D Page>
RowDay of Week
A 0 0 _______B 0 0 _______C 0 0 _______
<9 Key with C+D+9=0> <7 Key>
Plan Select1 thru 9 = Coordination Plan 1 thru 914 or E = Free15 or F = Flash
Offset SelectA = Offset AB = Offset BC = Offset C
Pla
n
Offs
et
Func
t.
T.O.D. Functions0 = Permitted Phases1 = Red Lock2 = Yellow Lock3 = Veh Min Recall4 = Ped Recall5 =6 = Rest In Walk7 = Red Rest8 = Double Entry9 = Veh Max RecallA = Veh Soft RecallB = Maximum 2C = Conditional ServiceD = Free Lag PhasesE = Bit 1 - Local Override Bit 2 - Phase Bank 2 Bit 3 - Phase Bank 3 Bit 4 - Disable Detector OFF Monitor Bit 7 - Detector Count Monitor Bit 8 - Real Time Split MonitorF = Output Bits 1 thru 4
TOD Coordination TOD Function Holiday # 3Holiday # 2
Offs
et
Pla
n
Offs
et
Pla
n
Offs
et
Holiday # 1 Date
TOD Coordination
Month Select1 = January2 = February3 = March4 = April5 = May6 = June7 = July8 = August9 = SeptemberA = OctoberB = NovemberC = December
Pla
n
Holiday # 1TOD Coordination
<9 Key with C+D+9=1> <9 Key with C+D+9=2> <9 Key with C+D+9=3>TOD Coordination
Holiday Dates<8 Key>
Mon
th
Yea
r
Day
000Holiday # 3 Date
Holiday # 2 Date
Printed on 6/3/2016 5:36 PM Timing Sheet Version: 200 SA & CA Revision: 10430

INTERSECTION: 020 Santa Rosa @ E Las Posas Page 4 (of 5)
1 3 9 C D 0Carry- Detector 332 Input Detector Green Yellow Red Load-
Row Delay over Name File Number Row Clear Change Clear Switch #0 0.0 0.0 I-1 14 A Overlap A 0.0 0.0 0.0 01 0.0 0.0 I-2U 1 B Overlap B 0.0 0.0 0.0 02 0.0 0.0 I-2L 5 C Overlap C 0.0 0.0 0.0 03 0.0 0.0 I-3U 21 D Overlap D 0.0 0.0 0.0 04 0.0 0.0 I-3L 25 Overlap Timing <F Page> <D Page>5 0.0 0.0 I-4 96 0.0 0.0 I-5 167 0.0 0.0 I-6U 3 Row Detector Numbers E8 8.0 0.0 I-6L 7 A 1 2 3 4 5 6 7 8 123456789 0.0 0.0 I-7U 23 B 9 10 11 12 -- -- -- -- 1234____A 0.0 0.0 I-7L 27 C 13 14 15 16 17 18 19 20 12345678B 0.0 0.0 I-8 11 D -- -- -- -- 21 22 23 24 ____5678C 0.0 0.0 I-9U 18 E -- -- -- -- -- -- -- -- 1234____D 0.0 0.0 I-9L 20 F -- 25 26 27 28 -- -- -- _2345___E - - - - - - - - - - - - - - -F - - - - - - - - - - - - - - -
0 <F+C+1>2 4 0 0.0 <F+C+3>
Carry- Detector 332 Input Detector Detector Advance Warning Beacon - Sign 1Row Delay over Name File Number Row Number0 0.0 0.0 J-1 13 0 0 <F+D+1>1 0.0 0.0 J-2U 2 1 System Det. # 1 0 0.0 <F+D+3>2 0.0 0.0 J-2L 6 2 System Det. # 2 0 Advance Warning Beacon - Sign 23 0.0 0.0 J-3U 22 3 System Det. # 3 04 0.0 0.0 J-3L 26 4 System Det. # 4 0 0.0 <F+0+6>5 0.0 0.0 J-4 10 5 System Det. # 5 0 0.0 <F+0+7>6 0.0 0.0 J-5 15 6 System Det. # 6 0 Power Cycle Correction (Default = 0.5)7 0.0 0.0 J-6U 4 7 System Det. # 7 08 0.0 0.0 J-6L 8 8 System Det. # 8 0 0 <D+B+0>9 0.0 0.0 J-7U 24 System Detectors <D Page> Dial-Up Telephone CommunicationsA 0.0 0.0 J-7L 28 (If set to a non-zero value, parity will be disabled)
B 0.0 0.0 J-8 12C 0.0 0.0 J-9U 17 Max ON (minutes) 5 <D+A+E>D 0.0 0.0 J-9L 19 Max OFF (minutes) 60 <D+A+F>E - - - - - - - - - - - - - - - Detector Failure MonitorF - - - - - - - - - - - - - - -
Detector Delay & Carryover <D Page>
Disable Parity
Active Detectors <D Page>
Long FailureShort Failure
Phase NumberTime Before Yellow
Phase NumberTime Before Yellow
Note: Initialized data is for alldetectors to be active (ie, allflag bits set). A Detectorwhich is "not flagged", will notbe active as a PhaseDetector, and WILL NOT callor extend its associatedphase. It will still function as aSystem Detector.
Printed on 6/3/2016 5:36 PM Timing Sheet Version: 200 SA & CA Revision: 10430

INTERSECTION: 020 Santa Rosa @ E Las Posas Page 5 (of 5)
Column Numbers ----> 1 2 3 4 5 6 7 8 Column Numbers ----> 1 2 3 4 5 6 7 8Row Phase Names ----> Phase Names ----> Row
0 0 7 0 7 0 7 0 7 Ped Walk 0 7 0 7 0 7 0 7 01 0 10 0 10 0 10 0 10 Ped FDW 0 10 0 10 0 10 0 10 12 3 7 3 7 3 7 3 7 Min Green 3 7 3 7 3 7 3 7 23 0 0 0 0 0 0 0 0 Type 3 Limit 0 0 0 0 0 0 0 0 34 0.0 1.2 0.0 1.2 0.0 1.2 0.0 1.2 Added Initial 0.0 1.2 0.0 1.2 0.0 1.2 0.0 1.2 45 0.5 3.5 0.5 3.5 0.5 3.5 0.5 3.5 Veh Extension 0.5 3.5 0.5 3.5 0.5 3.5 0.5 3.5 56 0.5 5.0 0.5 5.0 0.5 5.0 0.5 5.0 Max Gap 0.5 5.0 0.5 5.0 0.5 5.0 0.5 5.0 67 0.5 2.0 0.5 2.0 0.5 2.0 0.5 2.0 Min Gap 0.5 2.0 0.5 2.0 0.5 2.0 0.5 2.0 78 17 40 17 40 17 40 17 40 Max Limit 17 40 17 40 17 40 17 40 89 30 70 30 70 30 70 30 70 Max Limit 2 30 70 30 70 30 70 30 70 9A 0 0 0 0 0 0 0 0 - - - - - - 0 0 0 0 0 0 0 0 AB 0 0 0 0 0 0 0 0 Call To Phase 0 0 0 0 0 0 0 0 BC 0.1 0.1 0.1 0.1 0.1 0.1 0.1 0.1 Reduce By 0.1 0.1 0.1 0.1 0.1 0.1 0.1 0.1 CD 1.0 1.0 1.0 1.0 1.0 1.0 1.0 1.0 Reduce Every 1.0 1.0 1.0 1.0 1.0 1.0 1.0 1.0 DE 3.0 4.0 3.0 4.0 3.0 4.0 3.0 4.0 Yellow Change 3.0 4.0 3.0 4.0 3.0 4.0 3.0 4.0 EF 0.0 0.5 0.0 1.0 0.0 0.5 0.0 1.0 Red Clear 0.0 0.5 0.0 1.0 0.0 0.5 0.0 1.0 F
Phase Timing - Bank 2 <F Page> Phase Timing - Bank 3 <F Page>
7 8 CRow Time Dwell Vehicle Call Row
0 0 - - - - - - 01 0 0 ________ 12 0 0 ________ 23 0 0 ________ 34 0 0 ________ 45 0 0 ________ 56 0 0 ________ 67 0 0 ________ 78 0 0 ________ 89 0 0 ________ 9A - - - 0 ________ AB 0 0 ________ BC 0 0 ________ CD 0 0 ________ DE 0 0 ________ EF 0 0 ________ F
Special Event Schedule <C Page with F+9+F=22>
<--- Limited Service Interval
(Set Dwell = 255)
- - - - - - - - - - - -
________________________
________________
BForce Off
________
________
________________________________
Reduce ByReduce EveryYellow ChangeRed Clear
Delay Only --->
Limited Service Int. --->
Max GapMin GapMax LimitMax Limit 2 - - - - - -Call To Phase
Ped WalkPed FDWMin GreenType 3 LimitAdded InitialVeh Extension
________________________________
________________________
FOutput
________________________________________
________
________________
________________________________
________
________________________
________
________
________________________________
________________________________
________________
- - -________________________________________________________
________________
________________________
________________________________
________________
________________
________________________________________________
________
________________________________
________________________
________
________
- - -________________________
________________
________________________
Phase Phase
9Hold
AAdvance
DPermit Phases
EPed Omit
Printed on 6/3/2016 5:36 PM Timing Sheet Version: 200 SA & CA Revision: 10430

INTERSECTION: 034 Santa Rosa Rd@Vista Arroyo Page 1 (of 5)Group Assignment: NONE N/S Street Name: Vista Arroyo/Andalusia Last Database Change:
Field Master Assignment: FM2 Santa Rosa Road E/W Street Name: Santa Rosa RoadSystem Reference Number: 34
Notes:Change By Date By Date
Drop Number 6 <C+0+0>Zone Number <C+0+1>Area Number 4 <C+0+2> Max Initial 20 <F+0+E>Area Address 6 <C+0+3> <C+A+1> Red Revert 5.0 <F+0+F>QuicNet Channel (QuicNet) <C+B+1> All Red Start 6.0 <F+C+0>Communication Addresses Manual Selection Start / Revert Times
Column Numbers ----> 1 2 3 4 5 6 7 8 ERow Phase Names ----> Row
0 Ped Walk 0 0 0 7 0 7 0 0 RR-1 Delay 0 Permit 01 Ped FDW 0 0 0 19 0 23 0 0 RR-1 Clear 10 Red Lock 12 Min Green 9 10 3 8 9 10 3 8 EV-A Delay 0 Yellow Lock 23 Type 3 Limit 0 0 0 0 0 0 0 0 EV-A Clear 1 Min Recall 34 Added Initial 0.0 2.0 0.0 0.0 0.0 2.0 0.0 0.0 EV-B Delay 0 Ped Recall 45 Veh Extension 3.0 5.0 0.5 3.0 3.0 5.0 0.5 3.0 EV-B Clear 1 View Set Peds 56 Max Gap 3.0 6.0 0.5 3.0 3.0 6.0 0.5 3.0 EV-C Delay 0 Rest In Walk 67 Min Gap 3.0 3.0 0.5 3.0 3.0 3.0 0.5 3.0 EV-C Clear 1 Red Rest 78 Max Limit 15 30 0 15 15 30 0 15 EV-D Delay 0 Dual Entry 89 Max Limit 2 30 70 30 70 30 70 30 70 EV-D Clear 1 Max Recall 9A - - - - - - 0 0 0 0 0 0 0 0 RR-2 Delay 0 Soft Recall AB Call To Phase 0 0 0 0 0 0 0 0 RR-2 Clear 10 Max 2 BC Reduce By 0.1 0.1 0.1 0.1 0.1 0.1 0.1 0.1 View EV Delay - - - Cond. Service CD Reduce Every 1.0 1.0 1.0 1.0 1.0 1.0 1.0 1.0 View EV Clear - - - Man Cntrl Calls DE Yellow Change 3.6 5.0 3.0 3.6 3.6 5.0 3.0 3.6 View RR Delay - - - Yellow Start EF Red Clear 1.0 2.0 0.0 1.0 1.0 2.0 0.0 1.0 View RR Clear - - - First Phases F
Phase Timing - Bank 1 <F Page> Preempt Timing Phase Functions <F Page>
12/7/2015 13:15
4/8/16: New coordination timing
________________
12_456_8
Manual Offset 0 = Automatic 1 = Offset A 2 = Offset B 3 = Offset C
________
________ - - - - -
Manual Plan 0 = Automatic1-9 = Plan 1-9 14 = Free 15 = Flash
________________
Change Record
FPhase
Manual PlanManual Offset0
Change
_________________2___6__
_2_4_6_8_________2___6__________________
Printed on 6/3/2016 5:40 PM Timing Sheet Version: 200 SA & CA Revision: 10430

INTERSECTION: 034 Santa Rosa Rd@Vista Arroyo Page 2 (of 5)
Column Numbers ----> 1 2 3 4 5 6 7 8 9Row Plan Name ----> Row E Row
0 Cycle Length 120 120 0 0 0 0 0 0 0 0 01 Phase 1 - ForceOff 48 50 0 0 0 0 0 0 0 1 Plan 1 - Sync _2___6__ 12 Phase 2 - ForceOff 0 0 0 0 0 0 0 0 0 2 Plan 2 - Sync _2___6__ 23 Phase 3 - ForceOff 0 0 0 0 0 0 0 0 0 3 Plan 3 - Sync _2___6__ 34 Phase 4 - ForceOff 33 33 0 0 0 0 0 0 0 4 Plan 4 - Sync _2___6__ 45 Phase 5 - ForceOff 48 50 0 0 0 0 0 0 0 5 Plan 5 - Sync _2___6__ 56 Phase 6 - ForceOff 0 0 0 0 0 0 0 0 0 6 Plan 6 - Sync _2___6__ 67 Phase 7 - ForceOff 0 0 0 0 0 0 0 0 0 7 Plan 7 - Sync _2___6__ 78 Phase 8 - ForceOff 33 33 0 0 0 0 0 0 0 8 Plan 8 - Sync _2___6__ 89 Ring Offset 0 0 0 0 0 0 0 0 0 9 Plan 9 - Sync _2___6__ 9A Offset 1 14 25 0 0 0 0 0 0 0 A Coord Ped * ________ AB Offset 2 0 0 0 0 0 0 0 0 0 B NEMA Hold ________ BC Offset 3 0 0 0 0 0 0 0 0 0 C CD Permissive 3 3 0 0 0 0 0 0 0 D DE Hold Release 255 255 255 255 255 255 255 255 255 E EF Zone Offset 0 0 0 0 0 0 0 0 0 F F
Coordination <C Page> Sync Phases <C Page>
Row Column Numbers ----> E F F Row
0 Exclusive Phases ________ Coord Force-Off Adjust Free Lag _2_4_6_8 01 RR-1 Clear Phases ________ RR Overlap A - Phases ________ for Ped Service <C+D+F> Plan 1 - Lag _2_4_6_8 12 RR-2 Clear Phases ________ RR Overlap B - Phases ________ Plan 2 - Lag _2_4_6_8 23 RR-2 Limited Service ________ RR Overlap C - Phases ________ Plan 3 - Lag _2_4_6_8 34 Prot / Perm Phases ________ RR Overlap D - Phases ________ TBC Transition <C+D+D> Plan 4 - Lag _2_4_6_8 45 Overlap A - Green Omit ________ Ped 2P ________ Plan 5 - Lag _2_4_6_8 56 Overlap B - Green Omit ________ Ped 6P _____6__ Plan 6 - Lag _2_4_6_8 67 Overlap C - Green Omit ________ Ped 4P ___4____ Plan 7 - Lag _2_4_6_8 78 Overlap D - Green Omit ________ Ped 8P ________ Plan 8 - Lag _2_4_6_8 89 Overlap Yellow Flash ________ Yellow Flash Phases ________ Plan 9 - Lag _2_4_6_8 9A EV-A Phases ________ Overlap A - Phases ________ Coord Max * ________ AB EV-B Phases ________ Overlap B - Phases ________ Coord Lag * ________ BC EV-C Phases ________ Overlap C - Phases ________ CD EV-D Phases ________ Overlap D - Phases ________ DE Extra 1 Config. Bits 1_______ Restricted Phases ________ EF IC Select (Interconnect) _2______ Assign 5 Outputs ________ F
Configuration <E Page> Configuration <E Page> Lag Phases <C Page>
(* = Coordination Recall)Plan
Extra 1 Flags 1 = TBC Type 1 2 = NEMA Ext. Coord 3 = Auto Daylight Savings 4 = EV Advance 5 = 6 = Special Event 7 = Pretimed Operation 8 = Split Ring Operation
Assign 5 Outputs (Ped Loadswitch Yellows) 1 = Right Turn Overlap 2 = TOD Outputs 3 = EV Beacon - Steady 4 = EV Beacon - Flashing 5 = Special Event Outputs 6 = Phase 3 & 7 Ped 7 = Advanced Warning Sign 8 =
IC Select Flags1 =2 = Modem3 = 7-Wire Slave4 = Flash / Free5 =6 = Simplex Master7 = 7-Wire Master8 = Offset Interrupter
Transition Type
Force-Off Adjust
0
5
Transition Type 0 = Shortway Non-zero = Lengthen
Printed on 6/3/2016 5:40 PM Timing Sheet Version: 200 SA & CA Revision: 10430

INTERSECTION: 034 Santa Rosa Rd@Vista Arroyo Page 3 (of 5)
Column FRow Time Day of Week Time Day of Week Phases/Bits Time Day of Week Time Day of Week Time Day of Week Row
0 06 :30 1 A _23456_ 00 :00 0 _______ ________ 00 :00 0 0 _______ 00 :00 0 0 _______ 00 :00 0 0 _______ 01 09 :30 E A _23456_ 00 :00 0 _______ ________ 00 :00 0 0 _______ 00 :00 0 0 _______ 00 :00 0 0 _______ 12 14 :30 2 A _23456_ 00 :00 0 _______ ________ 00 :00 0 0 _______ 00 :00 0 0 _______ 00 :00 0 0 _______ 23 18 :30 E A _23456_ 00 :00 0 _______ ________ 00 :00 0 0 _______ 00 :00 0 0 _______ 00 :00 0 0 _______ 34 00 :00 0 0 _______ 00 :00 0 _______ ________ 00 :00 0 0 _______ 00 :00 0 0 _______ 00 :00 0 0 _______ 45 00 :00 0 0 _______ 00 :00 0 _______ ________ 00 :00 0 0 _______ 00 :00 0 0 _______ 00 :00 0 0 _______ 56 00 :00 0 0 _______ 00 :00 0 _______ ________ 00 :00 0 0 _______ 00 :00 0 0 _______ 00 :00 0 0 _______ 67 00 :00 0 0 _______ 00 :00 0 _______ ________ 00 :00 0 0 _______ 00 :00 0 0 _______ 00 :00 0 0 _______ 78 00 :00 0 0 _______ 00 :00 0 _______ ________ 00 :00 0 0 _______ 00 :00 0 0 _______ 00 :00 0 0 _______ 89 00 :00 0 0 _______ 00 :00 0 _______ ________ 00 :00 0 0 _______ 00 :00 0 0 _______ 00 :00 0 0 _______ 9A 00 :00 0 0 _______ 00 :00 0 _______ ________ 00 :00 0 0 _______ 00 :00 0 0 _______ 00 :00 0 0 _______ AB 00 :00 0 0 _______ 00 :00 0 _______ ________ 00 :00 0 0 _______ 00 :00 0 0 _______ 00 :00 0 0 _______ BC 00 :00 0 0 _______ 00 :00 0 _______ ________ 00 :00 0 0 _______ 00 :00 0 0 _______ 00 :00 0 0 _______ CD 00 :00 0 0 _______ 00 :00 0 _______ ________ 00 :00 0 0 _______ 00 :00 0 0 _______ 00 :00 0 0 _______ DE 00 :00 0 0 _______ 00 :00 0 _______ ________ 00 :00 0 0 _______ 00 :00 0 0 _______ 00 :00 0 0 _______ EF 00 :00 0 0 _______ 00 :00 0 _______ ________ 00 :00 0 0 _______ 00 :00 0 0 _______ 00 :00 0 0 _______ F
<D Page>
RowDay of Week
A 0 0 _______B 0 0 _______C 0 0 _______
Holiday Dates<8 Key>
Mon
th
Yea
r
Day
000Holiday # 3 Date
Holiday # 2 DateHoliday # 1 Date
TOD Coordination
Month Select1 = January2 = February3 = March4 = April5 = May6 = June7 = July8 = August9 = SeptemberA = OctoberB = NovemberC = December
Pla
n
Holiday # 1TOD Coordination
<9 Key with C+D+9=1> <9 Key with C+D+9=2> <9 Key with C+D+9=3>TOD Coordination
Holiday # 3Holiday # 2
Offs
et
Pla
n
Offs
et
Pla
n
Offs
et
<9 Key with C+D+9=0> <7 Key>
Plan Select1 thru 9 = Coordination Plan 1 thru 914 or E = Free15 or F = Flash
Offset SelectA = Offset AB = Offset BC = Offset C
Pla
n
Offs
et
Func
t.
T.O.D. Functions0 = Permitted Phases1 = Red Lock2 = Yellow Lock3 = Veh Min Recall4 = Ped Recall5 =6 = Rest In Walk7 = Red Rest8 = Double Entry9 = Veh Max RecallA = Veh Soft RecallB = Maximum 2C = Conditional ServiceD = Free Lag PhasesE = Bit 1 - Local Override Bit 2 - Phase Bank 2 Bit 3 - Phase Bank 3 Bit 4 - Disable Detector OFF Monitor Bit 7 - Detector Count Monitor Bit 8 - Real Time Split MonitorF = Output Bits 1 thru 4
TOD Coordination TOD Function
Printed on 6/3/2016 5:40 PM Timing Sheet Version: 200 SA & CA Revision: 10430

INTERSECTION: 034 Santa Rosa Rd@Vista Arroyo Page 4 (of 5)
1 3 9 C D 0Carry- Detector 332 Input Detector Green Yellow Red Load-
Row Delay over Name File Number Row Clear Change Clear Switch #0 0.0 0.0 I-1 14 A Overlap A 0.0 0.0 0.0 01 0.0 0.0 I-2U 1 B Overlap B 0.0 0.0 0.0 02 0.0 0.0 I-2L 5 C Overlap C 0.0 0.0 0.0 03 0.0 0.0 I-3U 21 D Overlap D 0.0 0.0 0.0 04 0.0 0.0 I-3L 25 Overlap Timing <F Page> <D Page>5 0.0 0.0 I-4 96 0.0 0.0 I-5 167 0.0 0.0 I-6U 3 Row Detector Numbers E8 8.0 0.0 I-6L 7 A 1 2 3 4 5 6 7 8 123456789 0.0 0.0 I-7U 23 B 9 10 11 12 -- -- -- -- 1234____A 0.0 0.0 I-7L 27 C 13 14 15 16 17 18 19 20 12345678B 0.0 0.0 I-8 11 D -- -- -- -- 21 22 23 24 ____5678C 0.0 0.0 I-9U 18 E -- -- -- -- -- -- -- -- 1234____D 0.0 0.0 I-9L 20 F -- 25 26 27 28 -- -- -- _2345___E - - - - - - - - - - - - - - -F - - - - - - - - - - - - - - -
0 <F+C+1>2 4 0 0.0 <F+C+3>
Carry- Detector 332 Input Detector Detector Advance Warning Beacon - Sign 1Row Delay over Name File Number Row Number0 0.0 0.0 J-1 13 0 0 <F+D+1>1 0.0 0.0 J-2U 2 1 System Det. # 1 0 0.0 <F+D+3>2 0.0 0.0 J-2L 6 2 System Det. # 2 0 Advance Warning Beacon - Sign 23 0.0 0.0 J-3U 22 3 System Det. # 3 04 0.0 0.0 J-3L 26 4 System Det. # 4 0 0.0 <F+0+6>5 0.0 0.0 J-4 10 5 System Det. # 5 0 0.0 <F+0+7>6 0.0 0.0 J-5 15 6 System Det. # 6 0 Power Cycle Correction (Default = 0.5)7 0.0 0.0 J-6U 4 7 System Det. # 7 08 8.0 0.0 J-6L 8 8 System Det. # 8 0 0 <D+B+0>9 0.0 0.0 J-7U 24 System Detectors <D Page> Dial-Up Telephone CommunicationsA 0.0 0.0 J-7L 28 (If set to a non-zero value, parity will be disabled)
B 0.0 0.0 J-8 12C 0.0 0.0 J-9U 17 Max ON (minutes) 5 <D+A+E>D 0.0 0.0 J-9L 19 Max OFF (minutes) 60 <D+A+F>E - - - - - - - - - - - - - - - Detector Failure MonitorF - - - - - - - - - - - - - - -
Detector Delay & Carryover <D Page>
Disable Parity
Active Detectors <D Page>
Long FailureShort Failure
Phase NumberTime Before Yellow
Phase NumberTime Before Yellow
Note: Initialized data is for alldetectors to be active (ie, allflag bits set). A Detectorwhich is "not flagged", will notbe active as a PhaseDetector, and WILL NOT callor extend its associatedphase. It will still function as aSystem Detector.
Printed on 6/3/2016 5:40 PM Timing Sheet Version: 200 SA & CA Revision: 10430

INTERSECTION: 034 Santa Rosa Rd@Vista Arroyo Page 5 (of 5)
Column Numbers ----> 1 2 3 4 5 6 7 8 Column Numbers ----> 1 2 3 4 5 6 7 8Row Phase Names ----> Phase Names ----> Row
0 0 7 0 7 0 7 0 7 Ped Walk 0 7 0 7 0 7 0 7 01 0 10 0 10 0 10 0 10 Ped FDW 0 10 0 10 0 10 0 10 12 3 7 3 7 3 7 3 7 Min Green 3 7 3 7 3 7 3 7 23 0 0 0 0 0 0 0 0 Type 3 Limit 0 0 0 0 0 0 0 0 34 0.0 1.2 0.0 1.2 0.0 1.2 0.0 1.2 Added Initial 0.0 1.2 0.0 1.2 0.0 1.2 0.0 1.2 45 0.5 3.5 0.5 3.5 0.5 3.5 0.5 3.5 Veh Extension 0.5 3.5 0.5 3.5 0.5 3.5 0.5 3.5 56 0.5 5.0 0.5 5.0 0.5 5.0 0.5 5.0 Max Gap 0.5 5.0 0.5 5.0 0.5 5.0 0.5 5.0 67 0.5 2.0 0.5 2.0 0.5 2.0 0.5 2.0 Min Gap 0.5 2.0 0.5 2.0 0.5 2.0 0.5 2.0 78 17 40 17 40 17 40 17 40 Max Limit 17 40 17 40 17 40 17 40 89 30 70 30 70 30 70 30 70 Max Limit 2 30 70 30 70 30 70 30 70 9A 0 0 0 0 0 0 0 0 - - - - - - 0 0 0 0 0 0 0 0 AB 0 0 0 0 0 0 0 0 Call To Phase 0 0 0 0 0 0 0 0 BC 0.1 0.1 0.1 0.1 0.1 0.1 0.1 0.1 Reduce By 0.1 0.1 0.1 0.1 0.1 0.1 0.1 0.1 CD 1.0 1.0 1.0 1.0 1.0 1.0 1.0 1.0 Reduce Every 1.0 1.0 1.0 1.0 1.0 1.0 1.0 1.0 DE 3.0 4.0 3.0 4.0 3.0 4.0 3.0 4.0 Yellow Change 3.0 4.0 3.0 4.0 3.0 4.0 3.0 4.0 EF 0.0 0.5 0.0 1.0 0.0 0.5 0.0 1.0 Red Clear 0.0 0.5 0.0 1.0 0.0 0.5 0.0 1.0 F
Phase Timing - Bank 2 <F Page> Phase Timing - Bank 3 <F Page>
7 8 CRow Time Dwell Vehicle Call Row
0 0 - - - - - - 01 0 0 ________ 12 0 0 ________ 23 0 0 ________ 34 0 0 ________ 45 0 0 ________ 56 0 0 ________ 67 0 0 ________ 78 0 0 ________ 89 0 0 ________ 9A - - - 0 ________ AB 0 0 ________ BC 0 0 ________ CD 0 0 ________ DE 0 0 ________ EF 0 0 ________ F
Special Event Schedule <C Page with F+9+F=22>
Phase Phase
9Hold
AAdvance
DPermit Phases
EPed Omit
- - -________________________
________________
________________________
________
________________________________
________________________
________
________ ________________
________________
________________________________________________
________________
________________________
________________________________
________________
- - -________________________________________________________
________________________
________________________________
________________________
________
________
________________
________________________________
________________
FOutput
________________________________________
________
________
________________________________
________________
Ped WalkPed FDWMin GreenType 3 LimitAdded InitialVeh ExtensionMax GapMin GapMax LimitMax Limit 2 - - - - - -Call To PhaseReduce ByReduce EveryYellow ChangeRed Clear
Delay Only --->
Limited Service Int. --->
BForce Off
________
________
________________________________
<--- Limited Service Interval
(Set Dwell = 255)
- - - - - - - - - - - -
________________________
________________
Printed on 6/3/2016 5:40 PM Timing Sheet Version: 200 SA & CA Revision: 10430

INTERSECTION: 019 Santa Rosa Rd @ Vista Grande Page 1 (of 5)Group Assignment: NONE N/S Street Name: Santa Rosa Road Last Database Change:
Field Master Assignment: FM2 Santa Rosa Road E/W Street Name: Vista Grande/SchoolSystem Reference Number: 15
Notes:Change By Date By Date
Drop Number 7 <C+0+0>Zone Number <C+0+1>Area Number 4 <C+0+2> Max Initial 20 <F+0+E>Area Address 7 <C+0+3> <C+A+1> Red Revert 5.0 <F+0+F>QuicNet Channel (QuicNet) <C+B+1> All Red Start 6.0 <F+C+0>Communication Addresses Manual Selection Start / Revert Times
Column Numbers ----> 1 2 3 4 5 6 7 8 ERow Phase Names ----> Row
0 Ped Walk 0 0 0 7 0 7 0 0 RR-1 Delay 0 Permit 01 Ped FDW 0 0 0 20 0 15 0 0 RR-1 Clear 10 Red Lock 12 Min Green 0 10 10 9 0 10 0 0 EV-A Delay 0 Yellow Lock 23 Type 3 Limit 0 0 0 0 0 0 0 0 EV-A Clear 1 Min Recall 34 Added Initial 0.0 2.0 0.0 0.0 0.0 2.0 0.0 0.0 EV-B Delay 0 Ped Recall 45 Veh Extension 0.0 5.0 3.0 3.0 0.0 5.0 0.0 0.0 EV-B Clear 1 View Set Peds 56 Max Gap 0.0 6.0 5.0 3.0 0.0 6.0 0.0 0.0 EV-C Delay 0 Rest In Walk 67 Min Gap 0.0 3.0 3.0 3.0 0.0 3.0 0.0 0.0 EV-C Clear 1 Red Rest 78 Max Limit 0 30 20 20 0 30 0 0 EV-D Delay 0 Dual Entry 89 Max Limit 2 0 50 60 20 0 50 0 0 EV-D Clear 1 Max Recall 9A - - - - - - 0 0 0 0 0 0 0 0 RR-2 Delay 0 Soft Recall AB Call To Phase 0 0 0 0 0 0 0 0 RR-2 Clear 10 Max 2 BC Reduce By 0.0 0.1 0.0 0.0 0.0 0.1 0.0 0.0 View EV Delay - - - Cond. Service CD Reduce Every 0.0 1.0 0.0 0.0 0.0 1.0 0.0 0.0 View EV Clear - - - Man Cntrl Calls DE Yellow Change 0.0 5.0 3.6 3.6 0.0 5.0 0.0 0.0 View RR Delay - - - Yellow Start EF Red Clear 0.0 2.0 1.0 1.0 0.0 2.0 0.0 0.0 View RR Clear - - - First Phases F
Phase Timing - Bank 1 <F Page> Preempt Timing Phase Functions <F Page>
_________________2___6__
_2___6___________2___6__________________
Change Record
FPhase
Manual PlanManual Offset0
Change
4/8/16: Updated coordination timings and implemented Max 2 during school start
________
4/8/16: Increased max gap for Ph 36/13/16: Local Override
________ - - - - -
Manual Plan 0 = Automatic1-9 = Plan 1-9 14 = Free 15 = Flash
________________
2/1/2016 12:49
6/2/15: Changed Phase 2 & 6 Min Green from 4 to 10 sec
________________
_234_6__
Manual Offset 0 = Automatic 1 = Offset A 2 = Offset B 3 = Offset C
8/26/15: Changed to run free at 7:45 AM.10/22/15: Changed ti run Plan 1A till 8:15
Printed on 6/13/2016 4:05 PM Timing Sheet Version: 200 SA & CA Revision: 10430

INTERSECTION: 019 Santa Rosa Rd @ Vista Grande Page 2 (of 5)
Column Numbers ----> 1 2 3 4 5 6 7 8 9Row Plan Name ----> Row E Row
0 Cycle Length 120 120 0 0 0 0 0 0 0 0 01 Phase 1 - ForceOff 0 0 0 0 0 0 0 0 0 1 Plan 1 - Sync _2___6__ 12 Phase 2 - ForceOff 0 0 0 0 0 0 0 0 0 2 Plan 2 - Sync _2___6__ 23 Phase 3 - ForceOff 69 62 0 0 0 0 0 0 0 3 Plan 3 - Sync _2___6__ 34 Phase 4 - ForceOff 34 34 0 0 0 0 0 0 0 4 Plan 4 - Sync _2___6__ 45 Phase 5 - ForceOff 0 0 0 0 0 0 0 0 0 5 Plan 5 - Sync _2___6__ 56 Phase 6 - ForceOff 0 0 0 0 0 0 0 0 0 6 Plan 6 - Sync _2___6__ 67 Phase 7 - ForceOff 0 0 0 0 0 0 0 0 0 7 Plan 7 - Sync _2___6__ 78 Phase 8 - ForceOff 0 0 0 0 0 0 0 0 0 8 Plan 8 - Sync _2___6__ 89 Ring Offset 0 0 0 0 0 0 0 0 0 9 Plan 9 - Sync _2___6__ 9A Offset 1 59 98 0 0 0 0 0 0 0 A Coord Ped * ________ AB Offset 2 0 0 0 0 0 0 0 0 0 B NEMA Hold ________ BC Offset 3 0 0 0 0 0 0 0 0 0 C CD Permissive 3 3 0 0 0 0 0 0 0 D DE Hold Release 255 255 0 0 0 0 0 0 0 E EF Zone Offset 0 0 0 0 0 0 0 0 0 F F
Coordination <C Page> Sync Phases <C Page>
Row Column Numbers ----> E F F Row
0 Exclusive Phases ________ Coord Force-Off Adjust Free Lag _23__6__ 01 RR-1 Clear Phases ________ RR Overlap A - Phases ________ for Ped Service <C+D+F> Plan 1 - Lag _23__6__ 12 RR-2 Clear Phases ________ RR Overlap B - Phases ________ Plan 2 - Lag _23__6__ 23 RR-2 Limited Service ________ RR Overlap C - Phases ________ Plan 3 - Lag _23__6__ 34 Prot / Perm Phases ________ RR Overlap D - Phases ________ TBC Transition <C+D+D> Plan 4 - Lag _23__6__ 45 Overlap A - Green Omit ________ Ped 2P ________ Plan 5 - Lag _23__6__ 56 Overlap B - Green Omit ________ Ped 6P _____6__ Plan 6 - Lag _23__6__ 67 Overlap C - Green Omit ________ Ped 4P ___4____ Plan 7 - Lag _23__6__ 78 Overlap D - Green Omit ________ Ped 8P ________ Plan 8 - Lag _23__6__ 89 Overlap Yellow Flash ________ Yellow Flash Phases ________ Plan 9 - Lag _23__6__ 9A EV-A Phases ________ Overlap A - Phases ________ Coord Max * ________ AB EV-B Phases ________ Overlap B - Phases ________ Coord Lag * ________ BC EV-C Phases ________ Overlap C - Phases ________ CD EV-D Phases ________ Overlap D - Phases ________ DE Extra 1 Config. Bits 1_______ Restricted Phases __34____ EF IC Select (Interconnect) _2______ Assign 5 Outputs ________ F
Configuration <E Page> Configuration <E Page> Lag Phases <C Page>
(* = Coordination Recall)Plan
Extra 1 Flags 1 = TBC Type 1 2 = NEMA Ext. Coord 3 = Auto Daylight Savings 4 = EV Advance 5 = 6 = Special Event 7 = Pretimed Operation 8 = Split Ring Operation
Assign 5 Outputs (Ped Loadswitch Yellows) 1 = Right Turn Overlap 2 = TOD Outputs 3 = EV Beacon - Steady 4 = EV Beacon - Flashing 5 = Special Event Outputs 6 = Phase 3 & 7 Ped 7 = Advanced Warning Sign 8 =
IC Select Flags1 =2 = Modem3 = 7-Wire Slave4 = Flash / Free5 =6 = Simplex Master7 = 7-Wire Master8 = Offset Interrupter
Transition Type
Force-Off Adjust
0
5
Transition Type 0 = Shortway Non-zero = Lengthen
Printed on 6/13/2016 4:05 PM Timing Sheet Version: 200 SA & CA Revision: 10430

INTERSECTION: 019 Santa Rosa Rd @ Vista Grande Page 3 (of 5)
Column FRow Time Day of Week Time Day of Week Phases/Bits Time Day of Week Time Day of Week Time Day of Week Row
0 06 :30 1 A _23456_ 07 :45 B _23456_ 12345678 00 :00 0 0 _______ 00 :00 0 0 _______ 00 :00 0 0 _______ 01 07 :45 E A _23456_ 08 :05 B _23456_ ________ 00 :00 0 0 _______ 00 :00 0 0 _______ 00 :00 0 0 _______ 12 08 :05 1 A _23456_ 00 :01 E 1234567 1_______ 00 :00 0 0 _______ 00 :00 0 0 _______ 00 :00 0 0 _______ 23 09 :30 E A _23456_ 00 :00 0 _______ ________ 00 :00 0 0 _______ 00 :00 0 0 _______ 00 :00 0 0 _______ 34 14 :30 2 A _23456_ 00 :00 0 _______ ________ 00 :00 0 0 _______ 00 :00 0 0 _______ 00 :00 0 0 _______ 45 18 :30 E A _23456_ 00 :00 0 _______ ________ 00 :00 0 0 _______ 00 :00 0 0 _______ 00 :00 0 0 _______ 56 00 :00 0 0 _______ 00 :00 0 _______ ________ 00 :00 0 0 _______ 00 :00 0 0 _______ 00 :00 0 0 _______ 67 00 :00 0 0 _______ 00 :00 0 _______ ________ 00 :00 0 0 _______ 00 :00 0 0 _______ 00 :00 0 0 _______ 78 00 :00 0 0 _______ 00 :00 0 _______ ________ 00 :00 0 0 _______ 00 :00 0 0 _______ 00 :00 0 0 _______ 89 00 :00 0 0 _______ 00 :00 0 _______ ________ 00 :00 0 0 _______ 00 :00 0 0 _______ 00 :00 0 0 _______ 9A 00 :00 0 0 _______ 00 :00 0 _______ ________ 00 :00 0 0 _______ 00 :00 0 0 _______ 00 :00 0 0 _______ AB 00 :00 0 0 _______ 00 :00 0 _______ ________ 00 :00 0 0 _______ 00 :00 0 0 _______ 00 :00 0 0 _______ BC 00 :00 0 0 _______ 00 :00 0 _______ ________ 00 :00 0 0 _______ 00 :00 0 0 _______ 00 :00 0 0 _______ CD 00 :00 0 0 _______ 00 :00 0 _______ ________ 00 :00 0 0 _______ 00 :00 0 0 _______ 00 :00 0 0 _______ DE 00 :00 0 0 _______ 00 :00 0 _______ ________ 00 :00 0 0 _______ 00 :00 0 0 _______ 00 :00 0 0 _______ EF 00 :00 0 0 _______ 00 :00 0 _______ ________ 00 :00 0 0 _______ 00 :00 0 0 _______ 00 :00 0 0 _______ F
<D Page>
RowDay of Week
A 0 0 _______B 0 0 _______C 0 0 _______
<9 Key with C+D+9=0> <7 Key>
Plan Select1 thru 9 = Coordination Plan 1 thru 914 or E = Free15 or F = Flash
Offset SelectA = Offset AB = Offset BC = Offset C
Pla
n
Offs
et
Func
t.
T.O.D. Functions0 = Permitted Phases1 = Red Lock2 = Yellow Lock3 = Veh Min Recall4 = Ped Recall5 =6 = Rest In Walk7 = Red Rest8 = Double Entry9 = Veh Max RecallA = Veh Soft RecallB = Maximum 2C = Conditional ServiceD = Free Lag PhasesE = Bit 1 - Local Override Bit 2 - Phase Bank 2 Bit 3 - Phase Bank 3 Bit 4 - Disable Detector OFF Monitor Bit 7 - Detector Count Monitor Bit 8 - Real Time Split MonitorF = Output Bits 1 thru 4
TOD Coordination TOD Function Holiday # 3Holiday # 2
Offs
et
Pla
n
Offs
et
Pla
n
Offs
et
Holiday # 1 Date
TOD Coordination
Month Select1 = January2 = February3 = March4 = April5 = May6 = June7 = July8 = August9 = SeptemberA = OctoberB = NovemberC = December
Pla
n
Holiday # 1TOD Coordination
<9 Key with C+D+9=1> <9 Key with C+D+9=2> <9 Key with C+D+9=3>TOD Coordination
Holiday Dates<8 Key>
Mon
th
Yea
r
Day
000Holiday # 3 Date
Holiday # 2 Date
Printed on 6/13/2016 4:05 PM Timing Sheet Version: 200 SA & CA Revision: 10430

INTERSECTION: 019 Santa Rosa Rd @ Vista Grande Page 4 (of 5)
1 3 9 C D 0Carry- Detector 332 Input Detector Green Yellow Red Load-
Row Delay over Name File Number Row Clear Change Clear Switch #0 0.0 0.0 I-1 14 A Overlap A 0.0 0.0 0.0 01 0.0 0.0 I-2U 1 B Overlap B 0.0 0.0 0.0 02 0.0 0.0 I-2L 5 C Overlap C 0.0 0.0 0.0 03 0.0 0.0 I-3U 21 D Overlap D 0.0 0.0 0.0 04 0.0 0.0 I-3L 25 Overlap Timing <F Page> <D Page>5 0.0 0.0 I-4 96 0.0 0.0 I-5 167 0.0 0.0 I-6U 3 Row Detector Numbers E8 8.0 0.0 I-6L 7 A 1 2 3 4 5 6 7 8 123456789 0.0 0.0 I-7U 23 B 9 10 11 12 -- -- -- -- 1234____A 0.0 0.0 I-7L 27 C 13 14 15 16 17 18 19 20 12345678B 0.0 0.0 I-8 11 D -- -- -- -- 21 22 23 24 ____5678C 0.0 0.0 I-9U 18 E -- -- -- -- -- -- -- -- 1234____D 0.0 0.0 I-9L 20 F -- 25 26 27 28 -- -- -- _2345___E - - - - - - - - - - - - - - -F - - - - - - - - - - - - - - -
0 <F+C+1>2 4 0 0.0 <F+C+3>
Carry- Detector 332 Input Detector Detector Advance Warning Beacon - Sign 1Row Delay over Name File Number Row Number0 0.0 0.0 J-1 13 0 0 <F+D+1>1 0.0 0.0 J-2U 2 1 System Det. # 1 0 0.0 <F+D+3>2 0.0 0.0 J-2L 6 2 System Det. # 2 0 Advance Warning Beacon - Sign 23 0.0 0.0 J-3U 22 3 System Det. # 3 04 0.0 0.0 J-3L 26 4 System Det. # 4 0 0.0 <F+0+6>5 0.0 0.0 J-4 10 5 System Det. # 5 0 0.0 <F+0+7>6 0.0 0.0 J-5 15 6 System Det. # 6 0 Power Cycle Correction (Default = 0.5)7 0.0 0.0 J-6U 4 7 System Det. # 7 08 0.0 0.0 J-6L 8 8 System Det. # 8 0 0 <D+B+0>9 0.0 0.0 J-7U 24 System Detectors <D Page> Dial-Up Telephone CommunicationsA 0.0 0.0 J-7L 28 (If set to a non-zero value, parity will be disabled)
B 0.0 0.0 J-8 12C 0.0 0.0 J-9U 17 Max ON (minutes) 5 <D+A+E>D 0.0 0.0 J-9L 19 Max OFF (minutes) 60 <D+A+F>E - - - - - - - - - - - - - - - Detector Failure MonitorF - - - - - - - - - - - - - - -
Detector Delay & Carryover <D Page>
Disable Parity
Active Detectors <D Page>
Long FailureShort Failure
Phase NumberTime Before Yellow
Phase NumberTime Before Yellow
Note: Initialized data is for alldetectors to be active (ie, allflag bits set). A Detectorwhich is "not flagged", will notbe active as a PhaseDetector, and WILL NOT callor extend its associatedphase. It will still function as aSystem Detector.
Printed on 6/13/2016 4:05 PM Timing Sheet Version: 200 SA & CA Revision: 10430

INTERSECTION: 019 Santa Rosa Rd @ Vista Grande Page 5 (of 5)
Column Numbers ----> 1 2 3 4 5 6 7 8 Column Numbers ----> 1 2 3 4 5 6 7 8Row Phase Names ----> Phase Names ----> Row
0 0 7 0 7 0 7 0 7 Ped Walk 0 7 0 7 0 7 0 7 01 0 10 0 10 0 10 0 10 Ped FDW 0 10 0 10 0 10 0 10 12 3 7 3 7 3 7 3 7 Min Green 3 7 3 7 3 7 3 7 23 0 0 0 0 0 0 0 0 Type 3 Limit 0 0 0 0 0 0 0 0 34 0.0 1.2 0.0 1.2 0.0 1.2 0.0 1.2 Added Initial 0.0 1.2 0.0 1.2 0.0 1.2 0.0 1.2 45 0.5 3.5 0.5 3.5 0.5 3.5 0.5 3.5 Veh Extension 0.5 3.5 0.5 3.5 0.5 3.5 0.5 3.5 56 0.5 5.0 0.5 5.0 0.5 5.0 0.5 5.0 Max Gap 0.5 5.0 0.5 5.0 0.5 5.0 0.5 5.0 67 0.5 2.0 0.5 2.0 0.5 2.0 0.5 2.0 Min Gap 0.5 2.0 0.5 2.0 0.5 2.0 0.5 2.0 78 17 40 17 40 17 40 17 40 Max Limit 17 40 17 40 17 40 17 40 89 30 70 30 70 30 70 30 70 Max Limit 2 30 70 30 70 30 70 30 70 9A 0 0 0 0 0 0 0 0 - - - - - - 0 0 0 0 0 0 0 0 AB 0 0 0 0 0 0 0 0 Call To Phase 0 0 0 0 0 0 0 0 BC 0.1 0.1 0.1 0.1 0.1 0.1 0.1 0.1 Reduce By 0.1 0.1 0.1 0.1 0.1 0.1 0.1 0.1 CD 1.0 1.0 1.0 1.0 1.0 1.0 1.0 1.0 Reduce Every 1.0 1.0 1.0 1.0 1.0 1.0 1.0 1.0 DE 3.0 4.0 3.0 4.0 3.0 4.0 3.0 4.0 Yellow Change 3.0 4.0 3.0 4.0 3.0 4.0 3.0 4.0 EF 0.0 0.5 0.0 1.0 0.0 0.5 0.0 1.0 Red Clear 0.0 0.5 0.0 1.0 0.0 0.5 0.0 1.0 F
Phase Timing - Bank 2 <F Page> Phase Timing - Bank 3 <F Page>
7 8 CRow Time Dwell Vehicle Call Row
0 0 - - - - - - 01 0 0 ________ 12 0 0 ________ 23 0 0 ________ 34 0 0 ________ 45 0 0 ________ 56 0 0 ________ 67 0 0 ________ 78 0 0 ________ 89 0 0 ________ 9A - - - 0 ________ AB 0 0 ________ BC 0 0 ________ CD 0 0 ________ DE 0 0 ________ EF 0 0 ________ F
Special Event Schedule <C Page with F+9+F=22>
<--- Limited Service Interval
(Set Dwell = 255)
- - - - - - - - - - - -
________________________
________________
BForce Off
________
________
________________________________
Reduce ByReduce EveryYellow ChangeRed Clear
Delay Only --->
Limited Service Int. --->
Max GapMin GapMax LimitMax Limit 2 - - - - - -Call To Phase
Ped WalkPed FDWMin GreenType 3 LimitAdded InitialVeh Extension
________________________________
________________________
FOutput
________________________________________
________
________________
________________________________
________
________________________
________
________
________________________________
________________________________
________________
- - -________________________________________________________
________________
________________________
________________________________
________________
________________
________________________________________________
________
________________________________
________________________
________
________
- - -________________________
________________
________________________
Phase Phase
9Hold
AAdvance
DPermit Phases
EPed Omit
Printed on 6/13/2016 4:05 PM Timing Sheet Version: 200 SA & CA Revision: 10430

INTERSECTION: 009 Santa Rosa Rd@Moorpark Rd Page 1 (of 9)Group Assignment: NONE N/S Street Name: Moorpark Road Last Database Change:
Field Master Assignment: FM2 Santa Rosa Road E/W Street Name: Santa Rosa RoadSystem Reference Number: 9
Notes:Change By Date By Date
Drop Number 8 <C/0+0+0>Zone Number 1 <C/0+0+1>Area Number 4 <C/0+0+2> 0 <F/1+0+E> Exclusive Walk 0 <F/1+0+0>Area Address 8 <C/0+0+3> <C/0+A+1> 5.0 <F/1+0+F> Exclusive FDW 0 <F/1+0+1>QuicNet Channel (QuicNet) <C/0+B+1> 6.0 <F/1+C+0> All Red Clear 0.0 <F/1+0+2>Communication Addresses Manual Selection Start / Revert Times Exclusive Ped Phase
Column Numbers ----> 1 2 3 4 5 6 7 8 9 A B C D ERow Phase Names ----> Row
0 Ped Walk 0 0 0 0 0 7 0 7 - - - - - - - - - - - - - - - RR-1 Delay 0 Permit 01 Ped FDW 0 0 0 0 0 33 0 28 Phase 1 0 0 0 0 0.0 RR-1 Clear 0 Red Lock 12 Min Green 4 10 4 6 8 10 0 5 Phase 2 20 0 0 0 0.0 EV-A Delay 0 Yellow Lock 23 Type 3 Disconnect 0 0 0 0 0 0 0 0 Phase 3 0 0 0 0 0.0 EV-A Clear 0 Min Recall 34 Added per Vehicle 0.0 2.0 0.0 3.0 0.0 2.0 0.0 0.0 Phase 4 20 0 0 0 0.0 EV-B Delay 0 Ped Recall 45 Veh Extension 2.0 4.5 2.0 5.0 2.0 4.5 0.0 2.0 Phase 5 0 0 0 0 0.0 EV-B Clear 0 View Set Peds 56 Max Gap 2.0 6.0 3.0 6.0 2.0 6.0 0.0 2.0 Phase 6 20 0 0 0 0.0 EV-C Delay 0 Rest In Walk 67 Min Gap 2.0 2.0 0.5 3.0 2.0 3.0 0.0 2.0 Phase 7 0 0 0 0 0.0 EV-C Clear 0 Red Rest 78 Max Limit 15 30 0 35 35 35 0 15 Phase 8 20 0 0 0 0.0 EV-D Delay 0 Dual Entry 89 Max Limit 2 20 35 0 60 40 40 0 15 EV-D Clear 0 Max Recall 9A Adv. / Delay Walk 0 0 0 0 0 0 0 0 Max Initial RR-2 Delay 0 Soft Recall AB PE Min Ped FDW 7 7 7 7 7 7 0 7 Alternate Walk RR-2 Clear 0 Max 2 BC Cond Serv Check 10 10 10 10 10 10 0 10 Alternate FDW View EV Delay - - - Cond. Service CD Reduce Every 1.0 0.5 1.0 2.0 1.0 0.5 0.0 1.0 Alternate Initial View EV Clear - - - Man Cntrl Calls DE Yellow Change 3.6 5.0 3.6 5.0 3.6 5.0 0.0 3.6 Alternate Extension View RR Delay - - - Yellow Start EF Red Clear 1.0 2.0 1.0 2.0 2.0 2.0 0.0 1.0 View RR Clear - - - First Phases F
Phase Timing - Bank 1 <C+0+F=1> Alternate Timing <C+0+F=1> Preempt Timing Phase Functions <C+0+F=1>
12/7/2015 13:17
ChangeChange Record
________
________ - - - - -
________________
12_456_8________________
_________________2___6__
_2___6___________2___6__________
________
F
(Outputs specified in Assignable Outputs at E/127+A+E & F)
Phase
Manual PlanManual Offset0 All Red Start
Manual Plan 0 = Automatic1-9 = Plan 1-9 14 = Free 15 = Flash
Manual Offset 0 = Automatic 1 = Offset A 2 = Offset B 3 = Offset C
4/8/16: New Max2 timings and TOD periods
Flash StartRed Revert
Printed on 6/3/2016 5:37 PM Timing Sheet Version: 233 RV2 Revision: 30826

INTERSECTION: 009 Santa Rosa Rd@Moorpark Rd Page 2 (of 9)
Column Numbers ----> 1 2 3 4 5 6 7 8Row Overlap Name ----> C Row
0 Load Switch Number 3 0 0 0 0 0 0 0 EV-A 0 01 Veh Set 1 - Phases ___45___ ________ ________ ________ ________ ________ ________ ________ EV-B 0 12 Veh Set 2 - Phases ________ ________ ________ ________ ________ ________ ________ ________ EV-C 0 23 Veh Set 3 - Phases ________ ________ ________ ________ ________ ________ ________ ________ EV-D 0 34 Neg Veh Phases _____6__ ________ ________ ________ ________ ________ ________ ________ RR-1 * - - - 45 Neg Ped Phases ________ ________ ________ ________ ________ ________ ________ ________ RR-2 * - - - 56 Green Omit Phases ________ ________ ________ ________ ________ ________ ________ ________ SE-1 0 67 Green Clear Omit Phs. ________ ________ ________ ________ ________ ________ ________ ________ SE-2 0 78 89 9A AB BC CD Green Clear 0.0 0.0 0.0 0.0 0.0 0.0 0.0 0.0 DE Yellow Change 4.0 0.0 0.0 0.0 0.0 0.0 0.0 0.0 EF Red Clear 1.0 0.0 0.0 0.0 0.0 0.0 0.0 0.0 F
Overlap Assignments <C+0+E=29>
Row Column Numbers ----> E F 2 Row
0 Exclusive Phases ________ Fast Green Flash Phase 01 RR-1 Clear Phases ________ Ext. Permit 1 Phases ________ Green Flash Phases Phase 1 10 12 RR-2 Clear Phases ________ Ext. Permit 2 Phases ________ Flashing Walk Phases Phase 2 20 23 RR-2 Limited Service ________ Exclusive Ped Assign ________ Guaranteed Passage Phase 3 0 34 Prot / Perm Phases ________ Preempt Non-Lock ________ Simultaneous Gap Term Phase 4 15 45 Flash to PE Circuits ________ Ped for 2P Output ________ Sequential Timing Phase 5 10 56 Flash Entry Phases ________ Ped for 6P Output _____6__ Advance Walk Phases Phase 6 40 67 Disable Yellow Range ________ Ped for 4P Output _______8 Delay Walk Phases Phase 7 0 78 Disable Ovp Yel Range ________ Ped for 8P Output _______8 External Recall Phase 8 31 89 Overlap Yellow Flash ________ Yellow Flash Phases ________ Start-up Overlap Green 9A EV-A Phases ________ Low Priority A Phases ________ Max Extension AB EV-B Phases ________ Low Priority B Phases ________ Inhibit Ped Reservice BC EV-C Phases ________ Low Priority C Phases ________ Semi-Actuated CD EV-D Phases ________ Low Priority D Phases ________ Start-up Overlap Yellow DE Extra 1 Config. Bits 1_______ Restricted Phases ___4___8 Start-up Vehicle Calls EF IC Select (Interconnect) _2______ Extra 2 Config. Bits _______8 Start-up Ped Calls F
Configuration <C+0+E=125> Configuration <C+0+E=125> Specials <C+0+F=2>
Overlap
CoordinationTransition
________12345678
________________
________F
<C+0+E=125>
IC Select Flags1 =2 = Modem3 = 7-Wire Slave4 = Flash / Free5 =6 = Simplex Master7 = 7-Wire Master8 = Offset Interrupter
Flash to PE & PE Non-Lock1 = EV A 5 = RR 12 = EV B 6 = RR 23 = EV C 7 = SE 14 = EV D 8 = SE 2
________
________________________________________12345678
Preempt Priority
Extra 1 Flags 1 = TBC Type 1 2 = NEMA Ext. Coord 3 = Auto Daylight Savings 4 = Solid FDW on EV 5 = Extended Status 6 = International Ped 7 = Flash - Clear Outputs 8 = Split Ring
Extra 2 Flags 1 = AWB During Initial 2 = RV2 FYA Enable 3 = Disable Min Walk 4 = QuicNet/4 System 5 = Ignore P/P on EV 6 = Police Adv hold in FDW 7 = Central PE Enable 8 = Flash GRN before YEL
( * RR-1 is always Highest, and RR-2 is always
Second Highest )
<C+0+C=5>
________________
________________
Minimums
Printed on 6/3/2016 5:37 PM Timing Sheet Version: 233 RV2 Revision: 30826

INTERSECTION: 009 Santa Rosa Rd@Moorpark Rd Page 3 (of 9)
Column Numbers ----> 1 2 3 4 5 6 7 8 9Row Plan Name ----> Row E Row
0 Cycle Length 0 0 0 0 0 0 0 0 0 0 01 Phase 1 - ForceOff 0 0 0 0 0 0 0 0 0 1 Plan 1 - Sync _2___6__ 12 Phase 2 - ForceOff 0 0 0 0 0 0 0 0 0 2 Plan 2 - Sync _2___6__ 23 Phase 3 - ForceOff 0 0 0 0 0 0 0 0 0 3 Plan 3 - Sync _2___6__ 34 Phase 4 - ForceOff 0 0 0 0 0 0 0 0 0 4 Plan 4 - Sync _2___6__ 45 Phase 5 - ForceOff 0 0 0 0 0 0 0 0 0 5 Plan 5 - Sync _2___6__ 56 Phase 6 - ForceOff 0 0 0 0 0 0 0 0 0 6 Plan 6 - Sync _2___6__ 67 Phase 7 - ForceOff 0 0 0 0 0 0 0 0 0 7 Plan 7 - Sync _2___6__ 78 Phase 8 - ForceOff 0 0 0 0 0 0 0 0 0 8 Plan 8 - Sync _2___6__ 89 Ring Offset 0 0 0 0 0 0 0 0 0 9 Plan 9 - Sync _2___6__ 9A Offset 1 0 0 0 0 0 0 0 0 0 A NEMA Sync ________ AB Offset 2 0 0 0 0 0 0 0 0 0 B NEMA Hold ________ BC Offset 3 0 0 0 0 0 0 0 0 0 C CD Perm 1 - End 0 0 0 0 0 0 0 0 0 D DE Hold Release 255 255 255 255 255 255 255 255 255 E Coord Extra ________ EF Zone Offset 0 0 0 0 0 0 0 0 0 F F
Coordination - Bank 1 <C+0+C=1> Sync Phases <C+0+C=1>
Row Row F Row
0 Ped Adjustment 10 10 10 0 0 0 0 0 0 0 Free Lag _2_4_6__ 01 Perm 2 - Start 0 0 0 0 0 0 0 0 0 1 Plan 1 - Lag _2_4_6__ 12 Perm 2 - End 0 0 0 0 0 0 0 0 0 2 Plan 2 - Lag _2_4_6__ 23 Perm 3 - Start 0 0 0 0 0 0 0 0 0 3 Plan 3 - Lag _2_4_6__ 34 Perm 3 - End 0 0 0 0 0 0 0 0 0 4 Plan 4 - Lag _2_4_6__ 45 Reservice Time 0 0 0 0 0 0 0 0 0 5 Plan 5 - Lag _2_4_6__ 56 Reservice Phases ________ ________ ________ ________ ________ ________ ________ ________ ________ 6 Plan 6 - Lag _2_4_6__ 67 7 Plan 7 - Lag _2_4_6__ 78 Pretimed Phases ________ ________ ________ ________ ________ ________ ________ ________ ________ 8 Plan 8 - Lag _2_4_6__ 89 Max Recall ________ ________ ________ ________ ________ ________ ________ ________ ________ 9 Plan 9 - Lag _2_4_6__ 9A Perm 1 Veh Phase 12345678 12345678 12345678 12345678 12345678 12345678 12345678 12345678 12345678 A External Lag ________ AB Perm 1 Ped Phase 12345678 12345678 12345678 12345678 12345678 12345678 12345678 12345678 12345678 B BC Perm 2 Veh Phase ________ ________ ________ ________ ________ ________ ________ ________ ________ C CD Perm 2 Ped Phase ________ ________ ________ ________ ________ ________ ________ ________ ________ D DE Perm 3 Veh Phase ________ ________ ________ ________ ________ ________ ________ ________ ________ E EF Perm 3 Ped Phase ________ ________ ________ ________ ________ ________ ________ ________ ________ F F
Coordination - Bank 2 <C+0+C=2> Lag Phases <C+0+C=1>
Plan Coord Extra 1 = Programmed WALK Time for Sync Phases 2 = Always Terminate Sync Phase Peds
Printed on 6/3/2016 5:37 PM Timing Sheet Version: 233 RV2 Revision: 30826

INTERSECTION: 009 Santa Rosa Rd@Moorpark Rd Page 4 (of 9)
Row Row
0 Spec. Funct. 1 0 NOT-3 0 Max 2 0 Pretimed 0 Set Monday 0 Dial 2 (7-Wire) 0 Sim Term 0 01 Spec. Funct. 2 0 NOT-4 0 System Det 1 0 Plan 1 0 Ext. Perm 1 0 Dial 3 (7-Wire) 0 EV-A 71 12 Spec. Funct. 3 0 OR-4 (a) 0 System Det 2 0 Plan 2 0 Ext. Perm 2 0 Offset 1 (7-Wire) 0 EV-B 72 23 Spec. Funct. 4 0 OR-4 (b) 0 System Det 3 0 Plan 3 0 Gate Down 0 Offset 2 (7-Wire) 0 EV-C 73 34 NAND-3 (a) 0 OR-5 (a) 0 System Det 4 0 Plan 4 0 Set Clock 0 Offset 3 (7-Wire) 0 EV-D 74 45 NAND-3 (b) 0 OR-5 (b) 0 System Det 5 0 Plan 5 0 Stop Time 82 Free (7-Wire) 0 RR-1 51 56 NAND-4 (a) 0 OR-6 (a) 0 System Det 6 0 Plan 6 0 Flash Sense 81 Flash (7-Wire) 0 RR-2 52 67 NAND-4 (b) 0 OR-6 (b) 0 System Det 7 0 Plan 7 0 Manual Enable 0 Excl. Ped Omit 0 Spec. Event 1 0 78 OR-7 (a) 0 Fig 3 Diamond 0 System Det 8 0 Plan 8 0 Man. Advance 0 NOT-1 0 Spec. Event 2 0 89 OR-7 (b) 0 Fig 4 Diamond 0 Max Inhibit (nema) 0 Plan 9 0 External Alarm 0 NOT-2 0 External Lag 0 9A OR-7 (c) 0 AND-4 (a) 0 Force A (nema) 0 DELAY-A 0 Phase Bank 2 0 OR-1 (a) 0 AND-1 (a) 200 AB OR-7 (d) 0 AND-4 (b) 0 Force B (nema) 0 DELAY-B 0 Phase Bank 3 0 OR-1 (b) 0 AND-1 (b) 4 BC OR-8 (a) 0 NAND-1 (a) 0 C.N.A. (nema) 0 DELAY-C 0 Overlap Set 2 200 OR-2 (a) 0 AND-2 (a) 0 CD OR-8 (b) 0 NAND-1 (b) 0 Hold (nema) 0 DELAY-D 0 Overlap Set 3 0 OR-2 (b) 0 AND-2 (b) 0 DE OR-8 (c) 0 NAND-2 (a) 0 Max Recall 0 DELAY-E 0 Detector Set 2 0 OR-3 (a) 0 AND-3 (a) 0 EF OR-8 (d) 0 NAND-2 (b) 0 Min Recall 0 DELAY-F 0 Detector Set 3 0 OR-3 (b) 0 AND-3 (b) 0 F
Assignable Inputs <C+0+E=126>
Row Row
0 Phase ON - 1 0 Preempt Fail 0 Flasher 0 0 Free 0 NOT-1 0 TOD Out 1 200 Dial 2 (7-Wire) 0 01 Phase ON - 2 0 Sp Evnt Out 1 0 Flasher 1 0 Plan 1 0 OR-1 0 TOD Out 2 0 Dial 3 (7-Wire) 0 12 Phase ON - 3 0 Sp Evnt Out 2 0 Fast Flasher 0 Plan 2 0 OR-2 0 TOD Out 3 0 Offset 1 (7-Wire) 0 23 Phase ON - 4 0 Sp Evnt Out 3 0 Fig 3 Diamond 0 Plan 3 0 OR-3 0 TOD Out 4 0 Offset 2 (7-Wire) 0 34 Phase ON - 5 0 Sp Evnt Out 4 0 Fig 4 Diamond 0 Plan 4 0 AND-1 38 TOD Out 5 0 Offset 3 (7-Wire) 0 45 Phase ON - 6 0 Sp Evnt Out 5 0 Plan 5 0 AND-2 0 TOD Out 6 0 Free (7-Wire) 0 56 Phase ON - 7 0 Sp Evnt Out 6 0 Plan 6 0 AND-3 0 TOD Out 7 0 Flash (7-Wire) 0 67 Phase ON - 8 0 Sp Evnt Out 7 0 Plan 7 0 NOT-2 0 TOD Out 8 0 Preempt 0 78 Ph. Check - 1 0 Sp Evnt Out 8 0 NOT-3 0 Plan 8 0 EV-A 0 Adv. Warn - 1 36 Low Priority A 0 89 Ph. Check - 2 0 NOT-4 0 Plan 9 0 EV-B 0 Adv. Warn - 2 0 Low Priority B 0 9A Ph. Check - 3 0 Detector Fail 0 OR-4 0 Spec. Funct. 3 0 EV-C 0 DELAY-A 0 Low Priority C 0 AB Ph. Check - 4 0 Spec. Funct. 1 0 OR-5 0 Spec. Funct. 4 0 EV-D 0 DELAY-B 0 Low Priority D 0 BC Ph. Check - 5 0 Spec. Funct. 2 0 OR-6 0 NAND-3 0 RR-1 0 DELAY-C 0 CD Ph. Check - 6 0 Central Control 0 AND-4 0 NAND-4 0 RR-2 0 DELAY-D 0 DE Ph. Check - 7 0 Excl. Ped DW 0 NAND-1 0 OR-7 0 Spec. Event 1 0 DELAY-E 0 EF Ph. Check - 8 0 Excl. Ped WK 0 NAND-2 0 OR-8 0 Spec. Event 2 0 DELAY-F 0 F
Assignable Outputs <C+0+E=127>
Column D
Column C
Column C
Column D Column E Column F
Column E Column F
Column 9
Column 9
Column A Column B
Column A Column B
Printed on 6/3/2016 5:37 PM Timing Sheet Version: 233 RV2 Revision: 30826
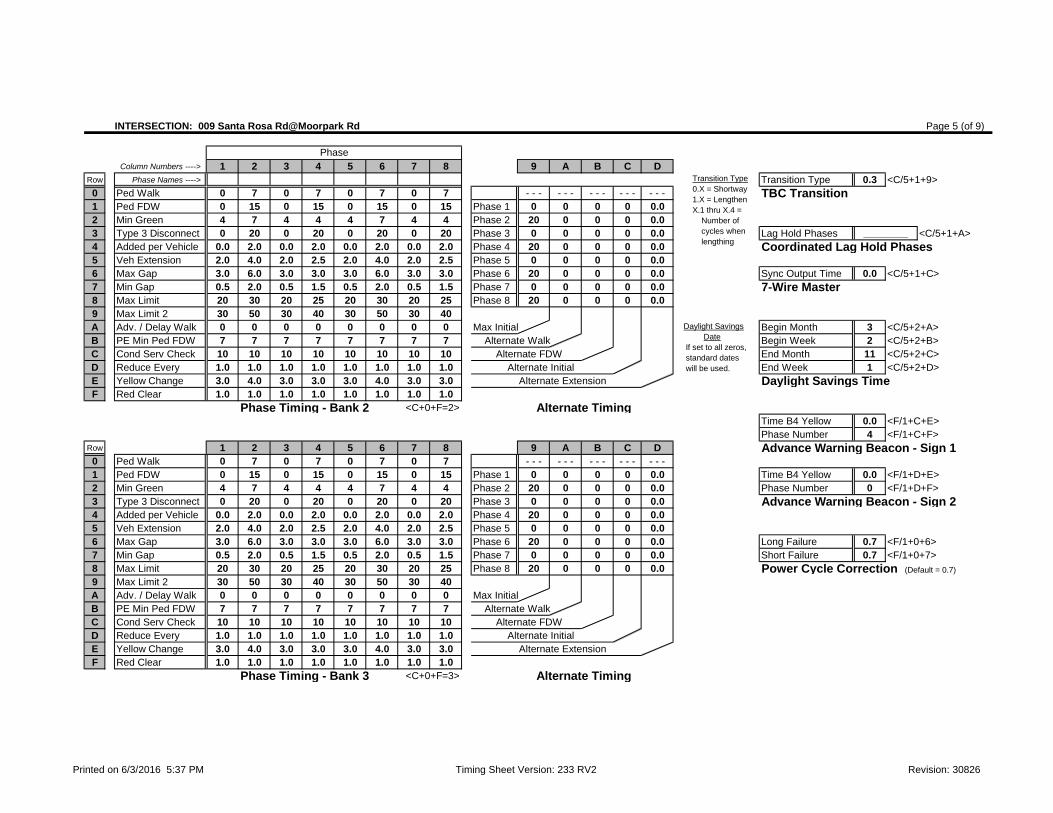
INTERSECTION: 009 Santa Rosa Rd@Moorpark Rd Page 5 (of 9)
Column Numbers ----> 1 2 3 4 5 6 7 8 9 A B C DRow Phase Names ----> Transition Type 0.3 <C/5+1+9>0 Ped Walk 0 7 0 7 0 7 0 7 - - - - - - - - - - - - - - - TBC Transition1 Ped FDW 0 15 0 15 0 15 0 15 Phase 1 0 0 0 0 0.02 Min Green 4 7 4 4 4 7 4 4 Phase 2 20 0 0 0 0.03 Type 3 Disconnect 0 20 0 20 0 20 0 20 Phase 3 0 0 0 0 0.0 Lag Hold Phases <C/5+1+A>4 Added per Vehicle 0.0 2.0 0.0 2.0 0.0 2.0 0.0 2.0 Phase 4 20 0 0 0 0.0 Coordinated Lag Hold Phases5 Veh Extension 2.0 4.0 2.0 2.5 2.0 4.0 2.0 2.5 Phase 5 0 0 0 0 0.06 Max Gap 3.0 6.0 3.0 3.0 3.0 6.0 3.0 3.0 Phase 6 20 0 0 0 0.0 Sync Output Time 0.0 <C/5+1+C>7 Min Gap 0.5 2.0 0.5 1.5 0.5 2.0 0.5 1.5 Phase 7 0 0 0 0 0.0 7-Wire Master8 Max Limit 20 30 20 25 20 30 20 25 Phase 8 20 0 0 0 0.09 Max Limit 2 30 50 30 40 30 50 30 40A Adv. / Delay Walk 0 0 0 0 0 0 0 0 Max Initial Begin Month 3 <C/5+2+A>B PE Min Ped FDW 7 7 7 7 7 7 7 7 Alternate Walk Begin Week 2 <C/5+2+B>C Cond Serv Check 10 10 10 10 10 10 10 10 Alternate FDW End Month 11 <C/5+2+C>D Reduce Every 1.0 1.0 1.0 1.0 1.0 1.0 1.0 1.0 Alternate Initial End Week 1 <C/5+2+D>E Yellow Change 3.0 4.0 3.0 3.0 3.0 4.0 3.0 3.0 Alternate Extension Daylight Savings TimeF Red Clear 1.0 1.0 1.0 1.0 1.0 1.0 1.0 1.0
Phase Timing - Bank 2 <C+0+F=2> Alternate TimingTime B4 Yellow 0.0 <F/1+C+E>Phase Number 4 <F/1+C+F>
Row 1 2 3 4 5 6 7 8 9 A B C D Advance Warning Beacon - Sign 10 Ped Walk 0 7 0 7 0 7 0 7 - - - - - - - - - - - - - - -1 Ped FDW 0 15 0 15 0 15 0 15 Phase 1 0 0 0 0 0.0 Time B4 Yellow 0.0 <F/1+D+E>2 Min Green 4 7 4 4 4 7 4 4 Phase 2 20 0 0 0 0.0 Phase Number 0 <F/1+D+F>3 Type 3 Disconnect 0 20 0 20 0 20 0 20 Phase 3 0 0 0 0 0.0 Advance Warning Beacon - Sign 24 Added per Vehicle 0.0 2.0 0.0 2.0 0.0 2.0 0.0 2.0 Phase 4 20 0 0 0 0.05 Veh Extension 2.0 4.0 2.0 2.5 2.0 4.0 2.0 2.5 Phase 5 0 0 0 0 0.06 Max Gap 3.0 6.0 3.0 3.0 3.0 6.0 3.0 3.0 Phase 6 20 0 0 0 0.0 Long Failure 0.7 <F/1+0+6>7 Min Gap 0.5 2.0 0.5 1.5 0.5 2.0 0.5 1.5 Phase 7 0 0 0 0 0.0 Short Failure 0.7 <F/1+0+7>8 Max Limit 20 30 20 25 20 30 20 25 Phase 8 20 0 0 0 0.0 Power Cycle Correction (Default = 0.7)9 Max Limit 2 30 50 30 40 30 50 30 40A Adv. / Delay Walk 0 0 0 0 0 0 0 0 Max InitialB PE Min Ped FDW 7 7 7 7 7 7 7 7 Alternate WalkC Cond Serv Check 10 10 10 10 10 10 10 10 Alternate FDWD Reduce Every 1.0 1.0 1.0 1.0 1.0 1.0 1.0 1.0 Alternate InitialE Yellow Change 3.0 4.0 3.0 3.0 3.0 4.0 3.0 3.0 Alternate ExtensionF Red Clear 1.0 1.0 1.0 1.0 1.0 1.0 1.0 1.0
Phase Timing - Bank 3 <C+0+F=3> Alternate Timing
Phase
________
Transition Type 0.X = Shortway 1.X = Lengthen X.1 thru X.4 = Number of cycles when lengthing
Daylight Savings Date If set to all zeros, standard dates will be used.
Printed on 6/3/2016 5:37 PM Timing Sheet Version: 233 RV2 Revision: 30826

INTERSECTION: 009 Santa Rosa Rd@Moorpark Rd Page 6 (of 9)
Column Numbers ----> 0 1 2 3 1 3C1 Pin Carry-
Row Detector Name Number Attributes Phase(s) Assign Delay over Column Numbers ----> 1 2 3 4 5 6 7 8 Row
0 39 ___45_7_ _2______ 123____8 0.0 0.0 Walk 0 0 0 0 0 0 0 0 01 40 ___45_7_ _____6__ 123____8 0.0 0.0 Don't Walk 0 0 0 0 0 0 0 0 12 41 ___45_7_ ___4____ 123____8 0.0 0.0 Phase Green 0 0 0 0 0 0 0 0 23 42 ___45_7_ _______8 123____8 15.0 0.0 Phase Yellow 0 0 0 0 0 0 0 0 34 43 ___45_7_ _2______ 123____8 0.0 0.0 Phase Red 0 0 0 0 0 0 0 0 45 44 ___45_7_ _____6__ 123____8 0.0 0.0 Overlap Green 0 0 0 0 0 0 0 0 56 45 ___45_7_ ___4____ 123____8 0.0 0.0 Overlap Yellow 0 0 0 0 0 0 0 0 67 46 ___45_7_ _______8 123____8 0.0 0.0 Overlap Red 0 0 0 0 0 0 0 0 78 47 _____67_ _2______ 123____8 0.0 0.0 Redirect Phase Outputs <C+0+E=127>9 48 _____67_ _____6__ 123____8 0.0 0.0A 49 _____67_ ___4____ 123____8 0.0 0.0 Cabinet Type 0 <E/125+D+0> Row
B 50 _____67_ _______8 123____8 0.0 0.0 Enable Redirection 0C 55 ___45_7_ ____5___ 123____8 0.0 0.0 1D 56 ___45_7_ 1_______ 123____8 0.0 0.0 2E 57 ___45_7_ ______7_ 123____8 0.0 0.0 Max OFF (minutes) 255 <D/0+0+1> 3F 58 ___45_7_ __3_____ 123____8 0.0 0.0 Max ON (minutes) 7 <D/0+0+2> 4
Detector Failure Monitor 54 5 6 7 2 4 6
C1 Pin Carry- 7Row Detector Name Number Attributes Phase(s) Assign Delay over Detector Attributes D Dimming <C+0+E=125>0 59 ___45_7_ ____5___ 123____8 0.0 0.0 Number of Digits 01 60 ___45_7_ 1_______ 123____8 0.0 0.0 1 st Digit 0 B Row
2 61 ___45_7_ ______7_ 123____8 0.0 0.0 2 ed Digit 0 0 A3 62 ___45_7_ __3_____ 123____8 0.0 0.0 3 ed Digit 0 0 B4 63 ___45_7_ _2______ 123____8 0.0 0.0 4 th Digit 0 0 C5 64 ___45_7_ _____6__ 123____8 0.0 0.0 5 th Digit 0 0 D6 65 ___45_7_ ___4____ 123____8 0.0 0.0 6 th Digit 0 0 E7 66 ___45_7_ _______8 123____8 0.0 0.0 7 th Digit 0 0 F8 67 _2______ _2______ 123____8 0.0 0.0 Det. Assignments 8 th Digit 0 Delay Logic Times9 68 _2______ _____6__ 123____8 0.0 0.0 9 th Digit 0 <C+0+D=0> (seconds)A 69 _2______ ___4____ 123____8 0.0 0.0 10 th Digit 0B 70 _2______ _______8 123____8 0.0 0.0 11 th Digit 0 <C/5+F+0>C 76 ___45_7_ _2______ 123____8 0.0 0.0 12 th Digit 0 Disable Alarm ReportingD 77 ___45_7_ _____6__ 123____8 0.0 0.0 13 th Digit 0E 78 ___45_7_ ___4____ 123____8 0.0 0.0 14 th Digit 0 10 <C/5+C+0>F 79 ___45_7_ _______8 123____8 0.0 0.0 15 th Digit 0 <C+0+C=5> Redial Time (minutes)
Detector Assignments <C+0+E=126> Dial-Back Telephone Number (View Redial Timer at E/2+D+6)
________________________________
Output Port 7
DELAY-C
Output Port 2
________________
Output Port 3Output Port 4Output Port 5Output Port 6
<C+0+D=0>
1 = Full Time Delay 2 = Ped Call 3 = 4 = Count 5 = Extension 6 = Type 3 7 = Calling 8 = Alternate
1 = Det. Set 1 2 = Det. Set 2 3 = Det. Set 3 4 = 5 = 6 = Failure - Min Recall 7 = Failure - Max Recall 8 = Report on Failure
________
1 = Stop Time 2 = Flash Sense 3 = Keyboard Entry 4 = Manual Plan 5 = Police Control 6 = External Alarm 7 = Detector Failure 8 =
DELAY-ADELAY-B
DELAY-E
Time
Omit Alarm
DELAY-F
Ped / Phase / Overlap
D
________(Enable Redirection = 30) Output Port 1
DELAY-D
Disable Alarms
Printed on 6/3/2016 5:37 PM Timing Sheet Version: 233 RV2 Revision: 30826
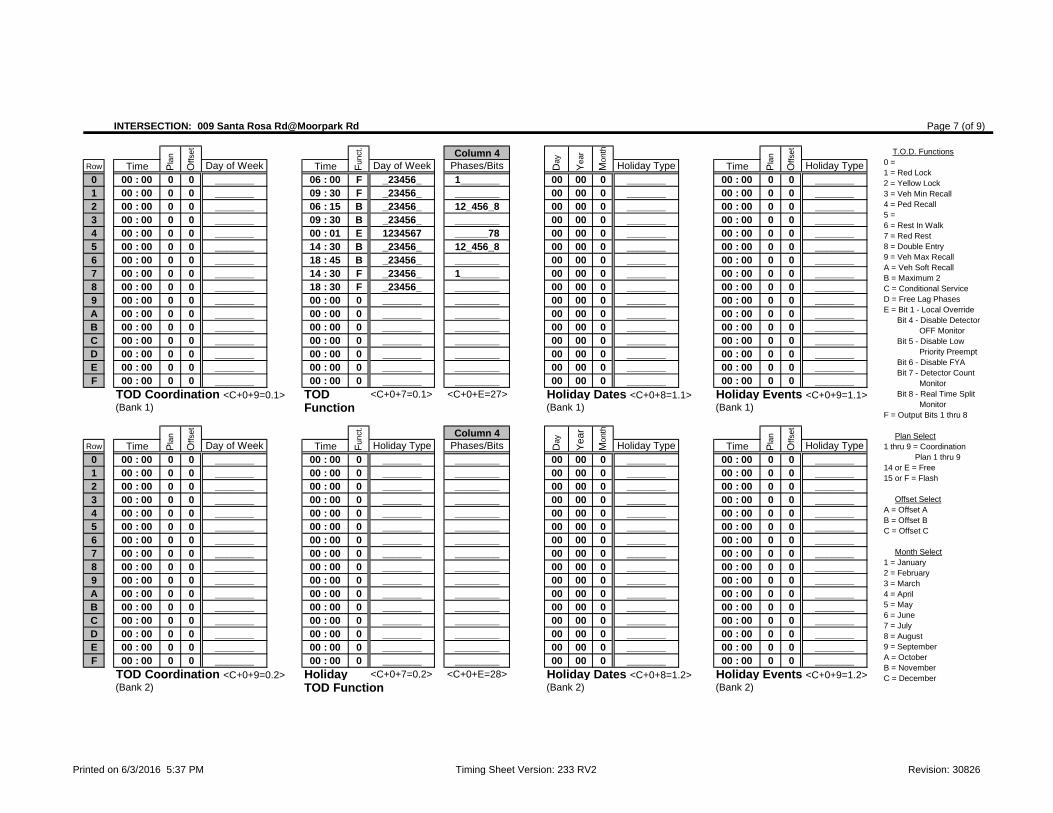
INTERSECTION: 009 Santa Rosa Rd@Moorpark Rd Page 7 (of 9)
Column 4Row Time Day of Week Time Day of Week Phases/Bits Holiday Type Time Holiday Type0 00 : 00 0 0 _______ 06 : 00 F _23456_ 1_______ 00 00 0 _______ 00 : 00 0 0 _______1 00 : 00 0 0 _______ 09 : 30 F _23456_ ________ 00 00 0 _______ 00 : 00 0 0 _______2 00 : 00 0 0 _______ 06 : 15 B _23456_ 12_456_8 00 00 0 _______ 00 : 00 0 0 _______3 00 : 00 0 0 _______ 09 : 30 B _23456_ ________ 00 00 0 _______ 00 : 00 0 0 _______4 00 : 00 0 0 _______ 00 : 01 E 1234567 ______78 00 00 0 _______ 00 : 00 0 0 _______5 00 : 00 0 0 _______ 14 : 30 B _23456_ 12_456_8 00 00 0 _______ 00 : 00 0 0 _______6 00 : 00 0 0 _______ 18 : 45 B _23456_ ________ 00 00 0 _______ 00 : 00 0 0 _______7 00 : 00 0 0 _______ 14 : 30 F _23456_ 1_______ 00 00 0 _______ 00 : 00 0 0 _______8 00 : 00 0 0 _______ 18 : 30 F _23456_ ________ 00 00 0 _______ 00 : 00 0 0 _______9 00 : 00 0 0 _______ 00 : 00 0 _______ ________ 00 00 0 _______ 00 : 00 0 0 _______A 00 : 00 0 0 _______ 00 : 00 0 _______ ________ 00 00 0 _______ 00 : 00 0 0 _______B 00 : 00 0 0 _______ 00 : 00 0 _______ ________ 00 00 0 _______ 00 : 00 0 0 _______C 00 : 00 0 0 _______ 00 : 00 0 _______ ________ 00 00 0 _______ 00 : 00 0 0 _______D 00 : 00 0 0 _______ 00 : 00 0 _______ ________ 00 00 0 _______ 00 : 00 0 0 _______E 00 : 00 0 0 _______ 00 : 00 0 _______ ________ 00 00 0 _______ 00 : 00 0 0 _______F 00 : 00 0 0 _______ 00 : 00 0 _______ ________ 00 00 0 _______ 00 : 00 0 0 _______
TOD Coordination <C+0+9=0.1> TOD <C+0+7=0.1> <C+0+E=27> Holiday Dates <C+0+8=1.1> Holiday Events <C+0+9=1.1>(Bank 1) Function (Bank 1) (Bank 1)
Column 4Row Time Day of Week Time Holiday Type Phases/Bits Holiday Type Time Holiday Type0 00 : 00 0 0 _______ 00 : 00 0 _______ ________ 00 00 0 _______ 00 : 00 0 0 _______1 00 : 00 0 0 _______ 00 : 00 0 _______ ________ 00 00 0 _______ 00 : 00 0 0 _______2 00 : 00 0 0 _______ 00 : 00 0 _______ ________ 00 00 0 _______ 00 : 00 0 0 _______3 00 : 00 0 0 _______ 00 : 00 0 _______ ________ 00 00 0 _______ 00 : 00 0 0 _______4 00 : 00 0 0 _______ 00 : 00 0 _______ ________ 00 00 0 _______ 00 : 00 0 0 _______5 00 : 00 0 0 _______ 00 : 00 0 _______ ________ 00 00 0 _______ 00 : 00 0 0 _______6 00 : 00 0 0 _______ 00 : 00 0 _______ ________ 00 00 0 _______ 00 : 00 0 0 _______7 00 : 00 0 0 _______ 00 : 00 0 _______ ________ 00 00 0 _______ 00 : 00 0 0 _______8 00 : 00 0 0 _______ 00 : 00 0 _______ ________ 00 00 0 _______ 00 : 00 0 0 _______9 00 : 00 0 0 _______ 00 : 00 0 _______ ________ 00 00 0 _______ 00 : 00 0 0 _______A 00 : 00 0 0 _______ 00 : 00 0 _______ ________ 00 00 0 _______ 00 : 00 0 0 _______B 00 : 00 0 0 _______ 00 : 00 0 _______ ________ 00 00 0 _______ 00 : 00 0 0 _______C 00 : 00 0 0 _______ 00 : 00 0 _______ ________ 00 00 0 _______ 00 : 00 0 0 _______D 00 : 00 0 0 _______ 00 : 00 0 _______ ________ 00 00 0 _______ 00 : 00 0 0 _______E 00 : 00 0 0 _______ 00 : 00 0 _______ ________ 00 00 0 _______ 00 : 00 0 0 _______F 00 : 00 0 0 _______ 00 : 00 0 _______ ________ 00 00 0 _______ 00 : 00 0 0 _______
TOD Coordination <C+0+9=0.2> Holiday <C+0+7=0.2> <C+0+E=28> Holiday Dates <C+0+8=1.2> Holiday Events <C+0+9=1.2>(Bank 2) TOD Function (Bank 2) (Bank 2)
Pla
n
Offs
et
Pla
n
Offs
et
T.O.D. Functions0 =1 = Red Lock2 = Yellow Lock3 = Veh Min Recall4 = Ped Recall5 =6 = Rest In Walk7 = Red Rest8 = Double Entry9 = Veh Max RecallA = Veh Soft RecallB = Maximum 2C = Conditional ServiceD = Free Lag PhasesE = Bit 1 - Local Override Bit 4 - Disable Detector OFF Monitor Bit 5 - Disable Low Priority Preempt Bit 6 - Disable FYA Bit 7 - Detector Count Monitor Bit 8 - Real Time Split MonitorF = Output Bits 1 thru 8
Plan Select1 thru 9 = Coordination Plan 1 thru 914 or E = Free15 or F = Flash
Offset SelectA = Offset AB = Offset BC = Offset C
Month Select1 = January2 = February3 = March4 = April5 = May6 = June7 = July8 = August9 = SeptemberA = OctoberB = NovemberC = December
Offs
et
Pla
n
Offs
et
Pla
n
Func
t.Fu
nct.
Mon
thM
onth
Yea
rY
ear
Day
Day
Printed on 6/3/2016 5:37 PM Timing Sheet Version: 233 RV2 Revision: 30826

INTERSECTION: 009 Santa Rosa Rd@Moorpark Rd Page 8 (of 9)
6 7 8 9 A B C D E FRow Clear Time Ped Call Hold Advance Force Off Vehicle Call Permit Phases Ped Omit Output0 ________ 0 ________ ________ ________ ________ ________ ________ ________ ________1 ________ 0 ________ ________ ________ ________ ________ ________ ________ ________ Notes:2 ________ 0 ________ ________ ________ ________ ________ ________ ________ ________3 ________ 0 ________ ________ ________ ________ ________ ________ ________ ________4 ________ 0 ________ ________ ________ ________ ________ ________ ________ ________5 ________ 0 ________ ________ ________ ________ ________ ________ ________ ________6 ________ 0 ________ ________ ________ ________ ________ ________ ________ ________7 ________ 0 ________ ________ ________ ________ ________ ________ ________ ________8 ________ 0 ________ ________ ________ ________ ________ ________ ________ ________9 ________ 0 ________ ________ ________ ________ ________ ________ ________ ________A ________ 0 ________ ________ ________ ________ ________ ________ ________ ________B ________ 0 ________ ________ ________ ________ ________ ________ ________ ________C ________ 0 ________ ________ ________ ________ ________ ________ ________ ________D ________ 0 ________ ________ ________ ________ ________ ________ ________ ________E ________ 0 ________ ________ ________ ________ ________ ________ ________ ________ 0 <E/27+5+F>F ________ 0 ________ ________ ________ ________ ________ ________ ________ ________ Limited Service Interval
Special Event Schedule -- Table 1 <C+0+E=27>
6 7 8 9 A B C D E FRow Clear Time Ped Call Hold Advance Force Off Vehicle Call Permit Phases Ped Omit Output0 ________ 0 ________ ________ ________ ________ ________ ________ ________ ________1 ________ 0 ________ ________ ________ ________ ________ ________ ________ ________ Notes:2 ________ 0 ________ ________ ________ ________ ________ ________ ________ ________3 ________ 0 ________ ________ ________ ________ ________ ________ ________ ________4 ________ 0 ________ ________ ________ ________ ________ ________ ________ ________5 ________ 0 ________ ________ ________ ________ ________ ________ ________ ________6 ________ 0 ________ ________ ________ ________ ________ ________ ________ ________7 ________ 0 ________ ________ ________ ________ ________ ________ ________ ________8 ________ 0 ________ ________ ________ ________ ________ ________ ________ ________9 ________ 0 ________ ________ ________ ________ ________ ________ ________ ________A ________ 0 ________ ________ ________ ________ ________ ________ ________ ________B ________ 0 ________ ________ ________ ________ ________ ________ ________ ________C ________ 0 ________ ________ ________ ________ ________ ________ ________ ________D ________ 0 ________ ________ ________ ________ ________ ________ ________ ________E ________ 0 ________ ________ ________ ________ ________ ________ ________ ________ 0 <E/28+5+F>F ________ 0 ________ ________ ________ ________ ________ ________ ________ ________ Limited Service Interval
Special Event Schedule -- Table 2 <C+0+E=28>
Printed on 6/3/2016 5:37 PM Timing Sheet Version: 233 RV2 Revision: 30826

INTERSECTION: 009 Santa Rosa Rd@Moorpark Rd Page 9 (of 9)
Min Time (seconds) 0 <F/1+0+8> 0 <F/1+A+D>Min Green Before PE Force Off Bus Delay
Max Time (minutes) 255 <F/1+0+9> 0 <F/1+A+E>Max Preempt Time Before Failure Max Early Green
Min Time (seconds) 0 <F/1+0+A> 0 <F/1+A+F>Min Time Between Same Preempts Max Green Extension (Does Not Apply To Railroad Preempt)
Low Pri. Channel <E/125+C+8>Disable Low Priority Channel
Row Time0 00 : 00 0 01 00 : 00 0 02 00 : 00 0 03 00 : 00 0 04 00 : 00 0 05 00 : 00 0 06 00 : 00 0 07 00 : 00 0 08 00 : 00 0 09 00 : 00 0 0A 00 : 00 0 0B 00 : 00 0 0C 00 : 00 0 0D 00 : 00 0 0E 00 : 00 0 0F 00 : 00 0 0
Headway <C+0+9=2.1>
______________
_______
_______
________
Low Priority1 = Channel A2 = Channel B3 = Channel C4 = Channel D
______________
Headway Time(minutes)
1 thru 9 = 1 thru 9A = 10B = 11C = 12D = 13E = 14F = 15
Delay Time (seconds)
Max Time (seconds)
Max Time (seconds)
Day of Week_______
____________________________
_2______2345__
Low Priority Preemption (Bus Priority)Note: Also see "Time of Day Functions", Function E, Bit 5 (Disable Low Priority)
Hea
dway
Dire
ctio
n
Only available with Program 233RV2.B (and above)
_____________________
Printed on 6/3/2016 5:37 PM Timing Sheet Version: 233 RV2 Revision: 30826

FIELD MASTER: FM2 Santa Rosa Road Page 1 (of 2)Group Assignment: NONE Description: Last Database Change:
System Reference Number: 5002Notes:
1 <C+0+0> <C+A+1>1 <C+0+1> 0 <C+0+5> <C+B+1>7 <C+0+2> Extended Comm. Timeout Manual Selection2 <C+0+3>
__3_____ <E+E+E>9 <D+0+0> 0 <C+A+8>
84912674 (QuicNet) 0 <C+B+8>Communication Addresses Backup Plan Selection
Row Day of Week Day of Week Day of Week Day of Week Row
0 06 : 30 1 A _23456_ 00 :00 0 0 _______ 00 : 00 0 0 _______ 00 : 00 0 0 _______ 01 09 : 30 E A _23456_ 00 :00 0 0 _______ 00 : 00 0 0 _______ 00 : 00 0 0 _______ 12 14 : 30 2 A _23456_ 00 :00 0 0 _______ 00 : 00 0 0 _______ 00 : 00 0 0 _______ 23 18 : 30 E A _23456_ 00 :00 0 0 _______ 00 : 00 0 0 _______ 00 : 00 0 0 _______ 34 00 : 00 0 0 _______ 00 :00 0 0 _______ 00 : 00 0 0 _______ 00 : 00 0 0 _______ 45 00 : 00 0 0 _______ 00 :00 0 0 _______ 00 : 00 0 0 _______ 00 : 00 0 0 _______ 56 00 : 00 0 0 _______ 00 :00 0 0 _______ 00 : 00 0 0 _______ 00 : 00 0 0 _______ 67 00 : 00 0 0 _______ 00 :00 0 0 _______ 00 : 00 0 0 _______ 00 : 00 0 0 _______ 78 00 : 00 0 0 _______ 00 :00 0 0 _______ 00 : 00 0 0 _______ 00 : 00 0 0 _______ 89 00 : 00 0 0 _______ 00 :00 0 0 _______ 00 : 00 0 0 _______ 00 : 00 0 0 _______ 9A 00 : 00 0 0 _______ 00 :00 0 0 _______ 00 : 00 0 0 _______ 00 : 00 0 0 _______ AB 00 : 00 0 0 _______ 00 :00 0 0 _______ 00 : 00 0 0 _______ 00 : 00 0 0 _______ BC 00 : 00 0 0 _______ 00 :00 0 0 _______ 00 : 00 0 0 _______ 00 : 00 0 0 _______ CD 00 : 00 0 0 _______ 00 :00 0 0 _______ 00 : 00 0 0 _______ 00 : 00 0 0 _______ DE 00 : 00 0 0 _______ 00 :00 0 0 _______ 00 : 00 0 0 _______ 00 : 00 0 0 _______ EF 00 : 00 0 0 _______ 00 :00 0 0 _______ 00 : 00 0 0 _______ 00 : 00 0 0 _______ F
6/13/16: Change TOD Coordination
Manual Plan
Backup Offset
Extra
Manual Offset
Backup PlanHighest Local Addr.
Offs
et
Plan
TOD Coordination (# 2)
< 9 Page ><C+0+9=0.2>
< 9 Page > < 9 Page >
Extras 3 = Auto. DaylightSavings
150 ms First Byte Time
TOD Coordination (# 4)<C+0+9=0.4>
QuicNet Channel
Drop NumberZone NumberArea NumberArea Address
Plan
< 9 Page >
TimeTime TimePlan
Offs
et
Plan
Offs
et
2/19/09 10:51 AM
Time
<C+0+9=0.1> <C+0+9=0.3>
Manual Plan 0 = Automatic1-9 = Plan 1-9 14 = Free 15 = FlashManual Offset 0 = Automatic 1 = Offset A 2 = Offset B 3 = Offset C
TOD Coordination (# 1) TOD Coordination (# 3)
FM@Santa Rosa Rd/Yucca
Offs
et
Change RecordChange DateBy
Printed on 6/13/2016 4:07 PM Timing Sheet Version: 210 FM1 Revision 50615

APPENDIX C – TRAVEL TIME RUN RESULTS

RunTravelTime
StoppedTime Speed Travel
TimeStopped
Time SpeedRun
TravelTime
StoppedTime Speed Travel
TimeStopped
Time Speed
1 04:20 00:12 46.2 04:43 00:00 42.8 1 04:07 00:00 48.9 05:15 00:31 38.92 04:23 00:00 46.1 05:05 00:00 39.9 2 04:50 00:22 41.8 04:58 00:07 40.63 06:36 01:38 31.0 05:40 00:45 35.8 3 04:48 00:23 41.9 06:07 01:02 33.24 06:50 01:26 29.9 04:48 00:00 42.0 4 10:53 04:10 18.8 07:04 00:52 28.95 04:25 00:00 45.7 05:17 00:19 38.2 5 07:07 00:54 28.5 04:38 00:00 43.76 05:40 00:19 35.9 04:53 00:16 41.7 6 04:36 00:18 43.9 04:34 00:00 44.17 04:19 00:00 46.8 04:19 00:00 46.7 7 05:37 01:08 35.9 04:56 00:34 40.8
Average 05:13 00:31 40.2 04:58 00:11 41.0 Average 06:00 01:02 37.1 05:22 00:27 38.6
1 04:28 00:04 45.2 04:42 00:00 43.0 1 05:04 00:00 39.8 06:23 00:47 31.92 04:40 00:08 43.3 04:22 00:00 46.4 2 05:48 00:34 34.9 06:22 00:55 32.03 06:04 00:41 33.5 04:31 00:04 44.7 3 05:40 01:10 35.7 05:51 00:44 34.74 04:00 00:00 50.4 04:24 00:00 45.9 4 06:37 01:35 30.7 05:26 00:07 37.35 04:28 00:08 45.2 05:10 00:22 39.4 5 05:47 00:23 35.1 04:47 00:10 42.16 05:04 00:26 40.0 04:39 00:01 43.3 6 05:21 00:58 37.8 04:51 00:00 41.67 04:44 00:08 42.8 04:40 00:00 43.2 7 04:20 00:00 46.5 04:41 00:10 42.9
Average 04:47 00:14 42.9 04:38 00:04 43.7 Average 05:31 00:40 37.2 05:29 00:25 37.5
Appendix CTravel Time Summary
Santa Rosa RoadBefore After Before After
Evening
Morning
Wes
tbou
nd
Eas
tbou
ndE
astb
ound
Wes
tbou
nd